


Languages
Pages
Legal


GENOMMA LAB DAY
September 29, 2015
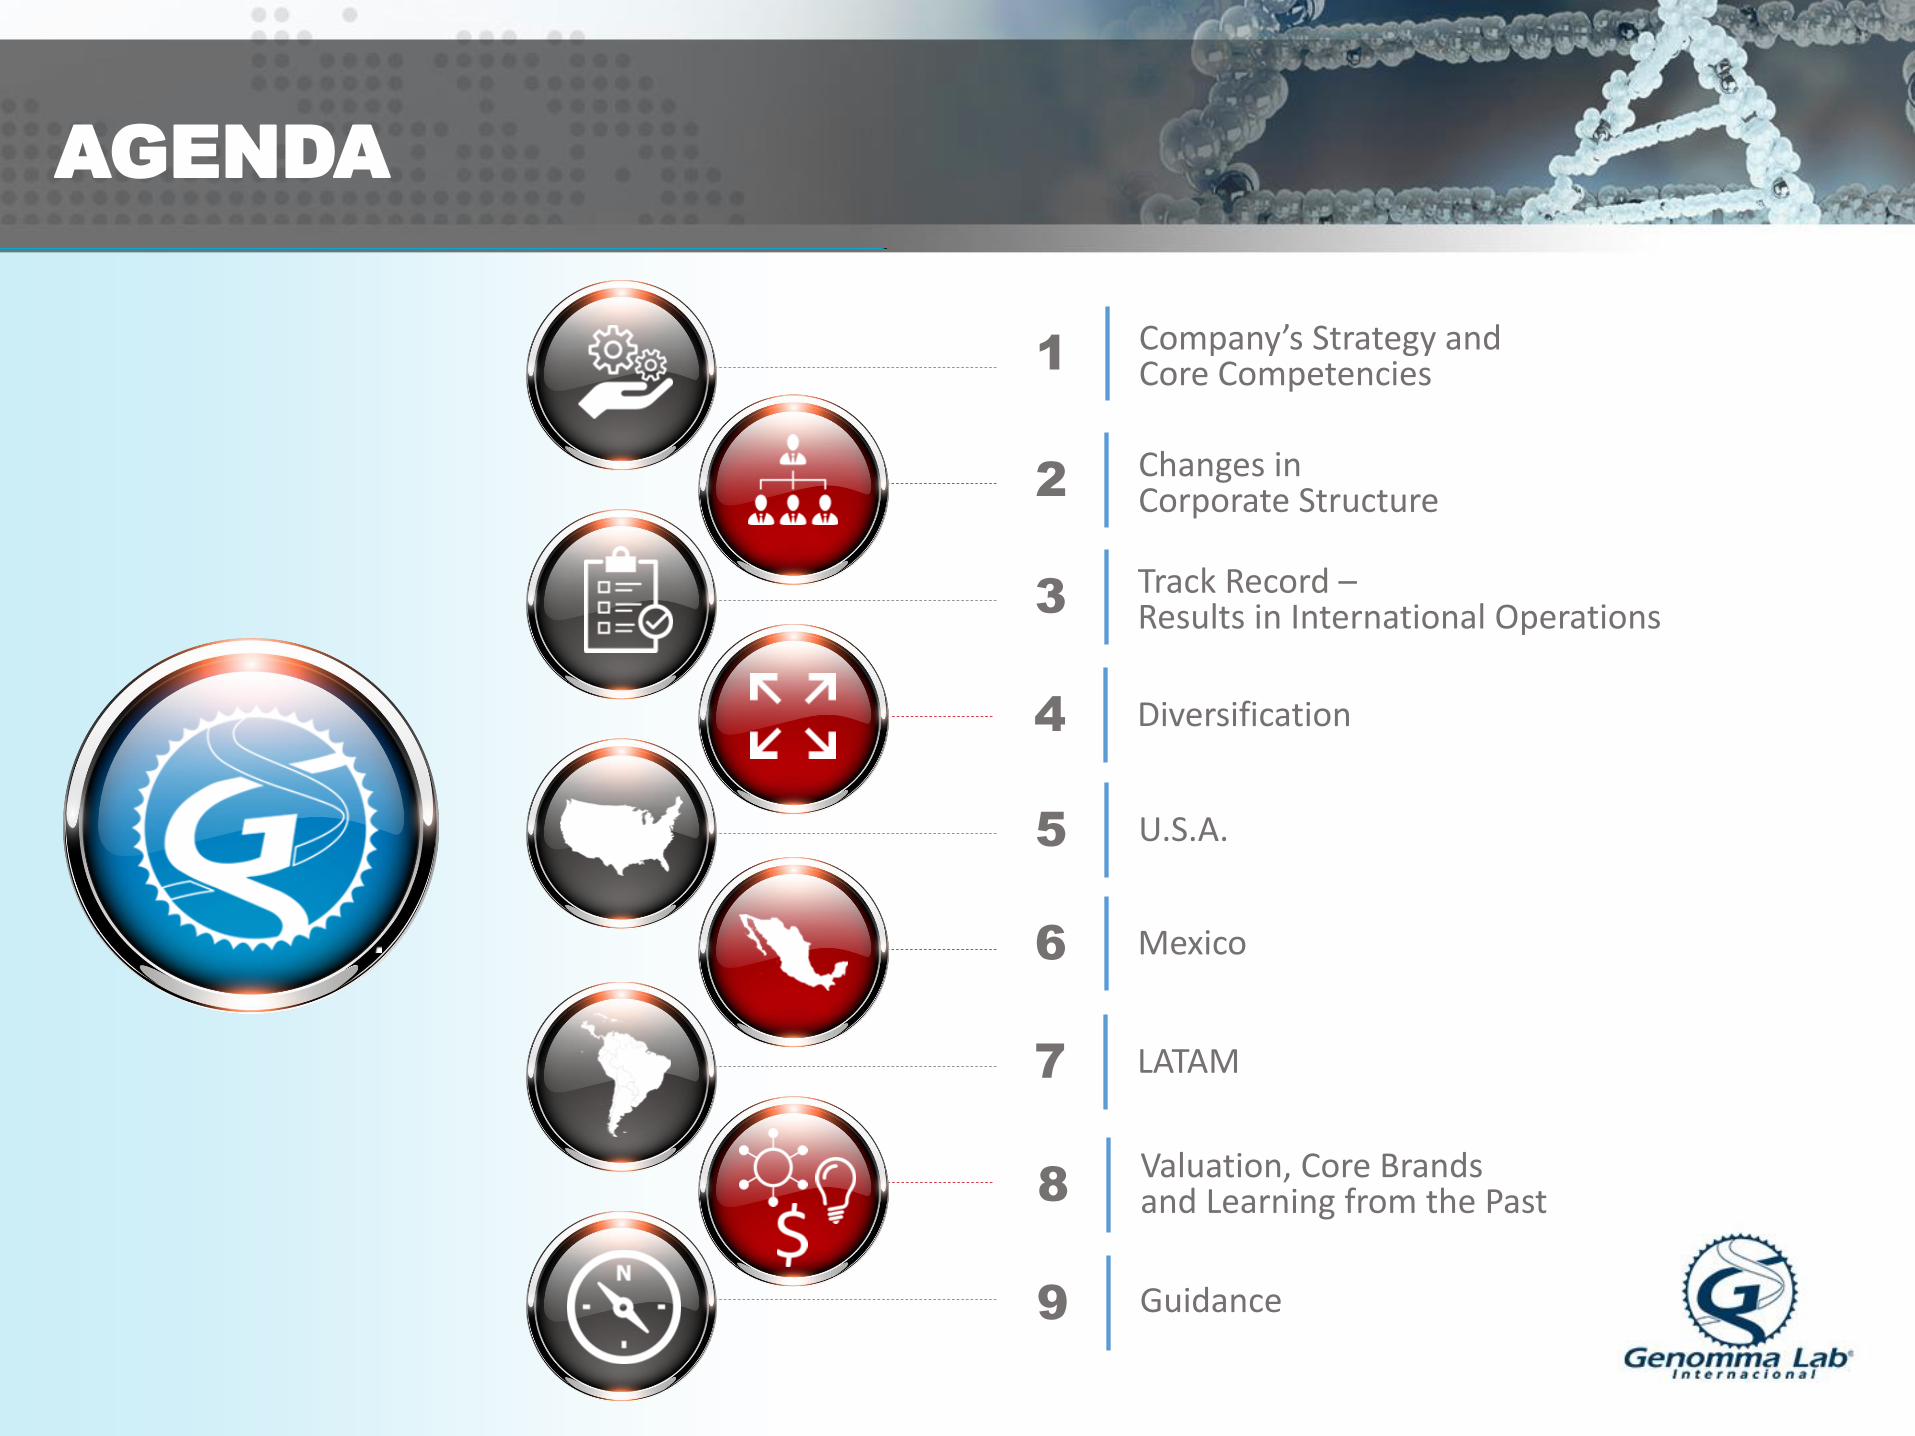
AGENDA
Company’s Strategy and Core Competencies 1
Changes in Corporate Structure 2
Track Record – Results in International Operations 3
Diversification 4
U.S.A. 5
Mexico 6
LATAM 7
Valuation, Core Brands and Learning from the Past 8
Guidance 9

COMPANY’S
STRATEGY AND CORE
COMPETENCES
3

STRATEGY
4
Flawless POS Execution
Demand Generation
Win Online
Talent
Genomma Lab: Sell-out, EBITDA, FCF
Brand Sustainability Core Brands
CORE COMPETENCES
BEFORE AFTER
POS Execution
Demand Generation
Talent
Mexico: Sell-in
International: Sell-out, EBITDA, FCF
Growth

CHANGES IN
CORPORATE
STRUCTURE
5

NEW CORPORATE STRUCTURE
RAMÓN
NEME SASTRE
Executive VP Institutional Relationships
OSCAR
VILLALOBOS TORRES
Executive VP C.F.O.
MARCO
SPARVIERI
Executive VP Global Sales
ALEJANDRO
BASTÓN PATIÑO
VP International and Sales Development
MÁXIMO
JUDA
C.E.O.
CLAUDIA
ORTEGA VETORETTI
VP Media
LAURA
RAPINO
Director Marketing, R&D
SERGIO
ROCHA SÁNCHEZ
Country Manager Mexico
ALBERTO
DEL LAGO ACOSTA
Director Regulatory Affairs

RECENT CHANGES IN KEY
MANAGEMENT POSITIONS
7
EXPERIENCE
BACHELOR IN BUSINESS ADMINISTRATION AND MBA
• Experience in marketing and digital strategy, media and commercial planning, and budget administration. Project development in Danone, Clorox and Siemens.
BACHELOR IN TELECOMMUNICATIONS ENGINEERING
• Experience in top management projects, virtual technology and telecommunication systems configuration.
BACHELOR DEGREE IN MEDICINE AND MBA
• Experience in medical regulatory issues in the pharma industry in Mexico, Latam, USA and Europe. Medical support to new products in companies such as Genomma Lab, Liomont, Genzyme, 3M Mexico, Boehringer-Ingelheim and Promeco.
In the past months we have worked on strengthening key areas of the company, bringing experienced executives to key management positions.
IT Director
Director of Regulatory Affairs
Director Marketing, R&D
NESTOR FABIÁN
RODRÍGUEZ
ALBERTO DEL
LAGO ACOSTA
LAURA RAPINO
POSITION NAME

RECENT CHANGES IN KEY
MANAGEMENT POSITIONS
8
EXPERIENCE
BACHELOR IN BUSINESS ADMINISTRATION AND
MASTER IN HUMAN CAPITAL MANAGEMENT
• +20 years of experience in human resources in companies such as Ryder Logística, Casa Saba and Despachos Contables.
BACHELOR IN INDUSTRIAL CHEMISTRY AND MASTER
IN TOP MANAGEMENT
• +10 years of experience in the pharma industry, auditing implementation and quality controls, ISO 9001 management in companies such as L’oreal, P&G, UQUIFA, BI Promeco and CITEC.
BACHELOR IN INDUSTRIAL ENGINEERING AND MBA
• +18 years of experience in logistics and supply chain solutions, quality assurance, cost optimization, inventory reduction and development of distribution strategies (P&G).
BACHELOR IN INDUSTRIAL ENGINEERING
• +20 years of experience in Research & Development in P&G.
POSITION NAME
Quality Director
Supply Chain Director
Human Resources Director
Packaging Manager
UVALDO VÁZQUEZ
VÁZQUEZ
JESÚS RAMÍREZ
DE ALBA
LAURA LÓPEZ
HERNÁNDEZ
ALFONSO NOÉ
MERLÍN MUÑOZ

RODRIGO HERRERA’S ROLE
MR. RODRIGO HERRERA ASPRA
FOUNDER OF THE COMPANY
AND CEO UNTIL JULY 23RD,
2015, IS CURRENTLY:
• PRESIDENT of the Board
• INCREASED his share of Genomma Lab from 25.9% to 29.9% in 1Q15
• PRESIDENT of the Operations Committee, meets quarterly
• ADVISOR in Research & Development and Marketing when required

TRACK RECORD -
RESULTS IN
INTERNATIONAL
OPERATIONS
10

TRACK RECORD – RESULTS IN
INTERNATIONAL OPERATIONS
COLOMBIA
Note: Growth and variation rates are for 2015e compared to 2012.
NET SALES (MMD)
SALES PER EMPLOYEE (MMD)
EBITDA MARGIN
# OF SKU’S
Growth 137%
Growth 243%
11
Growth 25.5PP
Variation -35%

TRACK RECORD – RESULTS IN
INTERNATIONAL OPERATIONS
PERU
Note: Growth rates are for 2015e compared to 2012.
NET SALES (MMD) EBITDA MARGIN
# OF SKU’S
Growth 154%
Growth 203%
12
Growth 30.1PP
Variation 8%
SALES PER EMPLOYEE (MMD)

TRACK RECORD – RESULTS IN
INTERNATIONAL OPERATIONS
CHILE
Note: Growth rates are for 2015e compared to 2012.
NET SALES (MMD) EBITDA MARGIN
# OF SKU’S
Growth 203%
13
Growth 535%
Growth 21.9PP
Variation 6%
Growth 339%
SALES PER EMPLOYEE (MMD)

TRACK RECORD – RESULTS IN
INTERNATIONAL OPERATIONS
U.S.A.
Note: Growth rates are for 2015e compared to 2013.
NET SALES (MMD) EBITDA MARGIN
# OF SKU’S
Growth 203%
14
Growth 31.6PP
Variation 7.4%
Growth 8.2%
2013
SALES PER EMPLOYEE (MMD)
NET SALES (MMD)
Growth 88.4%
DIVERSIFICATION
15

2011
DIVERSIFICATION
16
International Mexico 2012
2013
2014
2015e
35%
53%
62%
73%
34%
2016e

INTERNATIONAL PRESENCE
PRESENCE
IN 20 COUNTRIES
RANKING IMS: NA
RANKING ADVERTISER: #1
U.S.A.
RANKING IMS: #1
RANKING ADVERTISER: #1
MEXICO
RANKING IMS: #6
RANKING ADVERTISER: #1
COLOMBIA
RANKING IMS: #3
RANKING ADVERTISER: #1
ECUADOR
RANKING IMS: #5
RANKING ADVERTISER: #2
CHILE
FASTEST
GROWING
OTC COMPANY
RANKING IMS: #3
RANKING ADVERTISER: #3
PERU &
BOLIVIA
RANKING IMS: #8
RANKING ADVERTISER: #1
BRAZIL
RANKING IMS: #1
RANKING ADVERTISER: #1
ARGENTINA
CENTRAL
AMERICA
RANKING IMS: #1
RANKING ADVERTISER: #1
Source: IMS Health. Ranking in the OTC market. Information as of December 2014.

DIVERSIFICATION GOING FORWARD
% OF NET SALES
2015e
35.4%
MEXICO
53.2%
LATAM
11.4%
U.S.A.

DIVERSIFICATION VS.
OTHER COMPANIES
Other countries Mexico
AMX
WALMEX
CEMEX
ALSEA
BIMBO
LAB
All companies as of 2Q15 LTM. LAB 2015e.

DIVERSIFICATION VS.
OTHER COMPANIES
COMPANY ENTRANCE
TO BRAZIL STRATEGY
Acquisition
Acquisition
Acquisition
Acquisition
Acquisition
Organically
No presence
No presence
Acquisition
Organically
ENTRANCE
TO THE US
STRATEGY
Acquisition

U.S.A.
21

BRAND SUSTAINABILITY
22
COUGH / COLD
Tukol Robitussin Vicks Cat avg
TOTAL SHOPPERS 1,166,949 655,762 1,192,301 N/A
% SHOPPERS 2 + REPEAT 16.9% 11.3% 8.2% 15.5%
# OF SHOPPERS 2 + REPEAT 197,214 74,101 97,769 N/A
TUKOL drives loyalty versus both the overall category and key competitors.
SKIN CARE
Cicatricure Neutrogena Olay Cat avg
TOTAL SHOPPERS 81,926 425,205 250,525 N/A
% SHOPPERS 2 + REPEAT 14.0% 11.9% 11.2% 12.9%
# OF SHOPPERS 2 + REPEAT 11,470 50,599 28,059 N/A
CICATRICURE drives loyalty versus both the overall category and key competitors.
Source: Walgreens Loyalty Card Insights – October 31, 2014 thru March 31, 2015.
COUGH/COLD CATEGORY AT
WALGREENS
SKIN CARE CATEGORY AT
WALGREENS

BRAND SUSTAINABILITY
23
COUGH SYRUP / LIQUID COMPETITORS – TOTAL MARKET
PRODUCT % OF BUYERS,
2X + BUYERS
Cold / Allergy / Sinus Liquid / Powder Category 34.4
Tukol 52.8
Vicks NyQuil 43.6
Vicks DayQuil 37.0
Robitussin CF 24.4
Vicks NyQuil & Vicks DayQuil 23.3
Robitussin 25.2
TUKOL Drives loyalty versus both the overall category and key competitors.
Source: IRI – Latest 52 Weeks ending August 09, 2015.
ACNE TREATMENTS – TOTAL MARKET
PRODUCT % OF BUYERS,
2X + BUYERS
Acne Treatments Average 42.7
Asepxia 61.8
Neutrogena 50.1
Johnsons Clean & Clear 42.9
St. Ives 38.1
Olay 20.8
ASEPXIA Drives loyalty versus both the overall category and key competitors.
SHAMPOO CATEGORY – TOTAL MARKET
PRODUCT % OF BUYERS,
2X + BUYERS
Shampoo 43.6
Tio Nacho 50.4 Pantene Pro V 45.8 Tresemme 43.5 Clairol Herbal Essences 47.3 Garnier Furctis 44.9 Head & Shoulders 42.4 Dove 39.6 Organix 48.0 Suave 30.5
HAND & BODY LOTION – TOTAL MARKET
PRODUCT % OF BUYERS,
2X + BUYERS
Hand & Body Lotion Average 40.8
Goicoechea 56.1
Gold Bond Ultimate 38.6
Nivea 40.9
Suave 39.3
Jergens 41.1
Curel Ultra Healing 28.6
TIO NACHO Drives loyalty versus both the overall category and key competitors.
GOICOECHEA Drives loyalty versus both the overall category and key competitors.

SHAMPOO
PRODUCT 3x + REPEAT
Category Average 5.5%
Tio Nacho 6.8%
Pantene ProV 6.3%
Garnier Fructis 5.0%
Head & Shoulders 5.3%
Dove 5.1%
Organix 3.9%
Suave 3.8%
BRAND SUSTAINABILITY
24
TIO NACHO drives loyalty versus both the overall category and key competitors.
Source: Rite Aid Loyalty Card Insights – Latest 52 Weeks ending Aug-29-2015
FACIAL CLEANSERS
PRODUCT 3x + REPEAT
Category Average 7.0%
Asepxia 8.5%
Neutrogena 8.4%
Olay 7.4%
Biore 3.1%
Ponds 7.7%
ASEPXIA drives loyalty versus both the overall category and key competitors.

SUCCESS CASES IN POS
Symphony/IRI Data: Leading Chain Drugstore LAST 13 WEEKS as of Feb 2015
Genomma Lab is rapidly becoming a relevant player in the general market
(in USD)
VS
Last 52 Weeks
$4.3 MM
8,000 STORES
$3.1 MM
8,000 STORES
$1.7 MM
6,900 STORES
$867 K
8,000 STORES
$1.8 MM
4,500 STORES
$396 K
8,000 STORES
VS
Last 26 Weeks
VS
Last 36 Weeks

GL INCREASES WALGREENS
HISPANIC MARKET SHARE
26
Source. Symphony IRI. Hispanic Snippet data. August 2015. *HAB: Health and Beauty.
Share of Hispanic HAB
AFTER
GENOMMA
33% and growing
Share of Hispanic HAB BEFORE
GENOMMA
17%

GENOMMA’S SALES IN WALGREENS
27
STRONG GROWTH RATE AFTER MEDIA STARTED
(in USD)
Source: RSi., 52 Weeks Ending 5.18.13
5/8/13
$683K
MEDIA
START
9/8/12
$91K

28
PRESENCE IN POS – WALGREENS
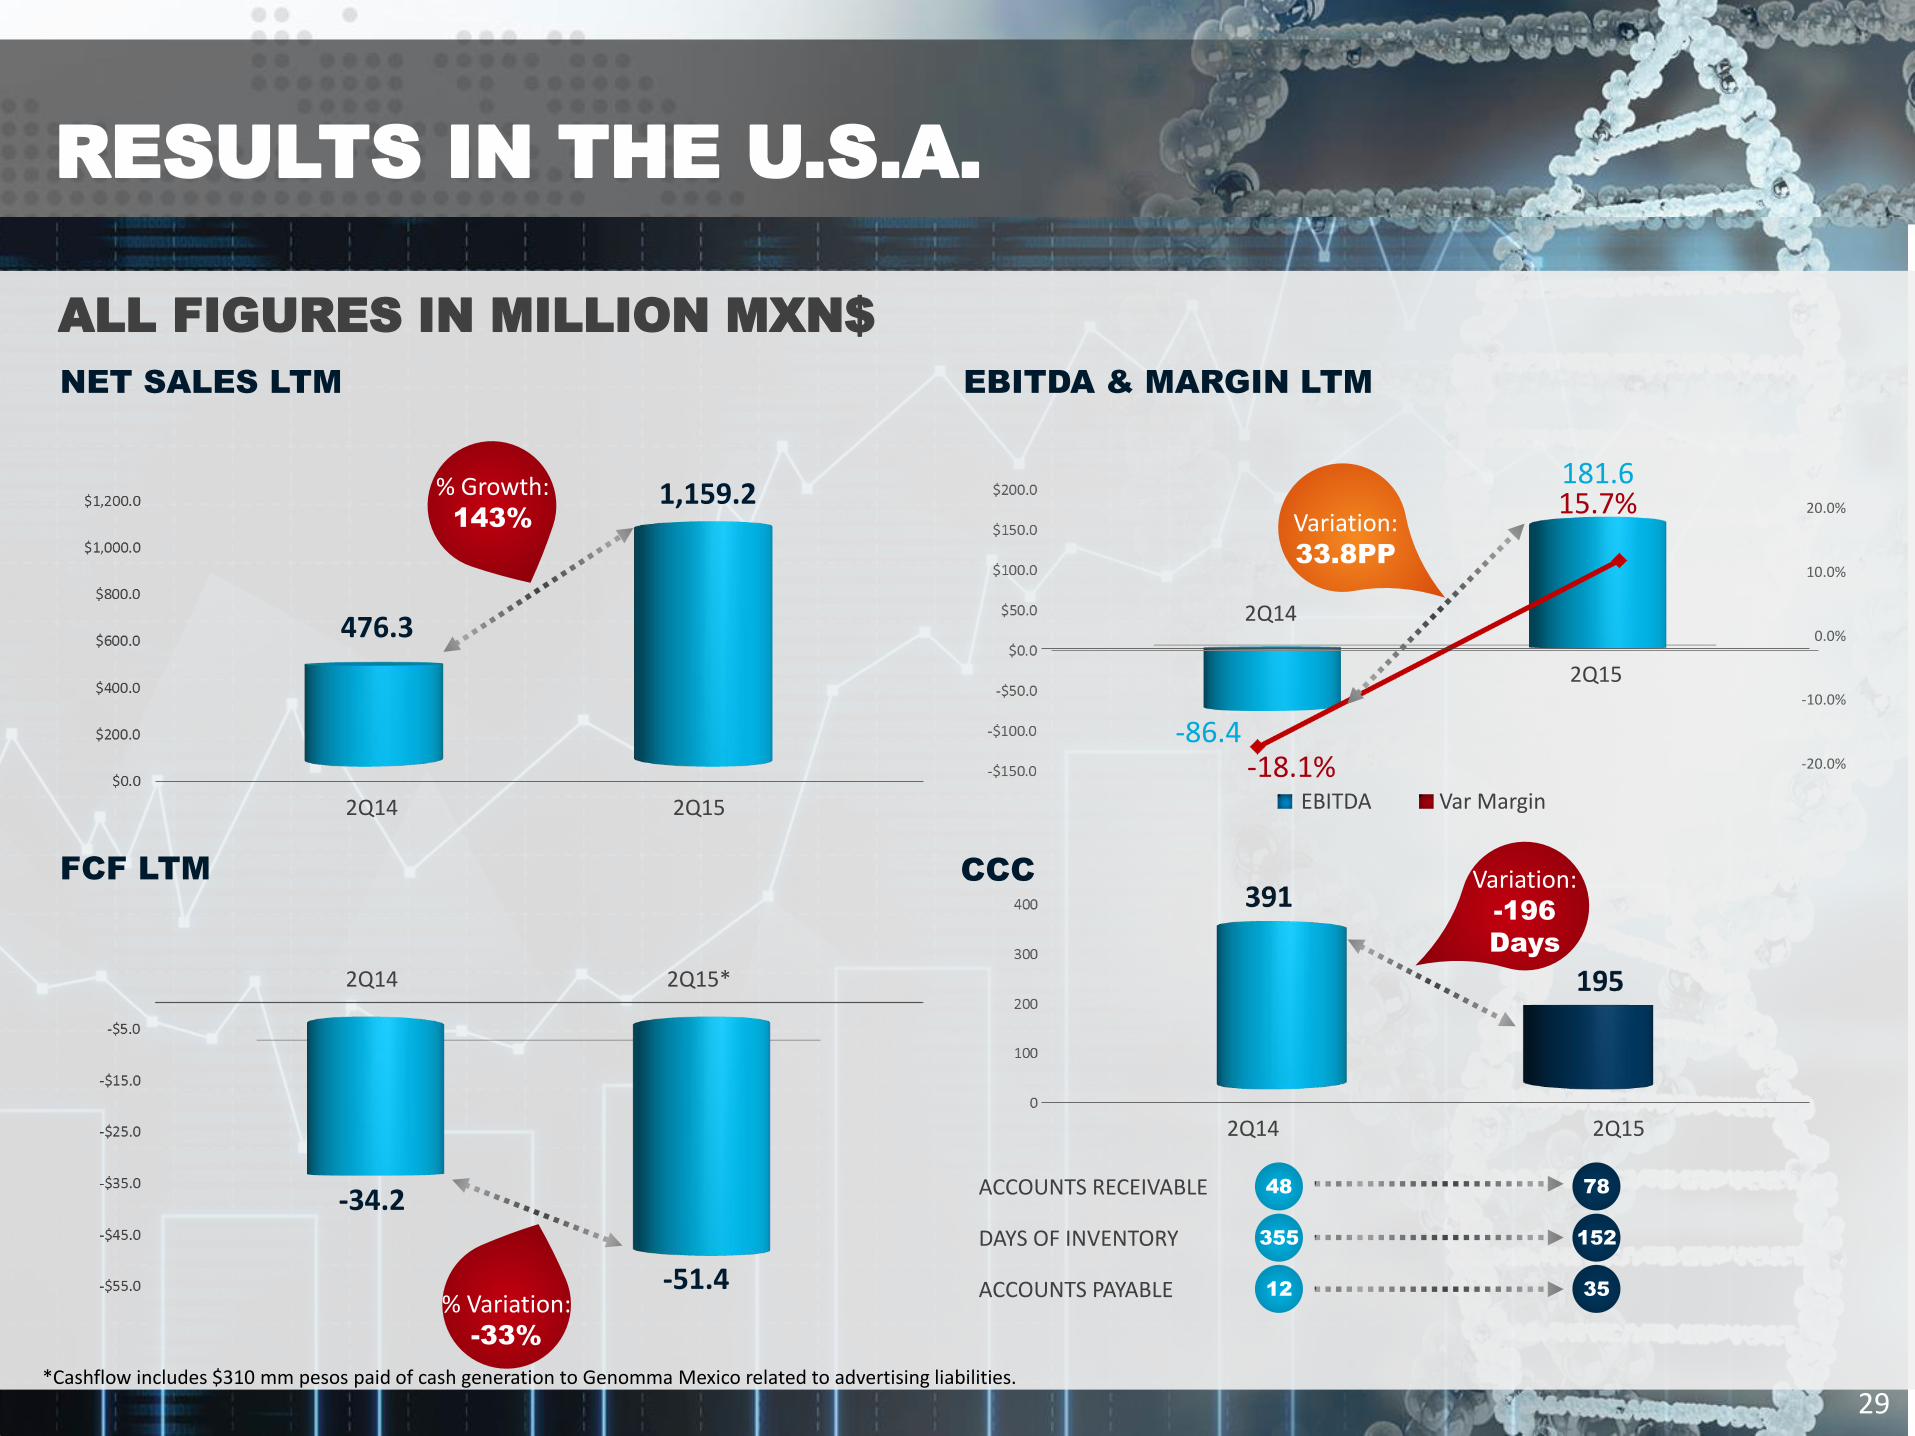
RESULTS IN THE U.S.A.
ALL FIGURES IN MILLION MXN$
NET SALES LTM
FCF LTM CCC
% Growth: 143%
2Q14 2Q15*
2Q14 2Q15
2Q14 2Q15
2Q14
2Q15
EBITDA & MARGIN LTM
Variation: 33.8PP
Var Margin EBITDA
29
Variation: -196
Days
-20.0%
-10.0%
0.0%
10.0%
20.0%
476.3
1,159.2
-86.4 -18.1%
15.7% 181.6
-34.2
-51.4
DAYS OF INVENTORY
ACCOUNTS PAYABLE
ACCOUNTS RECEIVABLE 48
355
12
78
152
35
% Variation: -33%
*Cashflow includes $310 mm pesos paid of cash generation to Genomma Mexico related to advertising liabilities.

U.S.A. – POTENTIAL FOR GROWTH
Opportunity for Growth in POS
Market Size
30.7% 65.2%
11.8% 12.8% 8.8% 1.6%
% In-Store Presence (Distribution Points)
4,531 8,225 7,621 1,793 4,565 3,519
Number of POS
$18,026 $4,166
$6,743 $5,562 $2,454 $2,697
OTC
$31,315
$11,757 $10,834 $10,841
$3,841 $4,276
Beauty
$13,289
$7,591
$4,091 $5,279 $1,387 $1,579
*In millions of USD

MEXICO
31

TURNAROUND IN MEXICO
• To increase efficiency and improve margins, significant reductions in headcount took place in past months.
• Inventories in our warehouse have also been reduced significantly to improve cash conversion cycle and free cash flow generation.
-39.2%
-31.2%
HEADCOUNT INVENTORIES

TURNAROUND IN MEXICO
SGM&A
Excluding Non-recurrent expenses Total SGM&A
• In 2015, the Company has made significant efforts to reduce SGM&A expenses to increase profitability.
-4.1% -14.4%
-5.5%
-15.1%

TURNAROUND IN MEXICO
34
WAREHOUSE EXPENSES
-64.3%
• In the first half of 2015 we were able to significantly reduce warehouse expenses. The objective is to cut expenses to Net Sales at 7.9% down to 2.8%.
Note: Monthly information.

1.04
1.01
1.06 1.05
1.11
1.05
1.10
1.03
1.13
1.07
1.04 1.04
0.95
1.03
1.01
0.99
0.97
1.11
1.03
1.02 1.02
1.11
1.00
1.01
0.99
1.01
1.17
1.09
1.17
1.18
1.16
1.11
1.08
1.17
1.06
1.20
1.06
1.0687
1 2 3 4 5 6 7 8 9 10 11 12 13 14 15 16 17 18 19 20 21 22 23 24 25 26 27 28 29 30 31 32 33 34 35 36 37 380.90
0.95
1.00
1.05
1.10
1.15
1.20
1.25
• Sell-out performance improved in 2015 from 2014. Sell-out performance for 3Q15 until September 18 increased 12.7%.
• In Mexico, sell-out of our products increased 3.9% in the first six months of 2015,
compared to the same period of 2014 (Company sell-out data: 4.0% growth for
OTC products and 3.7% growth for personal care products).
TURNAROUND IN MEXICO
35
Weeks
2014
1Q15 2Q15 Up-to-date
SELL-OUT
Accumulated Weekly Variation 2015 vs 2014 Weekly Variation 2015 vs 2014
1.07

RESULTS IN MEXICO
ALL FIGURES IN MILLION MXN$
NET SALES LTM
FCF LTM CCC
% Variation: -22%
2Q14 2Q15
2Q14 2Q15
2Q14 2Q15
2Q14 2Q15
EBITDA & MARGIN LTM
Var Margin EBITDA
36
25.7%
16.5%
% Var: EBITDA
-50.1%
0.0%
10.0%
20.0%
30.0%
% Variation: 30%
Variation: 15
Days
7,201.3
5,603.5
-2,926.7
-2,063.6
1,853.2
925.2
DAYS OF INVENTORY
ACCOUNTS PAYABLE
ACCOUNTS RECEIVABLE 181
112
228
119
106
145 -$3,000.0
-$2,000.0
-$1,000.0
$0.0

CHANNEL AND CUSTOMER EXPANSION
+58 New Customers / +27,600 Stores (Mexico and International)
GO TO MARKET
(-)3 to 5 pts trade terms improvement and PAY FOR PERFORMANCE (Mexico and International)
POS EXECUTION
65% STORES in Mexico executed in line with IN-STORE VISION
COMMERCIAL INNOVATION +5-7 Global Initiatives
COMMERCIAL STRATEGY - UPDATE
37
1
2
3
4

POS EXECUTION 1
BIO ELECTRO NEXT
TO EXCEDRIN &
SAME SHARE OF SHELF
MOVE QG-5 SHELF
ARRANGEMENT
FROM NATURE TO
STOMACH SEGMENT
TEATRICAL NEXT TO
PONDS WITH AT
LEAST 20% SOS*
LOMECAN AS BRAND
BLOCK & SYSTEM USAGE
+62%
in Sales +39%
in Sales
*Last Four Weeks vs Year Ago..
*Start of Shipping.
+58%
in Sales
+21% YTD vs YA
+79% L4W vs YA*
+21%
in Sales

CUSTOMER & CHANNEL
EXPANSION
+14 New Customers + 15 Customers +15 Retail /+14 Dist
+1,504 /+235,000 +4,100 +22,000
2
# STORES
# CUSTOMERS

GO TO MARKET
(PAY FOR PERFORMANCE)
INVESTMENTS BEHIND SALES FUNDAMENTALS IMPROVEMENT:
3
3
Distribution Shelf Pricing
1 2 3 4
Merchandising

COMMERCIAL INNOVATION
BOTIQUÍN ABARROTE: +150,000 TRADITIONAL
STORES (IN NEXT TWO YEARS)
HAIR CARE
REINVENTION PLAN
CHECK OUTS
1,500 POS 3,000 POS 600 POS
+93%
in Sales YTD 4
4

MARZAM
• On August 25th, 2015 the Comisión Federal de Competencia Economica (COFECE) approved the sale of 50% plus one share of Grupo Comercial e Industrial Marzam S.A.P.I. de C.V.
• According to previously negotiated contracts, the closing of the transaction took place on September 25th. In such date, we received the first tranche of the payment for $1,050 million pesos.
• The remaining $300 million pesos will be received on September, 2016.
• As part of the agreement, Genomma Lab had to deliver Marzam free of accounts payable and inventories of its products. This resulted in the return of all of Genomma’s products in the wholesaler’s warehouses, which amounted to $160 million pesos.
• As of this date, Moench Cooperatief U.A. will take control of the operation of Marzam maintaing Genomma as their strategic partner in the operation of Marzam.
• Genomma will have two seats in the Board of Directors and will be part of the Executive Committee of Marzam.
• $950.0 million pesos of the proceeds were used to prepay banking debt. The remaining $100.0 million pesos will be used to repurchase shares.

MARZAM
(Impact on Genomma’s Financial Statements)
Assets June 2015(1) Movements Use of funds Proforma(2)
Cash and equivalents 1,731,722 1,050,000 -950,000 1,831,722
Accounts Receivables - Net 4,683,666 350,549 5,034,215
Inventories 1,472,632 159,725 1,632,357
Assets classified as held for sale 6,974,459 -6,974,459 0
Investment in shares 17,269 1,350,000 1,367,269
Liabilities June 2015(1) Movements Use of funds Proforma(2)
Liabilities classified as held for sale
3,686,290 -3,686,290 0
Banking debt 7,088,259 -950,000 6,138,259
Shareholders’ Equity June 2015(1) Movements Use of funds Proforma(2)
Accumulated Net Income 8,760,327 -5,101 8,755,266
(1) Based on financial information as of June 2015. (2) Proforma figures will be affected by the financial results as of September 2015.
ALL FIGURES IN THOUSAND MXN$

MARZAM
(Proforma Financial Statements)
Cash and equivalents
Inventories
Other current assets
Other Non current assets
Suppliers Other current liabilities
Non current liabilities
Shareholders’ Equity
Investments on shares
PROFORMA BALANCE SHEET(1)
(FIGURES IN MILLION PESOS)
21,074
Secured loans and banking debt
Total Liabilities + Shareholders’ Equity Total Assets
8,436 10,862
1,632
5,034
2,039
1,615 1,367
639
6,138
1,447 1,038
A/R- Net
21,074
(1) Proforma figures will be affected by the financial results as of September 2015.

LATAM
45

NEW CLIENTS
ARGENTINA
New Clients: 4 BRAZIL
New Clients: 13 COLOMBIA
New Clients: 10 ECUADOR
New Clients: 4
PERU
New Clients: 2 DOMINICAN REPUBLIC
New Clients: 2
EL SALVADOR
New Clients: 1 HONDURAS
New Clients: 1 GUATEMALA
New Clients: 1 CHILE
New Clients: 2
Bodega
Farmacéutica
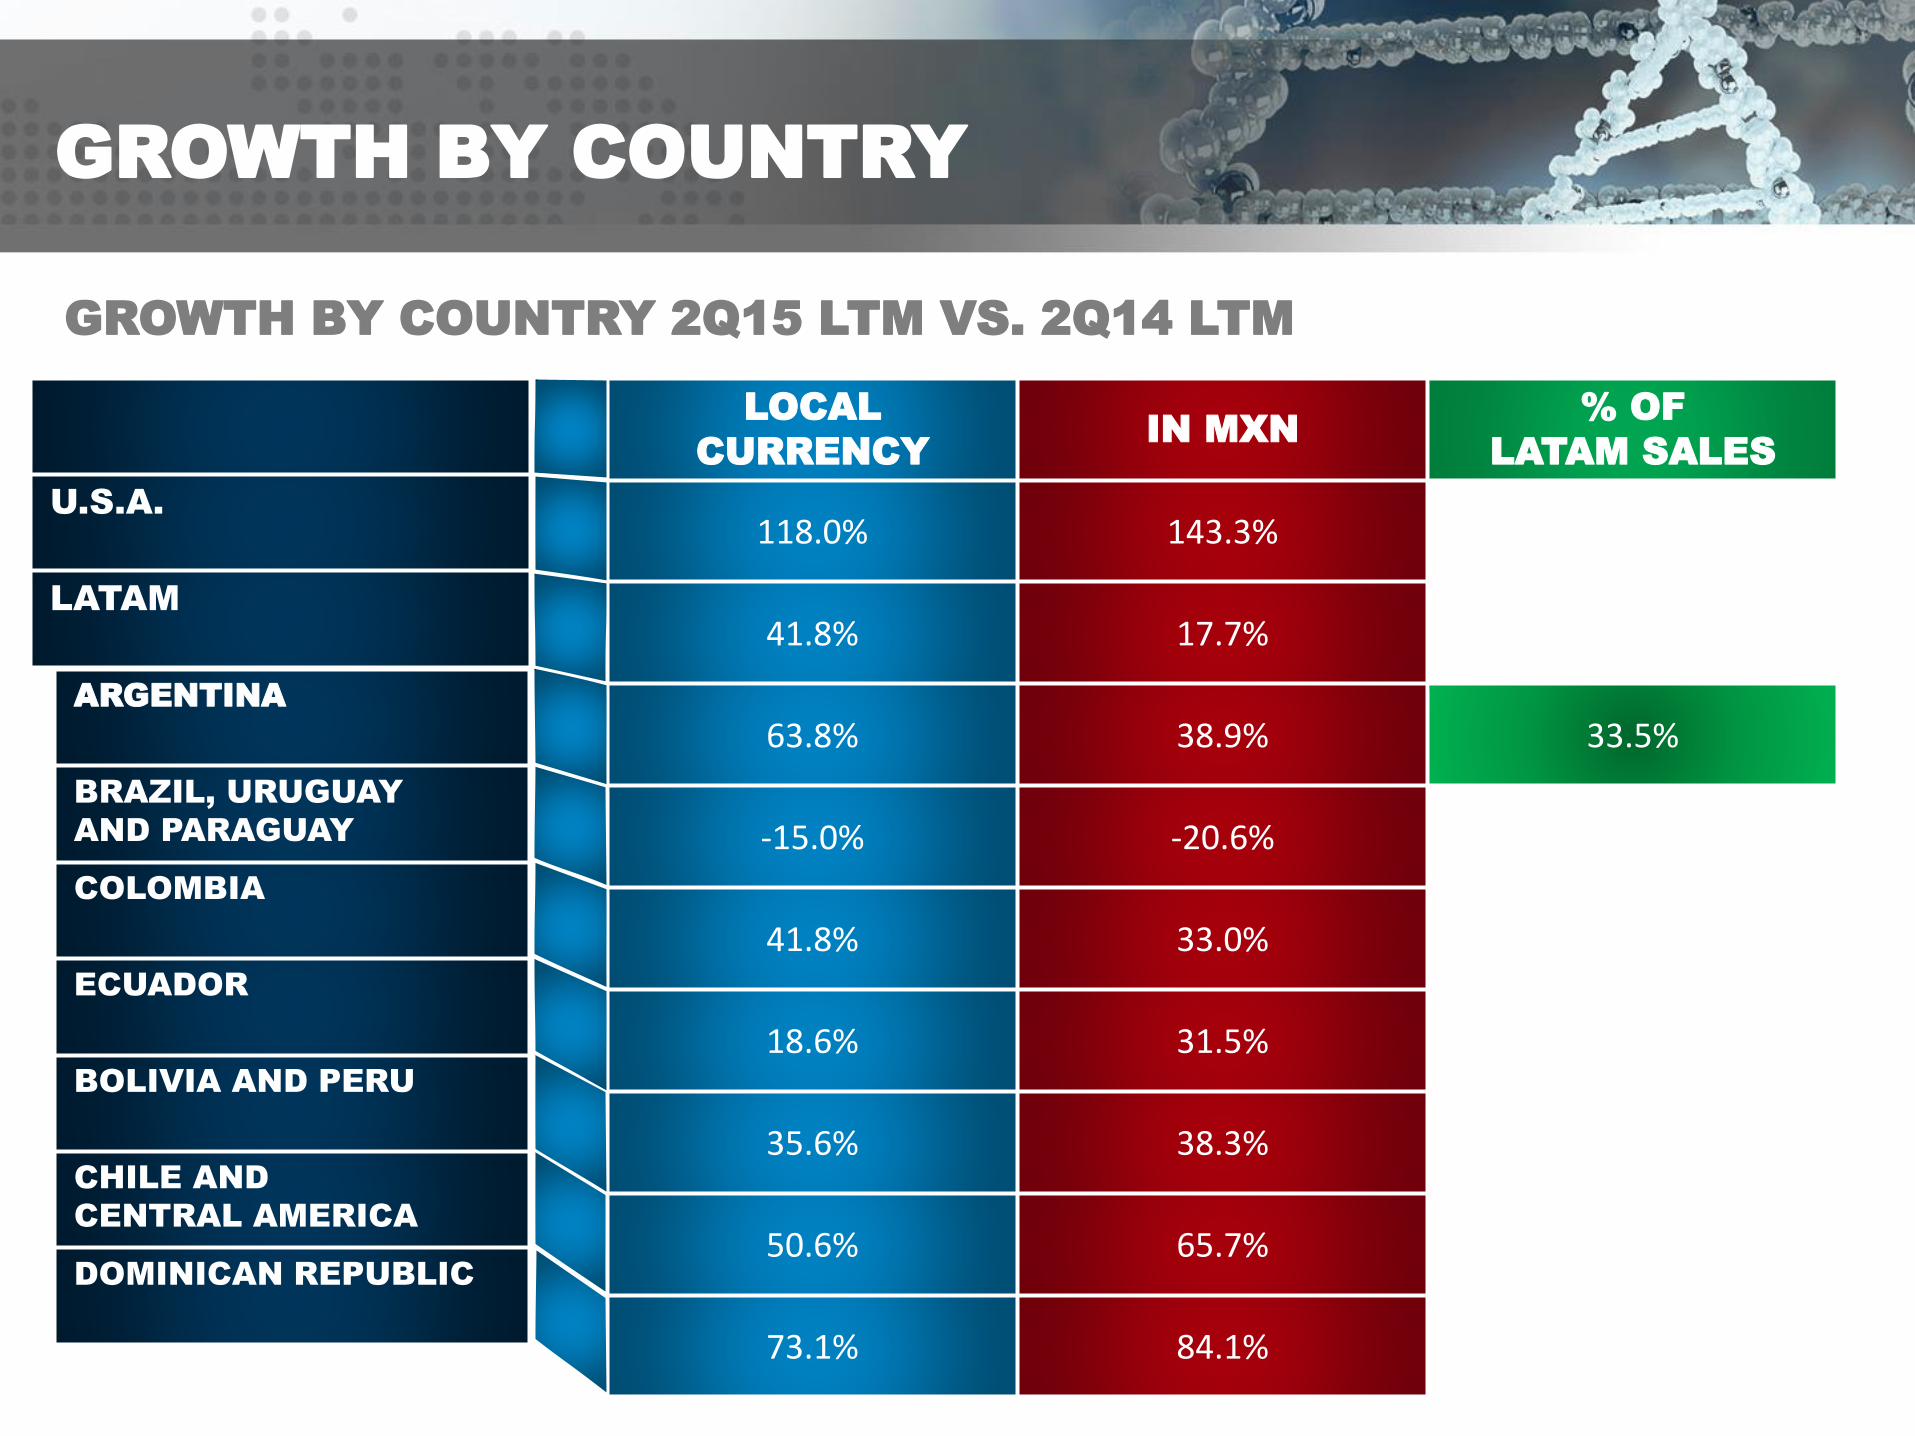
GROWTH BY COUNTRY
LOCAL
CURRENCY IN MXN
% OF
LATAM SALES
118.0% 143.3%
41.8% 17.7%
63.8% 38.9% 33.5%
-15.0% -20.6%
41.8% 33.0%
18.6% 31.5%
35.6% 38.3%
50.6% 65.7%
73.1% 84.1%
GROWTH BY COUNTRY 2Q15 LTM VS. 2Q14 LTM
U.S.A.
LATAM
ARGENTINA
BRAZIL, URUGUAY
AND PARAGUAY
COLOMBIA
ECUADOR
BOLIVIA AND PERU
CHILE AND
CENTRAL AMERICA
DOMINICAN REPUBLIC

RESULTS IN LATAM
ALL FIGURES IN MILLION MXP
NET SALES LTM
FCF LTM CCC
% Variation: 18%
2Q14 2Q15
2Q14 2Q15
2Q14 2Q15
2Q14 2Q15
EBITDA & MARGIN LTM
Var Margin EBITDA
48
30.9%
28.6%
% Variation: -2.3pp
% Var: EBITDA 9.1%
28.0%
28.5%
29.0%
29.5%
30.0%
30.5%
31.0%
31.5%
% Variation: 139%
Variation: -32 days
4,403.8
5,183.5
334.5
798.3
1,359.5
1,483.0
DAYS OF INVENTORY
ACCOUNTS PAYABLE
ACCOUNTS RECEIVABLE 119
147
10
80
205
61

VALUATION,
CORE BRANDS AND
LEARNING FROM
THE PAST
49

EBITDA 2016e $27 $111
SELL OUT $382
VALUATION HINTS:
NEW REGIONAL DISCLOSURE(1)
FORWARD 2016
(in million of USD*)
(1) Valuation multiples based on information provided by the Top 6 Investment Banking Firms (2) Sales represent the Company’s Sell Out * Exchange rate of $16.85 MXP/USD
USA $375
Market Cap
@17.11 p/share $1,050
Potential Value $933
1x Sales(2)
Mexico $382
11x EBITDA
LATAM $1,226
14x EBITDA
Hint Valuation
88.9% Upside
$1,983

CORE BRANDS
• Rational approach to brand
management. Purchase,
sale or licensing.
• CUM Strategic business
unit.
Based on Company’s sell-out data, as of September 2015.
25 CORE BRANDS

WHAT WE HAVE LEARNED
FROM INVENTORIES
MANAGEMENT
CHANGES IN POLICIES, SYSTEMS AND CONTROLS
COUNTRY MANAGER COMPLIANCE
INCENTIVES - COMPENSATION BASED
ON THE FOLLOWING METRICS:
LEARNING FROM THE PAST
52
1
2
3
FCF Sell-out EBITDA

GUIDANCE
53

INVENTORY DESTOCKING AT POS
IN MEXICO
INVENTORY DESTOCKING DISCLOSURE
(In million pesos and days)
45-60
objective days of inventory
$ 2,420 2,420
$ 2,127
$ 1,785
$ 1,243
$ 800 $ 800 $ 800
INVENTORIES AS OF 2Q15
3Q15 4Q15 1Q16 2Q16 3Q16 4Q16 4Q16 EXPECTED
INVENTORIES
2Q15 3Q15 4Q15 1Q16 2Q16 3Q16 4Q16
847 847 800 800 1,200 1,200
1,140 1,190 1,342 1,243 1,200 1,200
293 343 542 443 0 0
2,420 2,127 1,785 1,243 800 800 800
GUIDANCE SALES
(WITH DESTOCKING)
SELL OUT
(WITHOUT DESTOCKING)
INVENTORY DESTOCKING
INVENTORY AT THE
END OF THE PERIOD

2015 GUIDANCE REVIEW
AND 2016 GUIDANCE
55
3Q15 4Q15 FY 2015 1Q16 2Q16 3Q16 4Q16 FY 2016
847.3 847.3 3,860.8 800.0 800.0 1,200.0 1,200.0 4,000.0
1,429.0 1,471.2 5,811.1 1,520.8 1,477.1 1,632.9 1,649.0 6,279.8
299.5 280.1 1,245.7 374.1 430.1 361.5 338.1 1,503.8
2,575.8 2,598.6 10,917.6 2,694.9 2,707.2 3,194.5 3,187.1 11,783.7
-23.3% -8.6% -5.4% -2.7% -9.0% 24.0% 22.6% 7.9%
3Q15 4Q15 FY 2015 1Q16 2Q16 3Q16 4Q16 FY 2016
- 102.4 - 100.8 - 201.4 - 148.5 - 116.4 127.5 127.5 - 10.0
400.0 421.5 1,701.7 454.7 441.6 488.2 493.0 1,877.6
80.7 52.9 288.1 98.6 121.5 117.1 114.0 451.1
378.3 373.6 1,788.4 404.8 446.7 732.8 734.5 2,318.8
14.7% 14.4% 16.4% 15.0% 16.5% 22.9% 23.0% 19.7%
Periods without destocking Periods with destocking
NET SALES
MEXICO
LATAM
EUA
CONSOLIDATED
% VAR. YOY
EBITDA
MEXICO
LATAM
EUA
CONSOLIDATED
EBITDA MARGIN
Figures in million MXN$
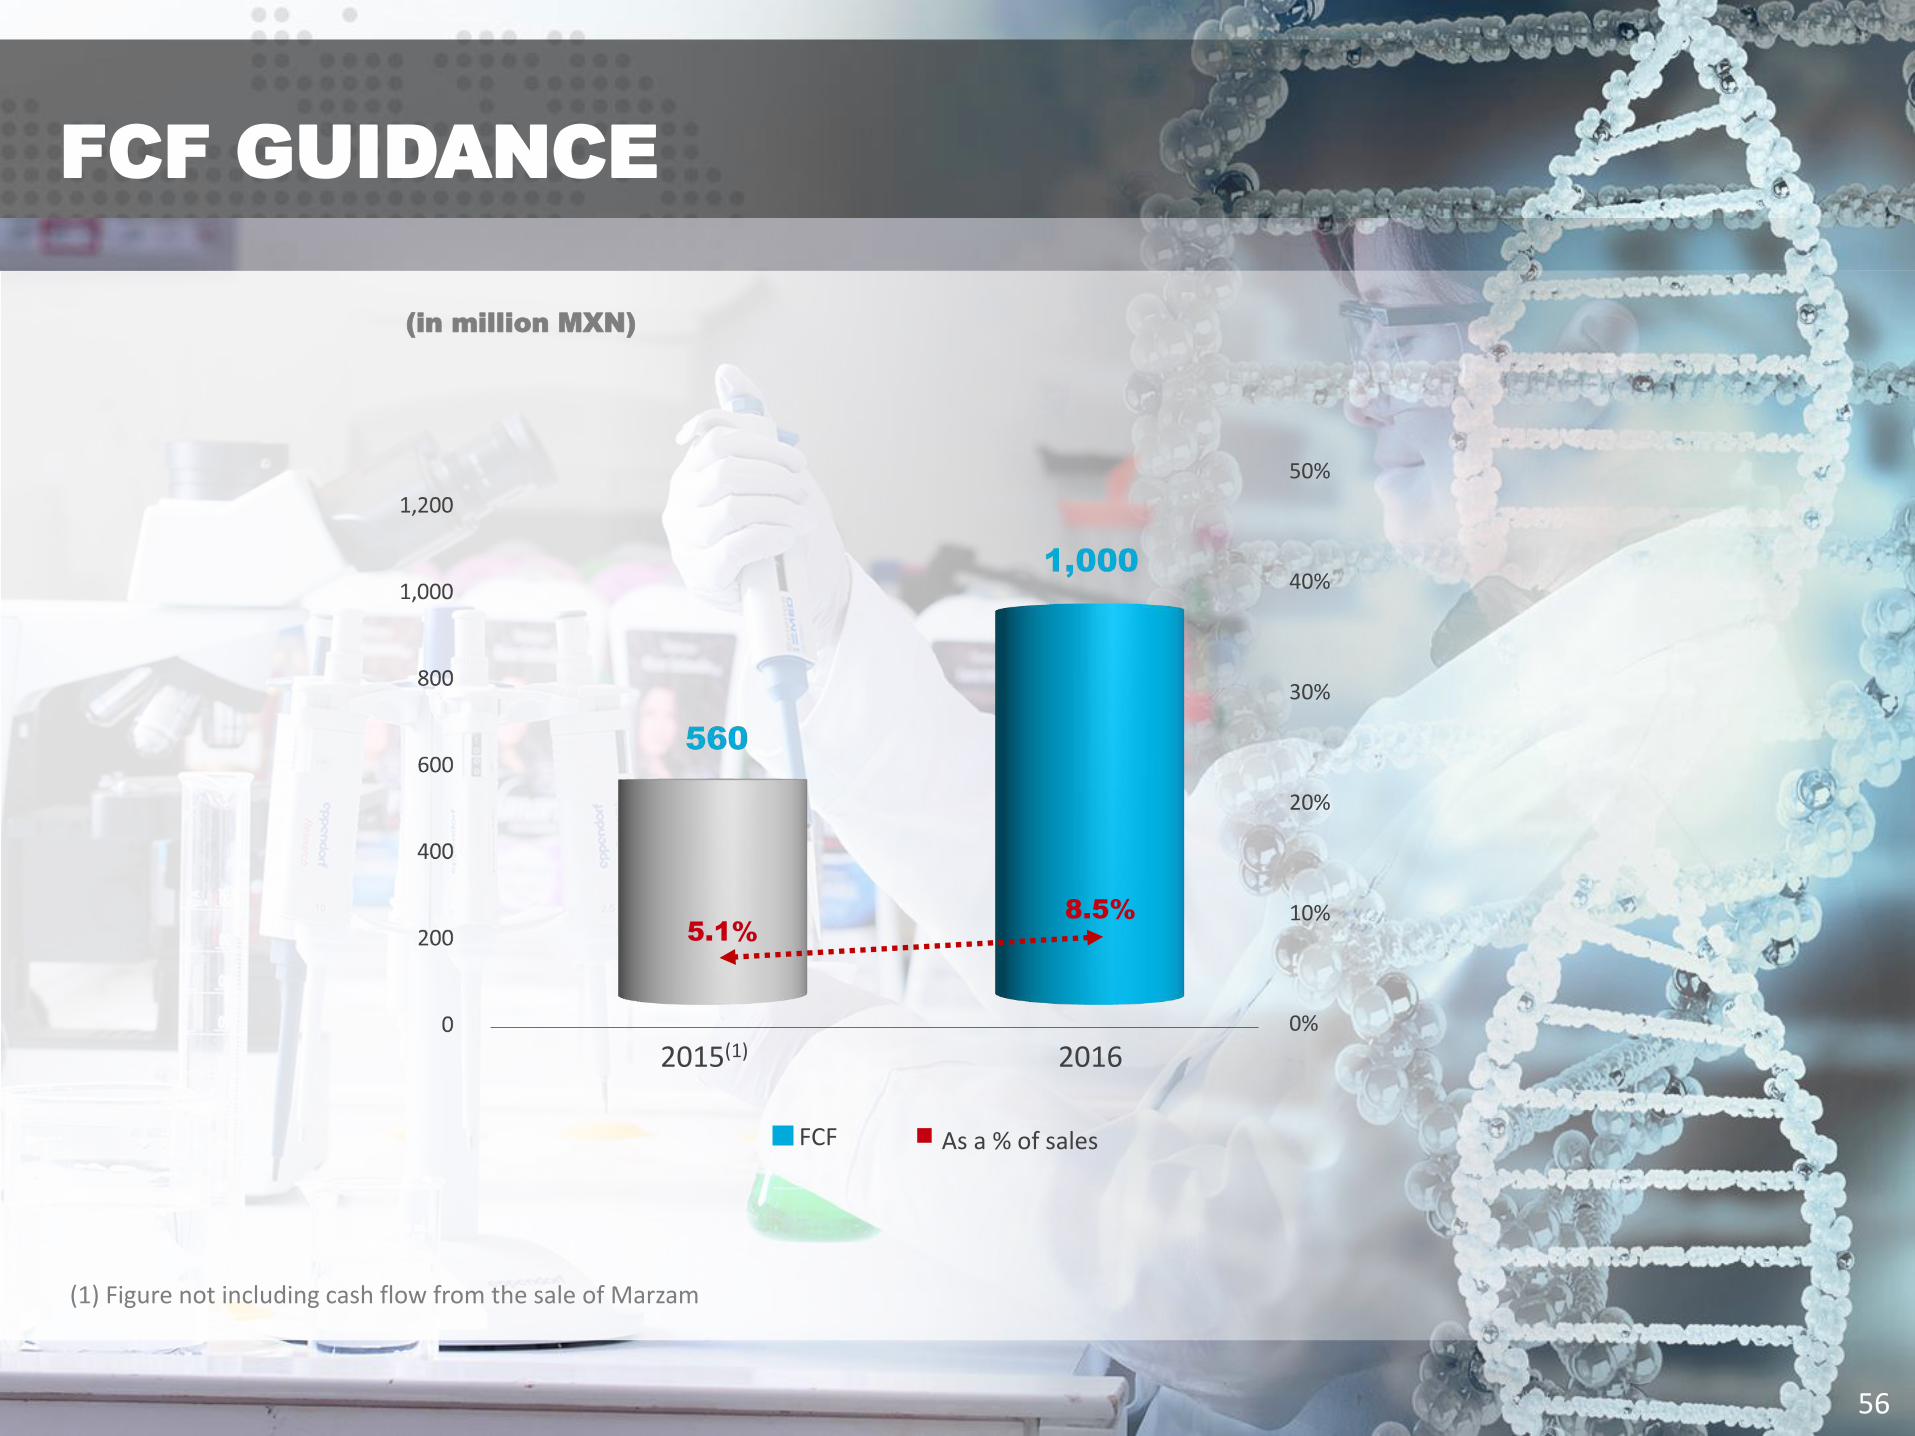
FCF GUIDANCE
56
(in million MXN)
2015(1) 2016
As a % of sales FCF
0%
10%
20%
30%
40%
50%
(1) Figure not including cash flow from the sale of Marzam
5.1%
8.5%

FINAL REMARKS
• ONE-YEAR TURNAROUND, FINISH INVENTORY CLEANUP
BY Q2 2016.
• PERFORMANCE: NEW EBITDA, NET PROFIT = FCF
• MANAGEMENT’S INVESTMENTS IN GLI.
• GENOMMA DAY Q3 2016. END OF OCTOBER.
• TRANSPARENCY AND ACCOUNTABILITY, NO EXCUSES.

OSCAR VILLALOBOS – CFO ANA MARÍA YBARRA – Investor Relations [email protected] Tel. (55) 5081-0000 ext. 5106
www.genommalab.com/inversionistas
INVESTOR RELATIONS CONTACT:
Top Related