


Languages
Pages
Legal


ERC Working Papers in Economics 04/17 December 2004
Economic Research Center Middle East Technical University Ankara 06531 Turkey www.erc.metu.edu.tr
Gender Differences in Academic Performance in a Large Public University in Turkey
Meltem Dayıo�lu Department of Economics
Middle East Technical University Ankara 06531 Turkey [email protected]
Serap Türüt-A�ık
Department of Economics Middle East Technical University
Ankara 06531 Turkey [email protected]

Gender Differences in Academic Performance
in a Large Public University in Turkey
Meltem Dayıo�lu*
and
Serap Türüt-A�ık
Abstract
The paper attempts to determine whether there are significant gender differences in academic performance among undergraduate students in a large public university in Turkey based on three indicators; university entrance scores, performance in the English preparatory school and in the program the student is majoring in. The paper finds that a smaller number of female students manage to enter the university and when they do so, they enter with lower scores. However, once they are admitted to the university, they excel in their studies and outperform their male counterparts. This result holds after controlling for the field of study and individual attributes.
Keywords: Academic achievement, undergraduate students, gender disparity, Turkey
* Corresponding author
2
1. Introduction
The paper attempts to determine whether there are significant gender differences in
academic performance among undergraduate students at Middle East Technical University
(METU), which is a large public university in Turkey, and if so, the factors that give rise to
these differences. Academic performance is affected by a host of factors. These include
individual and household characteristics such as student ability, motivation, the quality of
secondary education obtained and the like. The gender of the student may also be a factor
in determining student performance. Childhood training and experience, gender differences
in attitudes, parental and teacher expectations and behaviors, differential course taking and
biological differences between the sexes may all be instrumental in giving rise to gender
differences in achievement (Feingold, 1988). The rather high gender disparity in various
spheres of public life and the patriarchal social structure in Turkey may also lead to poorer
academic performance among female university students.
In terms of educational attainment women lag behind men in Turkey. The 2000
Population Census records the illiteracy rate among men at 6.1%, while that of women at
19.4% (SIS, 2003). Among the literate population, men’s average level of schooling far
exceeds that of women though there does seem to be a faster improvement among the latter
(Dayıo�lu and Tunalı, 2002). Gender disparity in schooling is also observed among the
younger population, where female school enrollment in basic and secondary education falls
behind male children (Tansel, 2002; Ertürk and Dayıo�lu, 2004). Despite the numerous
studies that analyze the disadvantaged position of women as adults and children, there is
almost no work on the educational experiences of women as young adults. The paucity of
such work has been one of the motivations for this study. The other motivation has been
our observation that in the undergraduate classes we teach female students often
outperform their male counterparts. This casual observation contradicts with the general
experiences of the female population as children and adults. Hence, this study grew out of

3
our curiosity to find out how far our personal observations hold for the general
undergraduate student population in our university.
Following the introduction, the study is organized as follows: Section 2 looks at the
literature on gender differences in scholastic achievement. Section 3 presents a brief
account of the education system in Turkey and gives information about Middle East
Technical University. Section 4 presents the employed methodology, while Section 5
discusses the data set used. Section 6 presents the results on student academic achievement
and compares the performance of male and female students on the basis of a number of
indicators. Section 7 concludes the paper.
2. Review of literature
Despite the lack of interest in Turkey, numerous studies on sex differences in
cognitive performance can be found in the literature. In one of the earliest studies Morris
(1959) referring to the psychic and social differences between sexes, claims that the
education outcomes of men and women will, at least in part, be different at the collegiate
and graduate level. The debate on gender differences in cognitive abilities has actually
evolved out of the debate on biological vs. social determinism. The biological perspective
on sex differences and cognitive performance considers social factors to be trivial or
subordinate to biological factors like brain structure. Lynn in several of his studies (Lynn,
1998a, 1998b, 1999; Allik, Must and Lynn, 1999; Colom and Lynn, 2004) asserts that
males have larger average brain sizes than females and therefore, would be expected to
have higher average IQs1. Mackintosh (1998), on the other hand, claims that there is no sex
difference in general intelligence. Mackintosh proposes that general intelligence should be
1 General intelligence is defined as the sum of verbal comprehension, reasoning and spatial abilities.

4
defined as reasoning ability and that the best measure of this is the Progressive Matrices.2
Examining two tests administered by The Israeli Defense Forces which qualify as IQ tests -
one of them is an adaptation of Progressive Matrices- Flynn (1998) finds no sex difference.
Investigating academic performance at pre-collegiate level, Lao (1980) finds
female students to obtain higher CGPA compared to males. Examining sex-related
difference in classroom grades, Kimball (1989) finds that in contrast to standardized
measures of mathematics achievement tests like SAT-M3, female students outperform
males in math classes. Wilberg and Lynn (1999) arrive at a similar conclusion for history
classes vs. history tests. The authors explain this pattern by stating that females tend to
work more conscientiously and have a stronger work ethic than males. They also tend to
have better language abilities including essay writing skills, vocabulary and word fluency
which contribute to better course work. Stage and Kloosterman (1995) note that although
gender differences in math achievement continue to exist on high cognitive level tasks at
the high school level, such differences appear to be declining. Young and Fisler (2000)
examining SAT-M scores of high school seniors, find males to score better than females.
However, they note that males generally come from households where the parents’
socioeconomic status as measured by examinee reported educational levels and income, is
higher. In contrast, female test takers are more diverse and include more low-income
students than the boys group. Others have argued that the content of the test or of its
administration favors males (Bridgeman and Wendler, 1991). Yet other researchers have
explained the gap by adhering to such factors as differences in course taking behavior,
classroom experiences and cognitive processing (Byrnes, Hong and Xing, 1997; Young
and Fisler, 2000). 2 The Standard Progressive Matrices was constructed in the late 1930s as a test of non-verbal or abstract reasoning ability and the Advanced Progressive Matrices was constructed in 1947 as a more difficult version of the test suitable for those in the higher ability range (Lynn and Tse-Chan, 2003). 3 SATs were revised and renamed as the Scholastic Assessment Tests (SAT I) and Scholastic Achievement Tests (SAT II) (Young and Fisler, 2000; Leonard and Jiang 1999).

5
The studies conducted outside of the US present differing outcomes. Younger,
Warrington and Williams (1999) focus on the gender gap in English secondary schools.
Their analysis is based on the performance of boys and girls in GCSE examinations in the
UK and girls are found to get better grades than boys. This phenomenon is explained by
boys’ disregard for authority, academic work and formal achievement, differences in
students’ attitudes to work and their goals and aspirations and girls’ increased maturity and
more effective learning strategies. Baker and Jones (1993) analyze sex differences in the
eighth grade math performance of over 77,000 students in 19 developed and developing
countries. They find no evidence of a significant gender gap. Both cross-national variation
in sex differences in mathematical performance and the trend toward less of a difference
between males and females question any innate male superiority in intelligence. OECD
(2001) analyzes gender differences in mathematics and science achievement in the eighth
grade for fourteen OECD countries including Turkey. The study finds that gender
differences in mathematics achievement are statistically insignificant in all countries but
the Czech Republic. In science, gender differences favor males and are often statistically
significant except for five countries including Turkey.
In higher education women are often found to outperform men. Hyde and Kling
(2000) state this to be the case irrespective of the measure of success used. Betts and
Morell (1999) report that sex remains a significant predictor of CGPA after controlling for
various individual attributes such as ethnic background, SAT scores and the high school
attended. Similarly, investigating about 60,000 students from 22 public research
universities, Kim, Rhoades and Woodard (2003) find that SAT scores have a significant
impact on student graduation, although at the individual level gender is a more powerful
correlate of graduation than the SAT score. Women are also found to obtain better grades
than would be predicted from their SAT scores (Leonard and Jiang, 1999; Hyde and Kling,
2001; Bridgeman and Wendler, 1991; Wainer and Steinberg, 1992). Many researchers

6
claim that a large part of the under-prediction derives from the difference in course taking
patterns of male and female college students. Ruling out differential course selection as an
explanation for the under-prediction of female grades, Leonard and Jiang (1999) suggest
that females have better study skills than the male students. Other researchers have argued
that women receive higher grades than men because they work harder and attend class
more frequently (Wainer and Steinberg, 1992).
Investigating success in terms of course grades, Bridgeman and Wendler (1991)
find that women typically had equal or higher grades in math classes. Wainer and
Steinberg (1992) on a sample of 62,000 students conclude that although women had lower
SAT-M scores, they received similar grades from first-year math courses. Cohn et al.
(1998), on the other hand, find gender to an insignificant determinant of success in courses
on macroeconomics.
The literature survey on gender differences in scholastic performance at different
levels indicate mixed results. However, one common finding is that females outperform
their male counterparts in higher education. In what follows next, we shall try to see
whether this is also true for Turkey.
3. Education system in Turkey and at METU
The formal education system in Turkey includes basic education, secondary
education and higher education institutions. Basic education is compulsory and lasts for
eight years. Secondary education, on the other hand, is composed of general, and technical
and vocational high schools. General high school education last for three years, while
technical and vocational training may extend up to four years. While the former is geared
more toward preparing students for tertiary education, the latter aims to equip students with
marketable skills for immediate employment after graduation. The curricula of vocational
and technical schools differ depending on the type of vocational training they offer. The

7
curricula of general high schools may also differ from each other; while some schools
emphasize mathematics and sciences in their teachings, in others the emphasis is on
foreign languages with the medium of instruction being in a foreign language. A
significant proportion of these specialized public high schools admit students through a
centralized exam. The overwhelming majority of basic and secondary education schools
(including the specialized high schools) are public and free of charge though the parents
are expected to meet various school expenses such as books, school supplies, commuting
fees etc. The proportion of the student population enrolled in private basic and secondary
schools is limited to 1.5% (MNE, 2004).
3.1 Progression to higher education
Admittance to higher education is through a central examination managed by the
Student Selection and Placement Center. The university entrance exam is given once a year
and over 1.5 million high school graduates take it annually. The applicants get placed into
the departments and universities of their choice depending on their placement score which
includes the examination score along with the high school CGPA of the student. The latter
is weighted by the standing of the student’s school in the placement exam. Following the
exam, the student submits to the Placement Center a list containing his/her department and
university preferences. Depending on the score obtained, s/he may get placed into any one
or none of his/her submitted choices as placement starts from the applicant with the highest
score and moves down until the allocated slots for each department is filled. The minimum
score above which a department in a given university admits students may change from
one year to the next depending on the demand for the department in that specific university
and the available seats. Medical schools and engineering departments are usually high in
demand requiring top scores. At the other end of the spectrum, there are open-university
programs that require much lower scores for admittance. The scores of more established

8
universities are also comparatively higher. Although there are 53 public and 24 private
universities4 scattered around the country vast difference in the quality of higher education
offered causes excess demand for more established universities. On a yearly basis, roughly
one out of ten applicants gets placed into a four-year program. An additional 20% are
placed into open-university or two-year programs (SSPC, 2004). The success rate is
slightly lower for the first time applicants (44%) who often end up taking the exam a
number of times before they get placed (T.C. Yüksekö�retim Kurulu, 2003). The problem
associated with not being placed into a program of choice lies in the imbalance between
the demand for and supply of higher education. Despite the high demand, limited capacity
causes university graduates to constitute a small proportion of the population. Among the
adult population those with higher education, inclusive of open-university, is limited to 6%
(SIS, 2003). This figure is lower for women recorded at 4.9%.
The university entrance exam has taken on such a paramount importance in the
lives of the young people that many devote a good part of their last two years in high
school preparing for this examination. In fact, the struggle starts earlier in trying to get into
a high school that is reputed to succeed in getting the largest number of students placed in
prestigious universities. But the struggle hardly ends there. Besides following the high
school curriculum, students attend specialized private courses geared toward preparing
them for the university examination during their high school years. The cost of such
private courses is often rather high. The end result is that the chances that a young adult of
modest background will enter a highly competitive university are rather slim.
3.2 Middle East Technical University
Middle East Technical University (METU), located in the capital city of Ankara, is
one of the larger public universities in Turkey with nearly 14,500 undergraduate and 5,200
4 More information on universities in Turkey can be obtained from http://www.yok.gov.tr.

9
graduate students, and 700 faculty members (METU, 2003). It was established in 1956 by
an American mission and therefore, the education system shares many common features
with American universities. It operates on a semester system. Students obtain credits from
the courses they take and graduation is conditional on obtaining the required amount of
credits from a minimum number of courses within a maximum of 14 semesters. Being a
public university the tuition fee is relatively low ranging from $240/year in the Faculty of
Education to $650/year in the Faculty of Architecture.5 Students who do not have the
financial capability of meeting the minimum fees can however, apply for various types of
student grants. In this sense, METU is open to students with various socio-economic
backgrounds, provided that they manage to get through the highly rigorous (and costly)
selection process described earlier.
There are 39 departments at METU organized under five schools; Architecture and
City Planning, Economics and Administrative Sciences, Education, Engineering and Arts
and Sciences. There is no medical or law school. METU was originally established as a
technical university. Although social sciences were later added to it, it has nevertheless
continued to have a technical character with over half the student body enrolled in one of
the 13 engineering departments. Entry into METU is highly competitive. The majority of
departments admit students from the top 1% of applicants taking the university placement
exam. Being a well-reputed university, it attracts students from all over the country though
the main crux of the student body comes from Ankara and western provinces. The
proportion of students coming from east and southeast, which are relatively poorer regions
of the country, is limited to less than 5% of the student body.
Women’s representation in higher education across the world is increasingly
approaching parity with men (Bradley, 2000). At METU female students constitute 37.4%
of the student body (Table 2) which is lower than the average (43%) recorded for the
5 For further details on METU see http://www.metu.edu.tr

10
country at large.6 If one possible reason for the lower share of female students at METU is
its engineering character, the other might be the relatively poorer performance of female
students in the placement exam. We address the latter point in the ensuing sections of the
paper.
The medium of instruction at METU is English so that before the students are
admitted to their respective departments, they need to pass an English language test. If
their background in English is found to be unsatisfactory, they enroll in the preparatory
school. Progression to departments requires receiving a passing score in the language test.
4. Methodology
A number of indicators can be used to determine the academic achievement of an
undergraduate student. In the literature, the most frequently employed measure is students’
cumulative grade point average (CGPA). In this paper, we also primarily rely on CGPA to
measure academic success though we do employ additional measures such as university
entrance scores and progression from preparatory school to departments to capture student
performance at different stages of students’ academic life.
As mentioned earlier, a whole host of factors affect student achievement. The
variable of prime interest for this study is the sex of the student. To see whether females
have an advantage over males, we use a multivariate analysis and thereby, control all other
possible predictors of CGPA.
Among individual level effects we consider student’s age and his/her year of entry
to university. For reasons such as repeated classes, not being able to enter university right
after graduation from high school, or being on leave for a period of time, the age of the
students will show variations within a given class. We might expect older students to
perform better than their younger classmates for the reason they are likely to be more
6 See http://www.osym.gov.tr.

11
mature. However, if they are composed of class repeaters this might indicate either that
their ability is lower than the average or that they are not as motivated as others, causing
their performance to suffer.
The student’s university entrance score and the type of high school attended will
also be important in determining student achievement as they would be indicative of
student ability and motivation. The studies that explore the determinants of
university/college GPAs use mainly SAT scores, high school GPA and class rank to
predict success in higher education. Among these variables SAT has long been advocated
as a necessary check on potentially heterogeneous high school grading policies so as to
decrease the influence of high school grade inflation (Rothstein, 2004). As mentioned
earlier, the university entrance score used in this study is an amalgam of the entrance
examination score, student’s high school CGPA and the relative success of the student’s
high school in the placement exam. The use of this three-parameter scale avoids the
problem of grade inflation and hence, is a better measure of student ability. Also, assuming
that the student’s achievement depends on his/her willingness to graduate from the
department that s/he is in, we include the preference rank for his/her department as another
factor. Whether or not the student was enrolled in preparatory school and the number of
semesters spent there, are also controlled for to see whether or not language ability affects
academic achievement.
The socio-economic background of the student may also be important in
determining his/her academic achievement. Unfortunately, the data set we employ lack
information relating to parental characteristics. To partly proxy for the socio-economic
standing of the family, we employ student’s place of permanent residence. The type of
high school attended, i.e. whether it was private or not, will also be indicative of the socio-
economic standing of the family.

12
In the multivariate analysis, we also employ a number of control variables
reflecting departmental/school characteristics. For instance, we control for the school that
the student is enrolled in for the reason that the average CGPA in a given school might be
traditionally lower or higher in comparison to others. Other control variables include the
gender composition of the student body and that of the faculty in the department that the
student is enrolled. We conjecture that the higher is the representation of women in the
form of fellow students or faculty the greater will be the academic success of female
students as the former will help create a support group and a network, while the latter will
act as role models. Empirical research finds mixed support for the role model hypothesis.
Robst, Keil and Russo (1998) find a positive relationship between retention of female
students and the percentage of science and mathematics classes taught by female faculty.
No significant relationship is found for men. Canes and Rosen (1995), on the other hand,
find no evidence that the gender composition of the students in a department is affected by
the gender composition of the faculty. Jacobs (1996) reports mixed evidence on student
satisfaction with same sex advisors and faculty. Rothstein (1995) states that the percentage
of female faculty at a college had a positive, statistically significant impact on the
probability that female students surveyed would attain an advanced degree.
In addition to the CGPA of students, we analyze university entrance scores, and the
number of semesters spent in the preparatory school as additional indicators of academic
achievement. In the analysis of university entrance scores, our interest lies in determining
whether or not there are appreciable differences between male and female students in terms
of educational achievement at the time they enter the university. The performance at the
preparatory school, which is measured by the semesters spent there until the student
achieves a passing mark in the English language test, will indicate the language ability of
the student. Based on these three indicators - CGPA, university entrance scores and the
number of semesters spent in the preparatory school - we hope to get an understanding
13
about academic performance at different stages of student’s life; at the time of college
entry, before the progression to departments and during the time spent in the department
itself.
One possible caveat in our analysis might be the university drop-outs. The data set
we employ does include students who have failed out of their classes and face possible
dismissal but not those who dropped out for personal reasons or were dismissed in earlier
semesters. Dismissal occurs if a student fails to accumulate a total of 1.80 points at the end
of three consecutive semesters.7 The rate of dismissal at METU is rather low, which is
reported to be 0.7% of all undergraduates in the 2001-2002 academic year (METU, 2003)
and 0.6% in the 2002-2003 period (METU, 2004). Given the small number of drop-outs,
we do not expect them to impact on our results significantly.
5. The data
The data for this study come from the undergraduate student records compiled by
the registrar’s office of METU. We were provided with an extract of this data reflecting the
academic standing of the students as of Spring 2003. Table 1 presents the descriptive
statistics on the undergraduate population based on key variables. The original data
included 11,560 students. We excluded international students (who constitute 4.6% of the
sample) and those who have transferred from abroad for the reason that they have no
university entrance score. We also dropped departments such as physical education and
vocational training for the same reason that they admit students not through the university
exam but via an alternative mechanism. Additional exclusions include a small number of
students with missing information. With all these exclusions, the data set is reduced to
10,343 individual cases.
7 The rules for dismissal have been changed starting from the 2003-2004 academic year. According to the new regulations, a student can be dismissed if s/he fails to achieve 1.80 CGPA at the end of 14 semesters. Students who are in their final semester but who have failed at most three classes can take make-up exams.

14
Female students constitute 37.4% of the total student body8 and are heavily
represented in non-engineering departments though as mentioned earlier, METU has an
engineering bias. Whether this is the result of women’s choice, societal discrimination or
failure to receive high enough placement scores is a question that begs an answer. As will
be illustrated later in the paper, lower placement scores might partly explain the gender
imbalance though considering that the teaching staff and the guidance councilors in basic
and secondary schools in Turkey often carry and, consciously or unconsciously, reflect
onto their students notions of gender appropriate traits and competencies and often use
gender biased teaching materials (Acar et al., 1999; Helvacıo�lu, 1996), the role of societal
discrimination cannot be ruled out. It has also been suggested that women who expect
interruptions in their work careers choose those fields that have low cost of exit and re-
entry (Polachek, 1981; Jacobs, 1995; Blakemore and Low, 1984) which might also explain
their lower concentration in engineering departments.
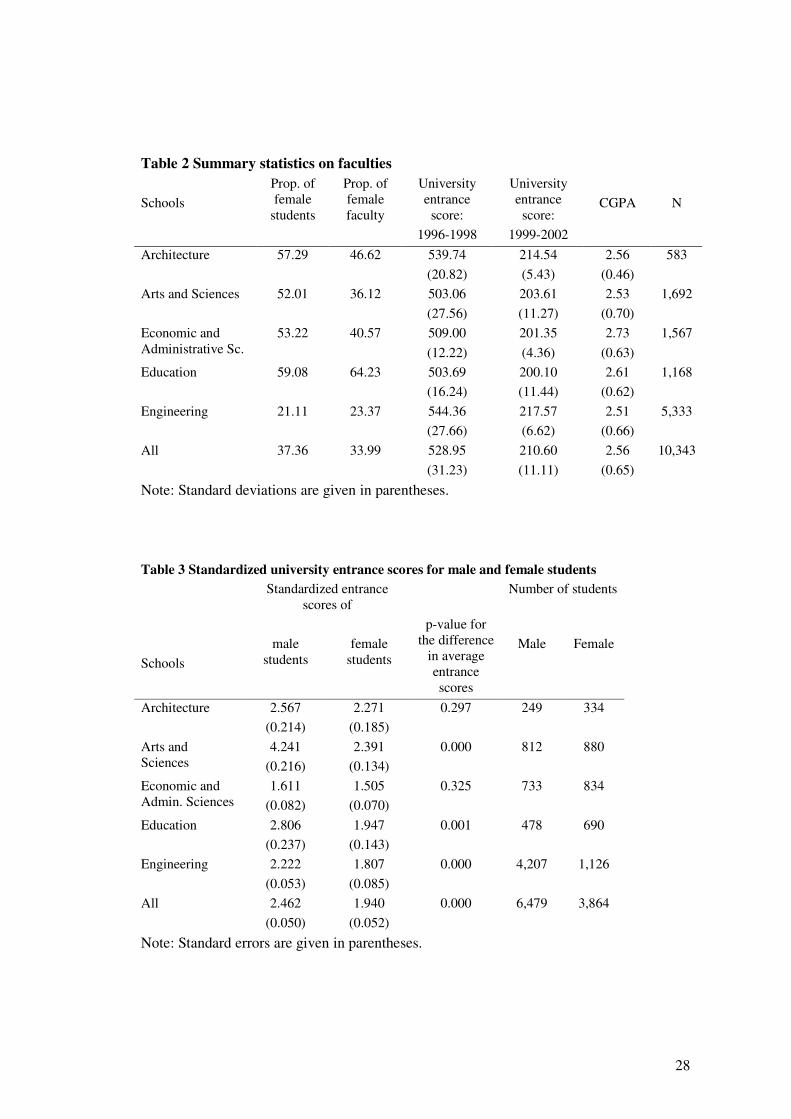
The gender composition of the teaching staff also shows wide variations across
schools, which is not a surprising finding given the imbalance in the gender distribution of
majors (see Table 2). While women constitute 34% of the full-time teaching staff, their
representation in the Faculty of Education reaches 64.2%, but goes down as low as 23.4%
in the Faculty of Engineering. The latter also constitutes the most competitive school with
the highest average admittance score. The scoring system in the centrally managed
university entrance examination changed in 1998 so that in Tables 1 and 2 we report two
sets of entrance scores, one relating to students who have entered METU prior to the
change in 1998 and the other for those who have entered after this date. Both sets of scores
indicate that the Faculty of Engineering accepts students with relatively higher university
8 Women constitute a slightly smaller proportion (about 42%) of high school graduates taking the university exam.

15
entrance scores. Interestingly though, the engineering students have the lowest CGPA9 of
all schools, which might be indicative of its more demanding nature in relation to others.
When the CGPA of male and female students are compared, a difference in favor
of the latter is observed. An opposite observation is made in terms of university entrance
scores, though female applicants seem to be more successful in getting into the department
of their choice which might indicate that they have lower aspirations. While male students,
on average, enter their fifth choice, female students manage better, the average of their
school rank being 4.4.
A substantial portion of the students (36.9%) come from Anatolian High Schools
where the medium of instruction is in a foreign language, usually in English. Students from
private schools make up a little more than one fifth of the student body, which considering
the overall share of private schools in secondary education, is quite substantial. This
finding goes to indicate that students at METU are a select group. Based on their high
school background, a significant number of students are expected to have a fair amount of
knowledge in the English language. Despite this, over 70% of the student body is found to
enroll in the preparatory school before proceeding on to departments. The average number
of semesters spent in the preparatory school is close to two semesters or one academic
year. These results imply either that high school English does not equip students with the
required language skills or that students opt to enroll in the preparatory school (by
purposely not doing well in the English proficiency exam) to have a break from their
studies. If the latter is the case, there is certainly a waste of resources, which needs to be
avoided.
The distribution of students also shows variations by year. In comparison to males,
a higher proportion of females are freshmen, whereas a smaller proportion of them are
9 Courses taken from the preparatory school are excluded from CGPA calculations since they are evaluated on a pass or fail basis.

16
seniors. The former observation stems from the fact that a smaller proportion of females
attend preparatory school and when they do, they spend fewer semesters there. The latter
observation, on the other hand, may stem from more timely graduation of female students.
In other words, if female students are more successful in their studies, which is the subject
of the next section, their presentation among seniors will be less than their overall share.
As mentioned earlier, dismissal is rather unlikely which essentially means a greater
concentration of students in the fourth-year.
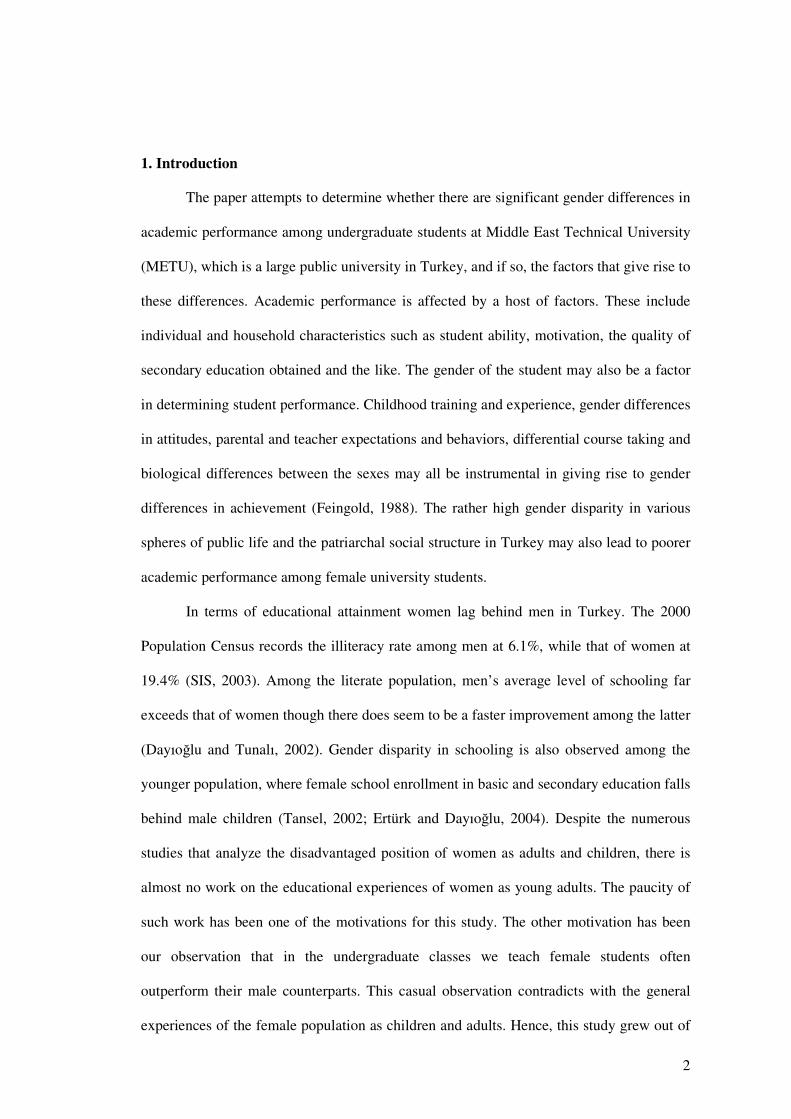
As students mature and get used to their department, their performance improves so
that higher CGPAs are recorded in upper classes. Figure 1 shows that the distribution of
CGPA by year is distinctly different so that pooling students from all years might not be
appropriate. Therefore, in what follows next, we analyze the academic performance of
genders separately for each year. Before proceeding on to presenting our results, it is also
important to emphasize that the student body at METU represents the best students in
Turkey so that the conclusions drawn from this study may not be representative of the
other 1.5 million students who hope to get a university degree.
6. Academic performance by sex
In this section of the paper, we analyze the academic performance of male and
female students via three indicators; university entrance scores, the rate of progress from
preparatory school to faculties and student CGPA.
6.1 University entrance scores
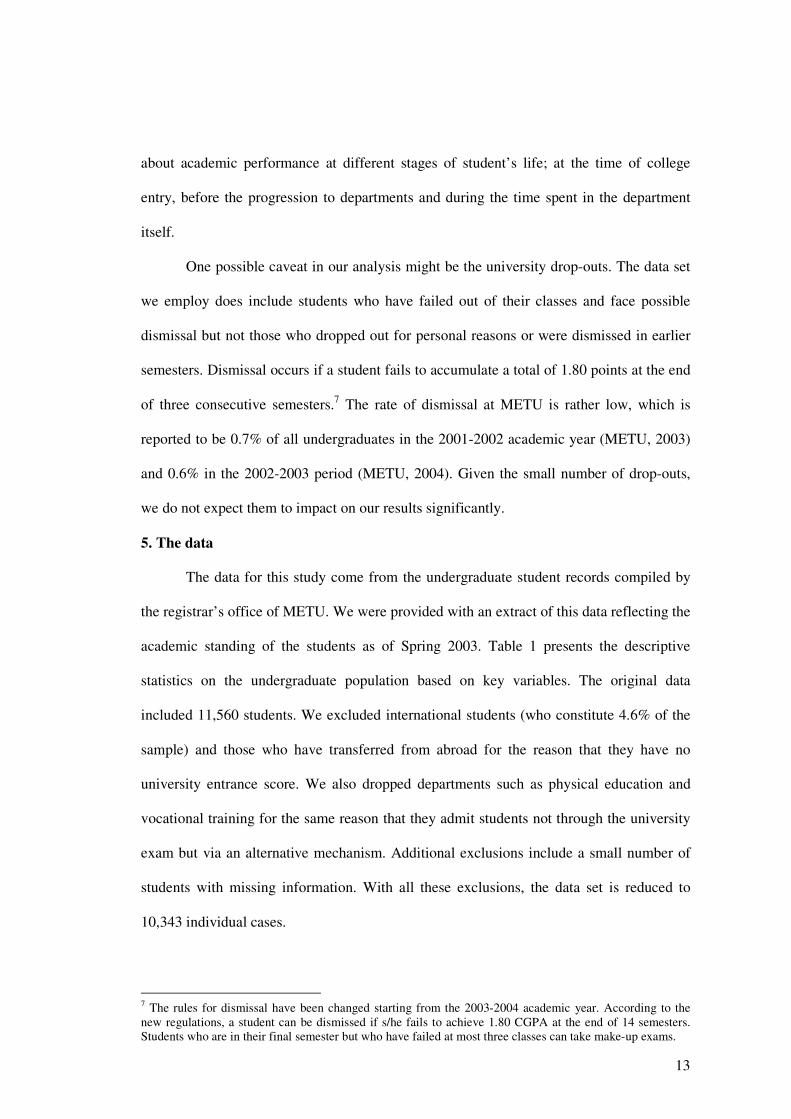
As the summary statistics indicated in Table 1, there is a gender gap in favor of
male students in terms of university entrance scores. Figures 2A and 2B illustrate the
cumulative distribution of entrance scores for male and female students for the 1999-2002
and 1996-1998 periods, respectively. In both graphs, the cumulative distribution of female

17
scores lies above the distribution for males indicating the existence of a gender gap in
favor of the latter. The observed difference in scores may originate from two sources; (1)
Female students are less successful in the placement exam so that they enter their
respective departments with lower scores, (2) Female students prefer less competitive
departments that admits students with lower scores, which reduces their motivation to do
well in the entrance exam or that due to their lower scores they get placed into departments
with lower entrance requirements. The distribution of students across schools given in
Table 1 indeed shows that female students are concentrated in schools with less
competitive entrance requirements. To allow comparability across departments and to see
whether female students do indeed enter their departments with lower scores, we
standardize the entrance scores using the score obtained by the last student admitted to the
department in question. Minimum scores show variations among departments and across
time primarily due to the change in the demand for the department. Standardization, which
is done by subtracting the student’s score from the minimum score, accounts for
interdepartmental demand differences as well as the change in the scoring scheme in
1999.10
The mean standardized university entrance scores for male and female students by
schools along with the associated p-values reflecting the results of the hypothesis that there
is no gender gap in entrance scores are given in Table 3. For female students the average
standardized entrance score is found to be 1.94 points, whereas for male students this
figure stands at 2.46 points. Although, in comparison to the crude differential the gender
gap is substantially reduced, it nevertheless remain statistically significant at conventional
levels (p<0.000). These results confirm that while a good portion of the crude gap stems
10 The standardized scores may embody negative values due mainly to transfer students. If a student cannot get into the department of his/her choice but enrolls in a different program, s/he has the possibility of transferring to his/her preferred program provided s/he meets the set criteria. One of the requirements is that his/her university entrance score is not below a given cut off point, which is determined in relation to the minimum score of the department in the year that the student took the university exam.

18
from females being placed into less competitive departments, the fact that there is a
significant gender gap in standardized scores imply that they enter their respective
departments with lower scores.
Analyzing the gender gap by schools shows that the gap is statistically significant
to the disadvantage of women in all five schools except for the Faculty of Architecture and
the Faculty of Economic and Administrative Sciences (see Table 3). The difference is
especially big in the Faculty of Arts and Sciences possibly because rather diverse
departments are gathered under the same school, ranging from such technical fields as
physics and mathematics to departments that are more social science oriented such as
sociology and history. The placement scores for male and female students by departments
along with the p-values showing the statistical significance of the gender gaps are given in
Appendix Table A1. Indeed, as conjectured above, the departments under the Faculty of
Arts and Sciences demonstrate larger gender gaps in placement scores.
These findings are consistent with the literature on gender disparity in SAT scores
in the US. However, the gap cannot be explained by differential course taking patterns
between sexes since unlike the American students who can choose among courses, all
Turkish high school students are required to take the same mandatory courses including
math. Neither is there evidence that the university entrance exam is biased against a given
sex or that male and female examinees differ in terms of socio-economic background.11
Hence, the reason for the gap must lie in the pre-collegiate experience of students.
6.2 Preparatory school
An imbalance is also observed in the gender composition of the preparatory school.
While the proportion of male students enrolling in preparatory school at the start of their 11 Even if they do, it is unlikely that the students admitted to METU will differ from each other as well. Conjecturing that the sample of male and female students will differ at the low end of the score distribution and given that METU admits only a fraction of students from top, we expect a rather homogenous student population by sex.

19
college life is 74.5%, the corresponding rate for female students is 68.4%. The difference is
statistically significant (p-value<0.000). There is also a small but statistically significant
gap in the number of semesters male and female students spend in the preparatory school
before they pass the English language test. While male students spend, on average, 1.85
semesters learning English, this figure is 1.8 semesters for females. These observations can
be taken to indicate the higher language ability of female students in comparison to their
male counterparts, though differences in motivation may also be a factor.
6.3 Cumulative grade point average
Next, we consider the academic achievement of male and female students in terms
of CGPA. The summary statistics presented in Table 1 showed that female students, on
average, outperform their male counterparts. To see whether this result holds when other
relevant factors determining CGPA are controlled for, we run a series of OLS estimations
disaggregated by year (freshman, sophomore, junior, and senior).
Running the model on a pooled sample of male and female students reveal that
holding individual characteristics constant and controlling for differing departmental
characteristics, females are expected to have CGPAs that are 0.12-0.13 points higher than
that of their male counterparts (see Appendix Table A2). This result holds regardless of the
year of the student. Having found that the gender of the student matters in determining
CGPA, we run separate regressions for male and female students to determine the factors
that are instrumental in bringing about an advantage for females. The results are presented
in Tables 4 and 5.
Age is an important determinant of the CGPA of male students but not of females,
with the exception of first-year women. This result possibly stems from the fact that girls
mature faster than boys. Younger students in a given class are found to outperform their
older counterparts who are likely to be composed of class repeater or those who have

20
entered the university after a number of tries. Since we are controlling for the year of entry,
which has a positive effect on CGPA indicating that more recent entrants are more
successful, it must be that older students are class repeaters. The results seem to be
indicating that, in a given class, a larger proportion of males are composed of class
repeaters which is also supported by descriptive statistics presented in Section 3.
The type of high school attended also matters. Male students graduating from
Anatolian and science high schools and private language schools outperform other male
students during freshman and senior years. The language skills acquired in these schools
might be instrumental in helping the first-year students follow classes, while making it
easier for seniors to fulfill their written assignments which intensify in the final year.
However, it is interesting to note that in their second and third years, male students
graduating from general public high schools that manage to send only a small number of
their graduates to METU outperform others. A plausible explanation is that these are a
select group of students who probably have above average skills (though not necessarily
language skills) making it possible for them to enter METU. Among females, the effect of
high school differences on CGPA is not so pronounced. Graduating from sciences oriented
high schools help, we suspect because they equip students with better academic skills.
The (standardized) university entrance scores impact positively on CGPA though
the effect is observed most strongly in the first year. While its effect lingers on to the
second year for male students, it disappears for female students only to reappear in the
third year, but with a much weaker effect. Even among freshmen, the impact of university
entrance scores on CGPA is rather minimal. This may be due to the fact that there is not
much variation in the placement scores especially when differences among departments are
controlled. A student entering his/her department with an extra point as compared to the
student with the lowest placement score expects to have a CGPA that is 0.02-0.04 points
higher. Holding the placement score constant, getting into a less favored department, on

21
the other hand, decreases the CGPA of male and female students quite significantly. The
effect is not only stronger but also persists throughout the student’s college life. For
instance, a freshman entering his/her 10th choice expects to have 0.4 points lower CGPA
than a fellow student entering the department as a first choice.
The preparatory school education, taking into the semesters spent there, impacts on
student achievement positively. The only exception is observed for male students in the
freshman year, for whom no significant effect is recorded. It is interesting to also note that
additional semesters spent in the preparatory school, except for in the first year, do not
seem to negatively affect student performance. The negative impact in the first year
possibly stems from adjustment problems. Preparatory school education is relatively less
demanding so that the longer the time spent here, the harder the transition is from the
preparatory school to the department. The positive effect in upper years, on the other hand,
implies that certain number of semesters in preparatory school is required to achieve
competency in the English language.
The department in which the student is enrolled also matters in determining his/her
CGPA. For both the male and female students, there seems to be a ‘penalty’ associated
with being in the engineering school though as mentioned earlier, it admits students with
relatively higher university entrance scores. Comparing the ‘grade premium’ associated
with not being an engineering student across male and female students reveal that only in
the freshmen year and in the Faculty of Education do the female students have a premium
over their male counterparts. Male students, on the other hand, have an advantage over
females in the Faculty of Architecture and Arts and Sciences in sophomore and junior
years and in the Faculty of Education in their senior year.
The gender composition of the student body in the department that the student is
enrolled in does not seem to impact on the success of female students. However, quite
interestingly, higher female student composition works to reduce the CGPA of male

22
students. Since almost the entire student body comes from co-ed schools, this effect is
puzzling. A plausible explanation is that contrary to our conjecture, female students are
more conservative about including their male classmates into their study groups so that
where the latter constitute a minority they suffer from lack of study networks. Higher
female faculty composition, on the other hand, works to increase the CGPA of both the
male and female students. Although the ‘role model’ hypothesis would predict a positive
effect for females, it is not clear why male students are also positively affected. In fact,
except for the freshmen among whom the favorable effect is observed only for male
students, higher female faculty ratio does not seem to particularly bring about an advantage
for female students. A plausible conjecture for the equally favorable effect of women
faculty on male and female students’ academic performance is that women faculty
members are more generous in giving out grades compared to their male counterparts.
Students from Ankara, the majority of whom would be living at home, are
predicted to have higher CGPAs. So do the male students residing in dormitories on
campus. Female students’ academic performance seem to be less affected from being away
from their families, or having to live alone possibly because they have been brought up
with skills to manage on their own whereas, male students often lack such skills.
Alternatively, it might be that female students are freed from their domestic obligations
and therefore, perform better.
7. Conclusion
The study has established that despite their lower university entrance scores and
under-representation in most departments, female undergraduate students outperform their
male counterparts during their college years. While it is true that higher grades in the
Faculty of Education and the greater concentration of female students in education
departments help explain the higher CGPA for the female student population, it is also the

23
case that female students outperform their male counterparts in all the other four schools
considered. The multivariate analysis has further shown that, controlling for all other
relevant factors, belonging to a certain school does not bring about an advantage to female
students. Quite the contrary, it is the male students who enjoy a ‘grade premium’. To the
extent that we are controlling for student ability and other relevant individual attributes,
our results seem to indicate that female students are able to make better use of their
individual endowments and the opportunities offered at METU in achieving higher grades.
As suggested in the literature, this would most likely to entail such factors as better class
attendance, study skills, and motivation on the part of the female students.
Amidst the gender inequality in much of the public life in Turkey, higher course
grades achieved by female students are encouraging. However, gender segregation by
fields of study should not be overlooked. A significant portion of the gender earnings gap
(as much as 45%) among university graduates in the US is attributed to differences in
majors (Solnick, 1995; Jacobs, 1996). To the extent that females are less likely to get into
lucrative fields of study, this may translate into lower earnings in the future. Labor market
statistics in Turkey indicate that university educated women earn less than men. The most
recent statistics put this gap at little under 25%.12 It must also be considered that not all
university educated women enter the labor market (62% do as opposed to 78% of men). If
labor market discrimination is a factor in this, then the earnings gap reported above is
probably underestimated. Since METU does not keep track of the labor market
performance of its graduates, it is not clear whether women alumni constitute a happy
minority who find the labor market as open and satisfying as men do. It might very well be
that they end up becoming part of the larger crowd of highly qualified but underemployed
women.
12 The figure is based on hourly earnings of men and women and is calculated by the authors using the 2002 Household Income and Consumption Expenditures Survey.

24
Acknowledgements This work was undertaken with the support provided by METU Scientific Project Fund (BAP-2004-04-03-02). We would like to thank Erol Taymaz for his suggestions and comments. References Acar, F. Güne�-Ayata, A. and Varo�lu, D. (1999) Cinsiyete Dayalı Ayırımcılık: Türkiye’de
E�itim Sektörü Örne�i (Gender Discrimination: A Case Study of the Education Sector in Turkey), Ankara: KSSM
Allik, J., Must, O. and Lynn, R. (1999) Sex Differences in General Intelligence among High School Graduates: Some Results From Estonia, Personality and Individual Differences, 26, pp. 1137-1141.
Baker, D. P. and Jones, D. P. ( 1993) Creating Gender Equality: Cross-national Gender Stratification and Mathematical Performance, Sociology of Education, 66, pp. 91-103.
Betts, J. R. and Morell, D. (1999) The Determinants of Undergraduate Grade Point Average: The Relative Importance of Family Background, High School Resources, and Peer Group Effects, The Journal of Human Resources, 34, pp. 268-293.
Blakemore, A. E. and Low, S. A. (1984) Sex Differences in Occupational Selection: The Choice of College Majors, Review of Economics and Statistics, 66, pp. 157-163.
Bradley, K. (2000) The Incorporation of Women into Higher Education: Paradoxical Outcomes?, Sociology of Education, 73, pp. 1-18.
Bridgeman, B. and Wendler, C. (1991) Gender Differences in Predictors of College Mathematics Performance and in College Mathematics Course Grades, Journal of Educational Psychology, 83, pp. 275-284.
Byrnes, J. P., Hong, L. and Xing, S. (1997) Gender Differences on the Math Subtest of the Scholastic Aptitude Test May Be Culture-Specific, Educational Studies in Mathematics, 34, pp. 49-66.
Canes, B. J. and Rosen, H. S. (1995) Following in Her Footsteps? Faculty Gender Composition and Women’s Choices of College Majors, Industrial and Labor Relations Review, 48, pp. 486-504.
Cohn, E., Cohn, S., Hult Jr., R. E., Balch, D. C. and Bradley Jr., J. (1998) The Effects of Mathematics Background on Student Learning in Principles of Economics, Journal of Education for Business, 74, pp. 18-22.
Colom, R. and Lynn, R. (2004) Testing the Developmental Theory of Sex Differences in Intelligence on 12-18 Year Olds, Personality and Individual Differences, 36, pp. 75-82.
Dayıo�lu, M. and Tunalı, �. (2003) Falling Behind While Catching Up: Changes in the Female-Male Wage Differential in Urban Turkey, 1988 to 1994, paper presented at the 2003 Annual Meeting of the Population Association of America.
Ertürk, Y. and Dayıo�lu, M. (forthcoming) Gender, Education and Child Labor in Turkey, Geneva: ILO.
Feingold, A. (1988) Cognitive Gender Differences Are Disappearing, American Psychologist, 43, 95-103.
Flynn, J. R. (1998) Israeli Military IQ Tests: Gender Differences Small; IQ gains Large, Journal of Biosocial Sciences, 30, pp. 541-553.
Helvacıo�lu, F. (1996) Ders Kitaplarında Cinsiyetçilik (Gender Bias in School Textbooks), Ankara: Kaynak Publishing.

25
Hyde, J. S. and Kling, K. C. (2001) Women, Motivation and Achievement, Psychology of Women Quarterly, 25, 364-378.
Jacobs, J. A. (1995) Gender and Academic Specialties: Trends among Recipients of College Degrees in the 1980s, Sociology of Education, 68, pp. 81-98.
Jacobs, J. A. (1996) Gender Inequality and Higher Education, Annual Review of Sociology, 22, pp. 153-185.
Kim, M. M., Rhoades, G. and Woodard Jr., D. B. (2003) Sponsored Research versus Graduating Students? Intervening Variables and Unanticipated Findings in Public Research Universities, Research in Higher Education, 44, pp. 51-81.
Kimball, M. M. (1989) A New Perspective on Women’s Math Achievement, Psychological Bulletin, 105, pp. 198-214.
Lao, R. C. (1980) Differential Factors Affecting Male and Female Academic Performance in High School, The Journal of Psychology, 104, pp.119-127.
Leonard, D. K. and Jiang, J. (1999) Gender Bias and the College Predictors of the SATs: A Cry of Despair, Research in Higher Education, 40, pp. 375-407.
Lynn, R. (1998a) Sex Differences in Intelligence: A Rejoinder to Mackintosh, Journal of Biosocial Sciences, 30, pp. 529-532.
Lynn, R. (1998b) Sex Differences in Intelligence: Some Comments on Mackintosh and Flynn, Journal of Biosocial Sciences, 30, pp. 555-559.
Lynn, R. (1999) Sex Differences in Intelligence and Brain Size: A Developmental Theory, Intelligence, 27, pp. 1-12.
Lynn, R. and Tse-Chan, P. W. (2003) Sex Differences on the Progressive Matrices: Some Data From Hong Kong, Journal of Biosocial Sciences, 35, pp. 145-150.
Mackintosh, N. J. (1998) Reply to Lynn, Journal of Biosocial Sciences, 30, pp. 533-539. Ministry of National Education (MNE) (2004) Statistics on National Education 2002-
2003, http://www.meb.gov.tr Middle East Technical University (2003). 2002 Faaliyet Raporu (Activities Report),
Ankara: METU. Middle East Technical University (2004). 2003 Faaliyet Raporu (Activities Report),
Ankara: METU. Morris, V. C. (1959) Male, Female, and the Higher Learning: The Educational
Significance of Differences between the Sexes, Journal of Higher Education, 30, pp. 67-72.
OECD (2001) Education at a Glance: OECD Indicators, Paris: OECD Publicatons. Polachek, S. W. (1981) Occupational Self-Selection: A Human Capital Approach to Sex
Differences in Occupational Structure, The Review of Economics and Statistics, 63, pp. 60-69.
Robst, J., Keil, J. and Russo, D. (1998) The Effect of Gender Composition of Faculty on Student Retention, Economics of Education Review, 17, pp. 429-439.
Rothstein, D. S. (1995) Do Female Faculty Influence Female Students’ Educational and Labor Market Attainments?, Industrial and Labor Relations Review, 48, pp. 515-530.
Rothstein, J. M. (2004) College Performance Predictions and the SAT, Journal of Econometrics, 121, 297-317.
Solnick, S. J. (1995) Changes in Women’s Majors from Entrance to Graduation at Women’s and Coeducational Colleges, Industrial and Labor Relations Review, 48, pp. 505-514.
Stage, F. K. and Kloosterman, P. (1995) Gender, Beliefs, and Achievement in Remedial College-Level Mathematics, Journal of Higher Education, 66, pp. 294-311.
State Institute of Statistics (SIS) (2003). Census of Population 2000, Ankara: SIS. Student Selection and Placement Center (SSPC) (2004) http://www.osym.gov.tr.

26
T.C. Yüksekö�retim Kurulu (2003) Türk Yüksekö�retiminin Bugünkü Durumu March 2003 (http://www.yok.gov.tr/egitim/raporlar/Mart2003).
Tansel, A. (2002) Determinants of School Attainment of Boys and Girls in Turkey: Individual, Household and Community Factors, Economics of Education Review, 21, pp. 455-470.
Wainer, H. and Steinberg, L. S. (1992) Sex Differences in Performance on the Mathematics Section of the Scholastic Aptitude Test: A Bidirectional Validity Study, Harvard Educational Review, 62, pp. 323-336.
Wilberg, S. and Lynn, R. (1999) Sex Differences in Historical Knowledge and School Grades: A 26 Nation Study, Personality and Individual Differences, 27, pp. 1221-1229.
Young, J. W. and Fisler, J. L. (2000) Sex Differences on the SAT: An Analysis of Demographic and Educational Variables, Research in Higher Education, 41, pp. 401-416.
Younger, M., Warrington, M. and Williams, J. (1999) The Gender Gap and Classroom Interactions: Reality and Rhetoric? British Journal of Sociology of Education, 20, pp. 325-341.

27
Table 1 Descriptive statistics on key variables All Male Female Age 21.43
(1.52) 21.57 (1.58)
21.18 (1.39)
University entrance score: 1999-2002
210.60 (11.11)
213.85 (9.50)
205.68 (11.55)
University entrance score: 1996-1998
527.95 (31.23)
533.27 (30.71)
514.43 (28.35)
CGPA 2.56 (0.65)
2.48 (0.67)
2.70 (0.61)
Year at university First year 26.54 25.50 28.29 Second year 25.33 25.17 25.60 Third year 23.11 22.41 24.28 Fourth year 25.02 26.92 21.84 School Architecture 5.64 3.84 8.64 Arts and Sciences 11.29 7.38 17.86 Economics and Administrative Sc. 16.36 12.53 22.77 Education 15.15 11.31 21.58 Engineering 51.56 64.93 28.14 High School Type Anatolian (public foreign language) 36.95 35.11 40.03 Sciences 9.33 10.97 6.57 Regular high school 19.90 22.64 15.30 Private Sciences 4.07 5.09 2.36 Private regular 1.55 1.85 1.04 Private language school 17.82 16.18 20.57 Other 10.38 8.16 14.13 Preference rank for department 4.82
(3.37) 5.06
(3.46) 4.42
(3.17) Prep school: Yes 72.21 74.74 68.43 Semesters in prep. school 1.83
(0.64) 1.85
(0.65) 1.80
(0.63) Resides in dormitory 40.07 35.51 47.70 Permanent residence in Ankara 34.21 34.26 34.11 No. of observations 10,343 6,479 3,864 Note: For continuous variables standard deviations are given in parenthesis.
The discrete variables are given in percentage terms.
28
Table 2 Summary statistics on faculties Schools
Prop. of female
students
Prop. of female faculty
University entrance
score: 1996-1998
University entrance score:
1999-2002
CGPA
N
Architecture 57.29 46.62 539.74 (20.82)
214.54 (5.43)
2.56 (0.46)
583
Arts and Sciences 52.01 36.12 503.06 (27.56)
203.61 (11.27)
2.53 (0.70)
1,692
Economic and Administrative Sc.
53.22 40.57 509.00 (12.22)
201.35 (4.36)
2.73 (0.63)
1,567
Education 59.08 64.23 503.69 (16.24)
200.10 (11.44)
2.61 (0.62)
1,168
Engineering 21.11 23.37 544.36 (27.66)
217.57 (6.62)
2.51 (0.66)
5,333
All 37.36 33.99 528.95 (31.23)
210.60 (11.11)
2.56 (0.65)
10,343
Note: Standard deviations are given in parentheses. Table 3 Standardized university entrance scores for male and female students Standardized entrance
scores of Number of students
Schools
male
students
female
students
p-value for the difference
in average entrance scores
Male
Female
Architecture 2.567 (0.214)
2.271 (0.185)
0.297 249 334
Arts and Sciences
4.241 (0.216)
2.391 (0.134)
0.000 812 880
Economic and Admin. Sciences
1.611 (0.082)
1.505 (0.070)
0.325 733 834
Education 2.806 (0.237)
1.947 (0.143)
0.001 478 690
Engineering 2.222 (0.053)
1.807 (0.085)
0.000 4,207 1,126
All 2.462 (0.050)
1.940 (0.052)
0.000 6,479 3,864
Note: Standard errors are given in parentheses.

29
Table 4 OLS estimates for the determinants of CGPA for male students by year First-year
students Second-year
students Third-year students
Fourth-year students
Age -0.068*** -0.073*** -0.038** -0.048*** [0.025] [0.017] [0.018] [0.014] High School Type (ref. Other) Anatolian 0.287*** -0.106 -0.137* 0.115** [0.102] [0.076] [0.075] [0.050] Sciences 0.248** -0.108 -0.037 0.162** [0.112] [0.084] [0.085] [0.065] Regular high school -0.022 -0.207*** -0.259*** -0.017 [0.110] [0.076] [0.073] [0.047] Private sciences -0.088 -0.268*** -0.153* -0.001 [0.135] [0.094] [0.093] [0.069] Private regular -0.083 -0.379*** -0.256** 0.085 [0.151] [0.114] [0.128] [0.094] Private language school 0.216** -0.136* -0.158** 0.133** [0.105] [0.077] [0.080] [0.060] Std. university entrance score 0.038*** 0.019*** 0.001 0.003 [0.009] [0.006] [0.004] [0.002] Preference for department -0.044*** -0.018*** -0.022*** -0.024*** [0.007] [0.004] [0.004] [0.003] Year of entry to university 0.101 0.293*** 0.278*** 0.248*** [0.065] [0.033] [0.030] [0.020] Prep school: Yes 0.209** -0.148** 0.164*** 0.291*** [0.082] [0.064] [0.058] [0.047] Semesters in prep school -0.250*** 0.198*** 0.073*** -0.021 [0.053] [0.030] [0.027] [0.019] Schools (ref. Engineering) Architecture 0.437*** 0.203*** 0.109 -0.013 [0.114] [0.064] [0.073] [0.058] Arts and Sciences 0.05 0.279*** 0.338*** 0.053 [0.076] [0.052] [0.054] [0.044] Economic and Administrative Sciences 0.343*** 0.294*** 0.347*** 0.045 [0.087] [0.056] [0.056] [0.050] Education 0.093 -0.089 0.181** 0.219*** [0.108] [0.075] [0.079] [0.057]
-1.171*** -1.065*** -0.900*** -0.126 Prop. of female students in department [0.240] [0.169] [0.170] [0.148]
0.803*** 0.651*** 0.662*** 0.213* Prop. of female faculty in department [0.198] [0.135] [0.144] [0.125]
Resides in dormitory 0.211*** 0.083*** 0.090*** 0.012 [0.050] [0.032] [0.031] [0.028] Ankara 0.201** 0.075 0.244*** 0.111*** [0.081] [0.053] [0.048] [0.041] Constant 2.823*** 2.537*** 2.264*** 3.007*** [0.795] [0.485] [0.501] [0.390] No. of observations 1652 1631 1452 1744 R-squared 0.217 0.218 0.227 0.254 Notes: ***significant at 1%, **significant at 5%, *significant at 10%. Huber-White standard errors reported. Regions indicating permanent place of residence are omitted for brevity.

30
Table 5 OLS estimates for the determinants of CGPA for female students by year First-year
students Second-year
students Third-year students
Fourth-year students
Age -0.057** -0.027 -0.022 -0.012 [0.027] [0.026] [0.026] [0.022] High School Type (ref. Other) Anatolian 0.121 0.082 0.066 0.059 [0.090] [0.082] [0.071] [0.072] Sciences 0.395*** 0.235** 0.158* 0.243** [0.119] [0.102] [0.091] [0.095] Regular high school 0.003 0.038 -0.019 0.03 [0.137] [0.088] [0.075] [0.070] Private sciences 0.455** 0.055 0.19 0.035 [0.182] [0.134] [0.125] [0.160] Private regular -0.02 0.297** -0.11 -0.326* [0.162] [0.140] [0.166] [0.176] Private language school 0.115 0.118 0.131* 0.108 [0.093] [0.083] [0.073] [0.084] Std. university entrance score 0.028*** 0.007 0.012* 0.001 [0.010] [0.008] [0.006] [0.003] Preference for department -0.033*** -0.026*** -0.014** -0.012** [0.007] [0.006] [0.005] [0.005] Year of entry to university 0.062 0.380*** 0.339*** 0.343*** [0.088] [0.079] [0.067] [0.038] Prep school: Yes 0.615*** -0.208 0.186* 0.359*** [0.107] [0.147] [0.101] [0.058] Semesters in prep school -0.534*** 0.273*** 0.06 -0.019 [0.058] [0.072] [0.060] [0.025] Schools (ref. Engineering) Architecture 0.135 -0.085 -0.055 -0.115* [0.083] [0.065] [0.068] [0.063] Arts and Sciences 0.201*** 0.08 0.148** 0.067 [0.076] [0.063] [0.064] [0.067] Economic and Administrative Sciences 0.365*** 0.181*** 0.283*** 0.064 [0.077] [0.062] [0.060] [0.062] Education 0.404*** 0.045 0.137 0.083 [0.102] [0.094] [0.086] [0.073]
-0.033 0.009 0.047 -0.1 Prop. of female students in department [0.231] [0.172] [0.176] [0.200] 0.159 0.436*** 0.333** 0.449** Prop. of female faculty in department [0.220] [0.163] [0.165] [0.179]
Resides in dormitory 0.011 -0.046 -0.008 0.043 [0.065] [0.044] [0.041] [0.038] Ankara 0.076 0.056 0.148** 0.188*** [0.088] [0.071] [0.063] [0.065] Constant 3.165*** 0.511 1.284* 1.546*** [0.947] [0.845] [0.736] [0.596] No. of observations 1093 989 938 844 R-squared 0.187 0.143 0.167 0.217 Notes: ***significant at 1%, **significant at 5%, *significant at 10%. Huber-White standard errors reported. Regions indicating permanent place of residence are omitted for brevity.

31
Table A1 Standardized entrance scores for male and female students by departments Standardized entrance scores of Number of students Departments
male
students
female
students
p-value for the difference
in average entrance scores
Male
Female
Architecture Architecture 3.11 (0.34) 2.31 (0.28) 0.075 109 158 City and Regional Planning 2.47 (0.41) 2.88 (0.34) 0.433 81 105 Industrial Design 1.69 (0.24) 1.29 (0.30) 0.308 59 71 Arts and Sciences Biology 5.46 (1.08) 3.17 (0.62) 0.049 42 73 Molecular Bio. and Genetics 2.24 (0.79) 1.52 (0.41) 0.407 40 46 Chemistry 4.30 (0.56) 2.65 (0.35) 0.012 110 115 Mathematics 2.84 (0.29) 1.62 (0.30) 0.005 199 125 History 1.63 (0.39) 2.21 (0.48) 0.357 49 58 Philosophy 5.11 (0.14) 2.78 (0.43) 0.032 40 59 Physics 6.99 (0.56) 3.74 (0.63) 0.003 189 57 Psychology 2.28 (1.04) 2.45 (0.29) 0.836 23 136 Sociology 6.74 (1.68) 2.55 (0.46) 0.001 32 130 Statistics 2.43 (0.41) 1.56 (0.24) 0.071 88 81 Econ. and Admin. Sciences Business Administration 1.33 (0.13) 1.62 (0.16) 0.140 229 196 Economics 1.38 (0.13) 1.17 (0.13) 0.251 217 230 International Relations 1.78 (0.19) 1.78 (0.19) 0.981 97 152 Public Administration 2.13 (0.21) 1.55 (0.10) 0.007 190 256 Education Chemistry Education 3.16 (0.82) 2.90 (0.64) 0.801 57 59 Computer & Teaching Tech. 4.74 (0.46) 4.56 (0.71) 0.844 141 49 Foreign Languages 0.73 (0.35) 0.99 (0.17) 0.466 109 320 Math Education 1.84 (0.30) 2.74 (0.36) 0.085 43 73 Physics Education 3.38 (0.79) 2.49 (0.88) 0.468 77 46 Sciences Education 1.39 (0.17) 1.25 (0.22) 0.633 50 77 Engineering Aerospace Engineering 1.57 (0.19) 2.11 (0.86) 0.351 169 42 Chemical Engineering 2.52 (0.24) 1.94 (0.25) 0.373 242 171 Civil Engineering 2.70 (0.13) 2.18 (0.34) 0.192 756 88 Computer Engineering 1.25 (0.13) 1.07 (0.14) 0.483 355 104 Electrical Engineering 1.63 (0.09) 1.17 (0.16) 0.058 758 105 Environmental Engineering 2.53 (0.36) 2.15 (0.30) 0.426 114 102 Food Engineering 1.56 (0.22) 1.73 (0.20) 0.556 121 118 Geological Engineering 3.98 (0.40) 2.35 (0.31) 0.012 123 55 Industrial Engineering 1.61 (0.13) 1.67 (0.22) 0.811 319 131 Mechanical Engineering 2.26 (0.13) 1.81 (0.22) 0.269 769 84 Metallurgical Engineering 3.29 (0.35) 2.00 (0.32) 0.056 233 66 Mine Engineering 4.34 (0.39) 2.83 (0.88) 0.079 114 35 Petroleum Engineering 2.53 (0.33) 1.43 (0.69) 0.186 134 25 Note 1: Standard errors are given in parentheses. Note 2: Average entrance scores for the Department of Early Childhood Education under the School of Education are not reported since there is only one male student in the department.

32
Table A2 OLS estimates for the determinants of CGPA by year First-year
students Second-year
students Third-year students
Fourth-year students
Age -0.066*** -0.063*** -0.034** -0.038*** [0.020] [0.014] [0.015] [0.012] Female 0.119*** 0.134*** 0.128*** 0.132*** [0.033] [0.024] [0.025] [0.021] High School Type (ref. Other) Anatolian 0.268*** 0.012 -0.027 0.106*** [0.068] [0.057] [0.052] [0.040] Sciences 0.342*** 0.06 0.066 0.193*** [0.080] [0.065] [0.062] [0.054] Regular high school 0.014 -0.07 -0.137*** 0.005 [0.081] [0.058] [0.052] [0.038] Private sciences 0.077 -0.105 -0.016 0.011 [0.107] [0.076] [0.071] [0.062] Private regular 0.029 -0.109 -0.173* 0.031 [0.108] [0.095] [0.100] [0.085] Private language school 0.224*** 0.009 -0.012 0.135*** [0.070] [0.058] [0.055] [0.048] University entrance score 0.033*** 0.015*** 0.004 0.002 [0.007] [0.005] [0.003] [0.002] Preference rank for department -0.043*** -0.022*** -0.021*** -0.021*** [0.005] [0.004] [0.003] [0.003] Year of entry to university 0.095* 0.313*** 0.304*** 0.268*** [0.052] [0.031] [0.026] [0.018] Prep school: Yes 0.362*** -0.155*** 0.169*** 0.314*** [0.067] [0.057] [0.051] [0.037] Semesters in prep school -0.343*** 0.219*** 0.074*** -0.023 [0.041] [0.029] [0.026] [0.015] Schools (ref. Engineering) Architecture 0.205*** 0.022 0.025 -0.061 [0.066] [0.045] [0.048] [0.041] Arts and Sciences 0.090* 0.176*** 0.259*** 0.067* [0.054] [0.040] [0.040] [0.037] Economic and Administrative Sciences 0.305*** 0.211*** 0.311*** 0.045 [0.057] [0.041] [0.039] [0.037] Education 0.263*** 0.018 0.192*** 0.164*** [0.074] [0.060] [0.058] [0.044]
-0.568*** -0.527*** -0.472*** -0.112 Prop. of female students in department [0.163] [0.121] [0.118] [0.115]
0.456*** 0.477*** 0.480*** 0.277*** Prop. of female faculty in department [0.146] [0.103] [0.104] [0.100]
Resides in dormitory 0.159*** 0.04 0.054** 0.019 [0.039] [0.026] [0.025] [0.022] Ankara 0.182*** 0.076* 0.208*** 0.133*** [0.060] [0.043] [0.038] [0.034] Constant 2.750*** 1.964*** 1.868*** 2.610*** [0.617] [0.424] [0.398] [0.333] No. of observations 2745 2620 2390 2588 R-squared 0.196 0.197 0.23 0.27 Notes: ***significant at 1%, **significant at 5%, *significant at 10%. Huber-White standard errors reported. Regions indicating permanent place of residence are omitted for brevity.

33
dens
ity
Figure 1: Distribution of CGPA by yearCGPA
First-years Second-years Third-years Fourth-years
0 1 2 3 4
0
.15
.3
.45
.6
.75
cdf
Figure 2A: Cumulative distr.of male and female entrance scores Ientrance scores
female scores male scores
178.238 233.536
0
.2
.4
.6
.8
1

34
cdf
Figure 2B: Cumulative distr.of male and female entrance scores IIentrance scores
female scores male scores
453.145 647.032
0
.2
.4
.6
.8
1
Top Related
