


Languages
Pages
Legal


Statins Market to 2018 Weak Product Pipeline and Shift of Focus towards Combination Therapies will Lead to Erosion of Brand Share

GBI Research Report Guidance
© GBI Research. This is a licensed product and is not to be photocopied GBIHC180MR / Published JAN 2013 Page 2
GBI Research Report Guidance
Chapter three is concerned with the global market overview and estimates of the market size for the global statins market, with a revenue forecast up to 2018. This chapter also deals with the share of generics in the global statins market, the annual cost of treatment, and provides insights on the major revenue generating drugs.
The next chapter is on the statins market in the US, and includes revenue analysis of the US statins market. The chapter also provides information on the annual cost of therapy with statins and the treatment usage pattern for dyslipidemia in the US.
The next chapter is on the statins market in the top five countries of Europe (France, Italy, Germany, Spain, and the UK), and includes revenue analysis of the statins market in these countries. This chapter also provides information on the annual cost of therapy with statins and the treatment usage pattern for dyslipidemia in the top five countries of Europe.
The next chapter is on the statins market in Japan, and includes revenue analysis of the Japanese statins market. This chapter also provides information on the annual cost of therapy with statins and the treatment usage pattern for dyslipidemia in Japan.
The next chapter provides a detailed product pipeline analysis of the statins that are in various stages of clinical development.
Following the product pipeline analysis, the next chapter is on the competitive landscape and gives details of the top companies in the global statins market.
The last chapter is on Mergers and Acquisitions (M&As), and includes analysis of the recent M&A activity and licensing deals in the global statins market.

© GBI Research. This is a licensed product and is not to be photocopied GBIHC180MR / Published JAN 2013
Page 3
Statins Market to 2018 - Executive Summary
Statins Market to 2018 - Executive Summary
Statins (HMG-CoA reductase inhibitors), the first line of pharmacotherapy for the treatment of dyslipidemia, have dominated the dyslipidemia therapeutics market for the past few decades. However, GBI Research estimates that the market, valued at $XX billion in 2011, is set to experience a significant decline due to the increasing availability of generics, the implementation of cost-containment policies, rising generic usage, weak product pipelines, and a shift of focus towards the use of combination therapies and non-statins.
According to GBI Research’s analysis, the generic share in the statins market is expected to grow significantly from XX% in 2011 to XX% in 2018. The patent expiry of Pfizer’s blockbuster drug Lipitor (atorvastatin calcium) in late 2011, followed by the immediate launch of generics, intensified the competition in the statins market. Furthermore, the growing generic usage and highly competitive statins market will limit the commercial opportunities for pipeline molecules during the forecast period.
Generic Availability of the Leading Brands will Decrease the Global Statins Market in the Forecast Period
The global statins market, valued at $XX billion in 2011, is forecast to witness a significant decline, at a negative Compound Annual Growth Rate (CAGR) of XX%, to reach $XX billion by 2018. This is due to the availability of generic versions of branded statins in the future. The global statins market declined at a negative CAGR of XX%, from $XX billion in 2004 to $XX billion in 2011. The decline in the statins market in the historic period was mainly attributed to the patent expiries of Zocor (simvastatin) and Pravachol (pravastatin), followed by severe generic erosion.
Statins Market, Global, Revenue ($bn), 2004, 2011, 2018
Series1, 2011, 20.5
Series1, 2018, 12.2
2004 2011 2018
Rev
enue
($bn
)
(XX%)
(XX%)
Source: GBI Research
The global statins market is forecast to decline at a negative CAGR of XX% over the next seven years, to reach $XX billion by 2018, due to the availability of generic versions of branded statins in the future.
Pfizer’s blockbuster product, Lipitor (atorvastatin calcium), lost market exclusivity in November 2011, which was followed by the immediate launch of generics from Ranbaxy Laboratories (Ranbaxy) and Watson Pharmaceutical Inc. (Watson). AstraZeneca’s blockbuster statin Crestor (rosuvastatin calcium) is expected to lose market exclusivity in the US in 2016 and in 2017 in most of the European countries.
The patent expiries of these marketed drugs followed by severe generic erosion will lead to a decline in the global statins market in the forecast period.
Statins market was valued at $XX billion in 2011

© GBI Research. This is a licensed product and is not to be photocopied GBIHC180MR / Published JAN 2013
Page 5
Table of Contents
1 Table of Contents
1 Table of Contents ................................................................................................................................. 5 1.1 List of Tables ............................................................................................................................. 7 1.2 List of Figures............................................................................................................................ 8
2 Statins Market to 2018 - Introduction ................................................................................................... 9 3 Statins Market to 2018 - Global Statins Market ....................................................................................10
3.1 Introduction ............................................................................................................................10 3.2 Global Market Forecast ............................................................................................................11
3.2.1 Branded and Generic Market Share ..................................................................................13 3.3 Annual Cost of Treatment ........................................................................................................14 3.4 Treatment Usage Patterns .......................................................................................................15
3.4.1 Disease Population ...........................................................................................................16 3.4.2 Treatment Seeking Population ..........................................................................................16 3.4.3 Diagnosed Population ......................................................................................................16 3.4.4 Prescription Population ....................................................................................................16
3.5 Drivers and Restraints to the Statins Market .............................................................................17 3.5.1 Drivers to the Statins Market ............................................................................................17 3.5.2 Restraints to the Statins Market .......................................................................................18
3.6 Major Marketed Products ........................................................................................................20 3.6.1 Crestor (rosuvastatin calcium) ..........................................................................................20 3.6.2 Lipitor (atorvastatin calcium) ............................................................................................21 3.6.3 Vytorin (ezetimibe/simvastatin) ........................................................................................22 3.6.4 Zocor (simvastatin)...........................................................................................................23 3.6.5 Livalo (pitavastatin calcium) .............................................................................................23 3.6.6 Lescol XL (fluvastatin sodium) ...........................................................................................24 3.6.7 Pravachol (pravastatin sodium) ........................................................................................25
4 Statins Market to 2018 - Statins Market in the US ................................................................................26 4.1 Market ....................................................................................................................................26 4.2 Annual Cost of Therapy (ACT) ...................................................................................................28 4.3 Treatment Usage Pattern .........................................................................................................29
4.3.1 Diseased Population .........................................................................................................30 4.3.2 Treatment Seeking Population ..........................................................................................30 4.3.3 Diagnosed Population ......................................................................................................30 4.3.4 Patients on Statins Therapy ..............................................................................................30
5 Statins Market to 2018 - Statins Market in the Top Five Countries of Europe ........................................31 5.1 Market ....................................................................................................................................31 5.2 Annual Cost of Therapy ............................................................................................................34 5.3 Treatment Usage Pattern .........................................................................................................35
5.3.1 Diseased Population .........................................................................................................36 5.3.2 Treatment Seeking Population ..........................................................................................36 5.3.3 Diagnosed Population ......................................................................................................36 5.3.4 Patients on Statins Therapy ..............................................................................................36
6 Statins Market to 2018 - Statins Market in Japan .................................................................................37 6.1 Market ....................................................................................................................................37 6.2 Annual Cost of Therapy ............................................................................................................39 6.3 Treatment Usage Pattern .........................................................................................................41
6.3.1 Diseased Population .........................................................................................................42 6.3.2 Treatment Seeking Population ..........................................................................................42 6.3.3 Diagnosed Population ......................................................................................................42 6.3.4 Patients on Statins Therapy ..............................................................................................42

© GBI Research. This is a licensed product and is not to be photocopied GBIHC180MR / Published JAN 2013
Page 6
Table of Contents
7 Statins Market to 2018 - Product Pipeline Anlaysis ...............................................................................43 7.1 Introduction ............................................................................................................................43 7.2 Pipeline Analysis ......................................................................................................................43
8 Statins Market to 2018 - Competitive Landscape .................................................................................44 8.1 Pfizer Inc..................................................................................................................................45
8.1.1 Company Overview ..........................................................................................................45 8.1.2 SWOT Analysis .................................................................................................................45
8.2 AstraZeneca PLC (AstraZeneca) ................................................................................................46 8.2.1 Company Overview ..........................................................................................................46 8.2.2 SWOT Analysis .................................................................................................................46
8.3 Merck & Co Inc ........................................................................................................................47 8.3.1 Company Overview ..........................................................................................................47 8.3.2 SWOT Analysis .................................................................................................................47
8.4 Novartis AG (Novartis) .............................................................................................................48 8.4.1 Company Overview ..........................................................................................................48 8.4.2 SWOT Analysis .................................................................................................................48
9 Statins Market to 2018 - Strategic Consolidation ..................................................................................49 9.1 Merger and Acquisition (M&A) Deals........................................................................................49 9.2 Licensing Deals ........................................................................................................................50
9.2.1 Licensing Deals by Geography...........................................................................................50 9.3 Co-development Deals .............................................................................................................52
10 Statins Market to 2018 - Appendix ......................................................................................................53 10.1 Market Definitions ...................................................................................................................53 10.2 Abbreviations ..........................................................................................................................53 10.3 Bibliography ............................................................................................................................56 10.4 Research Methodology ............................................................................................................57
10.4.1 Coverage .........................................................................................................................57 10.4.2 Secondary Research .........................................................................................................57 10.4.3 Primary Research .............................................................................................................58 10.4.4 Therapeutic Landscape .....................................................................................................58 10.4.5 Geographical Landscape ..................................................................................................61 10.4.6 Pipeline Analysis...............................................................................................................61 10.4.7 Competitive Landscape.....................................................................................................61
10.5 Expert Panel Validation ............................................................................................................61 10.6 Contact Us ...............................................................................................................................61 10.7 Disclaimer................................................................................................................................61
© GBI Research. This is a licensed product and is not to be photocopied GBIHC180MR / Published JAN 2013
Page 7
Table of Contents
1.1 List of Tables
Table 1: Statins Market, Global, Revenue ($bn), 2004-2011 ..................................................................11 Table 2: Statins Market, Global, Revenue Forecast ($bn), 2011 -2018 ....................................................11 Table 3: Statins Market, Global, ACT ($), 2004-2011 ..............................................................................14 Table 4: Statins Market, Global, ACT ($), 2011-2018 ..............................................................................14 Table 5: Statins Market, Global, Treatment Usage Patterns (million), 2004-2011 ...................................15 Table 6: Statins Market, Global, Treatment Usage Patterns (million), 2011-2018 ...................................15 Table 7: Statins Market, the US, Revenue ($bn), 2004-2011 ..................................................................26 Table 8: Statins Market, the US, Revenue Forecast ($bn), 2011-2018 ....................................................26 Table 9: Statins Market, the US, ACT ($), 2004-2011 .............................................................................28 Table 10: Statins Market, the US, ACT ($), 2011-2018 .............................................................................28 Table 11: Statins Market, the US, Treatment Usage Pattern (million), 2004-2011 ....................................29 Table 12: Statins Market, the US, Treatment Usage Pattern (million), 2011-2018 ....................................29 Table 13: Statins Market, Top Five Countries of Europe, Revenue ($bn), 2004-2011 ................................32 Table 14: Statins Market, Top Five Countries of Europe, Revenue Forecasts ($bn), 2011-2018 .................32 Table 15: Statins Market, Top Five Countries of Europe, ACT ($), 2004-2011............................................34 Table 16: Statins Market, Top Five Countries of Europe, ACT ($), 2011-2018............................................34 Table 17: Statins Market, Top Five Countries of Europe, Treatment Usage Pattern (million), 2004-2011...35 Table 18: Statins Market, Top Five Countries of Europe, Treatment Usage Pattern (million), 2011-2018...35 Table 19: Statins Market, Japan, Revenue ($bn), 2004-2011....................................................................37 Table 20: Statins Market, Japan, Revenue Forecast ($bn), 2011-2018 ......................................................37 Table 21: Statins Market, Japan, ACT ($), 2004-2011 ...............................................................................39 Table 22: Statins Market, Japan, ACT ($), 2011-2018 ...............................................................................39 Table 23: Statins Market, Japan, Treatment Usage Pattern (million), 2004-2011 ......................................41 Table 24: Statins Market, Japan, Treatment Usage Pattern (million), 2011-2018 ......................................41 Table 25: Statins Market, Global, Product Pipeline, 2012 ........................................................................43 Table 26: Statins Market, M&A Deals ($m), 2008-2011 ...........................................................................49 Table 27: Statins Market, Licensing Deals, 2005-2011 .............................................................................50 Table 28: Statins Market, Co-Development Deals, 2005-2008 .................................................................52

© GBI Research. This is a licensed product and is not to be photocopied GBIHC180MR / Published JAN 2013
Page 8
Table of Contents
1.2 List of Figures
Figure 1: Statins Market, Global, Revenue ($bn), 2004-2018 ..................................................................11 Figure 2: Statins Market, Global, Generic and Branded Market Share (%), 2011 and 2018 .......................13 Figure 3: Statins Market, Global, ACT ($), 2004-2018 ..............................................................................14 Figure 4: Statins Market, Global, Treatment Usage Patterns (million), 2004-2018 ...................................15 Figure 5: Statins Market, Global, Drivers and Barriers, 2011 ...................................................................17 Figure 6: Statins Market, the US, Revenue ($bn), 2004 -2018 .................................................................26 Figure 7: Statins Market, the US, ACT ($), 2004-2018 .............................................................................28 Figure 8: Statins Market, the US, Treatment Usage Pattern (million), 2004-2018 ....................................29 Figure 9: Statins Market, Top Five Countries of Europe, Revenue ($bn), 2004-2018 ................................32 Figure 10: Statins Market, Top Five Countries of Europe, ACT ($), 2004-2018............................................34 Figure 11: Statins Market, Top Five Countries of Europe, Treatment Usage Pattern (million), 2004-2018 ..35 Figure 12: Statins Market, Japan, Revenue ($bn), 2004-2018....................................................................37 Figure 13: Statins Market, Japan, ACT ($), 2004-2018 ...............................................................................39 Figure 14: Statins Market, Japan, Treatment Usage Pattern (million), 2004-2018 ......................................41 Figure 15: Statins Market, Global, Top Companies’ Market Share (%), 2011 ..............................................44 Figure 16: Statins Market, Pfizer Inc., SWOT Analysis, 2011 ......................................................................45 Figure 17: Statins Market, AstraZeneca, SWOT Analysis, 2011 ..................................................................46 Figure 18: Statins Market, Merck & Co. Inc., SWOT Analysis, 2011 ............................................................47 Figure 19: Statins Market, Novartis, SWOT Analysis, 2011 ........................................................................48 Figure 20: Statins Market, Strategic Consolidation, 2005-2011 .................................................................49 Figure 21: GBI Research Market Forecasting Model .................................................................................60

© GBI Research. This is a licensed product and is not to be photocopied GBIHC180MR / Published JAN 2013
Page 9
Statins Market to 2018 - Introduction
2 Statins Market to 2018 - Introduction
The National Cholesterol Education Program (NCEP) and European Society of Cardiology/European Atherosclerosis Society (ESC/EAS) guidelines recommend the use of statins as the first choice of pharmacotherapy for the treatment of dyslipidemia.
Statins (HMG-CoA reductase inhibitors) are a class of medicines that lower a patient’s cholesterol level by inhibiting 3-hydroxy-3-methyl-glutaryl-CoA reductase (HMG-CoA reductase) - a rate-limiting enzyme in the synthesis of cholesterol in the liver. Increased levels of cholesterol are associated with dyslipidemia and various other cardiac complications.
Statins have dominated the dyslipidemia therapeutics market. Pfizer’s blockbuster drug Lipitor (atorvastatin calcium) generated revenues of $XX billion in 2011, and have dominated the statins market for a decade.
Crestor (rosuvastatin calcium) , from AstraZeneca PLC (AstraZeneca), generated $XX billion worth of sales in 2011 and became the XX largest revenue generating drug in the statins market. Other marketed statins includes Lescol (fluvastatin), Mevacor (lovastatin), Livalo (pitavastatin), Pravachol (pravastatin), Zocor (simvastatin) and combination products such as Vytorin (ezetimibe/simvastatin) and Simcor (simvastatin niacin extended release) and others.
The competition in the global statins market was increased with the availability of generics, following the patent expiries of Zocor and Pravachol in 2006, and Lipitor in late 2011. The competition is expected to intensify in the forecast period with the loss of market exclusivity for Lescol, Vytorin and Crestor, followed by the immediate launch of generics.
Statins have dominated dyslipidemia therapeutics market
© GBI Research. This is a licensed product and is not to be photocopied GBIHC180MR / Published JAN 2013
Page 14
Statins Market to 2018 - Global Statins Market
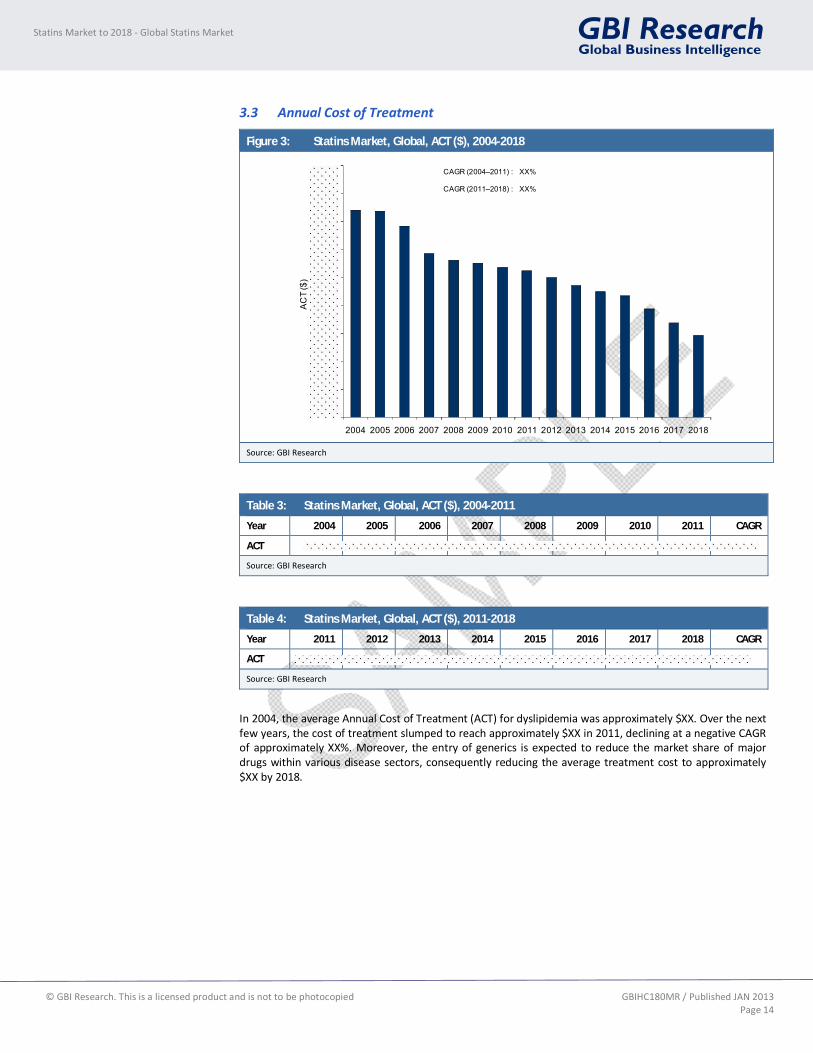
3.3 Annual Cost of Treatment
Figure 3: Statins Market, Global, ACT ($), 2004-2018
2004 2005 2006 2007 2008 2009 2010 2011 2012 2013 2014 2015 2016 2017 2018
AC
T ($
)
CAGR (2004–2011) : XX%
CAGR (2011–2018) : XX%
Source: GBI Research
Table 3: Statins Market, Global, ACT ($), 2004-2011
Year 2004 2005 2006 2007 2008 2009 2010 2011 CAGR
ACT
Source: GBI Research
Table 4: Statins Market, Global, ACT ($), 2011-2018
Year 2011 2012 2013 2014 2015 2016 2017 2018 CAGR
ACT
Source: GBI Research
In 2004, the average Annual Cost of Treatment (ACT) for dyslipidemia was approximately $XX. Over the next few years, the cost of treatment slumped to reach approximately $XX in 2011, declining at a negative CAGR of approximately XX%. Moreover, the entry of generics is expected to reduce the market share of major drugs within various disease sectors, consequently reducing the average treatment cost to approximately $XX by 2018.

© GBI Research. This is a licensed product and is not to be photocopied GBIHC180MR / Published JAN 2013
Page 44
Statins Market to 2018 - Competitive Landscape
8 Statins Market to 2018 - Competitive Landscape
The global statins market is consolidated, as a small number of players hold a large share of the statins market. The global statins market in 2011 was dominated by Pfizer with its flagship blockbuster product Lipitor. In 2011, Lipitor generated revenues of $XX billion and secured the largest market share (XX%) for Pfizer. AstraZeneca, — with the rising revenues of Crestor each year — secured XX place in the global statins market in 2011. AstraZeneca accounted for XX% of the market share in the global statins market in 2011. Pfizer and AstraZeneca collectively contributed approximately XX% share to the global statins market in 2011. Merck accounted for a XX% share with its statin products Zocor and Vytorin, followed by Novartis with a share of XX% in the global statins market in 2011.
Figure 15: Statins Market, Global, Top Companies’ Market Share (%), 2011
Pfizer
AstraZeneca Merck
Novartis
Others
Source: GBI Research
Each year the market share of the leading players in the statins market has changed due to changing dynamics in the global statins market from 2006 onwards, following the loss of market exclusivity of Zocor and Pravachol and immediate launches of generics. The sales and market share of each drug were notably affected following the surge of many generics and publication of results of further clinical studies such as JUPITER for Crestor and ENHANCE study for Vytorin. The sales of Vytorin were negatively affected with the publication of the ENHNACE study, and drug’s sales declined continuously post 2008.
The prescription share and the revenues of Crestor grew each year after the successful completion of the JUPITER study in 2008 and the launch of Crestor in Germany and Spain. The market share of AstraZeneca grew continuously over the last few years with the launch of drugs in almost all of the markets.
Pfizer’s market share declined over the last few years due to intense competition from generic versions of rival drugs and the rising prescription share of Crestor. With the loss of patent protection for Lipitor followed by immediate launches generic versions of atorvastatin, Pfizer’s revenue from Lipitor and so market share is anticipated to decline drastically during the forecast period.
Merck competitive share in the statins market declined each year with the patent expiry of Zocor, and failure of the ENHANCE study for Vytorin in 2008. Merck’s market share in the global statin market is expected to decline during the forecast period due to intense competition from generic versions of rival drugs (including the recently launched generic version of Lipitor), and the recent safety alert issued by the US FDA over the use of simvastatin (XXmg).
The patent expiry of Lipitor in November 2011 in the US, followed by the anticipated severe price erosion due to entry of multiple generic players in the market, likely to affect the market share of leading players, especially of Pfizer, during the forecast period.
Pfizer and AstraZeneca collectively contributed close to XX% share to the global statins market in 2010

© GBI Research. This is a licensed product and is not to be photocopied GBIHC180MR / Published JAN 2013
Page 53
Statins Market to 2018 - Appendix
10 Statins Market to 2018 - Appendix
10.1 Market Definitions
The global statins market includes the top seven markets: the US, the UK, Germany, France, Spain, Italy and Japan.
Prevalence Population: The prevalence population is the estimated number of people at any given point of time who are affected by dyslipidemia.
Treatment Seeking Rate and Population: The treatment seeking rate is the percentage of the prevalence population that seeks treatment for dyslipidemia. The treatment seeking population is the number of people seeking treatment for dyslipidemia.
Diagnosis Rate and Population: The diagnosis rate is the percentage of the treatment seeking population that is diagnosed with dyslipidemia. The diagnosis population refers to the number of people that are diagnosed with dyslipidemia.
Prescription Rate and Population: The prescription rate is the percentage of the diagnosed population that is prescribed statins medication for dyslipidemia. The prescription population refers to the number of people on statins.
10.2 Abbreviations
ACP - American College of Physicians
ACT - Annual Cost of Therapy
ACT - Annual Cost of Therapy
AHA - American Heart Association
AHA - American Heart Association
ANDA - Abbreviated New Drug Application
ANDA - Abbreviated New Drug Application
ATP III - Adult Treatment Panel III
ATP III - Adult Treatment Panel III
BMS - Bristol-Myers Squibb
BMS - Bristol-Myers Squibb
CAGR - Compound Annual Growth Rate
CAGR - Compound Annual Growth Rate
CETP - Cholesteryl Ester Transfer Protein
CETP - Cholesteryl Ester Transfer Protein
CHD - Coronary Heart Disease
CHD - Coronary Heart Disease
COPD - Chronic Obstructive Pulmonary Disorder
COPD - Chronic Obstructive Pulmonary Disorder
CRP - C Reactive Protein
CRP - C Reactive Protein
CVD - Cardiovascular Disorder
CVD - Cardiovascular Disorder
DMA - Development and Marketing Agreement

© GBI Research. This is a licensed product and is not to be photocopied GBIHC180MR / Published JAN 2013
Page 54
Statins Market to 2018 - Appendix
EAS - European Atherosclerosis Society
EAS - European Atherosclerosis Society
EMA - European Medicines Agency
EMA - European Medicines Agency
EMDA - Endocrinologic and Metabolic Drugs Advisory Committee
EMDA - Endocrinologic and Metabolic Drugs Advisory Committee
ENHANCE - Ezetimibe and Simvastatin in Hypercholesterolemia Enhances Atherosclerosis Regression
EPO - European Patent Office
EPO - European Patent Office
ESC - European Society of Cardiology
ESC - European Society of Cardiology
EU - European Union
EU - European Union
FDA - Food and Drug Administration
FDA - Food and Drug Administration
HDL - High-Density Lipoprotein Cholesterol
HDL - High-Density Lipoprotein Cholesterol
HeFh - Heterozygous Familial Hypercholesterolemia
HeFh - Heterozygous Familial Hypercholesterolemia
HMG-CoA reductase - 3-hydroxy-3-methyl-glutaryl-CoA reductase
HMG-CoA reductase - 3-hydroxy-3-methyl-glutaryl-CoA reductase
HPS - Heart Protection Study
HPS - Heart Protection Study
JAPIC - Japan Pharmaceutical Information Center
JAPIC - Japan Pharmaceutical Information Center
JUPITER - Justification for the Use of Statins in Primary Prevention: An Intervention Trial Evaluating Rosuvastatin Study of Coronary Atheroma by InTravascular Ultrasound: Effect of Rosuvastatin Versus AtorvastatiN
LDL - Low-density Lipoprotein Cholesterol
LDL - Low-density Lipoprotein Cholesterol
M&A - Mergers and Acquisitions
M&A - Mergers and Acquisitions
MA - Market Authorization
MA - Market Authorization
mg/dL - milligram per deciliter
MHLW - Ministry of Health, Labour and Welfare
MHLW - Ministry of Health, Labour and Welfare

© GBI Research. This is a licensed product and is not to be photocopied GBIHC180MR / Published JAN 2013
Page 55
Statins Market to 2018 - Appendix
MHRA - Medicines and Healthcare products Regulatory Agency
MHRA - Medicines and Healthcare products Regulatory Agency
MI - Myocardial Infarction
MI - Myocardial Infarction
NCEP - National Cholesterol Education Program
NCEP - National Cholesterol Education Program
NDA - New Drug Application
NDA - New Drug Application
NEJM - New England Journal of Medicine
NEJM - New England Journal of Medicine
PMDA - Pharmaceuticals and Medical Devices Agency
PMDA - Pharmaceuticals and Medical Devices Agency
R&D - Research & Development
R&D - Research & Development
ROW - Rest of World
ROW - Rest of World
SEARCH - Study of the Effectiveness of Additional Reductions in Cholesterol and Homocysteine Apo B- apolipoprotein B
SEARCH - Study of the Effectiveness of Additional Reductions in Cholesterol and Homocysteine Apo B- apolipoprotein B
SEAS - Simvastatin and Ezetimibe in Aortic Stenosis
sNDA - Supplemental New Drug Application
sNDA - Supplemental New Drug Application
TC - Total Cholesterol
TC - Total Cholesterol
TG - Triglycerides
TG - Triglycerides
USPTO - United States Patent and Trademark Office
USPTO - United States Patent and Trademark Office

© GBI Research. This is a licensed product and is not to be photocopied GBIHC180MR / Published JAN 2013
Page 56
Statins Market to 2018 - Appendix
10.3 Bibliography
American Heart Association (2009). Heart and Stroke Statistical Update. American Heart Association; 2009:11.
AstraZeneca (2012). Annual Reports. AstraZeneca. Available From: http://www.astrazeneca.com/Investors/Annual-reports. [Accessed September date ,2012].
Chapman MJ, et. al (2004). Raising High-Density Lipoprotein Cholesterol With Reduction Of Cardiovascular Risk: The Role Of Nicotinic Acid-A Position Paper Developed By The European Consensus Panel On Hdl-C. Current Medical Research & Opinion; 20(8): 1253-1268.
Drummond M, et. al (2011). Reimbursement of Pharmaceuticals: Reference Pricing Versus Health Technology Assessment. The European Journal of Health Economics; 12:263-271.
Federal Ministry of Health (2007). Reference Price System in Germany. Federal Ministry of Health. Available from: http://ppri.goeg.at/Downloads/Presentations/07_DE_Festbetragssystem.pdf.
Federal Ministry of Health (2011). The Act on the Reform of the Market for Medicinal Products (Gesetz zur Neuordnung des Arzneimittelmarktes - AMNOG). Federal Ministry of Health. Available from: http://www.bmg.bund.de/ministerium/english-version/amnog.html [Accessed September 12, 2012].
Grundy SM, et. al (2004). Implications of Recent Clinical Trials for the National Cholesterol Education Program Adult Treatment Panel III Guidelines. Circulation - A Journal of American Heart Association; 110: 227-239.
Kopin LA, et. al (2007). In The Clinic Dyslipidemia. Annals of Internal Medicine - A Journal of American College of Physicians; ITC9 -16.
Merck & Co., Inc (2012). Annual Reports, Proxy Statements & Form 10-K. Merck & Co., Inc; Available From: http://www.merck.com/investors/financials/annual-reports/home.html. [Accessed September 15, 2012].
Novartis AG (2012). Corporate Publications. Novartis AG; Available From: http://www.novartis.com/newsroom/corporate-publications/download.shtml. [Accessed September 30, 2012].
Paul M, et al (2008). Rosuvastatin to Prevent Vascular Events in Men and Women with Elevated C-Reactive Protein. The New England Journal of Medicine; 359:2195207. Available From: http://www.nejm.org/doi/pdf/10.1056/NEJMoa0807646. [Accessed September, 2012]
Pfizer (2012), Financial Reports. Pfizer; Available From: http://www.pfizer.com/investors/financial_reports/financial_reports.jsp. [Accessed September 29,2012].
Pronova Biopharma (2008). Annual Report - 2008. Pronova Biopharma. Available from: http://www.pronova.com/getfile.php/WEB/Janne/Filarkiv/Annual%20Reports/Annual%20Report%202008.pdf.
Reiner S, et. al (2011).ESC/EAS Guidelines for The Management Of Dyslipidaemias. European Heart Journal; 32: 1769-1818.
Steinhagen-Thiesse E, et. al (2008). Dyslipidemia in primary care - prevalence, recognition, treatment and control: data from the German Metabolic and Cardiovascular Risk Project (GEMCAS). Cardiovascular Diabetology; 7:31.
Weissglas-Volkov D and Pajukanta P (2010). Genetic causes of high and low serum HDL-cholesterol. The Journal of Lipid Research; 51(8): 2032-2057.

© GBI Research. This is a licensed product and is not to be photocopied GBIHC180MR / Published JAN 2013
Page 57
Statins Market to 2018 - Appendix
10.4 Research Methodology
GBI Research’s dedicated research and analysis teams consist of experienced professionals with marketing, market research and consulting backgrounds in the medical devices industry as well as advanced statistical expertise.
GBI Research adheres to the codes of practice of the Market Research Society (www.mrs.org.uk) and the Strategic and Competitive Intelligence Professionals (www.scip.org).
All GBI Research databases are continuously updated and revised.
10.4.1 Coverage
The objective of updating GBI Research coverage is to ensure that it represents the most up to date vision of the industry possible.
Changes to the industry taxonomy are built on the basis of extensive research of company, association and competitor sources.
Company coverage is based on three key factors: market capitalization, revenues and media attention/innovation/market potential.
An exhaustive search of 56 member exchanges is conducted and companies are prioritized on the basis of their market capitalization;
The estimated revenues of all major companies, including private and governmental, are gathered and used to prioritize coverage; and
Companies which are making the news, or which are of particular interest due to their innovative approach are prioritized.
GBI Research aims to cover all major news events and deals in the medical industry, updated on a daily basis.
The coverage is further streamlined and strengthened with additional inputs from GBI Research’s expert panel (see below).
10.4.2 Secondary Research
The research process begins with exhaustive secondary research on internal and external sources being carried out to source qualitative and quantitative information relating to each market.
The secondary research sources that are typically referred to include, but are not limited to:
Company websites, annual reports, financial reports, broker reports, investor presentations and US Securities and Exchanges Commission (SEC) filings
Industry trade journals, scientific journals and other technical literature
Internal and external proprietary databases
Relevant patent and regulatory databases
National government documents, statistical databases and market reports
Procedure registries
News articles, press releases and web-casts specific to the companies operating in the market

© GBI Research. This is a licensed product and is not to be photocopied GBIHC180MR / Published JAN 2013
Page 58
Statins Market to 2018 - Appendix
10.4.3 Primary Research
GBI Research conducts hundreds of primary interviews a year with industry participants and commentators in order to validate its data and analysis. A typical research interview fulfills the following functions:
It provides first-hand information on the market size, market trends, growth trends, competitive landscape and future outlook
It helps in validating and strengthening the secondary research findings; and
It further develops the analysis team’s expertise and market understanding.
Primary research involves email interactions and telephone interviews as well as face-to-face interviews for each market, category, segment and sub-segment across geographies.
The participants who typically take part in such a process include, but are not limited to:
Industry participants: CEOs, VPs, marketing/product managers, market intelligence managers and national sales managers
Hospital stores, laboratories, pharmacies, distributors and paramedics
Outside experts: Investment bankers, valuation experts, research analysts specializing in specific medical equipment markets
Key Opinion Leaders: Physicians and surgeons specializing in different therapeutic areas corresponding to different kinds of medical equipment.
The report consists of the following four major sections:
Therapeutic Landscape
Geographic Landscape
Pipeline Analysis
Competitive Analysis
10.4.4 Therapeutic Landscape
Revenues for each indication, geography-wise, are arrived at by utilizing the GBI Research market forecasting model. The global revenue for each indication is the sum value of revenues of all seven regions.
The annual cost of therapy for each indication is arrived at by considering the cost of the drugs, dosage of the drugs and the duration of the therapy.
The generic share of the market for each indication is obtained by calculating the prescription share for generic drugs and the respective cost of treatment.
The treatment usage pattern which includes quantitative data on the diseased population, treatment-seeking population, diagnosed population and treated population for an indication, is arrived at by referring to various sources, as mentioned below.
The marketed drugs section contains an overview of the drugs, their mechanism of action, efficacy and safety issues related to the drugs. The drugs profiled in this section are chosen based on estimated revenues and their mechanism of action.
GBI Research uses the epidemiology-based treatment flow model to forecast market size for therapeutic indications.

© GBI Research. This is a licensed product and is not to be photocopied GBIHC180MR / Published JAN 2013
Page 59
Statins Market to 2018 - Appendix
10.4.4.1 Epidemiology-based Forecasting
The forecasting model used at GBI Research makes use of epidemiology data gathered from research publications and primary interviews with physicians to represent the treatment flow patterns for individual diseases and therapies. The market for any disease segment is directly proportional to the volume of units sold and the price per unit.
Sales = Volume of Units sold Price per Unit
The volume of units sold is calculated on the average dosage regimen for that disease, duration of treatment and number of patients who are prescribed drug treatment (prescription population). Prescription population is calculated as the percentage of population diagnosed with a disease (diagnosis population). Diagnosis population is the population diagnosed with a disease expressed as a percentage of the population that is seeking treatment (treatment-seeking population). Prevalence of a disease (diseased population) is the percentage of the total population who suffer from a disease/condition.
Data on treatment seeking rate, diagnosis rate and prescription rate, if unavailable from research publications, are gathered from interviews with physicians and are used to estimate the patient volumes for the disease under consideration. Therapy uptake and compliance data are fitted in the forecasting model to account for patient switching and compliance behavior.
To account for differences in patient affordability of drugs across various geographies, macroeconomic data such as inflation and GDP; and healthcare indicators such as healthcare spending, insurance coverage and average income per individual are used.
Annual cost of treatment is calculated using product purchase frequency and the average price of the therapy. Product purchase frequency is calculated from the dosage data available for the therapies and drug prices are gathered from public sources.
The epidemiology-based forecasting model uses a bottom-up methodology and it makes use of estimations in the absence of data from research publications. Such estimations may result in a final market value which is different from the actual value. To correct this ‘gap’ the forecasting model uses ‘triangulation’ with the help of base year sales data (from company annual reports, internal and external databases) and sales estimations.
Analogous Forecasting Methodology
Analogous forecasting methodology is used to account for the introduction of new products, patent expiries of branded products and subsequent introduction of generics. Historic data for new product launches and generics penetration are used to arrive at robust forecasts. Increase or decrease of prevalence rates, treatment seeking rate, diagnosis rate and prescription rate are fitted into the forecasting model to estimate the market growth rate.
The proprietary model enables GBI Research to account for the impact of individual drivers and restraints in the growth of the market. The year of impact and the extent of impact are quantified in the forecasting model to provide close-to-accurate data sets.
Diseased Population
The diseased population for any indication is the prevalence. The prevalence rates are usually obtained from various journals, online publications, sources such as the American Heart Association (AHA), World Health Organization (WHO), and so on.
Treatment Seeking Population
The treatment seeking population is always calculated as a percentage of prevalence. The number denotes the actual number of patients who are going to hospitals to get diagnosis reports for any disease. The treatment seeking population is primarily driven by the onset of symptoms, patient awareness and the severity of the disease.
Diagnosis Population
Out of the patients who undergo diagnostic tests to confirm a disease, only a few people get diagnosed with the disease. This number as a percentage of the treatment seeking population is the diagnosis rate. The diagnosis population is primarily driven by the sensitivity of the diagnostic tests, state-of-the-art technology, patient access to these diagnostic tests and the cost of the diagnostic tests.

© GBI Research. This is a licensed product and is not to be photocopied GBIHC180MR / Published JAN 2013
Page 60
Statins Market to 2018 - Appendix
Prescription Population
For any disease, multiple treatment options exist. For example, in dyslipidemia various treatment options such as, lifestyle modification and drug therapy are available. Prescription population is defined as the number of patients who are prescribed drug therapy. This is calculated as a percentage of the diagnosis population. The prescription population is primarily driven by the age at which the disease is diagnosed, the disease stage, patient health and cost of drug treatment.
10.4.4.2 Market Size by Geography
The treatment usage pattern and annual cost of treatment in each country has been factored in while deriving the individual country market size.
Forecasting Model for Therapeutic Areas
Figure 21: GBI Research Market Forecasting Model
D is e ase P opu lati onGe ner al Po pu lation 743,53 5,048
Q ualifying c ondition 1 (Ag e/S ex/O c c upation etc )Q ualifying c ondition 2 (Ag e/S ex/O c c upation etc )
Pre val ence t issu e valv e dise ase 0.2% 1,78 4,484 Q ualifying c ondition (c om plic at ion, s everity)D IS EA SE D P OPU LA TIO N 1,78 4,484
T r e atm en t Flow P attern sTre atm ent S eek i ng R ate (Sy m ptom s/ Dis A warene ss) 89% 1,58 8,191 Dia gn osis Rat e (C lin ical and D iagn ostic Test s) 75% 1,19 1,143
Pre scr iption R ate ( Phy sician P e rcep t io n, Tr e atm ent E ffectiv e n ess)Tis s ue V alve 70% 83 3,800 O ther T reatm ents for Valve (Sur g/M ed/N one) -
Fulfi llm en tA vailab ilit y NAW illingn ess to U s e (Patient Perc eptions) NA
R ead y to U se (S urge ry e lig ib ility , R e us e etc ) NA
Affo rd abil ity at Pri ceH E as % of G D P s pendA verag e Inc om e (per ind ividu al)P at ient O ut-of -poc ket Budge t (A nnual)
Budget a lloc a tion to one-t im e s urge ryBudget a lloc a tion to other h ealth ne eds
A verag e Pay or C overageP atient L iab ility
Targ et Pr ic e (@ 20 % pat liab )A SP for C os t o f Th erapy
T O TA L P AT IEN T V OLU M E SPro du ct P urcha se Fr equenc y 1
T OTA L UN IT VO LU MES
Pr ic ing per Un it 1 8,000$ In f lat ionP rice D ec reas e du e to c om p et it ion
M a r ket Valu e
G B I R ese ar ch M ar ke t S iz in g M o del
Source: GBI Research
The above figure represents a typical forecasting model followed in GBI Research. As discussed previously, the model is built on the treatment flow patterns. The model starts with the general population, then the diseased population as a percentage of the general population, then the treatment seeking population as a percentage of the diseased population, and then the diagnosed population as a percentage of the treatment seeking population. Finally, the total volume of units sold is calculated by multiplying the treated population by the average dosage per year per patient.

© GBI Research. This is a licensed product and is not to be photocopied GBIHC180MR / Published JAN 2013
Page 61
Statins Market to 2018 - Appendix
Articles from research journals and agency publications such as the British Medical Journal, the New England Journal of Medicine, and sources such as the American Heart Association (AHA), World Health Organization (WHO) and clinicaltrials.gov have been referred to. The marketed drugs section is based on company websites and internal databases.
10.4.5 Geographical Landscape
GBI Research analyzed seven major geographies: the US, the top five countries in Europe (the UK, Germany, France, Spain, and Italy) and Japan. The total market size for each country is provided, which is the sum value of the market sizes of all the indications for that particular country.
10.4.6 Pipeline Analysis
This section provides a list of molecules at various stages in the pipeline for various indications. The list is sourced from internal database and validated for the accuracy of phase and mechanism of action at clinicaltrials.gov and company websites. The section also includes a list of promising molecules which is narrowed down based on the results of the clinical trials at various stages and the novelty of mechanism of action.
10.4.7 Competitive Landscape
Profiles of leading players are provided along with an overview of key products marketed by the companies for various indications. An analysis of strengths, weaknesses, opportunities and threats of each company with respect to various indications is also listed.
GBI Research aims to cover all major M&A, licensing and co-development deals related to the market. This section is sourced from the companies’ websites and internal databases.
10.5 Expert Panel Validation
GBI Research uses a panel of experts to cross verify its databases and forecasts.
GBI Research expert panel comprises marketing managers, product specialists, international sales managers from medical device companies; academics from research universities and key opinion leaders from hospitals.
Historic data and forecasts are relayed to GBI Research’s expert panel for feedback and are adjusted in accordance with their feedback.
10.7 Disclaimer
All Rights Reserved.
No part of this publication may be reproduced, stored in a retrieval system or transmitted in any form by any means, electronic, mechanical, photocopying, recording or otherwise, without the prior permission of the publisher, GBI Research.
Top Related