


Languages
Pages
Legal

LUND UNIVERSITY
PO Box 117221 00 Lund+46 46-222 00 00
Gas in Scattering Media Absorption Spectroscopy - GASMAS
Svanberg, Sune
Published in:Sixth International Conference On Advanced Optical Materials And Devices (Aomd-6)
DOI:10.1117/12.816469
2008
Link to publication
Citation for published version (APA):Svanberg, S. (2008). Gas in Scattering Media Absorption Spectroscopy - GASMAS. In Sixth InternationalConference On Advanced Optical Materials And Devices (Aomd-6) (Vol. 7142). SPIE.https://doi.org/10.1117/12.816469
Total number of authors:1
General rightsUnless other specific re-use rights are stated the following general rights apply:Copyright and moral rights for the publications made accessible in the public portal are retained by the authorsand/or other copyright owners and it is a condition of accessing publications that users recognise and abide by thelegal requirements associated with these rights. • Users may download and print one copy of any publication from the public portal for the purpose of private studyor research. • You may not further distribute the material or use it for any profit-making activity or commercial gain • You may freely distribute the URL identifying the publication in the public portal
Read more about Creative commons licenses: https://creativecommons.org/licenses/Take down policyIf you believe that this document breaches copyright please contact us providing details, and we will removeaccess to the work immediately and investigate your claim.
Gas in Scattering Media Absorption Spectroscopy -
GASMAS
Sune Svanberg Atomic Physics Division, and Lund Laser Centre
Lund University, P.O. Box 118, SE-221 00 Lund, Sweden
ABSTRACT
An overview of the new field of Gas in Scattering Media Absorption Spectroscopy (GASMAS) is presented. GASMAS combines narrow-band diode-laser spectroscopy with diffuse media optical propagation. While solids and liquids have broad absorption features, free gas in pores and cavities in the material is characterized by sharp spectral signatures, typically 10,000 times sharper than those of the host material. Many applications in materials science, food packaging, pharmaceutics and medicine have been demonstrated. So far molecular oxygen and water vapour have been studied around 760 and 935 nm, respectively. Liquid water, an important constituent in many natural materials, such as tissue, has a low absorption at such wavelengths, allowing propagation. Polystyrene foam, wood, fruits, food-stuffs, pharmaceutical tablets, and human sinus cavities have been studied. Transport of gas in porous media can readily be studied by first immersing the material in, e.g., pure nitrogen, and then observing the rate at which normal air, containing oxygen, reinvades the material. The conductance of the sinus connective passages can be measured in this way by flushing the nasal cavity with nitrogen. Also other dynamic processes such as drying of materials can be studied. The techniques have also been extended to remote-sensing applications (LIDAR-GASMAS). Keywords: Diode laser spectroscopy, scattering media, gas absorption, polystyrene foam, fruit, food, human sinuses, lidar
1. INTRODUCTION
Light scattering media are very frequently encountered in our environment. Examples include clouds, fog, snow, foods (incl. milk and fruits), human tissue, paper, textiles and foams. When light propagates in strongly scattering media two types of problems occur:
Since the optical path length is undefined, concentrations cannot be deduced from the light attenuation using the Beer-Lambert law
Imaging through scattering media is strongly impaired due to the blurring of scattered light Scattering and photon propagation is extensively considered in many fundamental contexts such as in the description of the propagation of photons from the inner part of the sun to its surface, or in the consideration of the Earth´s radiation budget (climate change). Light scattering is an important aspect in the context of laser sounding of the atmosphere using lidar – light detection and ranging; see, e.g. [1-3]). During recent years the extensive development of medical laser applications has been accompanied by strong efforts regarding the theoretical description and experimental study of optical radiation in human tissue (see, e.g. [4,5]). Clearly, the light propagation in scattering media is wavelength dependent since the molecules encountered in the medium have their characteristic absorption spectra, and since the scattering is strongly enhanced for short wavelengths. Thus, spectroscopy in scattering media is a very rich field, as is illustrated, e.g. in Ref. [6]. The present paper will focus on the quantitative analysis of species in scattering media. The other aspect, imaging in scattering media, is extensively studied in current biomedical physics. Emphasis is then frequently on optical mammography or monitoring of the brain for localizing hemorrhage or tumours. Our own early work in that field, which mostly focused on the concept of gated viewing, is presented in [7-9]. The present paper discusses spectroscopy
Sixth International Conference on Advanced Optical Materials and Devices (AOMD-6), edited byJanis Spigulis, Andris Krumins, Donats Millers, Andris Sternberg, Inta Muzikante, Andris Ozols, Maris Ozolinsh
Proc. of SPIE Vol. 7142, 714202 · © 2008 SPIE · CCC code: 0277-786X/08/$18 · doi: 10.1117/12.816469
Proc. of SPIE Vol. 7142 714202-1
Downloaded from SPIE Digital Library on 30 Jun 2011 to 130.235.188.104. Terms of Use: http://spiedl.org/terms
in scattering media as pursued in the spectral and temporal domains. Studies related to the determination of concentrations of molecules in scattering solids and liquids have been pursued for some time. Problems studied could be the concentration determination of tumour sensitizers in human tissue for photodynamic therapy, for glucose or urea determination in the blood, either in vivo or in an artificial kidney machine, for non-intrusive determination of the sweetness of fruits, or the determination of the concentration of the active component in pharmaceutical tablets. The next section will briefly discuss these aspects as a background to the main topic of the paper, Gas in Scattering Media Absorption Spectroscopy (GASMAS). This is a rich new field, where the extremely sharp absorptive features of free gas enclosures is solids are studied with many applications in materials, food, pharmaceutical and human medicine contexts. Following the GASMAS section we deal with the connection to multiple scattering lidar, to finally conclude with a discussion.
2. BROAD-BAND SPECTROSCOPY IN SCATTERING MEDIA
As we have already mentioned, concentration measurements in scattering media are not straight-forward since, in contrast to the normal situation in analytical chemistry treating non-scattering media in measurement cells, the optical path length is no longer defined and there is no straight-forward Beer-Lambert law to relate absorbance to concentration. This problem can be resolved by working in the time domain where the time history of a package of photons, launched at t=0, can be followed. Basically, we operate a small-scale laser-radar system, where the arrival time of the photons can be clocked, and thus the distance they traveled through the sample. The fate of a photon depends both on the scattering and the absorption of the medium and is highly wavelength dependent. Therefore multi-colour experiments must be performed. Since normal molecular constituents of the scattering solid or liquid absorb in broad bands characteristic of such materials there are small demands on spectral resolution. Using white-light generation due to self-phase modulation when short and intense pulses propagate in, e.g. water, a broad spectral distribution can be obtained. The light passing through the sample is detected both spectrally and temporally resolved using a crossed spectrometer and a streak camera. Theory shows, that the absorption and scattering coefficients of the sample can be determined separately in such experiments. Following early demonstrations of spectroscopy of this kind [10,11], we reported on concentration measurements of tumour sensitizers in living tissue [12]. Our efforts have recently focused on the study of pharmaceutical tablets [13-15]. It is of considerable interest to be able to measure constituent concentrations in tablets without the need of dissolving them. Most spectral signatures of interest are in the near-IR region. With the advent of photonic bandgap fibres it is possible to very efficiently generate “white light” also extending into this region. Also other scattering materials, such as fruits, have been studied [14,16]. An example of this type of time-resolved white light absorption spectroscopy is shown in Fig. 1 [14].
3. GAS IN SCATTERING MEDIA ABSORPTION SPECTROSCOPY – GASMAS
As we have noted already earlier the spectral signatures in the optical region for solids and liquids are normally quite broad, and are seldom sharper than 10 nm. Thus, spectral equipment normally employed in such contexts has moderate resolution. However, few years ago we realized that many solid or liquid materials have gas-filled pores and enclosures which can be spectroscopically studied. Free gases are characterized by extremely sharp linewidths, typically 10,000 times sharper than those encountered in solid state physics. Combining our long-time experience and equipment for atmospheric gas monitoring, mostly motivated for pollution studies, with the familiarity with strongly scattering media encountered in biomedical optics, the GASMAS technique was born [17].
Proc. of SPIE Vol. 7142 714202-2
Downloaded from SPIE Digital Library on 30 Jun 2011 to 130.235.188.104. Terms of Use: http://spiedl.org/terms
Measured raw data Amplitude (au.)loft
E
4 900
bOG
hOG
120
8o&
1000 71100
0 ido
1200
300 4 500 Evaluated properties
— Measured data— Instrumental data
Fitted dataE 04
0.3 /\ E
100 2 300 4 500 B50 900 950
Time (ps)
1DDO 1050 11DD
Wavelength (nm)
A
Source
:4::
Detector
Source 4, tDetector
(a) (b)
Line width0.01-0.001 nmtlt _________
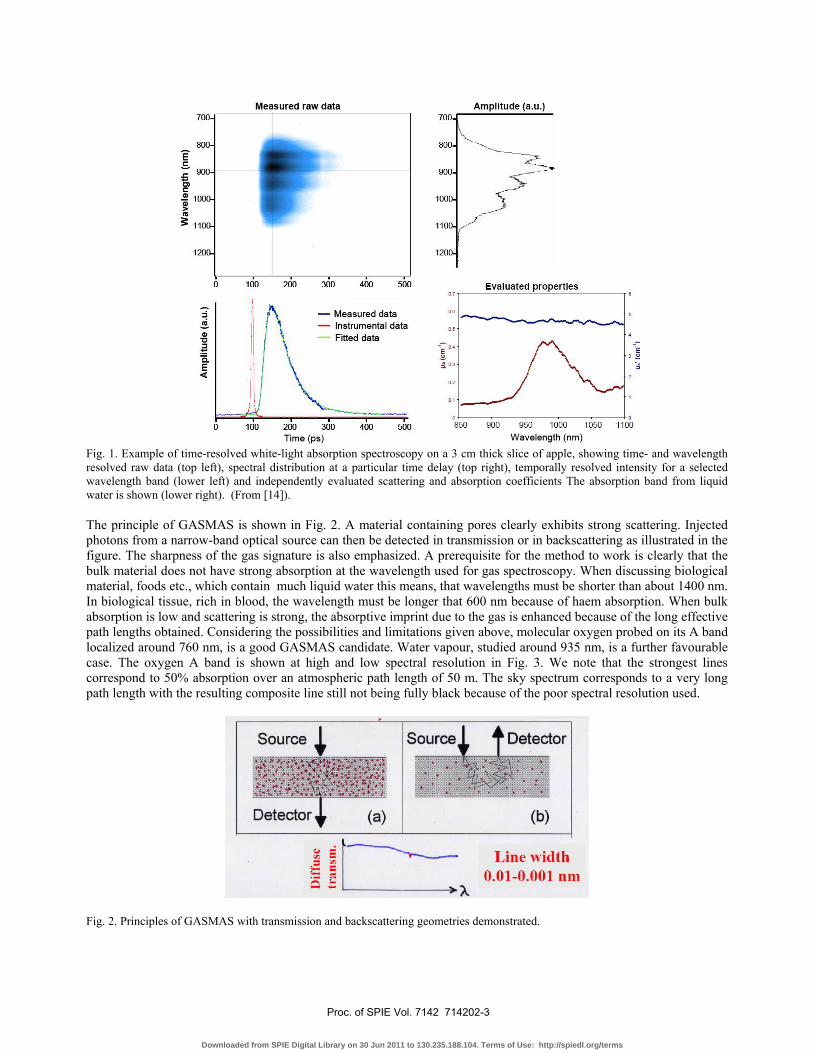
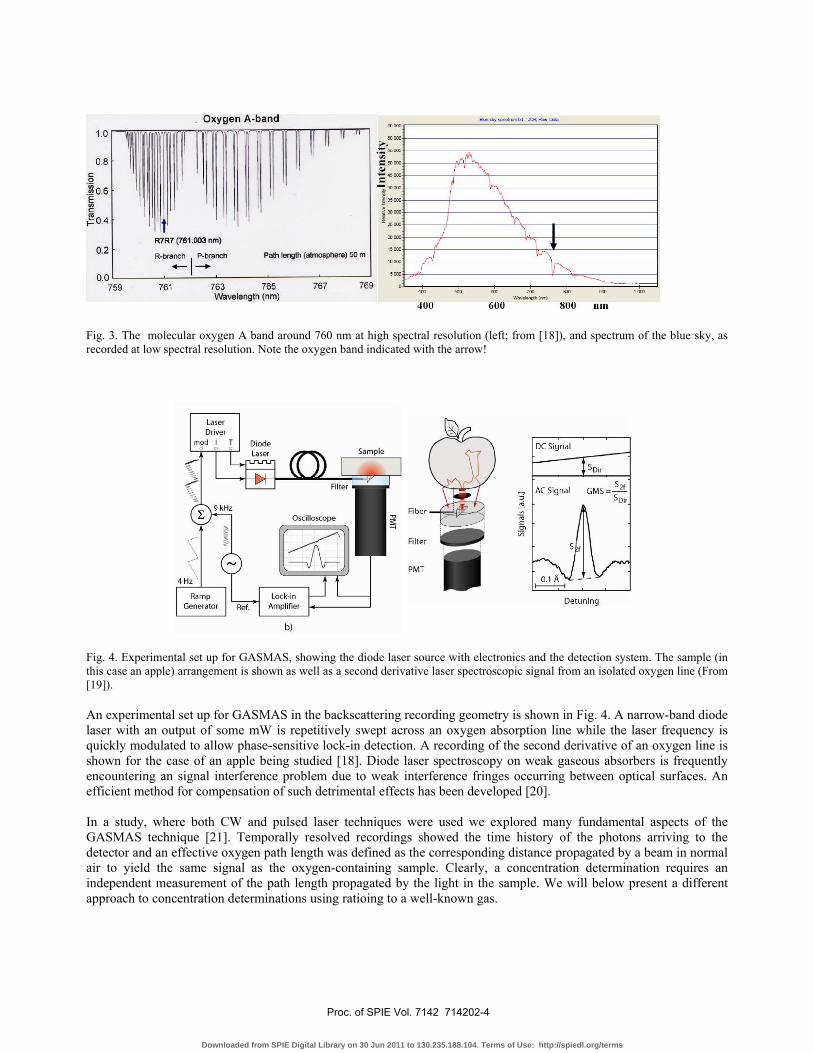
Fig. 1. Example of time-resolved white-light absorption spectroscopy on a 3 cm thick slice of apple, showing time- and wavelength resolved raw data (top left), spectral distribution at a particular time delay (top right), temporally resolved intensity for a selected wavelength band (lower left) and independently evaluated scattering and absorption coefficients The absorption band from liquid water is shown (lower right). (From [14]). The principle of GASMAS is shown in Fig. 2. A material containing pores clearly exhibits strong scattering. Injected photons from a narrow-band optical source can then be detected in transmission or in backscattering as illustrated in the figure. The sharpness of the gas signature is also emphasized. A prerequisite for the method to work is clearly that the bulk material does not have strong absorption at the wavelength used for gas spectroscopy. When discussing biological material, foods etc., which contain much liquid water this means, that wavelengths must be shorter than about 1400 nm. In biological tissue, rich in blood, the wavelength must be longer that 600 nm because of haem absorption. When bulk absorption is low and scattering is strong, the absorptive imprint due to the gas is enhanced because of the long effective path lengths obtained. Considering the possibilities and limitations given above, molecular oxygen probed on its A band localized around 760 nm, is a good GASMAS candidate. Water vapour, studied around 935 nm, is a further favourable case. The oxygen A band is shown at high and low spectral resolution in Fig. 3. We note that the strongest lines correspond to 50% absorption over an atmospheric path length of 50 m. The sky spectrum corresponds to a very long path length with the resulting composite line still not being fully black because of the poor spectral resolution used.
Fig. 2. Principles of GASMAS with transmission and backscattering geometries demonstrated.
Proc. of SPIE Vol. 7142 714202-3
Downloaded from SPIE Digital Library on 30 Jun 2011 to 130.235.188.104. Terms of Use: http://spiedl.org/terms
Oxygsrt A•bsnd •Isu •CSl
759 761 763 765
Wavelength (nm)
-400 600 800 urn
C0!o.6EL0
GA
€eecoJ
CeCCOJ
C
767 769
b)
Filter
PPM
C
Ca
Detunlng
Fig. 3. The molecular oxygen A band around 760 nm at high spectral resolution (left; from [18]), and spectrum of the blue sky, as recorded at low spectral resolution. Note the oxygen band indicated with the arrow!
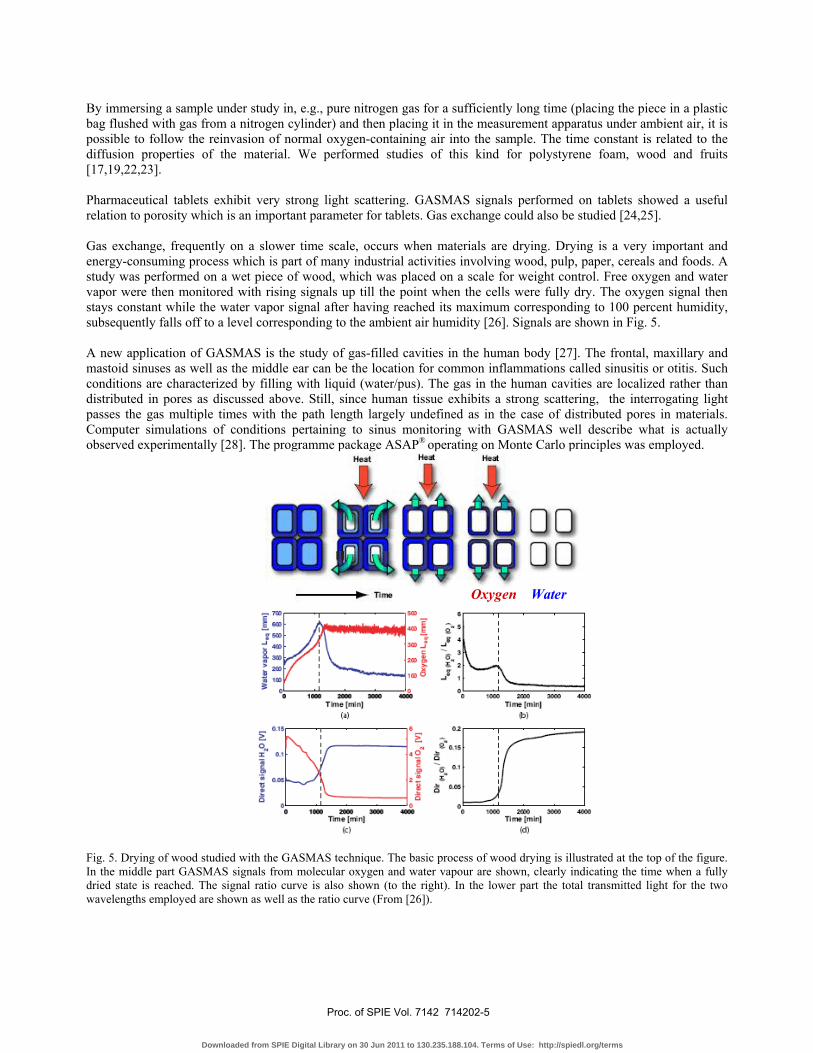
Fig. 4. Experimental set up for GASMAS, showing the diode laser source with electronics and the detection system. The sample (in this case an apple) arrangement is shown as well as a second derivative laser spectroscopic signal from an isolated oxygen line (From [19]). An experimental set up for GASMAS in the backscattering recording geometry is shown in Fig. 4. A narrow-band diode laser with an output of some mW is repetitively swept across an oxygen absorption line while the laser frequency is quickly modulated to allow phase-sensitive lock-in detection. A recording of the second derivative of an oxygen line is shown for the case of an apple being studied [18]. Diode laser spectroscopy on weak gaseous absorbers is frequently encountering an signal interference problem due to weak interference fringes occurring between optical surfaces. An efficient method for compensation of such detrimental effects has been developed [20]. In a study, where both CW and pulsed laser techniques were used we explored many fundamental aspects of the GASMAS technique [21]. Temporally resolved recordings showed the time history of the photons arriving to the detector and an effective oxygen path length was defined as the corresponding distance propagated by a beam in normal air to yield the same signal as the oxygen-containing sample. Clearly, a concentration determination requires an independent measurement of the path length propagated by the light in the sample. We will below present a different approach to concentration determinations using ratioing to a well-known gas.
Proc. of SPIE Vol. 7142 714202-4
Downloaded from SPIE Digital Library on 30 Jun 2011 to 130.235.188.104. Terms of Use: http://spiedl.org/terms
In En
OOuuQQDD
T1
Did
i0!I H
O N
] W
M p
€ L.
]]
NI
I
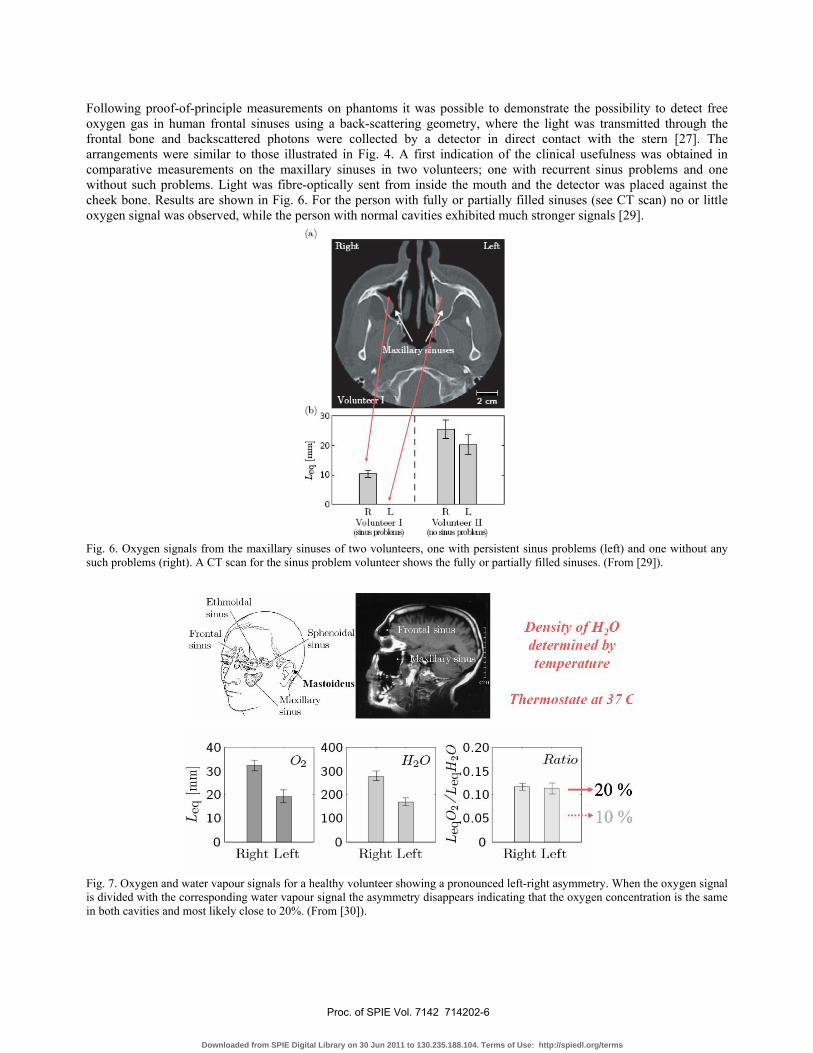
By immersing a sample under study in, e.g., pure nitrogen gas for a sufficiently long time (placing the piece in a plastic bag flushed with gas from a nitrogen cylinder) and then placing it in the measurement apparatus under ambient air, it is possible to follow the reinvasion of normal oxygen-containing air into the sample. The time constant is related to the diffusion properties of the material. We performed studies of this kind for polystyrene foam, wood and fruits [17,19,22,23]. Pharmaceutical tablets exhibit very strong light scattering. GASMAS signals performed on tablets showed a useful relation to porosity which is an important parameter for tablets. Gas exchange could also be studied [24,25]. Gas exchange, frequently on a slower time scale, occurs when materials are drying. Drying is a very important and energy-consuming process which is part of many industrial activities involving wood, pulp, paper, cereals and foods. A study was performed on a wet piece of wood, which was placed on a scale for weight control. Free oxygen and water vapor were then monitored with rising signals up till the point when the cells were fully dry. The oxygen signal then stays constant while the water vapor signal after having reached its maximum corresponding to 100 percent humidity, subsequently falls off to a level corresponding to the ambient air humidity [26]. Signals are shown in Fig. 5. A new application of GASMAS is the study of gas-filled cavities in the human body [27]. The frontal, maxillary and mastoid sinuses as well as the middle ear can be the location for common inflammations called sinusitis or otitis. Such conditions are characterized by filling with liquid (water/pus). The gas in the human cavities are localized rather than distributed in pores as discussed above. Still, since human tissue exhibits a strong scattering, the interrogating light passes the gas multiple times with the path length largely undefined as in the case of distributed pores in materials. Computer simulations of conditions pertaining to sinus monitoring with GASMAS well describe what is actually observed experimentally [28]. The programme package ASAP® operating on Monte Carlo principles was employed.
Oxygen Water
Fig. 5. Drying of wood studied with the GASMAS technique. The basic process of wood drying is illustrated at the top of the figure. In the middle part GASMAS signals from molecular oxygen and water vapour are shown, clearly indicating the time when a fully dried state is reached. The signal ratio curve is also shown (to the right). In the lower part the total transmitted light for the two wavelengths employed are shown as well as the ratio curve (From [26]).
Proc. of SPIE Vol. 7142 714202-5
Downloaded from SPIE Digital Library on 30 Jun 2011 to 130.235.188.104. Terms of Use: http://spiedl.org/terms
IlL H LVolunteer I Volunteer IIth(E1ioIti) tEtI irnbhnc)
Ethrnoidalsinus
Fronta1gSPheflOidaJinus
'J Masto ideus-MixiI1aiysinus
40 400
I
021 H203O[ 30O20 T 20O
I r'1____ HRigI1t Left Right Left
Density of 1120determined bytemperature
Thermost ate at 37 C
20 %
Ratioo 0.20
¶0.150.10
5o.osh-J
Right Left
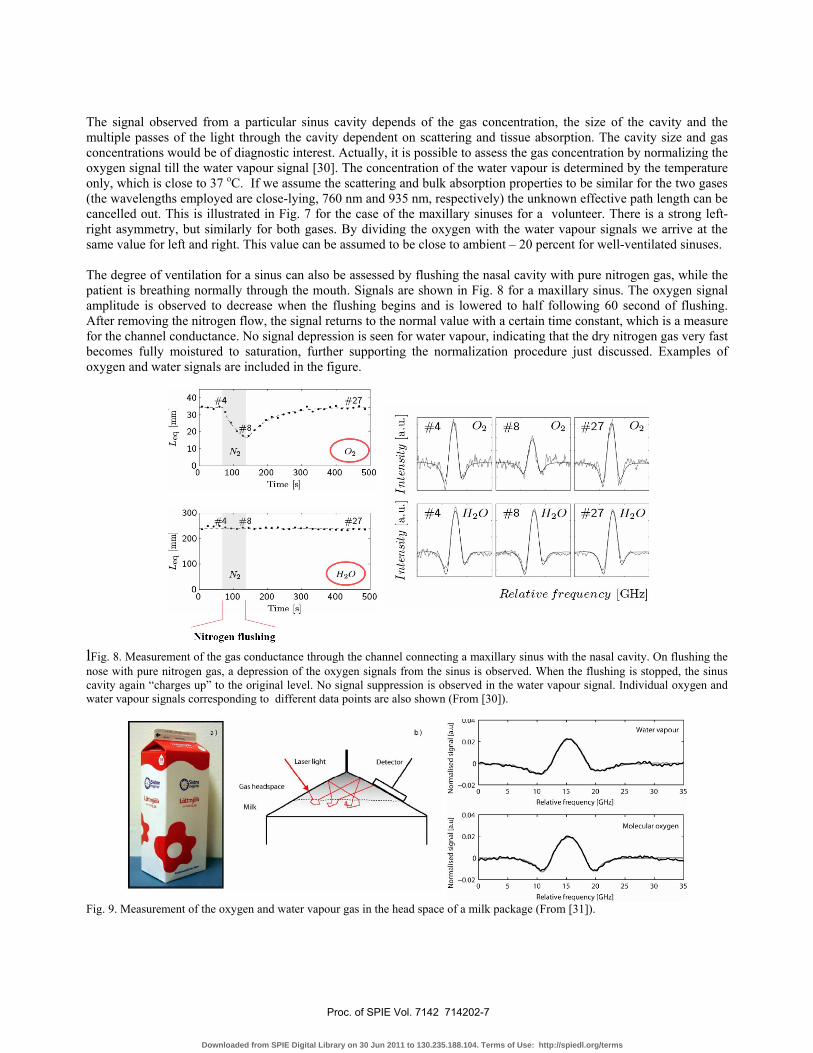
Following proof-of-principle measurements on phantoms it was possible to demonstrate the possibility to detect free oxygen gas in human frontal sinuses using a back-scattering geometry, where the light was transmitted through the frontal bone and backscattered photons were collected by a detector in direct contact with the stern [27]. The arrangements were similar to those illustrated in Fig. 4. A first indication of the clinical usefulness was obtained in comparative measurements on the maxillary sinuses in two volunteers; one with recurrent sinus problems and one without such problems. Light was fibre-optically sent from inside the mouth and the detector was placed against the cheek bone. Results are shown in Fig. 6. For the person with fully or partially filled sinuses (see CT scan) no or little oxygen signal was observed, while the person with normal cavities exhibited much stronger signals [29].
Fig. 6. Oxygen signals from the maxillary sinuses of two volunteers, one with persistent sinus problems (left) and one without any such problems (right). A CT scan for the sinus problem volunteer shows the fully or partially filled sinuses. (From [29]).
Fig. 7. Oxygen and water vapour signals for a healthy volunteer showing a pronounced left-right asymmetry. When the oxygen signal is divided with the corresponding water vapour signal the asymmetry disappears indicating that the oxygen concentration is the same in both cavities and most likely close to 20%. (From [30]).
Proc. of SPIE Vol. 7142 714202-6
Downloaded from SPIE Digital Library on 30 Jun 2011 to 130.235.188.104. Terms of Use: http://spiedl.org/terms
#2
20 #4 02 #8 02 #27 0210 N2 i
/C0 100 20ime 300 400 500 1 J /30C
#27 #4 1H20 #8 RH2O #27[\H2020O
N2
C0 100 200 300 400 500 Relative frequency [GHz]
me [s]Nitrogen flushing
u.U.
0020
i-UE
—002z 0
a04
0020
E—002z 0
b)
MIk
Water vapour
15 20 25 30 35
Relative frequency FGHzI
Molecular oxygen
5 5 20 25 30 35
Relative frequency LGHzJ
The signal observed from a particular sinus cavity depends of the gas concentration, the size of the cavity and the multiple passes of the light through the cavity dependent on scattering and tissue absorption. The cavity size and gas concentrations would be of diagnostic interest. Actually, it is possible to assess the gas concentration by normalizing the oxygen signal till the water vapour signal [30]. The concentration of the water vapour is determined by the temperature only, which is close to 37 oC. If we assume the scattering and bulk absorption properties to be similar for the two gases (the wavelengths employed are close-lying, 760 nm and 935 nm, respectively) the unknown effective path length can be cancelled out. This is illustrated in Fig. 7 for the case of the maxillary sinuses for a volunteer. There is a strong left-right asymmetry, but similarly for both gases. By dividing the oxygen with the water vapour signals we arrive at the same value for left and right. This value can be assumed to be close to ambient – 20 percent for well-ventilated sinuses. The degree of ventilation for a sinus can also be assessed by flushing the nasal cavity with pure nitrogen gas, while the patient is breathing normally through the mouth. Signals are shown in Fig. 8 for a maxillary sinus. The oxygen signal amplitude is observed to decrease when the flushing begins and is lowered to half following 60 second of flushing. After removing the nitrogen flow, the signal returns to the normal value with a certain time constant, which is a measure for the channel conductance. No signal depression is seen for water vapour, indicating that the dry nitrogen gas very fast becomes fully moistured to saturation, further supporting the normalization procedure just discussed. Examples of oxygen and water signals are included in the figure.
lFig. 8. Measurement of the gas conductance through the channel connecting a maxillary sinus with the nasal cavity. On flushing the nose with pure nitrogen gas, a depression of the oxygen signals from the sinus is observed. When the flushing is stopped, the sinus cavity again “charges up” to the original level. No signal suppression is observed in the water vapour signal. Individual oxygen and water vapour signals corresponding to different data points are also shown (From [30]).
Fig. 9. Measurement of the oxygen and water vapour gas in the head space of a milk package (From [31]).
Proc. of SPIE Vol. 7142 714202-7
Downloaded from SPIE Digital Library on 30 Jun 2011 to 130.235.188.104. Terms of Use: http://spiedl.org/terms
A further application of the GASMAS is to study food products and food packaging. We have already discussed studies of fruits. Recently, we have extended this work to packages with minced meat, bake-off bread and milk [31]. In contrast to most other methods it is possible to monitor the package non-intrusively. As an example we show in Fig. 9 the study of the head space of a milk container made of carton. Again it is possible to monitor the oxygen gas concentration by normalization to water vapour. We observed that the signal stayed constant also after perforating the package, meaning that the oxygen concentration was the ambient one even in the intact container. Many applications for food monitoring seem to be in sight.
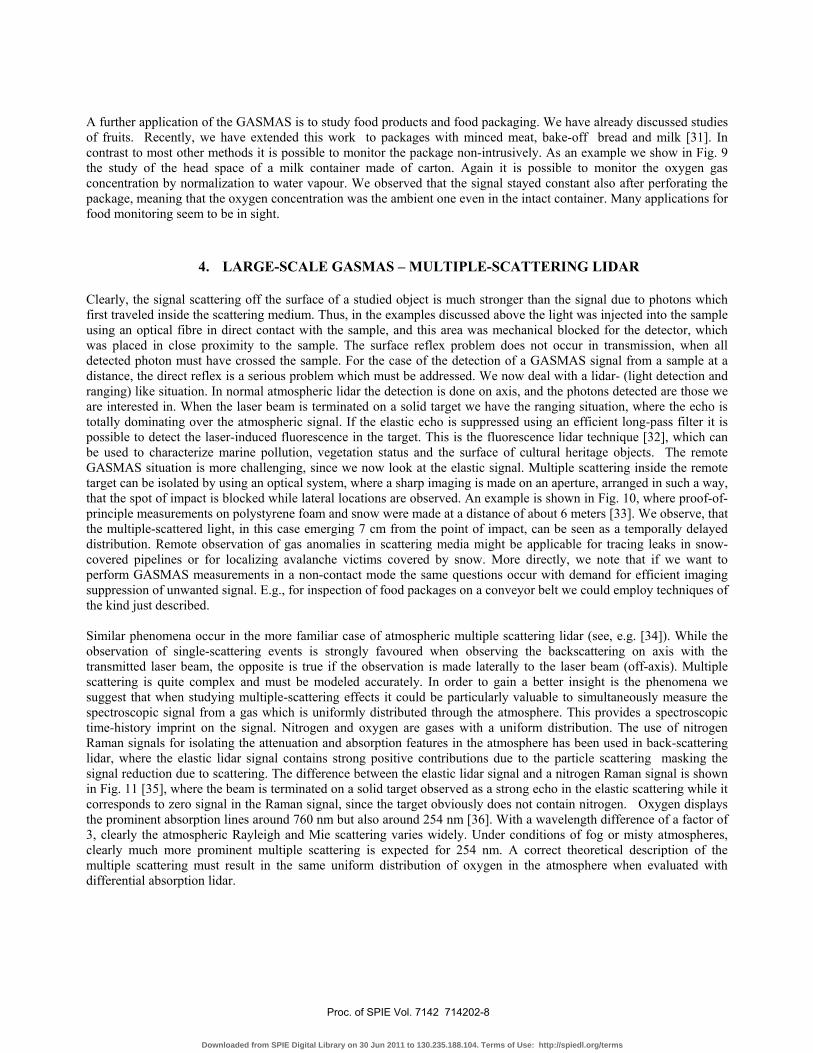
4. LARGE-SCALE GASMAS – MULTIPLE-SCATTERING LIDAR
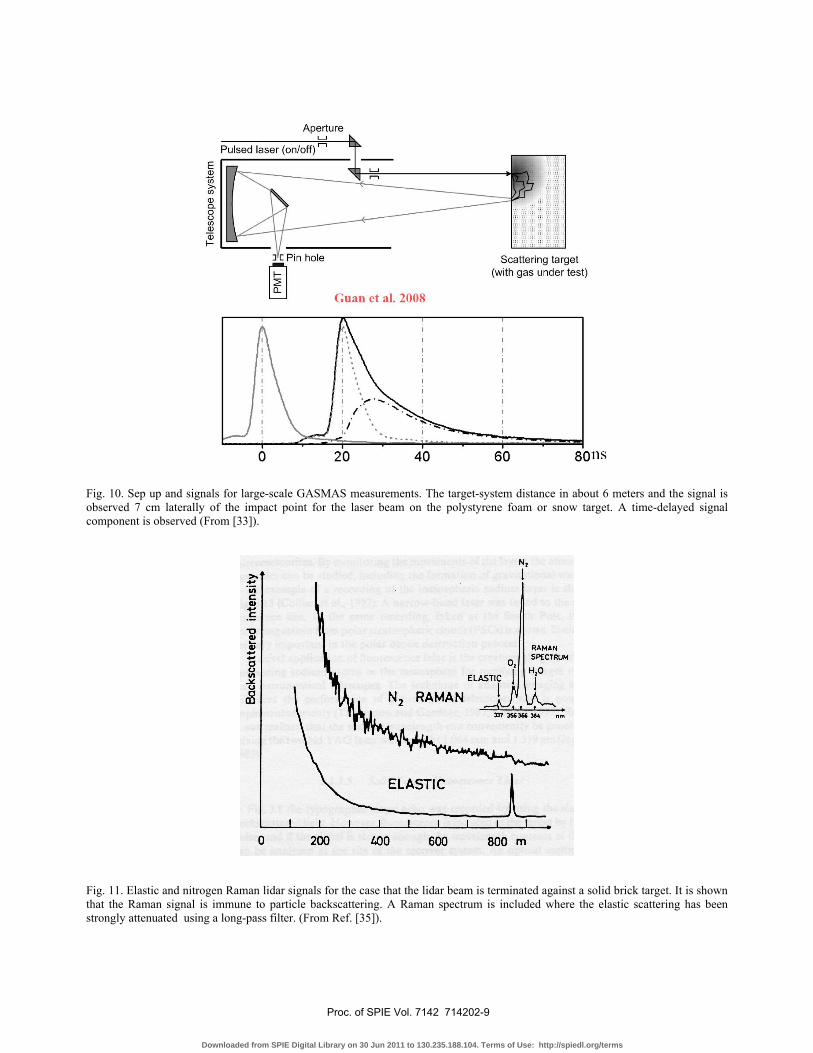
Clearly, the signal scattering off the surface of a studied object is much stronger than the signal due to photons which first traveled inside the scattering medium. Thus, in the examples discussed above the light was injected into the sample using an optical fibre in direct contact with the sample, and this area was mechanical blocked for the detector, which was placed in close proximity to the sample. The surface reflex problem does not occur in transmission, when all detected photon must have crossed the sample. For the case of the detection of a GASMAS signal from a sample at a distance, the direct reflex is a serious problem which must be addressed. We now deal with a lidar- (light detection and ranging) like situation. In normal atmospheric lidar the detection is done on axis, and the photons detected are those we are interested in. When the laser beam is terminated on a solid target we have the ranging situation, where the echo is totally dominating over the atmospheric signal. If the elastic echo is suppressed using an efficient long-pass filter it is possible to detect the laser-induced fluorescence in the target. This is the fluorescence lidar technique [32], which can be used to characterize marine pollution, vegetation status and the surface of cultural heritage objects. The remote GASMAS situation is more challenging, since we now look at the elastic signal. Multiple scattering inside the remote target can be isolated by using an optical system, where a sharp imaging is made on an aperture, arranged in such a way, that the spot of impact is blocked while lateral locations are observed. An example is shown in Fig. 10, where proof-of-principle measurements on polystyrene foam and snow were made at a distance of about 6 meters [33]. We observe, that the multiple-scattered light, in this case emerging 7 cm from the point of impact, can be seen as a temporally delayed distribution. Remote observation of gas anomalies in scattering media might be applicable for tracing leaks in snow-covered pipelines or for localizing avalanche victims covered by snow. More directly, we note that if we want to perform GASMAS measurements in a non-contact mode the same questions occur with demand for efficient imaging suppression of unwanted signal. E.g., for inspection of food packages on a conveyor belt we could employ techniques of the kind just described. Similar phenomena occur in the more familiar case of atmospheric multiple scattering lidar (see, e.g. [34]). While the observation of single-scattering events is strongly favoured when observing the backscattering on axis with the transmitted laser beam, the opposite is true if the observation is made laterally to the laser beam (off-axis). Multiple scattering is quite complex and must be modeled accurately. In order to gain a better insight is the phenomena we suggest that when studying multiple-scattering effects it could be particularly valuable to simultaneously measure the spectroscopic signal from a gas which is uniformly distributed through the atmosphere. This provides a spectroscopic time-history imprint on the signal. Nitrogen and oxygen are gases with a uniform distribution. The use of nitrogen Raman signals for isolating the attenuation and absorption features in the atmosphere has been used in back-scattering lidar, where the elastic lidar signal contains strong positive contributions due to the particle scattering masking the signal reduction due to scattering. The difference between the elastic lidar signal and a nitrogen Raman signal is shown in Fig. 11 [35], where the beam is terminated on a solid target observed as a strong echo in the elastic scattering while it corresponds to zero signal in the Raman signal, since the target obviously does not contain nitrogen. Oxygen displays the prominent absorption lines around 760 nm but also around 254 nm [36]. With a wavelength difference of a factor of 3, clearly the atmospheric Rayleigh and Mie scattering varies widely. Under conditions of fog or misty atmospheres, clearly much more prominent multiple scattering is expected for 254 nm. A correct theoretical description of the multiple scattering must result in the same uniform distribution of oxygen in the atmosphere when evaluated with differential absorption lidar.
Proc. of SPIE Vol. 7142 714202-8
Downloaded from SPIE Digital Library on 30 Jun 2011 to 130.235.188.104. Terms of Use: http://spiedl.org/terms
Aperture
Pulsed laser
IC Pin hole
llL9:J Guan et aL 2008
Scattering target(with gas under test)
0 20 40 60 8OflS
N2
ASTIC
ELAS RAMANSPECTRUM
(12 HO
I $356366 364 rm
N2 RAMAN
0 200 400 600 800m
Fig. 10. Sep up and signals for large-scale GASMAS measurements. The target-system distance in about 6 meters and the signal is observed 7 cm laterally of the impact point for the laser beam on the polystyrene foam or snow target. A time-delayed signal component is observed (From [33]).
Fig. 11. Elastic and nitrogen Raman lidar signals for the case that the lidar beam is terminated against a solid brick target. It is shown that the Raman signal is immune to particle backscattering. A Raman spectrum is included where the elastic scattering has been strongly attenuated using a long-pass filter. (From Ref. [35]).
Proc. of SPIE Vol. 7142 714202-9
Downloaded from SPIE Digital Library on 30 Jun 2011 to 130.235.188.104. Terms of Use: http://spiedl.org/terms
5. DISCUSSION
The GASMAS method was developed at the borderline between atmospheric gas remote sensing and tissue biomedical optics, two fields which have been pursued in the Lund research group for many years [37-39]. Many different applications for the technique are emerging. Several of these were reviewed in this paper. Suitable experimental techniques as set-ups have been developed [40,41]. Regarding medical applications we are now planning to apply gas monitoring techniques to neo-natal and small children for which lung and intestine monitoring is very relevant. Adult lung monitoring might be considered with lasers with sufficient power in a narrow linewidth. Here high-power diode lasers or single-mode alexandrite long-pulse systems might be applied. Regarding material science, studies of catalysts and zeolites, which are highly porous, could be considered. On the more basic side it is interesting to interrogate the detailed propagation of photons in porous media where the partition of light paths between bulk material and pores becomes non-trivial. Especially the situation for very small pores is challenging. A good understanding of these types of phenomena is important for correctly assessing absolute concentrations and porosities. Further, the correct relation between measured gas transport time constants and the diffusion constants has to be established [42].
ACKNOWLEDGEMENTS
The authors gratefully acknowledge a very fruitful collaboration with a large number of graduate students and colleagues in the field of Gas in Scattering Media Absorption Spectroscopy. These include: Janis Alnis, Benjamin Anderson, Mats Andersson, Stefan Andersson-Engels, Staffan Folestad, Hong Gao, Rasmus Grönlund, Zuguang Guan, Jonas Johansson, Claes af Klinteberg, Märta Lewander, Hans Lundberg, Annika Olsson, Linda Persson, Lars Rippe, Mikael Sjöholm, Gabriel Somesfalean, Katarina Svanberg, and Tomas Svensson. The work was supported by the Swedish Research Council (VR), the Lund University Medical Faculty, the Knut and Alice Wallenberg Foundation, NGIL and AstraZeneca.
REFERENCES
1. Fujii, T. and Fukuchi, T. (Eds), Laser Remote Sensing (CRC Press, Boca Raton 2005). 2. Weitkamp, C., Lidar: Range-Resolved Optical Remote Sensing of the Atmosphere (Springer, Heidelberg 2005). 3. Svanberg, S., ”LIDAR,” in Träger, F., Ed., Springer Handbook of Lasers and Optics (Springer, Heidelberg 2007), pp
1031-1052. 4. Müller, G. et al. (Eds), Medical Optical Tomography, Functional Imaging and Monitoring, SPIE Institute Series, Vol. 11
(SPIE, Bellingham 1993). 5. Vo-Dinh, T., Biomedical Photonics Handbook (CRC Press, New York 2003). 6. Svanberg, S., ”Electromagnetic radiation in scattering media – Spectroscopic aspects,” in Progress in Nonlinear Science,
Vol II, Ed. A.G. Litvak (Univ. of Nizhny Novgorod, N. Novgorod, 2002) p. 429 7. S. Andersson-Engels, R. Berg, O. Jarlman and S. Svanberg, Time-resolved transillumination for medical diagnostics,
Optics Letters 15, 1179 (1990). 8. Berg, R., Jarlman, O., and Svanberg, S., ”Medical transillumination imaging using short-pulse diode lasers.” Appl. Opt. 32,
574 (1993). 9. Berg, R., Andersson-Engels, S. and Svanberg, S., ”Time-resolved transillumination imaging,” in [4], p. 397. 10. Andersson-Engels, S., Berg, R., Persson, A. and Svanberg, S., ”Multispectral tissue characterization using time-resolved
detection of diffusely scattered white light,” Opt. Letters 18, 1697 (1993). 11. af Klinteberg, C., Berg, R., Lindquist, C., Andersson-Engels, S., and Svanberg, S., ”Diffusely scattered femtosecond white
light examination of breast tissue in vitro and in vivo,” SPIE 2626, 149 (1995). 12. af Klinteberg, C., Pifferi, A., Andersson-Engels, S., Cubeddu, R. and Svanberg, S., ”In vivo absorption spectroscopy of
tumor sensitizers using femtosecond white light,” Appl. Opt. 44, 2213 (2005). 13. Johansson, J., Folestad, S., Josefson, M., Sparén, A., Abrahamsson, C., Andersson-Engels, S. and Svanberg, S., “Time-
resolved NIR/VIS spectroscopy for analysis of solids: Pharmaceutical tablets,” Appl. Spectrosc. 56, 725 (2002). 14. Abrahamsson, Ch., Svensson, T., Svanberg, S., Andersson-Engels, S., Johansson, J. and Folestad, S., ”Time and
wavelength resolved spectroscopy of turbid media using light continuum generated in a crystal fibre,” Optics Express 12, 4103 (2004).
15. Abrahamsson, C., Johansson, J., Andersson-Engels, S., Svanberg, S. and Folestad, S., ”Time-resolved NIR spectroscopy for quantitative analysis of intact pharmaceutical tablets,” Anal. Chemistry 77, 1055 (2005).
Proc. of SPIE Vol. 7142 714202-10
Downloaded from SPIE Digital Library on 30 Jun 2011 to 130.235.188.104. Terms of Use: http://spiedl.org/terms
16. Chauchard, F., Roussel, S., Roger, J.-M., Bellon-Maurel, V., Abrahamsson, Ch., Svensson, T., Andersson-Engels, S., and Svanberg, S., ”Least squares-support vector machines modelling for time resolved spectroscopy,” Appl. Optics 44, 7091 (2005).
17. Sjöholm, M., Somesfalean, G., Alnis, J., Andersson-Engels, S. and Svanberg, S., ”Analysis of gas dispersed in scattering solids and liquids,” Opt. Lett. 26, 16 (2001).
18. Somesfalean, G., “Environmental monitoring using diode-laser-based spectroscopic techniques”, PhD dissertation, Lund University 2004
19. Persson, L., Anderson, B., Andersson, M., Sjöholm, M., and Svanberg, S., ”Studies of gas exchange in fruits using laser spectroscopic techniques, Proc. Fruitic 05, Information and Technology for Sustainable Fruit and Vegetable Production, 543-552, Montpellier (September 2005).
20. Persson, L., Andersson, M., Andersson, F. and Svanberg, S., “Approach to optical interference fringe reduction in diode-laser-based absorption spectroscopy,” Appl. Phys. B 87, 523 (2007).
21. Somesfalean, G., Sjöholm, M., Alnis J., af Klinteberg, C., Andersson-Engels, S. and Svanberg, S., ”Concentration measurement of gas imbedded in scattering media employing time and spatially resolved techniques,” Appl. Optics 41, 3538 (2002).
22. Persson, L., Gao, H., Sjöholm, M. and Svanberg, S., ”Diode laser absorption spectroscopy for studies of gas exchange in fruits,” Lasers Opt. Engineering 44, 687 (2006).
23. Alnis, J., Anderson, B., Sjöholm, M., Somesfalean, G. and Svanberg, S., ”Laser spectroscopy on free molecular oxygen dispersed in wood materials,” Appl. Phys. B 77, 691 (2003).
24. Svensson, T., Persson, L., Andersson, M., Svanberg, S., Andersson-Engels, S., Johansson, J. and Folestad, S., ”Noninvasive characterization of pharmaceutical solids by diode laser oxygen spectroscopy,” Appl. Spectr. 61, 784 (2007).
25. Svensson, T., Andersson, M., Rippe, L., Svanberg, S., Andersson-Engels, S., Johansson, J. and Folestad, S., “VCSEL-based oxygen spectroscopy for structural analysis of pharmaceutical solids,” Appl. Phys. B DOI:10.1007s0034-007-2901-6 (2008).
26. Andersson, M., Persson, L., Sjöholm, M. and Svanberg, S., ”Spectroscopic studies of wood-drying processes,” Optics Express 14, 3641 (2006).
27. Persson, L., Svanberg, K. and Svanberg, S., ”On the potential for human sinus cavity diagnostics using diode laser gas spectroscopy,” Appl. Phys. B 82, 313 (2006).
28. Persson, L., Kristensson, E., Simonsson, L. and Svanberg, S., ”Monte Carlo simulations of optical human sinusitis diagnostics,” J. Biomedical Optics 12 (5) (2007).
29. Persson, L., Andersson, M., Svensson, T., Svanberg, K. and Svanberg, S., “Non-intrusive optical study of gas and its exchange in human maxillary sinuses,” SPIE 6628, 662804 (2007).
30. Persson, L., Andersson, M., Cassel-Engquist, M., Svanberg, K. and Svanberg, S., ”Gas monitoring in human sinuses using tunable diode laser spectroscopy,” J. Biomed. Optics 12, (5) (2007).
31. Lewander, M., Guan, Z.G., Persson, L., Olsson, A. and Svanberg, S., ”Food monitoring based on diode laser gas spectroscopy,” Appl. Phys. B., in press (2008).
32. Svanberg, S., ”Fluorescence spectroscopy and imaging of lidar targets,” Chapter 7 in Ref. [1] pp 433-467 33. Guan, Z.G., Lewander M., Grönlund, R., Lundberg, H. and Svanberg, S., ”Gas analysis within remote porous targets using
LIDAR multi-scatter techniques,” Appl. Phys. B, in press (2008). 34. Borovoi, A.G., Ed., Proc. 13th International Workshop on LIDAR Multiple Scattering Experiments; SPIE 5829 (2005) 35. Fredriksson, K., Galle, B., Linder, A., Nyström, K. And Svanberg, S., ”Laser radar measurements of air pollutants at an oil-
burning power station,” Göteborg Institute of Physics Reports GIPR-150, 1977. 36. Edner, H., Faris, G.W., Sunesson, A., and Svanberg, S., ”Atmospheric atomic mercury monitoring using differential
absorption lidar techniques,” Appl. Opt. 28, 921 (1989) 37. Svanberg, S., ”Environmental and medical applications of photonic interactions,” Phys. Scripta T110, 39 (2004) 38. Andersson, M., Grönlund, R., Persson, L., Sjöholm, M., Svanberg, K. and Svanberg, S., “Laser spectroscopy of gas in
scattering media at scales ranging from kilometers to millimeters,” Laser Physics 17, 893 (2007). 39. Svanberg, S., “Laser based diagnostics - from cultural heritage to human health,” Appl. Phys. B DOI: 10.1007/s00340-008-
3092-5 (2008) 40. Andersson, M., Persson, L., Svensson, T. and Svanberg, S., “Flexible lock-in detection system based on synchronized
computer plug-in boards applied in sensitive gas spectroscopy,” Rev. Sci. Instr. 78, 113107 (2007). 41. Persson L., Lewander, M., Andersson M., Svanberg, K. and Svanberg, S., “Simultaneous detection of molecular oxygen
and water vapor in the tissue optical window using tunable diode laser spectroscopy,” Phys. Rev. 47, 2028 (2008). 42. Sjöholm, M., Persson, L., and Svanberg, S., “Gas diffustion measurements in porous media by the use of a laser
spectroscopic technique,”, Manuscript, included in [43]. 43. Sjöholm, M., “Laser spectroscopic analysis of atmospheric gases in scattering media,” PhD dissertation, Lund University
2006.
Proc. of SPIE Vol. 7142 714202-11
Downloaded from SPIE Digital Library on 30 Jun 2011 to 130.235.188.104. Terms of Use: http://spiedl.org/terms
Top Related