


Languages
Pages
Legal

Name: NAUMAN MITHANI
Student no.: 301016320; group C
Course: CHEM 316
Object: Expt. 3: GAS CHROMATOGRAPHY lab
report
Due date: 13-3-2008
! "!
ABSTRACT:
The first part of this series of "Gas Chromatography" experiments explored
the retention times of individual substances, in a BTEX mixture, based on their
boiling points; it was deemed that retention time is proportional to boiling point.
Secondly, the effect of flow rate of the carrier gas on isothermal separation of the
BTEX mixture was observed; 40 cm/s (24 m/min.) was deemed to be the ideal carrier
gas flow rate. By the variation of temperatures, it was determined that higher
temperatures increased resolution but not significantly, and that it must be kept
constant. With the aid of internal standards, the concentrations of the constituents of
BTEX were calculated to be benzene: 536.8 ppm, toluene: 682.4 ppm (inaccurate),
ethylene + m,p-xylenes: 566.8 ppm (b.p.’s are to close) and o-xylene: 48.1 ppm. The
concentrations of these components in the gasoline sample were: 9274 ppm of
benzene, 6880 ppm of toluene, 3820 ppm of ethylbenzene, 3420 ppm of m/p-xylene,
2186 ppm of o-xylene.
! #!
INTRODUCTION:
This series of experiments is one of the practical realisations of the concepts of
chromatography, an analytical technique of separation (and potential identification) of
substances or compounds in a mixture. It involves running the analyte in a solvent
through a passageway coated with an immobile substance, known as the stationary
phase. Each constituent of the mixture has a characteristic affinity for the immobile
adsorbing substance and the solvent, and so adsorbs/de-adsorbs at its characteristic
rate, thus is carried out by the solvent system and/or carrier gas at a characteristic rate.
The analyte present in the solvent or eluent is known as the mobile phase and the
opposite as stationary phase. These rates are dependant on physical factors, which this
series of experiments seeks to explain.
In this particular “Gas chromatography”, a carrier gas (He) is used to ‘push’ or
carry through the analyte, dissolved in hexane and or bromobenzene, through the
column (passageway). The different constituents of the analyte separate and are
detected by an attached flame ionization detector.
The first section of the experiment measures the effect of the speed of the
carrier gas’ flow rate on the retention times (rate of ad/desorption) of the analyte’s
constituents. The second section measures the effects of the column’s temperature on
the retention times, the selectivity (affinity for the stationary to the mobile phase of
the constituents in comparison with one another) of the analyte’s constituents and
resolution. The third seeks to quantify the concentrations of the analyte’s constituents.
The analytes were a BTEX (mixture of benzene, toluene, ethylbenzene,
xylenes) standard and gasoline, dissolved in hexanes with 1,000 ppm bromobenzene.
! $!
EXPERIMENTAL:
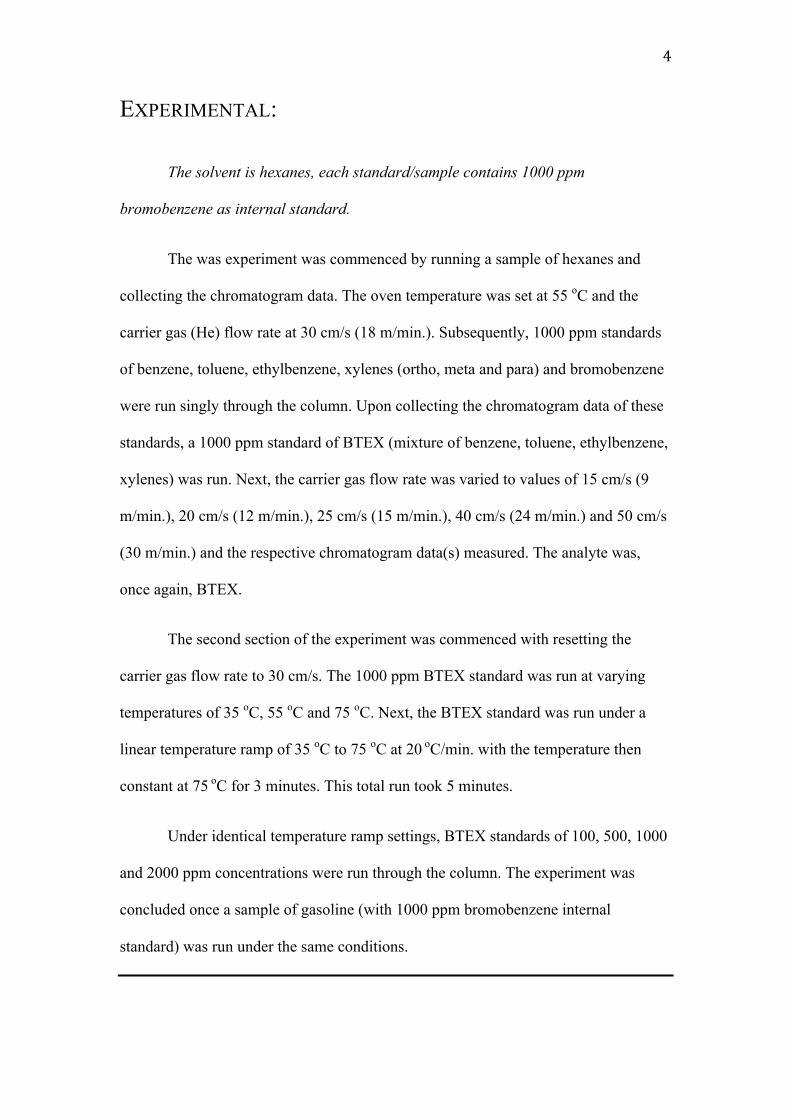
The solvent is hexanes, each standard/sample contains 1000 ppm
bromobenzene as internal standard.
The was experiment was commenced by running a sample of hexanes and
collecting the chromatogram data. The oven temperature was set at 55 oC and the
carrier gas (He) flow rate at 30 cm/s (18 m/min.). Subsequently, 1000 ppm standards
of benzene, toluene, ethylbenzene, xylenes (ortho, meta and para) and bromobenzene
were run singly through the column. Upon collecting the chromatogram data of these
standards, a 1000 ppm standard of BTEX (mixture of benzene, toluene, ethylbenzene,
xylenes) was run. Next, the carrier gas flow rate was varied to values of 15 cm/s (9
m/min.), 20 cm/s (12 m/min.), 25 cm/s (15 m/min.), 40 cm/s (24 m/min.) and 50 cm/s
(30 m/min.) and the respective chromatogram data(s) measured. The analyte was,
once again, BTEX.
The second section of the experiment was commenced with resetting the
carrier gas flow rate to 30 cm/s. The 1000 ppm BTEX standard was run at varying
temperatures of 35 oC, 55
oC and 75
oC. Next, the BTEX standard was run under a
linear temperature ramp of 35 oC to 75
oC at 20
oC/min. with the temperature then
constant at 75 oC for 3 minutes. This total run took 5 minutes.
Under identical temperature ramp settings, BTEX standards of 100, 500, 1000
and 2000 ppm concentrations were run through the column. The experiment was
concluded once a sample of gasoline (with 1000 ppm bromobenzene internal
standard) was run under the same conditions.
! %!
DATA and RESULTS:
---------------- Section 1 ----------------
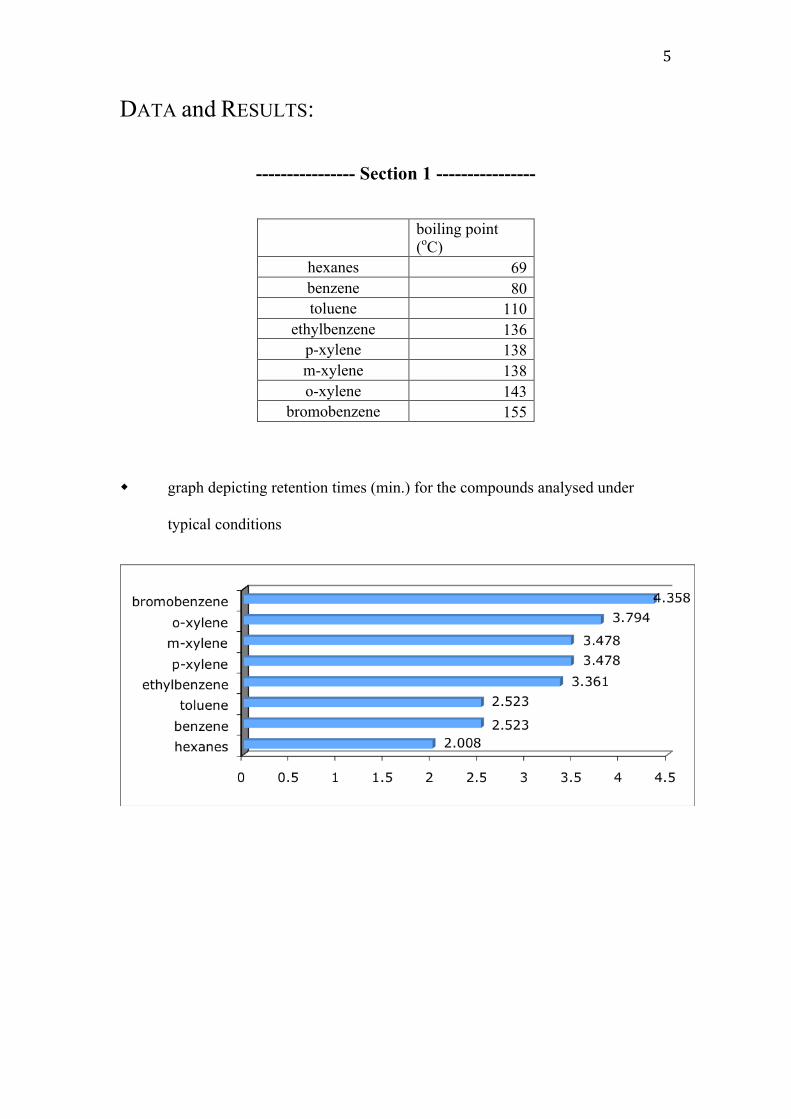
boiling point
(oC)
hexanes 69
benzene 80
toluene 110
ethylbenzene 136
p-xylene 138
m-xylene 138
o-xylene 143
bromobenzene 155
! graph depicting retention times (min.) for the compounds analysed under
typical conditions

! &!
! sample chromatogram of toluene standard under intial conditions: oven
temperature of 55 oC, carrier gas flow rate of 30 cm/s (18 m/min.)
The peak at ~2 minutes is of the solvent hexane.
! '!
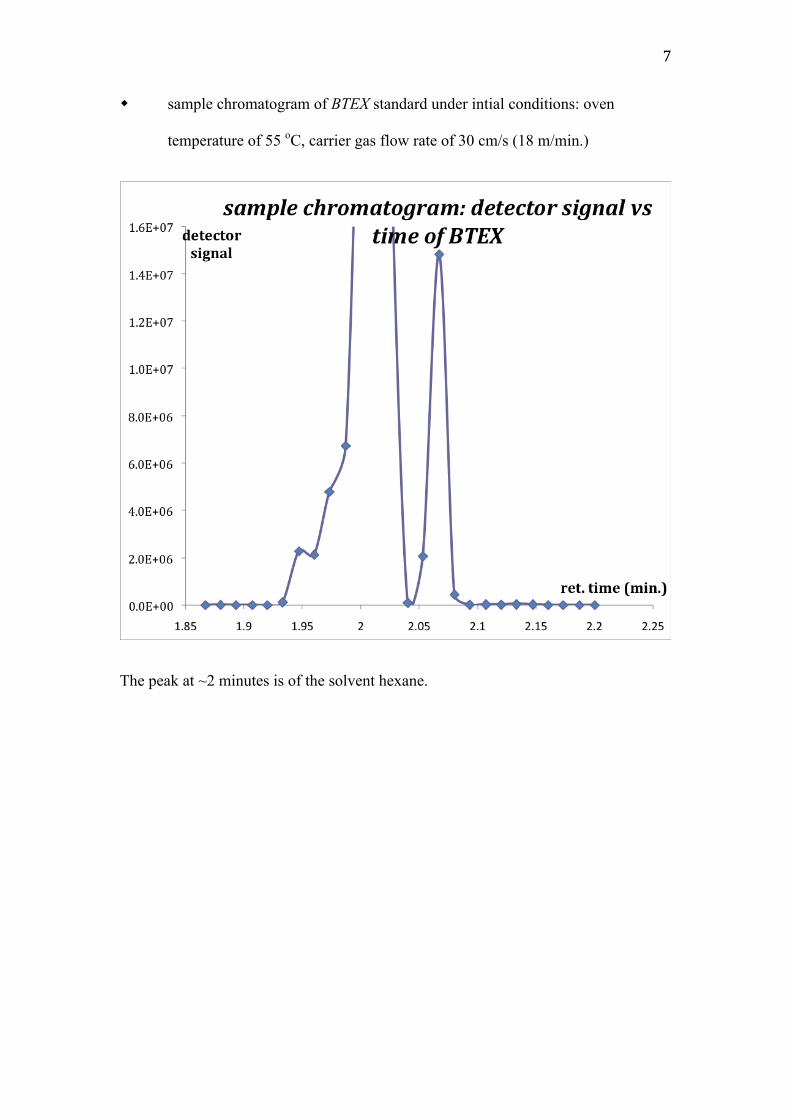
! sample chromatogram of BTEX standard under intial conditions: oven
temperature of 55 oC, carrier gas flow rate of 30 cm/s (18 m/min.)
The peak at ~2 minutes is of the solvent hexane.
! (!
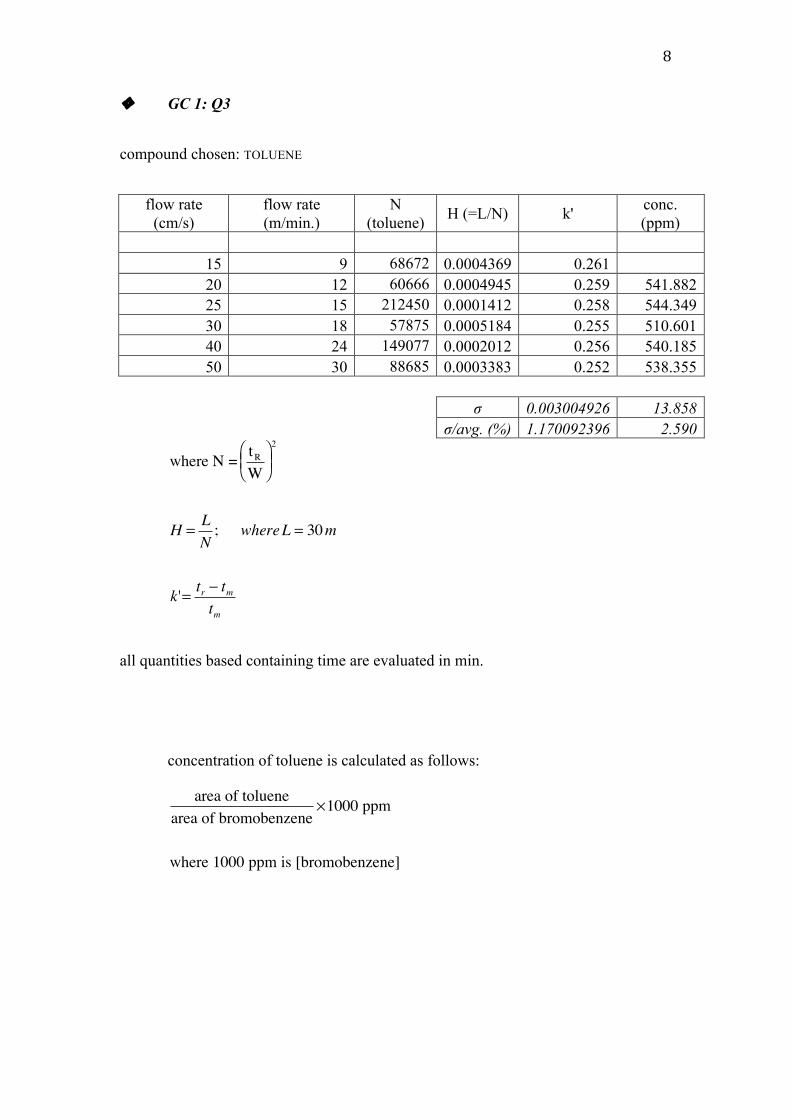
! GC 1: Q3
compound chosen: TOLUENE
flow rate
(cm/s)
flow rate
(m/min.)
N
(toluene) H (=L/N) k'
conc.
(ppm)
15 9 68672 0.0004369 0.261
20 12 60666 0.0004945 0.259 541.882
25 15 212450 0.0001412 0.258 544.349
30 18 57875 0.0005184 0.255 510.601
40 24 149077 0.0002012 0.256 540.185
50 30 88685 0.0003383 0.252 538.355
! 0.003004926 13.858
!/avg. (%) 1.170092396 2.590
where N =t
R
W
!
" #
$
% &
2
H =L
N; whereL = 30m
k'=tr' t
m
tm
all quantities based containing time are evaluated in min.
concentration of toluene is calculated as follows:
area of toluene
area of bromobenzene!1000 ppm
where 1000 ppm is [bromobenzene]
! )!
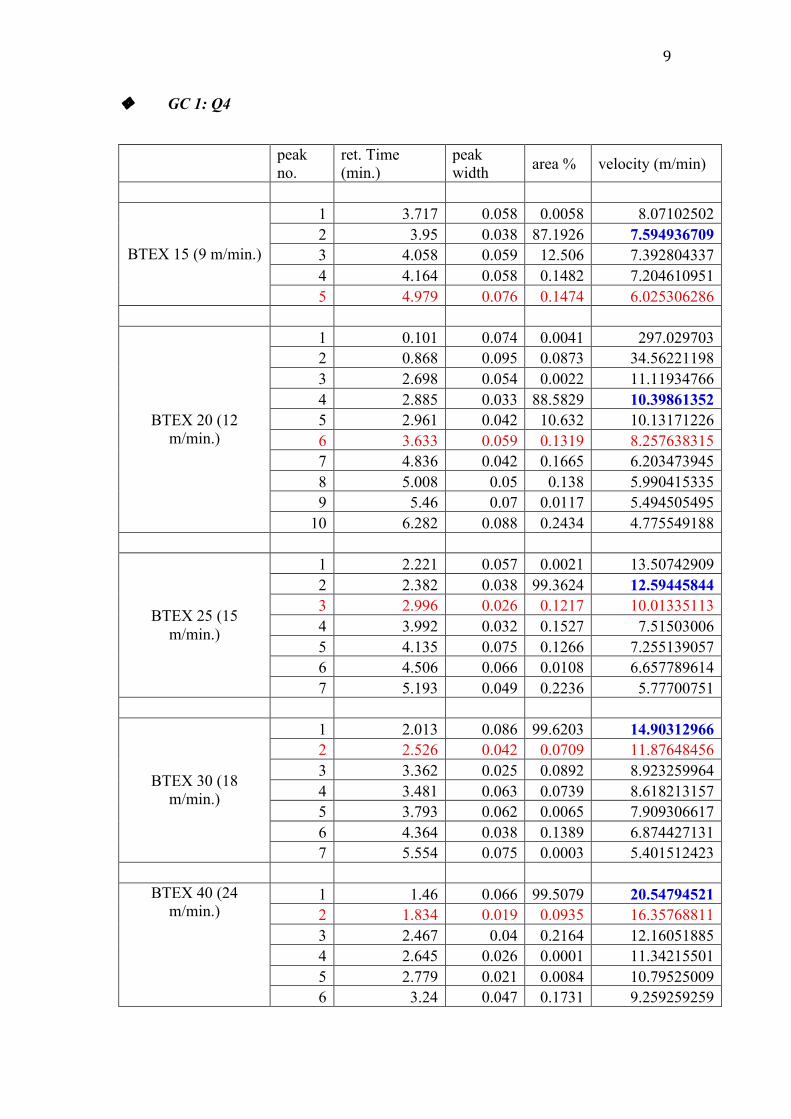
! GC 1: Q4
peak
no.
ret. Time
(min.)
peak
width area % velocity (m/min)
1 3.717 0.058 0.0058 8.07102502
2 3.95 0.038 87.1926 7.594936709
3 4.058 0.059 12.506 7.392804337
4 4.164 0.058 0.1482 7.204610951
BTEX 15 (9 m/min.)
5 4.979 0.076 0.1474 6.025306286
1 0.101 0.074 0.0041 297.029703
2 0.868 0.095 0.0873 34.56221198
3 2.698 0.054 0.0022 11.11934766
4 2.885 0.033 88.5829 10.39861352
5 2.961 0.042 10.632 10.13171226
6 3.633 0.059 0.1319 8.257638315
7 4.836 0.042 0.1665 6.203473945
8 5.008 0.05 0.138 5.990415335
9 5.46 0.07 0.0117 5.494505495
BTEX 20 (12
m/min.)
10 6.282 0.088 0.2434 4.775549188
1 2.221 0.057 0.0021 13.50742909
2 2.382 0.038 99.3624 12.59445844
3 2.996 0.026 0.1217 10.01335113
4 3.992 0.032 0.1527 7.51503006
5 4.135 0.075 0.1266 7.255139057
6 4.506 0.066 0.0108 6.657789614
BTEX 25 (15
m/min.)
7 5.193 0.049 0.2236 5.77700751
1 2.013 0.086 99.6203 14.90312966
2 2.526 0.042 0.0709 11.87648456
3 3.362 0.025 0.0892 8.923259964
4 3.481 0.063 0.0739 8.618213157
5 3.793 0.062 0.0065 7.909306617
6 4.364 0.038 0.1389 6.874427131
BTEX 30 (18
m/min.)
7 5.554 0.075 0.0003 5.401512423
1 1.46 0.066 99.5079 20.54794521
2 1.834 0.019 0.0935 16.35768811
3 2.467 0.04 0.2164 12.16051885
4 2.645 0.026 0.0001 11.34215501
5 2.779 0.021 0.0084 10.79525009
BTEX 40 (24
m/min.)
6 3.24 0.047 0.1731 9.259259259
! *+!
7 3.904 0.05 0.0002 7.68442623
8 4.086 0.042 0.0002 7.342143906
9 4.645 0.036 0.0001 6.458557589
1 1.189 0.081 99.4619 25.2312868
2 1.489 0.02 0.1018 20.14775017
3 1.989 0.034 0.2361 15.08295626
4 2.242 0.021 0.0094 13.3809099
5 2.591 0.032 0.1891 11.5785411
6 3.135 0.09 0.0007 9.56937799
7 3.28 0.033 0.0002 9.146341463
8 3.725 0.044 0.0002 8.053691275
9 5.098 0.043 0.0003 5.884660651
BTEX 50 (30
m/min.)
10 5.215 0.055 0.0002 5.752636625
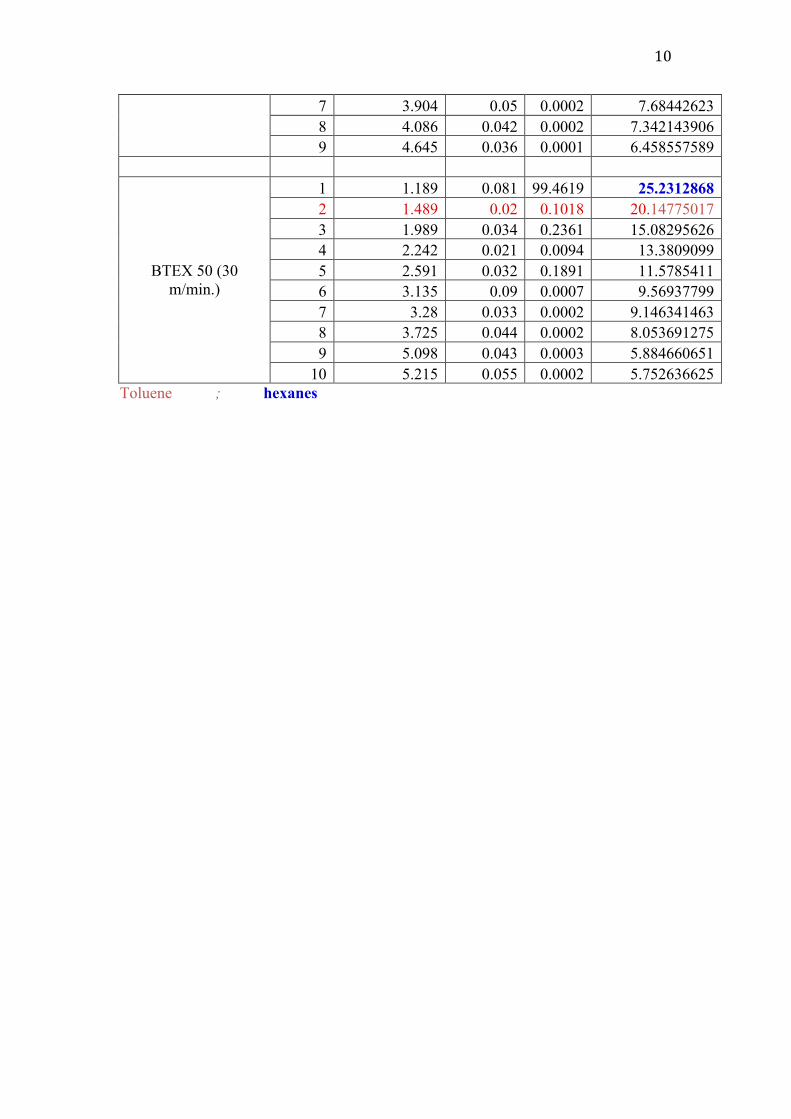
Toluene ; hexanes
! **!
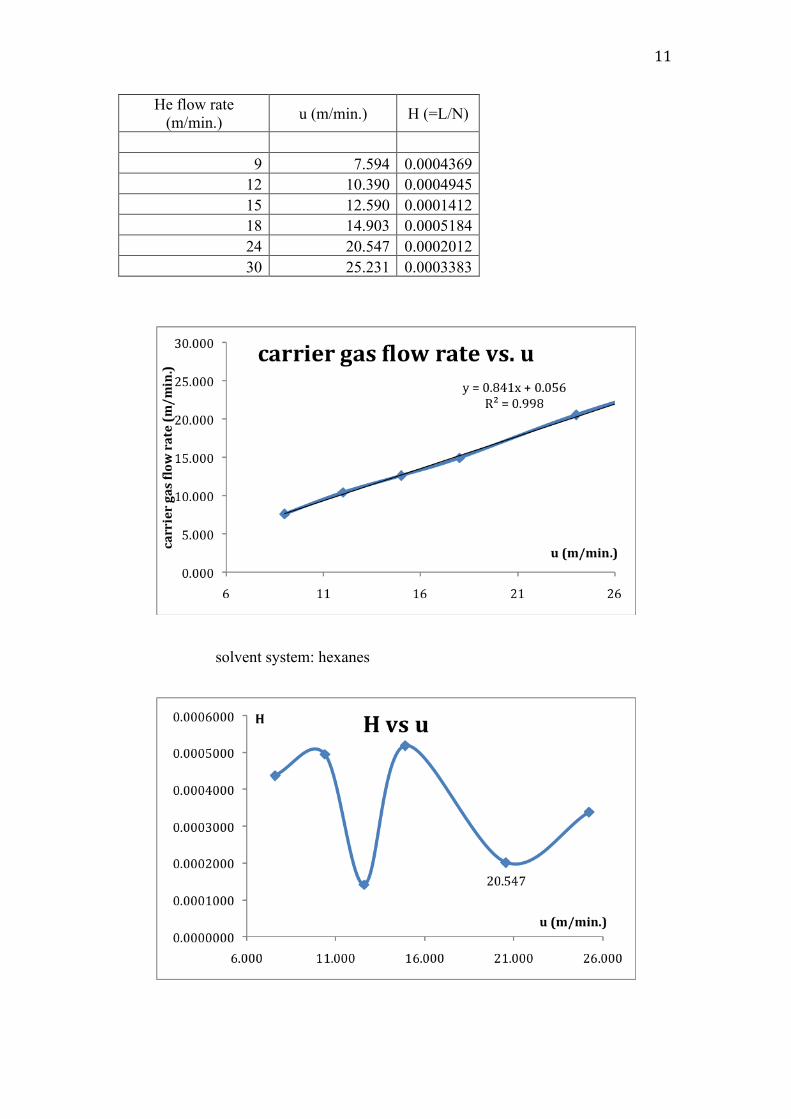
He flow rate
(m/min.) u (m/min.) H (=L/N)
9 7.594 0.0004369
12 10.390 0.0004945
15 12.590 0.0001412
18 14.903 0.0005184
24 20.547 0.0002012
30 25.231 0.0003383
solvent system: hexanes

! *"!
As can be seen from the graph and the table previously, the optimum solvent
value for H occurs at u of 20.547 m/min., corresponding to carrier gas flow
rate of 24 m/min. (40 cm/s).
The first three values cannot be considered since the general trend of Van
Deemter plots is not followed.
! *#!
---------------- Section 2 ----------------
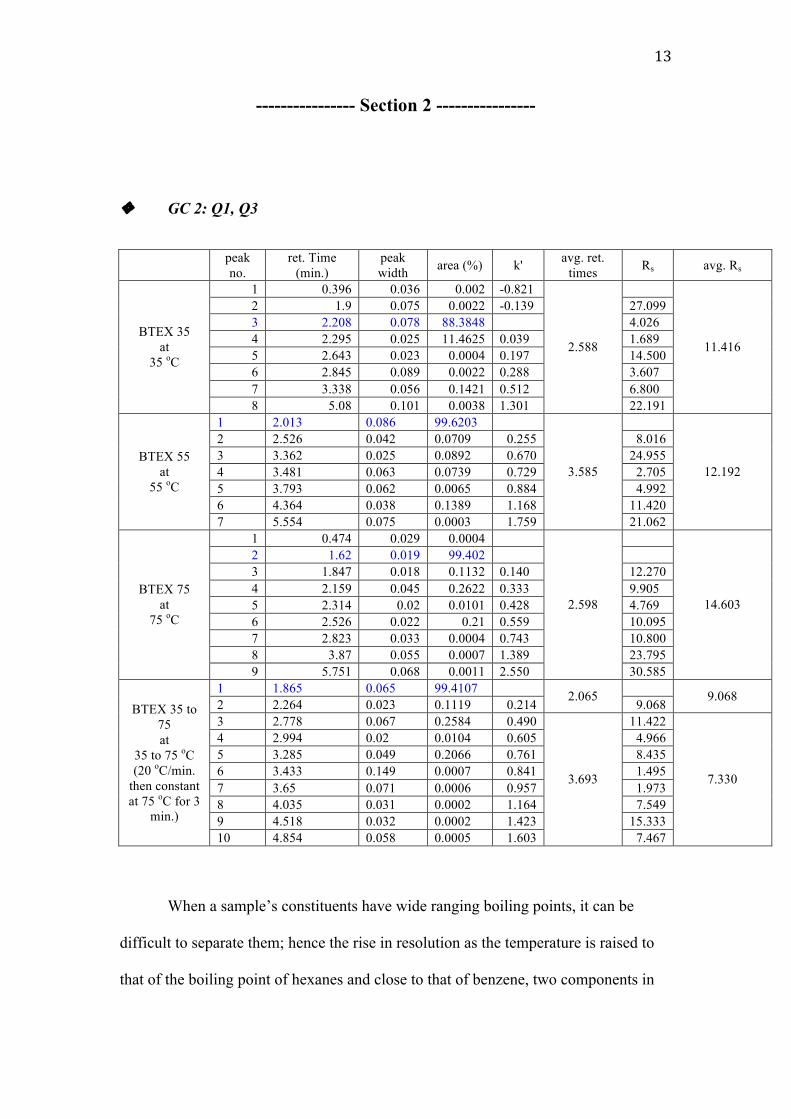
! GC 2: Q1, Q3
peak
no.
ret. Time
(min.)
peak
width area (%) k'
avg. ret.
times Rs avg. Rs
1 0.396 0.036 0.002 -0.821
2 1.9 0.075 0.0022 -0.139 27.099
3 2.208 0.078 88.3848 4.026
4 2.295 0.025 11.4625 0.039 1.689
5 2.643 0.023 0.0004 0.197 14.500
6 2.845 0.089 0.0022 0.288 3.607
7 3.338 0.056 0.1421 0.512 6.800
BTEX 35
at
35 oC
8 5.08 0.101 0.0038 1.301
2.588
22.191
11.416
1 2.013 0.086 99.6203
2 2.526 0.042 0.0709 0.255 8.016
3 3.362 0.025 0.0892 0.670 24.955
4 3.481 0.063 0.0739 0.729 2.705
5 3.793 0.062 0.0065 0.884 4.992
6 4.364 0.038 0.1389 1.168 11.420
BTEX 55
at
55 oC
7 5.554 0.075 0.0003 1.759
3.585
21.062
12.192
1 0.474 0.029 0.0004
2 1.62 0.019 99.402
3 1.847 0.018 0.1132 0.140 12.270
4 2.159 0.045 0.2622 0.333 9.905
5 2.314 0.02 0.0101 0.428 4.769
6 2.526 0.022 0.21 0.559 10.095
7 2.823 0.033 0.0004 0.743 10.800
8 3.87 0.055 0.0007 1.389 23.795
BTEX 75
at
75 oC
9 5.751 0.068 0.0011 2.550
2.598
30.585
14.603
1 1.865 0.065 99.4107
2 2.264 0.023 0.1119 0.214 2.065
9.068 9.068
3 2.778 0.067 0.2584 0.490 11.422
4 2.994 0.02 0.0104 0.605 4.966
5 3.285 0.049 0.2066 0.761 8.435
6 3.433 0.149 0.0007 0.841 1.495
7 3.65 0.071 0.0006 0.957 1.973
8 4.035 0.031 0.0002 1.164 7.549
9 4.518 0.032 0.0002 1.423 15.333
BTEX 35 to
75
at
35 to 75 oC
(20 oC/min.
then constant
at 75 oC for 3
min.)
10 4.854 0.058 0.0005 1.603
3.693
7.467
7.330
When a sample’s constituents have wide ranging boiling points, it can be
difficult to separate them; hence the rise in resolution as the temperature is raised to
that of the boiling point of hexanes and close to that of benzene, two components in
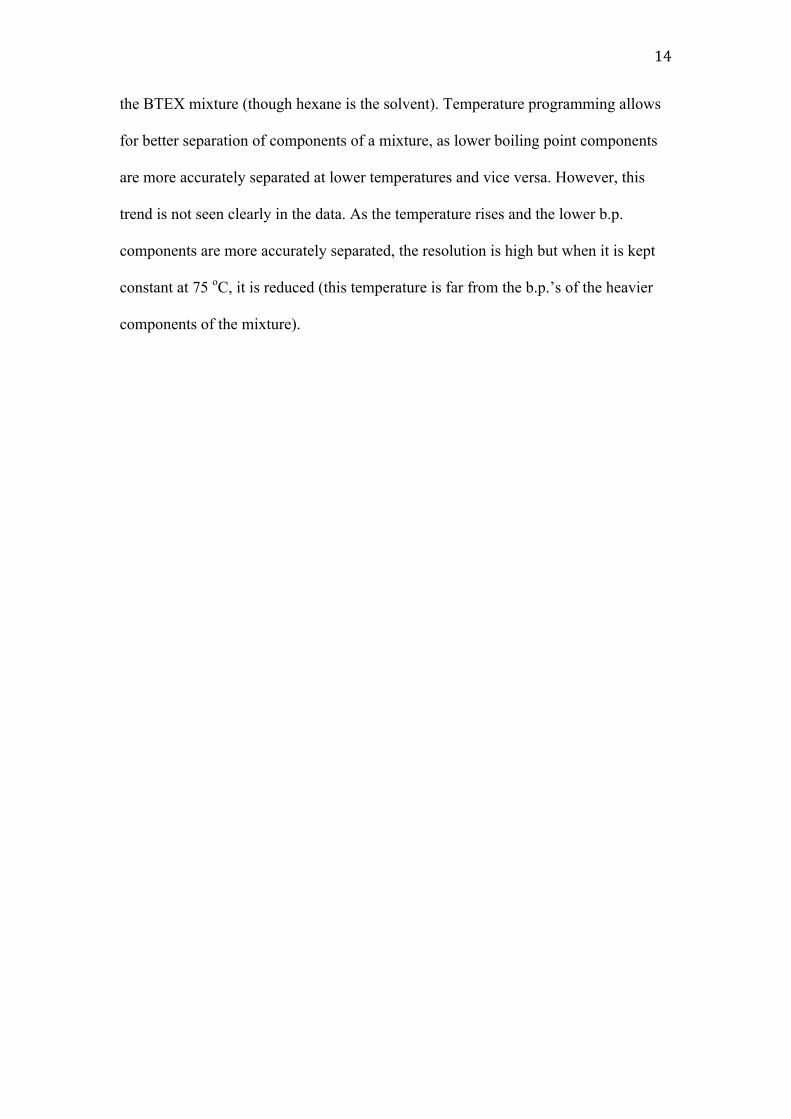
! *$!
the BTEX mixture (though hexane is the solvent). Temperature programming allows
for better separation of components of a mixture, as lower boiling point components
are more accurately separated at lower temperatures and vice versa. However, this
trend is not seen clearly in the data. As the temperature rises and the lower b.p.
components are more accurately separated, the resolution is high but when it is kept
constant at 75 oC, it is reduced (this temperature is far from the b.p.’s of the heavier
components of the mixture).
! *%!
---------------- Section 3 ----------------
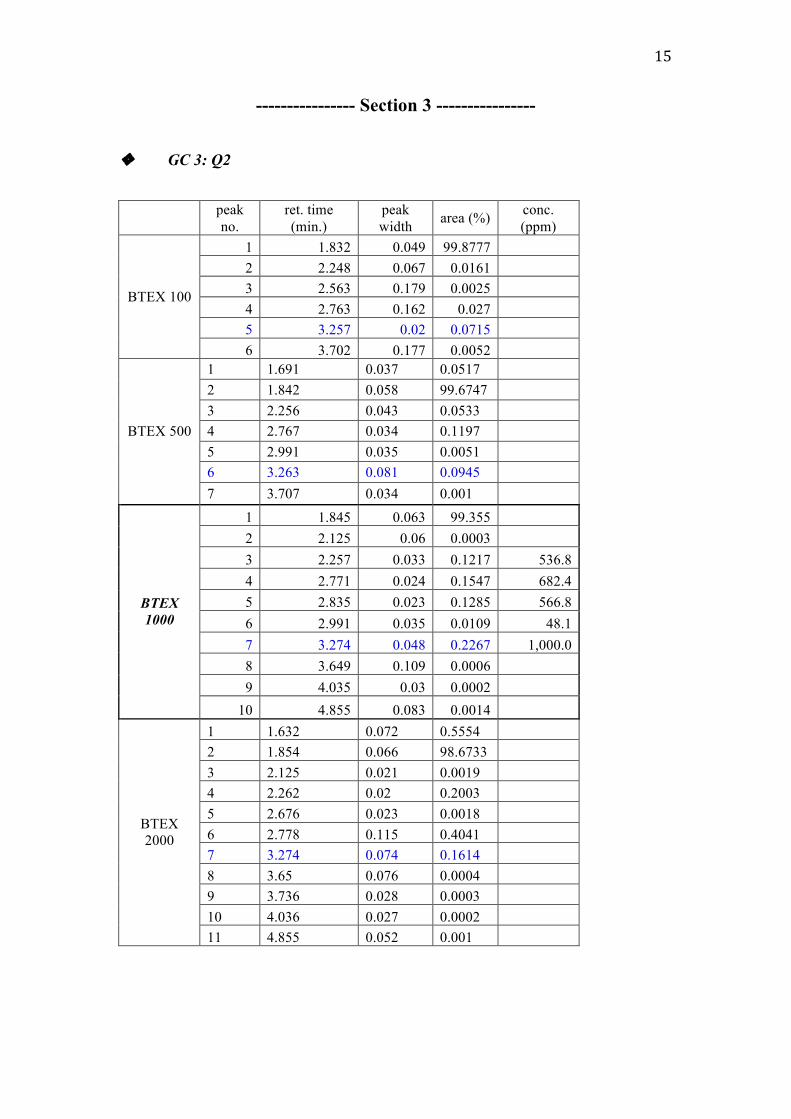
! GC 3: Q2
peak
no.
ret. time
(min.)
peak
width area (%)
conc.
(ppm)
1 1.832 0.049 99.8777
2 2.248 0.067 0.0161
3 2.563 0.179 0.0025
4 2.763 0.162 0.027
5 3.257 0.02 0.0715
BTEX 100
6 3.702 0.177 0.0052
1 1.691 0.037 0.0517
2 1.842 0.058 99.6747
3 2.256 0.043 0.0533
4 2.767 0.034 0.1197
5 2.991 0.035 0.0051
6 3.263 0.081 0.0945
BTEX 500
7 3.707 0.034 0.001
1 1.845 0.063 99.355
2 2.125 0.06 0.0003
3 2.257 0.033 0.1217 536.8
4 2.771 0.024 0.1547 682.4
5 2.835 0.023 0.1285 566.8
6 2.991 0.035 0.0109 48.1
7 3.274 0.048 0.2267 1,000.0
8 3.649 0.109 0.0006
9 4.035 0.03 0.0002
BTEX
1000
10 4.855 0.083 0.0014
1 1.632 0.072 0.5554
2 1.854 0.066 98.6733
3 2.125 0.021 0.0019
4 2.262 0.02 0.2003
5 2.676 0.023 0.0018
6 2.778 0.115 0.4041
7 3.274 0.074 0.1614
8 3.65 0.076 0.0004
9 3.736 0.028 0.0003
10 4.036 0.027 0.0002
BTEX
2000
11 4.855 0.052 0.001
! *&!
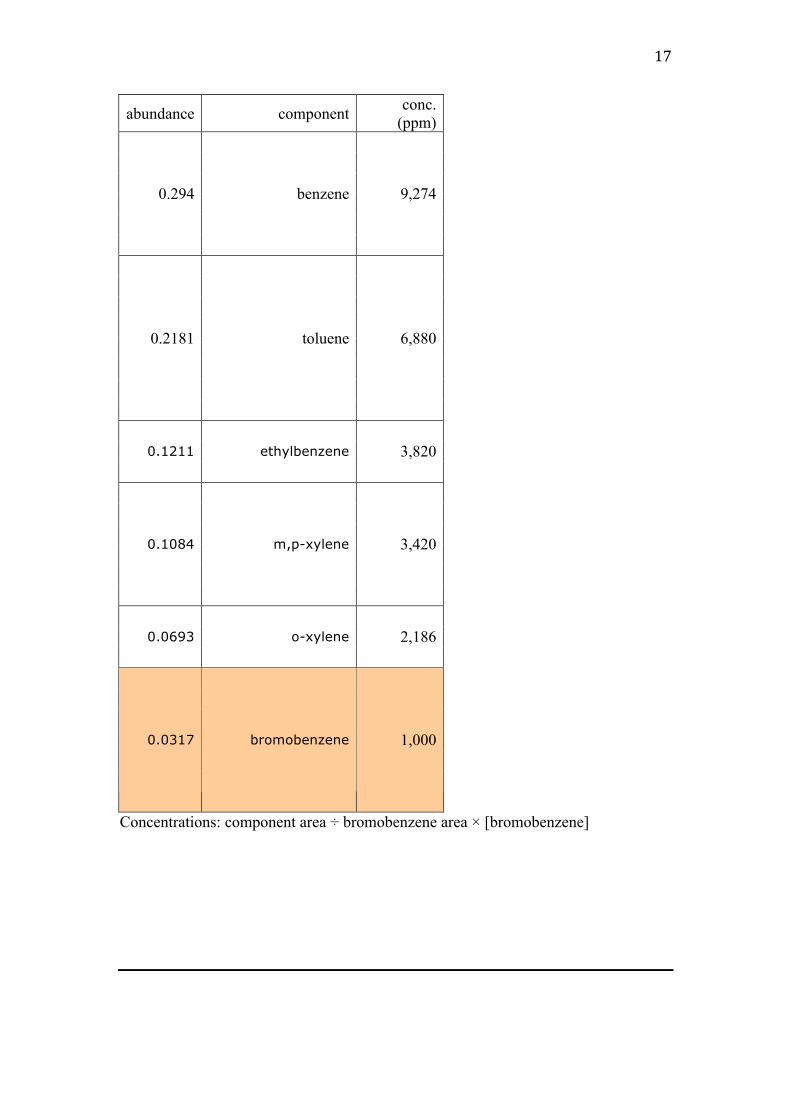
The 1000 ppm sample of BTEX was deemed to provide the best resolution and was
therefore used in calculating the concentrations of the constituents of BTEX (based on
the known concentration of the bromobezene internal standard of 1000 ppm, as shown
previously).
" Benzene: 536.8 ppm
" Toluene: 682.4 ppm (27 % higher than calculated earlier)
" Ethylbenzene + m/p xylenes: 566.8 ppm (due to their approximate b.p.’s, they
could not be resolved)
" o-xylene: 48.1 ppm
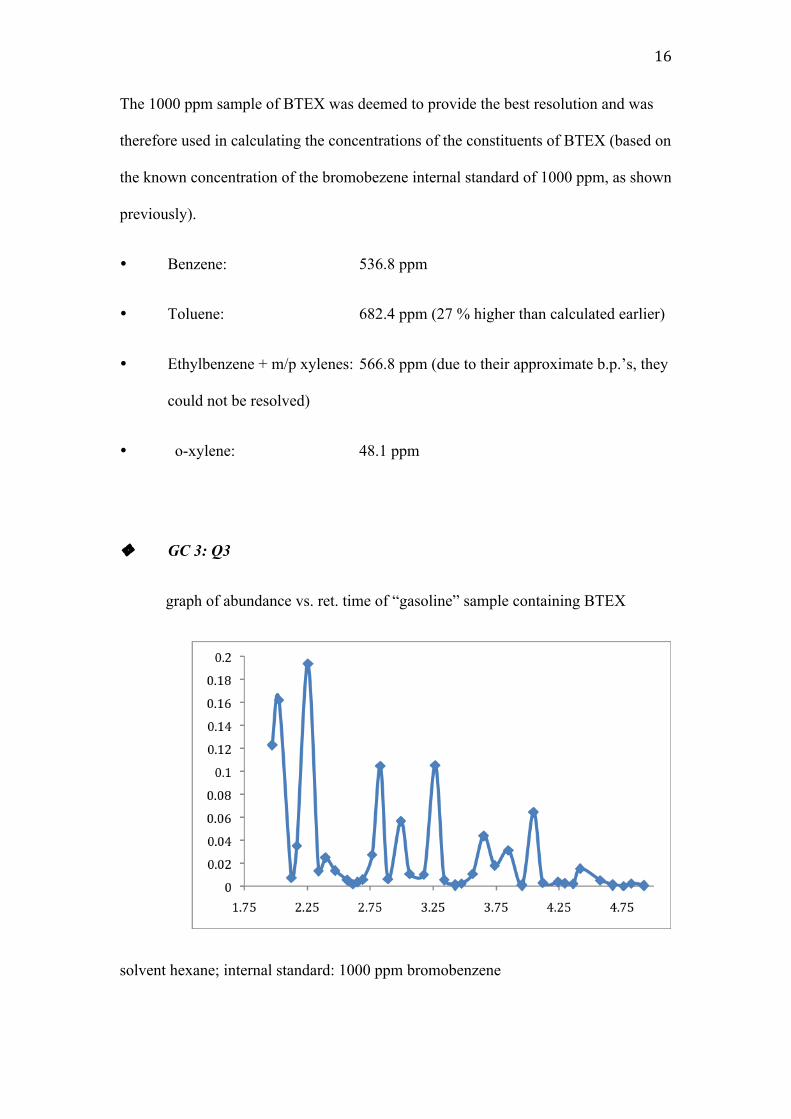
! GC 3: Q3
graph of abundance vs. ret. time of “gasoline” sample containing BTEX
solvent hexane; internal standard: 1000 ppm bromobenzene
! *'!
abundance component conc.
(ppm)
0.294 benzene 9,274
0.2181 toluene 6,880
0.1211 ethylbenzene 3,820
0.1084 m,p-xylene 3,420
0.0693 o-xylene 2,186
0.0317 bromobenzene 1,000
Concentrations: component area ÷ bromobenzene area ! [bromobenzene]
! *(!
DISCUSSION:
---------------- Section 1 ----------------
! GC 1: Q2
Generally, the greater the molecular weight of the molecule, the higher its
boiling point (b.p.) and the longer its retention time, since the molecule is not so much
in the more mobile gaseous phase.
! GC 1: Q5
o-xylene was relatively easier to separate from the the meta and para forms;
but the meta and para forms of xylene were more difficult to separate from
ethylbenzene since there is a lesser difference amongst the boiling points of these than
with o-xylene.
---------------- Section 3 ----------------
! GC 3: Q1
An internal standard is used as a reference; it is a substance, the relevant
characteristics, properties of which are known quantifiably. Signals and readings of
unknowns are measured against those of the standard, the concentration of which e.g.
is known, and so the concentration of the unknown may calculated by ratios.
! *)!
CONCLUSION:
It was observed that the ret. times were proportional to the boiling points of
the compounds tested. The variation of carrier gas flow rate saw 40 cm/s to be the
most viable rate, providing the lowest H-value. By varying the temperatures, it was
determined that resolution was raised slightly as lower boiling fractions e.g. hexanes
and bezene were prevented from contributing to the chromatogram. Lastly, the
concentrations of the constituents of BTEX were, against the 1000 ppm
bromobenzene internal standard, measure to be benzene: 536.8 ppm, toluene: 682.4
ppm (inaccurate), ethylene + m,p-xylenes: 566.8 ppm (b.p.’s are to close to be
resolved) and o-xylene: 48.1 ppm. The concentrations of these components in the
gasoline sample were 9274 ppm of benzene, 6880 ppm of toluene, 3820 ppm of
ethylbenzene, 3420 ppm of m/p-xylene, 2186 ppm of o-xylene.
Top Related