


Languages
Pages
Legal


Galena USD #499
i
• Budget General Information (characteristics of district)
• Supplemental Information for Tables in Summary of Expenditures
• KSDE Website Information Available
• Summary of Expenditures (Sumexpen.xlsx)
1
2014-15 Budget General Information USD #: 499
Introduction
Unified School District #499 covers 13.5 square miles and is one of the smallest school districts in Kansas. The school district's valuation as of July 1, 2013 was $13,547,883. The District is committed to ensuring that every student attains a high level of academic achievement. The stakeholders of the Galena School District are committed to providing a comprehensive system of support to ensure that this occurs for all children.
Board Members Michael Gibson 4274 SE 105th Ave., Galena, KS 620-783-5977 President Denise Titus P. O. Box 363, Galena, KS 620-783-5524 Vice-President David Ryan 217 West 19th St., Galena, KS 620-783-5550 Member Lawrence Miller 1822 Short St., Galena, KS 620-783-5025 Member Don Noe 2638 Hickory Hills Rd., Galena, KS 620-783-5781 Member William Van Cleave 2414 Bartlett St., Galena, KS 620-783-5898 Member Troy Wade 2907 Shoal Creek Ridge, Galena, KS 620-783-1355 Member
Key Staff Superintendent: Dr. Brian D. Smith Business Office Staff: Ray Holden, Sharon Anderson, Stacy Barker Curriculum & Instruction Staff: Toby Van Cleave Other Key Contacts: Technology - Jason Grotheer, Federal Programs - Susan New, Assessment Coordinator - Toby Van Cleave, Board Clerk - Sharon Anderson, Business Manager - Ray Holden, Director of Maintenance - Dave Clarkson, School Nurse - Amy Price
The District’s Accomplishments and Challenges Accomplishments: The district implemented several new programs during the 2012-13 school year. An after-school program, The Learning Zone, was established that provides supplemental learning opportunities for students above and beyond the regular school day. This program has been a huge success. The purpose of the program is to supplement areas of the curriculum that have suffered because of the emphasis on math and reading assessment scores by the state and federal governments. The district also offers a summer breakfast and lunch program that provides free lunches for any child between the ages of 1 to 18 during the summer months when school is not in session. The district also passed a bond issue in June of 2013. Construction will be completed on the facilities during the 2014-15 school year. The additions will include four classrooms, an athletic center, and storm shelters.

2
Challenges: Our greatest challenge is overcoming the obstacles that are associated with poverty. The socio-economic barriers for a majority of our students make learning more difficult. Many of our students lack access to learning and cultural opportunities that students from wealthier districts take for granted. Supplemental Information for the Following Tables 1. Summary of Total Expenditures by Function (All Funds) 2. Summary of General Fund Expenditures by Function 3. Summary of Supplemental General Fund Expenditures by Function 4. Summary of General and Supplemental General Fund Expenditures by Function 5. Summary of Special Education Fund by Function 6. Instruction Expenditures (1000) 7. Student Support Expenditures (2100)
8. Instructional Support Expenditures (2200) 9. General Administration Expenditures (2300) 10. School Administration Expenditures (2400)
11. Central Services Expenditures (2500) 12. Operations and Maintenance Expenditures (2600)
13. Transportation Expenditures (2700) 14. Other Support Services Expenditures (2900)
15. Food Service Expenditures (3100)
16. Community Services Operations (3300) 17. Capital Improvements (4000) 18. Debt Services (5100)
19. Miscellaneous Information – Transfers (5200) 20. Miscellaneous Information Unencumbered Cash Balance by Fund 21. Reserve Funds Unencumbered Cash Balance 22. Other Information – Enrollment Information

3
23. Miscellaneous Information Mill Rates by Fund 24. Other Information – Assessed Valuation and Bonded Indebtedness Note: The FTE (full time equivalency) used in this report to calculate the “Amount Per Pupil” is defined as following: Enrollment (FTE) includes the enrollment of the district used for state aid and budget authority, and all other preschool enrollment and kindergarten students attending full time.

4
KSDE Website Information Available K-12 Statistics (Building, District or State Totals) http://svapp15586.ksde.org/k12/k12.aspx
• Attendance / Enrollment Reports • Staff Reports • Graduates / Dropouts Reports • Crime / Violence Reports
School Finance Reports and Publications http://www.ksde.org/Agency/FiscalandAdministrativeServices/SchoolFinance/ReportsandPublications.aspx
• Assessed Valuation • Cash Balances • Headcount Enrollment • Mill Levies • Personnel (Certified/Non-Certified) • Salary Reports
Kansas Building Report Card http://svapp15586.ksde.org/rcard/
• Attendance Rate • Graduation Rate • Dropout Rate • School Violence • Assessments
o Reading o Mathematics o Writing
• Graduates Passing Adv. Science Courses • Graduates Passing Adv. Math Courses

USD# 499
Summary of Total Expenditures By Function (All Funds)
% % % % %
2012-2013 of 2013-2014 of inc/ 2014-2015 of inc/
Actual Tot Actual Tot dec Budget Tot dec
Instruction 6,298,579 63% 6,520,850 63% 4% 7,238,951 64% 11%
Student Support Services 224,828 2% 226,985 2% 1% 223,702 2% -1%
Instructional Support Services 196,961 2% 164,637 2% -16% 184,571 2% 12%
Administration & Support 960,608 10% 1,059,003 10% 10% 1,090,734 10% 3%
Operations & Maintenance 1,026,401 10% 975,444 9% -5% 1,029,696 9% 6%
Transportation 208,439 2% 217,313 2% 4% 235,321 2% 8%
Food Services 521,054 5% 531,112 5% 2% 620,636 6% 17%
Capital Improvements 217,580 2% 158,138 2% -27% 285,000 3% 80%
Debt Services 266,650 3% 441,493 4% 66% 323,095 3% -27%
Other Costs 0 0% 0 0% 0% 0 0% 0%
Total Expenditures* 9,921,100 100% 10,294,975 100% 4% 11,231,706 100% 9%
Amount per Pupil $13,228 $13,819 4% $14,976 8%
Current Expenditures** 9,400,260 100% 9,694,913 100% 3% 10,223,611 100% 5%
Amount per Pupil $12,534 $13,013 4% $13,631 5%
Instruction*** (Total Expenditures) 6,239,804 63% 6,519,919 63% 0% 6,888,951 61% -2%
Instruction*** (Current Expenditures) 6,239,804 66% 6,519,919 67% 1% 6,888,951 67% 0%
Note: Percentages on charts are within +-1% due to rounding used. Pie graph percentages may differ from charts for this reason also.
Further definition of what goes into each category:
Instruction - 1000 Transportation - 2700
Student Support Services - 2100 Food Service - 3100
Instructional Support Services - 2200 Other Costs - 2900 and 3300
Administration & Support - 2300, 2400 and 2500 Capital Improvements - 4000
Operations & Maintenance - 2600 Debt Services - 5100
Transfers - 5200
Percent of Expenditures
* The funds that are included in the categories above are: General, Supplemental General, Bilingual Education, At Risk(4yr Old), At Risk(K-12), Virtual Education, Capital
Outlay, Driver Education, Extraordinary School Program, Summer School, Special Education, Vocational Education, Professional Development, Bond & Interest #1, Bond &
Interest #2, No-Fund Warrant, Special Assessment, Parent Education, School Retirement, Student Materials Revolving & Textbook Rental, Tuition Reimbursement,
Gifts/Grants, KPERS Special Retirement Contribution, Contingency, Special Liability Expense, Federal Funds, Adult Education, Adult Supplemental Education, Activity Fund
and Special Education Coop Fund.
*** Instruction excludes Capital Outlay and Bond Debt expenditures (Code 16, Code 62, Code 63)
** Current Spending excludes Capital Outlay and Bond Debt expenditures (Code 16, Code 62, Code 63)
0
1,000,000
2,000,000
3,000,000
4,000,000
5,000,000
6,000,000
7,000,000
8,000,000 7,238,951
223,702 184,571 1,090,734 1,029,696
235,321 620,636 285,000 323,095 0
Summary of Total Expenditures by Function (All Funds)
2012-2013
2013-2014
2014-2015
Instruction 64%
Student Support Services
2%
Instructional Support 2%
Administration & Support 10%
Operations & Maintenance 9%
Transportation 2%
Food Services 5%
Capital Improvements 3% Debt
Services 3%
2014-15 Summary of Total Expenditures by Function
Instruction
Student Support Services
Instructional Support
Administration & Support
Operations & Maintenance
Transportation
Food Services
Capital Improvements
Debt Services
Other Costs
9/11/2014 9:25 AM Sumexpen.xlsx Page 1 of 30
USD# 499
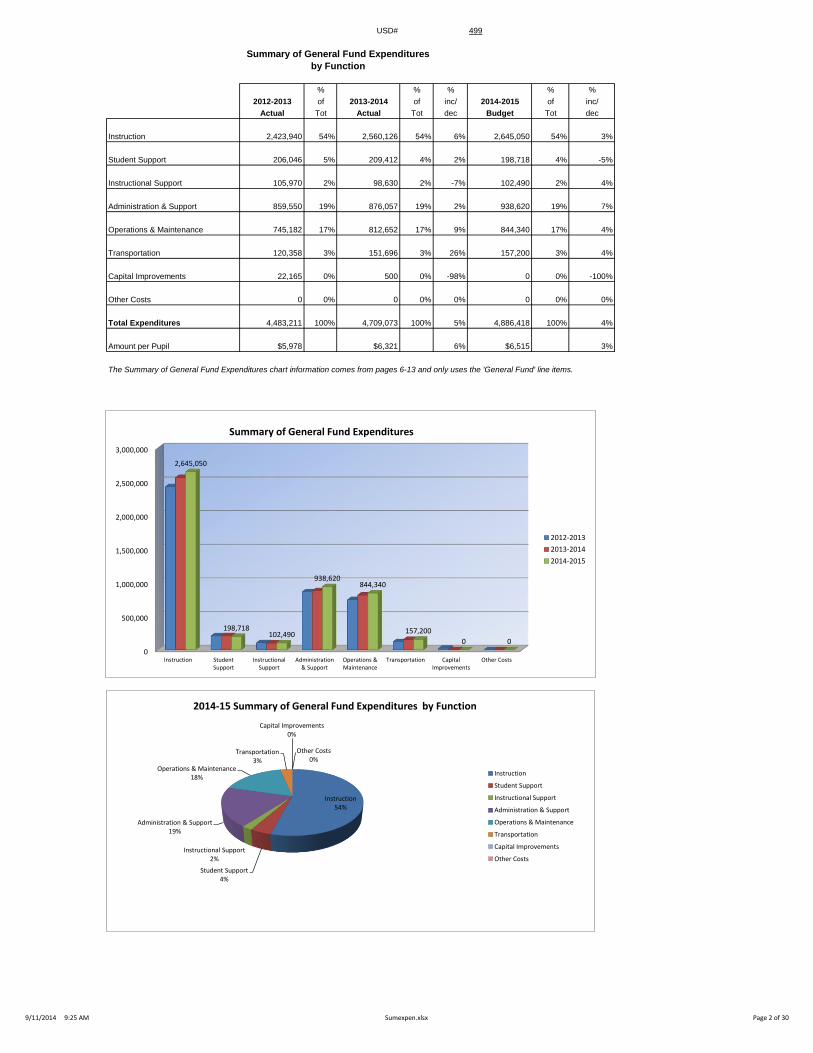
Summary of General Fund Expenditures
by Function
% % % % %
2012-2013 of 2013-2014 of inc/ 2014-2015 of inc/
Actual Tot Actual Tot dec Budget Tot dec
Instruction 2,423,940 54% 2,560,126 54% 6% 2,645,050 54% 3%
Student Support 206,046 5% 209,412 4% 2% 198,718 4% -5%
Instructional Support 105,970 2% 98,630 2% -7% 102,490 2% 4%
Administration & Support 859,550 19% 876,057 19% 2% 938,620 19% 7%
Operations & Maintenance 745,182 17% 812,652 17% 9% 844,340 17% 4%
Transportation 120,358 3% 151,696 3% 26% 157,200 3% 4%
Capital Improvements 22,165 0% 500 0% -98% 0 0% -100%
Other Costs 0 0% 0 0% 0% 0 0% 0%
Total Expenditures 4,483,211 100% 4,709,073 100% 5% 4,886,418 100% 4%
Amount per Pupil $5,978 $6,321 6% $6,515 3%
The Summary of General Fund Expenditures chart information comes from pages 6-13 and only uses the 'General Fund' line items.
0
500,000
1,000,000
1,500,000
2,000,000
2,500,000
3,000,000
Instruction StudentSupport
InstructionalSupport
Administration& Support
Operations &Maintenance
Transportation CapitalImprovements
Other Costs
2,645,050
198,718 102,490
938,620 844,340
157,200
0 0
Summary of General Fund Expenditures
2012-2013
2013-2014
2014-2015
Instruction 54%
Student Support 4%
Instructional Support 2%
Administration & Support 19%
Operations & Maintenance 18%
Transportation 3%
Capital Improvements 0%
Other Costs 0%
2014-15 Summary of General Fund Expenditures by Function
Instruction
Student Support
Instructional Support
Administration & Support
Operations & Maintenance
Transportation
Capital Improvements
Other Costs
9/11/2014 9:25 AM Sumexpen.xlsx Page 2 of 30
USD# 499
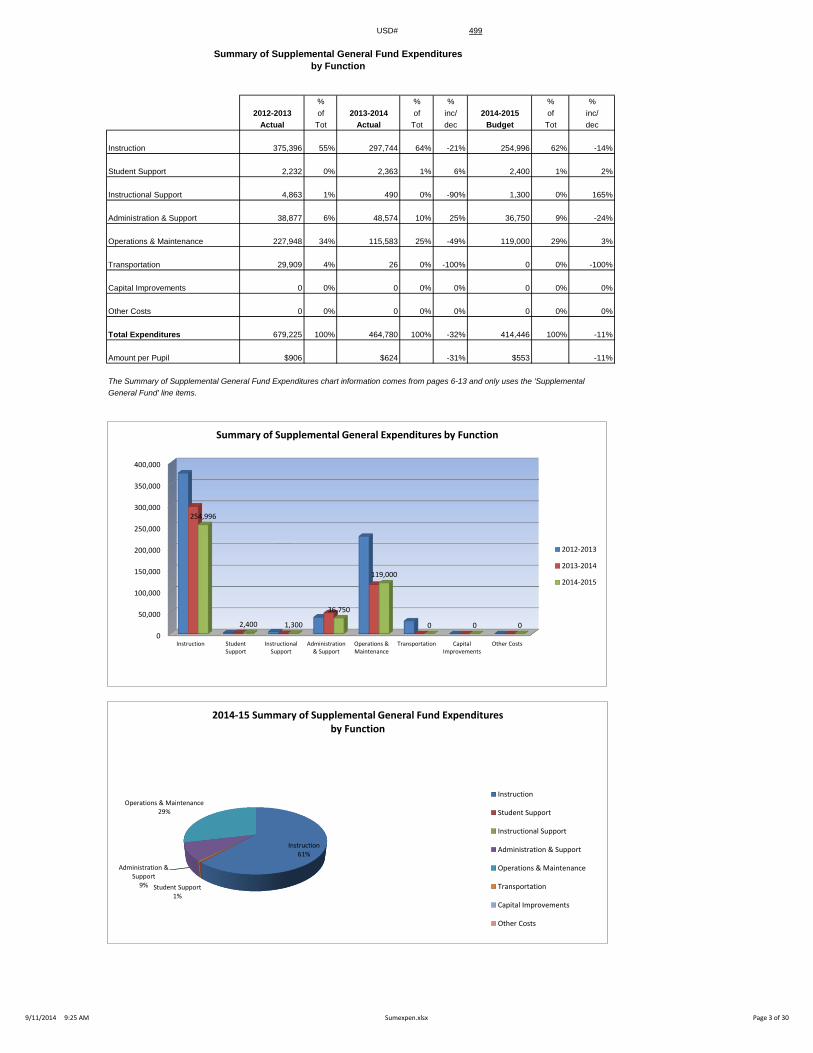
Summary of Supplemental General Fund Expenditures
by Function
% % % % %
2012-2013 of 2013-2014 of inc/ 2014-2015 of inc/
Actual Tot Actual Tot dec Budget Tot dec
Instruction 375,396 55% 297,744 64% -21% 254,996 62% -14%
Student Support 2,232 0% 2,363 1% 6% 2,400 1% 2%
Instructional Support 4,863 1% 490 0% -90% 1,300 0% 165%
Administration & Support 38,877 6% 48,574 10% 25% 36,750 9% -24%
Operations & Maintenance 227,948 34% 115,583 25% -49% 119,000 29% 3%
Transportation 29,909 4% 26 0% -100% 0 0% -100%
Capital Improvements 0 0% 0 0% 0% 0 0% 0%
Other Costs 0 0% 0 0% 0% 0 0% 0%
Total Expenditures 679,225 100% 464,780 100% -32% 414,446 100% -11%
Amount per Pupil $906 $624 -31% $553 -11%
The Summary of Supplemental General Fund Expenditures chart information comes from pages 6-13 and only uses the 'Supplemental
General Fund' line items.
0
50,000
100,000
150,000
200,000
250,000
300,000
350,000
400,000
Instruction StudentSupport
InstructionalSupport
Administration& Support
Operations &Maintenance
Transportation CapitalImprovements
Other Costs
254,996
2,400 1,300
36,750
119,000
0 0 0
Summary of Supplemental General Expenditures by Function
2012-2013
2013-2014
2014-2015
Instruction 61%
Student Support 1%
Administration & Support
9%
Operations & Maintenance 29%
2014-15 Summary of Supplemental General Fund Expenditures by Function
Instruction
Student Support
Instructional Support
Administration & Support
Operations & Maintenance
Transportation
Capital Improvements
Other Costs
9/11/2014 9:25 AM Sumexpen.xlsx Page 3 of 30

USD# 499
Summary of General and Supplemental General Fund
Expenditures by Function
% % % % %
2012-2013 of 2013-2014 of inc/ 2014-2015 of inc/
Actual Tot Actual Tot dec Budget Tot dec
Instruction 2,799,336 54% 2,857,870 55% 2% 2,900,046 55% 1%
Student Support 208,278 4% 211,775 4% 2% 201,118 4% -5%
Instructional Support 110,833 2% 99,120 2% -11% 103,790 2% 5%
Administration & Support 898,427 17% 924,631 18% 3% 975,370 18% 5%
Operations & Maintenance 973,130 19% 928,235 18% -5% 963,340 18% 4%
Transportation 150,267 3% 151,722 3% 1% 157,200 3% 4%
Capital Improvements 22,165 0% 500 0% -98% 0 0% -100%
Other Costs 0 0% 0 0% 0% 0 0% 0%
Total Expenditures 5,162,436 100% 5,173,853 100% 0% 5,300,864 100% 2%
Amount per Pupil $6,883 $6,945 1% $7,068 2%
The Summary of General and Supplemental General Fund Expenditures chart information comes from pages 6-13 and adds together
the 'General Fund' and 'Supplemental General Fund' line items.
0
500,000
1,000,000
1,500,000
2,000,000
2,500,000
3,000,000
Instruction StudentSupport
InstructionalSupport
Administration& Support
Operations &Maintenance
Transportation CapitalImprovements
Other Costs
2,7
99
,33
6
20
8,2
78
11
0,8
33
89
8,4
27
97
3,1
30
15
0,2
67
22
,16
5
0
2,8
57
,87
0
21
1,7
75
99
,12
0
92
4,6
31
92
8,2
35
15
1,7
22
50
0
0
2,9
00
,04
6
20
1,1
18
10
3,7
90
97
5,3
70
96
3,3
40
15
7,2
00
0
0
Summary of General and Supplemental General Fund Expenditures by Function
2012-2013
2013-2014
2014-2015
Instruction 55%
Student Support 4%
Instructional Support 2%
Administration & Support
18%
Operations & Maintenance 18%
Transportation 3%
2014-15 Summary of General and Supplemental General Fund Expenditures by Function
Instruction
Student Support
Instructional Support
Administration & Support
Operations & Maintenance
Transportation
Capital Improvements
Other Costs
9/11/2014 9:25 AM Sumexpen.xlsx Page 4 of 30

USD# 499
Summary of Special Education Fund
by Function
% % % % %
2012-2013 of 2013-2014 of inc/ 2014-2015 of inc/
Actual Tot Actual Tot dec Budget Tot dec
Instruction 962,652 95% 980,377 94% 2% 1,284,720 95% 31%
Student Support 0 0% 0 0% 0% 0 0% 0%
Instructional Support 417 0% 0 0% -100% 0 0% 0%
Administraton & Support 0 0% 0 0% 0% 0 0% 0%
Operations & Maintenance 0 0% 0 0% 0% 0 0% 0%
Transportation 48,319 5% 58,187 6% 20% 72,843 5% 25%
Capital Improvements 0 0% 0 0% 0% 0 0% 0%
Other Costs 0 0% 0 0% 0% 0 0% 0%
Total Expenditures 1,011,388 100% 1,038,564 100% 3% 1,357,563 100% 31%
Amount per Pupil $1,349 $1,394 3% $1,810 30%
The Summary of Special Education Fund Expenditures chart information comes from pages 6-13 and only uses the 'Special Education Fund'
line items. (Total expenditures excludes Special Ed Coop Fund because it would include expenditures for all schools participating in the Coop.)
0
200,000
400,000
600,000
800,000
1,000,000
1,200,000
1,400,000
Instruction StudentSupport
InstructionalSupport
Administraton& Support
Operations &Maintenance
Transportation CapitalImprovements
Other Costs
96
2,6
52
0 41
7
0
0 4
8,3
19
0
0
98
0,3
77
0
0
0
0 5
8,1
87
0
0
1,2
84
,72
0
0
0
0
0
72
,84
3
0
0
Summary of Special Education Fund Expenditures by Function
2012-2013
2013-2014
2014-2015
Instruction 95%
Transportation 5%
2014-15 Summary of Special Education Fund by Function
Instruction
Student Support
Instructional Support
Administraton & Support
Operations & Maintenance
Transportation
Capital Improvements
Other Costs
9/11/2014 9:25 AM Sumexpen.xlsx Page 5 of 30

USD# 499
Instruction Expenditures (1000)
% %
2012-2013 2013-2014 inc/ 2014-2015 inc/
Actual Actual dec Budget dec
General 2,423,940 2,560,126 6% 2,645,050 3%
Federal Funds 466,794 513,111 10% 429,784 -16%
Supplemental General 375,396 297,744 -21% 254,996 -14%
At Risk (4yr Old) 52,960 73,864 39% 87,650 19%
At Risk (K-12) 1,137,336 1,147,398 1% 1,199,500 5%
Bilingual Education 0 0 0% 0 0%
Virtual Education 4,000 0 -100% 10,000 0%
Capital Outlay 58,775 931 -98% 400,000 42865%
Driver Education 15,733 15,632 -1% 18,350 17%
Declining Enrollment 0 0 0% 0 0%
Extraordinary School Program 0 0 0% 0 0%
Food Service 0 0 0% 0 0%
Professional Development 0 0 0% 0 0%
Parent Education Program 0 0 0% 0 0%
Summer School 0 0 0% 0 0%
Special Education 962,652 980,377 2% 1,284,720 31%
Cost of Living 0 0 0% 0 0%
Vocational Education 257,080 334,183 30% 266,749 -20%
Gifts/Grants 215,578 203,573 -6% 205,521 1%
Special Liability 0 0 0% 0 0%
School Retirement 0 0 0% 0 0%
Extraordinary Growth Facilities 0 0 0% 0 0%
Special Reserve 0 0 0%
KPERS Spec. Ret. Contribution 306,884 370,614 21% 436,631 18%
Contingency Reserve 0 0 0%
Text Book & Student Material 0 50 0%
Activity Fund 21,451 23,247 8% 0 -100%
Bond and Interest #1 0 0 0% 0 0%
Bond and Interest #2 0 0 0% 0 0%
No-Fund Warrant 0 0 0% 0 0%
Special Assessment 0 0 0% 0 0%
Temporary Note 0 0 0% 0 0%
SUBTOTAL 6,298,579 6,520,850 4% 7,238,951 11%
Enrollment (FTE)* 750.0 745.0 -1% 750.0 1%
Amount per Pupil 8,398 8,753 4% 9,652 10%
Adult Education 0 0 0% 0 0%
Adult Supplemental Education 0 0 0% 0 0%
Tuition Reimbursement 0 0 0% 0 0%
Special Education Coop 0 0 0% 0 0%
TOTAL 6,298,579 6,520,850 4% 7,238,951 11%
NOTE: Gifts/Grants includes private grants and grants from nonfederal sources.
Amount per pupil excludes the following funds: Adult Education, Adult Supplemental Education, Special Education Coop
and Tuition Reimbursement.
*Enrollment (FTE) includes the enrollment of the district used for state aid and budget authority, and all other preschool enrollment
and kindergarten students attending full time.
0
500,000
1,000,000
1,500,000
2,000,000
2,500,000
3,000,000
2012-2013 2013-2014 2014-2015
2,423,940 2,560,126 2,645,050
375,396 297,744 254,996
962,652 980,377 1,284,720
Instruction Expenditures
GeneralSupplemental GeneralSpecial Education
5,800,000
6,000,000
6,200,000
6,400,000
6,600,000
6,800,000
7,000,000
7,200,000
7,400,000
2012-2013 2013-2014 2014-2015
6,298,579
6,520,850
7,238,951
Instruction Expenditures
9/11/2014 9:25 AM Sumexpen.xlsx Page 6 of 30
USD# 499
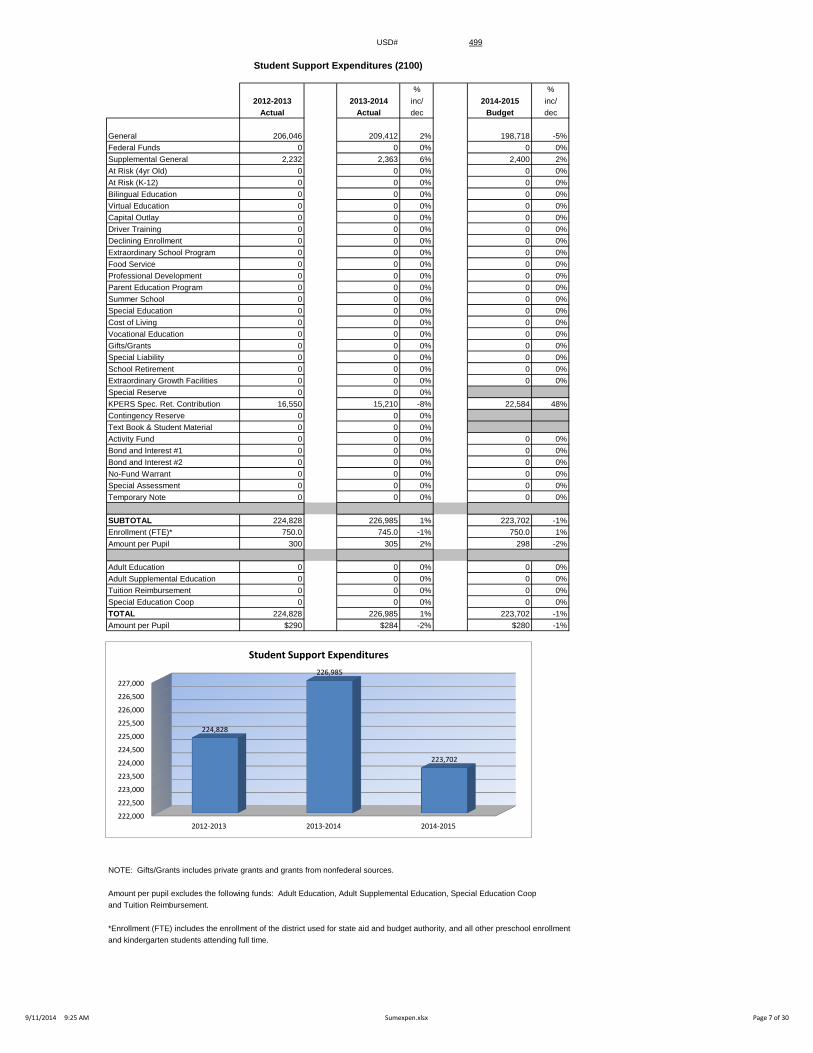
Student Support Expenditures (2100)
% %
2012-2013 2013-2014 inc/ 2014-2015 inc/
Actual Actual dec Budget dec
General 206,046 209,412 2% 198,718 -5%
Federal Funds 0 0 0% 0 0%
Supplemental General 2,232 2,363 6% 2,400 2%
At Risk (4yr Old) 0 0 0% 0 0%
At Risk (K-12) 0 0 0% 0 0%
Bilingual Education 0 0 0% 0 0%
Virtual Education 0 0 0% 0 0%
Capital Outlay 0 0 0% 0 0%
Driver Training 0 0 0% 0 0%
Declining Enrollment 0 0 0% 0 0%
Extraordinary School Program 0 0 0% 0 0%
Food Service 0 0 0% 0 0%
Professional Development 0 0 0% 0 0%
Parent Education Program 0 0 0% 0 0%
Summer School 0 0 0% 0 0%
Special Education 0 0 0% 0 0%
Cost of Living 0 0 0% 0 0%
Vocational Education 0 0 0% 0 0%
Gifts/Grants 0 0 0% 0 0%
Special Liability 0 0 0% 0 0%
School Retirement 0 0 0% 0 0%
Extraordinary Growth Facilities 0 0 0% 0 0%
Special Reserve 0 0 0%
KPERS Spec. Ret. Contribution 16,550 15,210 -8% 22,584 48%
Contingency Reserve 0 0 0%
Text Book & Student Material 0 0 0%
Activity Fund 0 0 0% 0 0%
Bond and Interest #1 0 0 0% 0 0%
Bond and Interest #2 0 0 0% 0 0%
No-Fund Warrant 0 0 0% 0 0%
Special Assessment 0 0 0% 0 0%
Temporary Note 0 0 0% 0 0%
SUBTOTAL 224,828 226,985 1% 223,702 -1%
Enrollment (FTE)* 750.0 745.0 -1% 750.0 1%
Amount per Pupil 300 305 2% 298 -2%
Adult Education 0 0 0% 0 0%
Adult Supplemental Education 0 0 0% 0 0%
Tuition Reimbursement 0 0 0% 0 0%
Special Education Coop 0 0 0% 0 0%
TOTAL 224,828 226,985 1% 223,702 -1%
Amount per Pupil $290 $284 -2% $280 -1%
NOTE: Gifts/Grants includes private grants and grants from nonfederal sources.
Amount per pupil excludes the following funds: Adult Education, Adult Supplemental Education, Special Education Coop
and Tuition Reimbursement.
*Enrollment (FTE) includes the enrollment of the district used for state aid and budget authority, and all other preschool enrollment
and kindergarten students attending full time.
222,000
222,500
223,000
223,500
224,000
224,500
225,000
225,500
226,000
226,500
227,000
2012-2013 2013-2014 2014-2015
224,828
226,985
223,702
Student Support Expenditures
9/11/2014 9:25 AM Sumexpen.xlsx Page 7 of 30

USD# 499
Instructional Support Expenditures (2200)
% %
2012-2013 2013-2014 inc/ 2014-2015 inc/
Actual Actual dec Budget dec
General 105,970 98,630 -7% 102,490 4%
Federal Funds 54,217 28,498 -47% 19,690 -31%
Supplemental General 4,863 490 -90% 1,300 165%
At Risk (4yr Old) 0 0 0% 0 0%
At Risk (K-12) 0 0 0% 0 0%
Bilingual Education 0 0 0% 0 0%
Virtual Education 0 0 0% 0 0%
Capital Outlay 0 0 0% 0 0%
Driver Training 0 0 0% 0 0%
Declining Enrollment 0 0 0% 0 0%
Extraordinary School Program 0 0 0% 0 0%
Food Service 0 0 0% 0 0%
Professional Development 24,509 28,568 17% 51,077 79%
Parent Education Program 0 0 0% 0 0%
Summer School 0 0 0% 0 0%
Special Education 417 0 -100% 0 0%
Cost of Living 0 0 0% 0 0%
Vocational Education 0 0 0% 0 0%
Gifts/Grants 157 0 -100% 0 0%
Special Liability 0 0 0% 0 0%
School Retirement 0 0 0% 0 0%
Extraordinary Growth Facilities 0 0 0% 0 0%
Special Reserve 0 0 0%
KPERS Spec. Ret. Contribution 6,828 8,451 24% 10,014 18%
Contingency Reserve 0 0 0%
Text Book & Student Material 0 0 0%
Activity Fund 0 0 0% 0 0%
Bond and Interest #1 0 0 0% 0 0%
Bond and Interest #2 0 0 0% 0 0%
No-Fund Warrant 0 0 0% 0 0%
Special Assessment 0 0 0% 0 0%
Temporary Note 0 0 0% 0 0%
SUBTOTAL 196,961 164,637 -16% 184,571 12%
Enrollment (FTE)* 750.0 745.0 -1% 750.0 1%
Amount per Pupil 263 221 -16% 246 11%
Adult Education 0 0 0% 0 0%
Adult Supplemental Education 0 0 0% 0 0%
Tuition Reimbursement 0 0 0% 0 0%
Special Education Coop 0 0 0% 0 0%
TOTAL 196,961 164,637 -16% 184,571 12%
Amount per Pupil $263 $221 -16% $246 11%
NOTE: Gifts/Grants includes private grants and grants from nonfederal sources.
Amount per pupil excludes the following funds: Adult Education, Adult Supplemental Education, Special Education Coop
and Tuition Reimbursement.
*Enrollment (FTE) includes the enrollment of the district used for state aid and budget authority, and all other preschool enrollment
and kindergarten students attending full time.
145,000
150,000
155,000
160,000
165,000
170,000
175,000
180,000
185,000
190,000
195,000
200,000
2012-2013 2013-2014 2014-2015
196,961
164,637
184,571
Instructional Support Expenditures
9/11/2014 9:25 AM Sumexpen.xlsx Page 8 of 30

USD# 499
General Administration Expenditures (2300)
% %
2012-2013 2013-2014 inc/ 2014-2015 inc/
Actual Actual dec Budget dec
General 188,048 189,699 1% 235,120 24%
Federal Funds 2,000 2,000 0% 2,000 0%
Supplemental General 30,249 37,942 25% 26,750 -29%
At Risk (4yr Old) 0 0 0% 0 0%
At Risk (K-12) 0 0 0% 0 0%
Bilingual Education 0 0 0% 0 0%
Virtual Education 0 0 0% 0 0%
Capital Outlay 0 0 0% 0 0%
Driver Training 0 0 0% 0 0%
Declining Enrollment 0 0 0% 0 0%
Extraordinary School Program 0 0 0% 0 0%
Food Service 0 0 0% 0 0%
Professional Development 0 0 0% 0 0%
Parent Education Program 0 0 0% 0 0%
Summer School 0 0 0% 0 0%
Special Education 0 0 0% 0 0%
Cost of Living 0 0 0% 0 0%
Vocational Education 0 0 0% 0 0%
Gifts/Grants 0 64,437 0% 24,969 -61%
Special Liability Expense 0 0 0% 0 0%
School Retirement 0 0 0% 0 0%
Extraordinary Growth Facilities 0 0 0% 0 0%
Special Reserve 0 0 0%
KPERS Spec. Ret. Contribution 10,716 7,417 -31% 18,673 152%
Contingency Reserve 0 0 0%
Text Book & Student Material 0 0 0%
Activity Fund 0 0 0% 0 0%
Bond and Interest #1 0 0 0% 0 0%
Bond and Interest #2 0 0 0% 0 0%
No-Fund Warrant 0 0 0% 0 0%
Special Assessment 0 0 0% 0 0%
Temporary Note 0 0 0% 0 0%
SUBTOTAL 231,013 301,495 31% 307,512 2%
Enrollment (FTE)* 750.0 745.0 -1% 750.0 1%
Amount per Pupil 308 405 31% 410 1%
Adult Education 0 0 0% 0 0%
Adult Supplemental Education 0 0 0% 0 0%
Tuition Reimbursement 0 0 0% 0 0%
Special Education Coop 0 0 0% 0 0%
TOTAL 231,013 301,495 31% 307,512 2%
NOTE: Gifts/Grants includes private grants and grants from nonfederal sources.
Amount per pupil excludes the following funds: Adult Education, Adult Supplemental Education, Special Education Coop
and Tuition Reimbursement.
*Enrollment (FTE) includes the enrollment of the district used for state aid and budget authority, and all other preschool enrollment
and kindergarten students attending full time.
0
50,000
100,000
150,000
200,000
250,000
300,000
350,000
2012-2013 2013-2014 2014-2015
231,013
301,495 307,512
General Administration Expenditures
9/11/2014 9:25 AM Sumexpen.xlsx Page 9 of 30

USD# 499
School Administration Expenditures (2400)
% %
2012-2013 2013-2014 inc/ 2014-2015 inc/
Actual Actual dec Budget dec
General 557,999 566,692 2% 582,100 3%
Federal Funds 0 0 0% 0 0%
Supplemental General 8,628 10,632 23% 10,000 -6%
At Risk (4yr Old) 0 0 0% 0 0%
At Risk (K-12) 0 0 0% 0 0%
Bilingual Education 0 0 0% 0 0%
Virtual Education 0 0 0% 0 0%
Capital Outlay 0 0 0% 0 0%
Driver Training 0 0 0% 0 0%
Declining Enrollment 0 0 0% 0 0%
Extraordinary School Program 0 0 0% 0 0%
Food Service 0 0 0% 0 0%
Professional Development 0 0 0% 0 0%
Parent Education Program 0 0 0% 0 0%
Summer School 0 0 0% 0 0%
Special Education 0 0 0% 0 0%
Cost of Living 0 0 0% 0 0%
Vocational Education 0 0 0% 0 0%
Gifts/Grants 0 0 0% 0 0%
Special Liability Expense 0 0 0% 0 0%
School Retirement 0 0 0% 0 0%
Extraordinary Growth Facilities 0 0 0% 0 0%
Special Reserve 0 0 0%
KPERS Spec. Ret. Contribution 40,943 51,118 25% 58,474 14%
Contingency Reserve 0 0 0%
Text Book & Student Material 0 0 0%
Activity Fund 0 0 0% 0 0%
Bond and Interest #1 0 0 0% 0 0%
Bond and Interest #2 0 0 0% 0 0%
No-Fund Warrant 0 0 0% 0 0%
Special Assessment 0 0 0% 0 0%
Temporary Note 0 0 0% 0 0%
SUBTOTAL 607,570 628,442 3% 650,574 4%
Enrollment (FTE)* 750.0 745.0 -1% 750.0 1%
Amount per Pupil 810 844 4% 867 3%
Adult Education 0 0 0% 0 0%
Adult Supplemental Education 0 0 0% 0 0%
Tuition Reimbursement 0 0 0% 0 0%
Special Education Coop 0 0 0% 0 0%
TOTAL 607,570 628,442 3% 650,574 4%
NOTE: Gifts/Grants includes private grants and grants from nonfederal sources.
Amount per pupil excludes the following funds: Adult Education, Adult Supplemental Education, Special Education Coop
and Tuition Reimbursement.
*Enrollment (FTE) includes the enrollment of the district used for state aid and budget authority, and all other preschool enrollment
and kindergarten students attending full time.
580,000
590,000
600,000
610,000
620,000
630,000
640,000
650,000
660,000
2012-2013 2013-2014 2014-2015
607,570
628,442
650,574
School Administration Expenditures
9/11/2014 9:25 AM Sumexpen.xlsx Page 10 of 30

USD# 499
Central Services Expenditures (2500)
% %
2012-2013 2013-2014 inc/ 2014-2015 inc/
Actual Actual dec Budget dec
General 113,503 119,666 5% 121,400 1%
Federal Funds 0 0 0% 0 0%
Supplemental General 0 0 0% 0 0%
At Risk (4yr Old) 0 0 0% 0 0%
At Risk (K-12) 0 0 0% 0 0%
Bilingual Education 0 0 0% 0 0%
Virtual Education 0 0 0% 0 0%
Capital Outlay 0 0 0% 0 0%
Driver Training 0 0 0% 0 0%
Declining Enrollment 0 0 0% 0 0%
Extraordinary School Program 0 0 0% 0 0%
Food Service 0 0 0% 0 0%
Professional Development 0 0 0% 0 0%
Parent Education Program 0 0 0% 0 0%
Summer School 0 0 0% 0 0%
Special Education 0 0 0% 0 0%
Cost of Living 0 0 0% 0 0%
Vocational Education 0 0 0% 0 0%
Gifts/Grants 0 0 0% 0 0%
Special Liability 0 0 0% 0 0%
School Retirement 0 0 0% 0 0%
Extraordinary Growth Facilities 0 0 0% 0 0%
Special Reserve 0 0 0%
KPERS Spec. Ret. Contribution 8,522 9,400 10% 11,248 20%
Contingency Reserve 0 0 0%
Text Book & Student Material 0 0 0%
Activity Fund 0 0 0% 0 0%
Bond & Interest #1 0 0 0% 0 0%
Bond & Interest #2 0 0 0% 0 0%
No-Fund Warrant 0 0 0% 0 0%
Special Assessment 0 0 0% 0 0%
Temporary Note 0 0 0% 0 0%
SUBTOTAL 122,025 129,066 6% 132,648 3%
Enrollment (FTE)* 750.0 745.0 -1% 750.0 1%
Amount per Pupil 163 173 6% 177 2%
Adult Education 0 0 0% 0 0%
Adult Supplemental Education 0 0 0% 0 0%
Tuition Reimbursement 0 0 0% 0 0%
Special Education Coop 0 0 0% 0 0%
TOTAL 122,025 129,066 6% 132,648 3%
NOTE: Gifts/Grants includes private grants and grants from nonfederal sources.
Amount per pupil excludes the following funds: Adult Education, Adult Supplemental Education, Special Education Coop
and Tuition Reimbursement.
*Enrollment (FTE) includes the enrollment of the district used for state aid and budget authority, and all other preschool enrollment
and kindergarten students attending full time.
116,000
118,000
120,000
122,000
124,000
126,000
128,000
130,000
132,000
134,000
2012-2013 2013-2014 2014-2015
122,025
129,066
132,648
Central Services Expenditures
9/11/2014 9:25 AM Sumexpen.xlsx Page 11 of 30

USD# 499
Operations and Maintenance Expenditures (2600)
% %
2012-2013 2013-2014 inc/ 2014-2015 inc/
Actual Actual dec Budget dec
General 745,182 812,652 9% 844,340 4%
Federal Funds 0 0 0% 0 0%
Supplemental General 227,948 115,583 -49% 119,000 3%
At Risk (4yr Old) 0 0 0% 0 0%
At Risk (K-12) 0 0 0% 0 0%
Bilingual Education 0 0 0% 0 0%
Virtual Education 0 0 0% 0 0%
Capital Outlay 0 0 0% 0 0%
Driver Training 1,523 1,017 -33% 1,800 77%
Declining Enrollment 0 0 0% 0 0%
Extraordinary School Program 0 0 0% 0 0%
Food Service 20,299 15,533 -23% 20,800 34%
Professional Development 0 0 0% 0 0%
Parent Education Program 0 0 0% 0 0%
Summer School 0 0 0% 0 0%
Special Education 0 0 0% 0 0%
Cost of Living 0 0 0% 0 0%
Vocational Education 0 0 0% 0 0%
Gifts/Grants 0 0 0% 0 0%
Special Liability 0 0 0% 0 0%
School Retirement 0 0 0% 0 0%
Extraordinary Growth Facilities 0 0 0% 0 0%
Special Reserve 0 0 0%
KPERS Spec. Ret. Contribution 31,449 30,659 -3% 43,756 43%
Contingency Reserve 0 0 0%
Text Book & Student Material 0 0 0%
Activity Fund 0 0 0% 0 0%
Bond and Interest #1 0 0 0% 0 0%
Bond and Interest #2 0 0 0% 0 0%
No-Fund Warrant 0 0 0% 0 0%
Special Assessment 0 0 0% 0 0%
Temporary Note 0 0 0% 0 0%
SUBTOTAL 1,026,401 975,444 -5% 1,029,696 6%
Enrollment (FTE)* 750.0 745.0 -1% 750.0 1%
Amount per Pupil 1,369 1,309 -4% 1,373 5%
Adult Education 0 0 0% 0 0%
Adult Supplemental Education 0 0 0% 0 0%
Tuition Reimbursement 0 0 0% 0 0%
Special Education Coop 0 0 0% 0 0%
TOTAL 1,026,401 975,444 -5% 1,029,696 6%
NOTE: Gifts/Grants includes private grants and grants from nonfederal sources.
Amount per pupil excludes the following funds: Adult Education, Adult Supplemental Education, Special Education Coop
and Tuition Reimbursement.
*Enrollment (FTE) includes the enrollment of the district used for state aid and budget authority, and all other preschool enrollment
and kindergarten students attending full time.
940,000
950,000
960,000
970,000
980,000
990,000
1,000,000
1,010,000
1,020,000
1,030,000
2012-2013 2013-2014 2014-2015
1,026,401
975,444
1,029,696
Operations and Maintenance Expenditures
9/11/2014 9:25 AM Sumexpen.xlsx Page 12 of 30

USD# 499
Transportation Expenditures (2700)
% %
2012-2013 2013-2014 inc/ 2014-2015 inc/
Actual Actual dec Budget dec
General 120,358 151,696 26% 157,200 4%
Federal Funds 2,258 3,204 42% 0 -100%
Supplemental General 29,909 26 -100% 0 -100%
At Risk (4yr Old) 0 0 0% 0 0%
At Risk (K-12) 0 0 0% 0 0%
Bilingual Education 0 0 0% 0 0%
Virtual Education 0 0 0% 0 0%
Capital Outlay 0 0 0% 0 0%
Driver Training 0 0 0% 0 0%
Declining Enrollment 0 0 0% 0 0%
Extraordinary School Program 0 0 0% 0 0%
Food Service 0 0 0% 0 0%
Professional Development 0 0 0% 0 0%
Parent Education Program 0 0 0% 0 0%
Summer School 0 0 0% 0 0%
Special Education 48,319 58,187 20% 72,843 25%
Cost of Living 0 0 0% 0 0%
Vocational Education 0 0 0% 0 0%
Gifts/Grants 0 976 0% 1,110 14%
Special Liability 0 0 0% 0 0%
School Retirement 0 0 0% 0 0%
Extraordinary Growth Facilities 0 0 0% 0 0%
Special Reserve 0 0 0%
KPERS Spec. Ret. Contribution 7,595 3,224 -58% 4,168 29%
Contingency Reserve 0 0 0%
Text Book & Student Material 0 0 0%
Activity Fund 0 0 0%
Bond and Interest #1 0 0 0% 0 0%
Bond and Interest #2 0 0 0% 0 0%
No-Fund Warrant 0 0 0% 0 0%
Special Assessment 0 0 0% 0 0%
Temporary Note 0 0 0% 0 0%
SUBTOTAL 208,439 217,313 4% 235,321 8%
Enrollment (FTE)* 750.0 745.0 -1% 750.0 1%
Amount per Pupil 278 292 5% 314 8%
Adult Education 0 0 0% 0 0%
Adult Supplemental Education 0 0 0% 0 0%
Tuition Reimbursement 0 0 0% 0 0%
Special Education Coop 0 0 0% 0 0%
TOTAL 208,439 217,313 4% 235,321 8%
NOTE: Gifts/Grants includes private grants and grants from nonfederal sources.
Amount per pupil excludes the following funds: Adult Education, Adult Supplemental Education, Special Education Coop
and Tuition Reimbursement.
*Enrollment (FTE) includes the enrollment of the district used for state aid and budget authority, and all other preschool enrollment
and kindergarten students attending full time.
190,000
195,000
200,000
205,000
210,000
215,000
220,000
225,000
230,000
235,000
240,000
2012-2013 2013-2014 2014-2015
208,439
217,313
235,321
Transportation Expenditures
9/11/2014 9:25 AM Sumexpen.xlsx Page 13 of 30

USD# 499
Other Support Services Expenditures (2900)
% %
2012-2013 2013-2014 inc/ 2014-2015 inc/
Actual Actual dec Budget dec
General 0 0 0% 0 0%
Federal Funds 0 0 0% 0 0%
Supplemental General 0 0 0% 0 0%
At Risk (4yr Old) 0 0 0% 0 0%
At Risk (K-12) 0 0 0% 0 0%
Bilingual Education 0 0 0% 0 0%
Virtual Education 0 0 0% 0 0%
Capital Outlay 0 0 0% 0 0%
Driver Training 0 0 0% 0 0%
Declining Enrollment 0 0 0% 0 0%
Extraordinary School Program 0 0 0% 0 0%
Food Service 0 0 0% 0 0%
Professional Development 0 0 0% 0 0%
Parent Education Program 0 0 0% 0 0%
Summer School 0 0 0% 0 0%
Special Education 0 0 0% 0 0%
Cost of Living 0 0 0% 0 0%
Vocational Education 0 0 0% 0 0%
Gifts/Grants 0 0 0% 0 0%
Special Liability 0 0 0% 0 0%
School Retirement 0 0 0% 0 0%
Extraordinary Growth Facilities 0 0 0% 0 0%
Special Reserve 0 0 0%
KPERS Spec. Ret. Contribution 0 0 0% 0 0%
Contingency Reserve 0 0 0%
Text Book & Student Material 0 0 0%
Activity Fund 0 0 0%
Bond and Interest #1 0 0 0% 0 0%
Bond and Interest #2 0 0 0% 0 0%
No-Fund Warrant 0 0 0% 0 0%
Special Assessment 0 0 0% 0 0%
Temporary Note 0 0 0% 0 0%
SUBTOTAL 0 0 0% 0 0%
Enrollment (FTE)* 750.0 745.0 -1% 750.0 1%
Amount per Pupil 0 0 0% 0 0%
Adult Education 0 0 0% 0 0%
Adult Supplemental Education 0 0 0% 0 0%
Tuition Reimbursement 0 0 0% 0 0%
Special Education Coop 0 0 0% 0 0%
TOTAL 0 0 0% 0 0%
NOTE: Gifts/Grants includes private grants and grants from nonfederal sources.
Amount per pupil excludes the following funds: Adult Education, Adult Supplemental Education, Special Education Coop
and Tuition Reimbursement.
*Enrollment (FTE) includes the enrollment of the district used for state aid and budget authority, and all other preschool enrollment
and kindergarten students attending full time.
0
0
0
0
0
1
1
1
1
1
1
2012-2013 2013-2014 2014-2015
0 0 0
Other Support Services Expenditures
9/11/2014 9:25 AM Sumexpen.xlsx Page 14 of 30

USD# 499
Food Services Expenditures (3100)
% %
2012-2013 2013-2014 inc/ 2014-2015 inc/
Actual Actual dec Budget dec
General 0 0 0% 0 0%
Federal Funds 0 0 0% 0 0%
Supplemental General 0 0 0% 0 0%
At Risk (4yr Old) 0 0 0% 0 0%
At Risk (K-12) 0 0 0% 0 0%
Bilingual Education 0 0 0% 0 0%
Virtual Education 0 0 0% 0 0%
Capital Outlay 0 0 0% 0 0%
Driver Training 0 0 0% 0 0%
Declining Enrollment 0 0 0% 0 0%
Extraordinary School Program 0 0 0% 0 0%
Food Service 508,014 523,201 3% 611,300 17%
Professional Development 0 0 0% 0 0%
Parent Education Program 0 0 0% 0 0%
Summer School 0 0 0% 0 0%
Special Education 0 0 0% 0 0%
Cost of Living 0 0 0% 0 0%
Vocational Education 0 0 0% 0 0%
Gifts/Grants 0 0 0% 0 0%
Special Liability 0 0 0% 0 0%
School Retirement 0 0 0% 0 0%
Extraordinary Growth Facilities 0 0 0% 0 0%
Special Reserve 0 0 0%
KPERS Spec. Ret. Contribution 13,040 7,911 -39% 9,336 18%
Contingency Reserve 0 0 0%
Text Book & Student Material 0 0 0%
Activity Fund 0 0 0%
Bond and Interest #1 0 0 0% 0 0%
Bond and Interest #2 0 0 0% 0 0%
No-Fund Warrant 0 0 0% 0 0%
Special Assessment 0 0 0% 0 0%
Temporary Note 0 0 0% 0 0%
SUBTOTAL 521,054 531,112 2% 620,636 17%
Enrollment (FTE)* 750.0 745.0 -1% 750.0 1%
Amount per Pupil 695 713 3% 828 16%
Adult Education 0 0 0% 0 0%
Adult Supplemental Education 0 0 0% 0 0%
Tuition Reimbursement 0 0 0% 0 0%
Special Education Coop 0 0 0% 0 0%
TOTAL 521,054 531,112 2% 620,636 17%
NOTE: Gifts/Grants includes private grants and grants from nonfederal sources.
Amount per pupil excludes the following funds: Adult Education, Adult Supplemental Education, Special Education Coop
and Tuition Reimbursement.
*Enrollment (FTE) includes the enrollment of the district used for state aid and budget authority, and all other preschool enrollment
and kindergarten students attending full time.
460,000
480,000
500,000
520,000
540,000
560,000
580,000
600,000
620,000
640,000
2012-2013 2013-2014 2014-2015
521,054 531,112
620,636
Food Service Expenditures
9/11/2014 9:25 AM Sumexpen.xlsx Page 15 of 30

USD# 499
Community Services Operations (3300)
% % chart and graph checked
2012-2013 2013-2014 inc/ 2014-2015 inc/
Actual Actual dec Budget dec
General 0 0 0% 0 0%
Federal Funds 0 0 0% 0 0%
Supplemental General 0 0 0% 0 0%
At Risk (4yr Old) 0 0 0% 0 0%
At Risk (K-12) 0 0 0% 0 0%
Bilingual Education 0 0 0% 0 0%
Virtual Education 0 0 0% 0 0%
Capital Outlay 0 0 0% 0 0%
Driver Training 0 0 0% 0 0%
Declining Enrollment 0 0 0% 0 0%
Extraordinary School Program 0 0 0% 0 0%
Food Service 0 0 0% 0 0%
Professional Development 0 0 0% 0 0%
Parent Education Program 0 0 0% 0 0%
Summer School 0 0 0% 0 0%
Special Education 0 0 0% 0 0%
Cost of Living 0 0 0% 0 0%
Vocational Education 0 0 0% 0 0%
Gifts/Grants 0 0 0% 0 0%
Special Liability 0 0 0% 0 0%
School Retirement 0 0 0% 0 0%
Extraordinary Growth Facilities 0 0 0% 0 0%
Special Reserve 0 0 0%
KPERS Spec. Ret. Contribution 0 0 0% 0 0%
Contingency Reserve 0 0 0%
Text Book & Student Material 0 0 0%
Activity Fund 0 0 0% 0 0%
Bond and Interest #1 0 0 0% 0 0%
Bond and Interest #2 0 0 0% 0 0%
No-Fund Warrant 0 0 0% 0 0%
Special Assessment 0 0 0% 0 0%
Temporary Note 0 0 0% 0 0%
SUBTOTAL 0 0 0% 0 0%
Enrollment (FTE)* 750.0 745.0 -1% 750.0 1%
Amount per Pupil 0 0 0% 0 0%
Adult Education 0 0 0% 0 0%
Adult Supplemental Education 0 0 0% 0 0%
Tuition Reimbursement 0 0 0% 0 0%
Special Education Coop 0 0 0% 0 0%
TOTAL 0 0 0% 0 0%
NOTE: Gifts/Grants includes private grants and grants from nonfederal sources.
Amount per pupil excludes the following funds: Adult Education, Adult Supplemental Education, Special Education Coop
and Tuition Reimbursement.
*Enrollment (FTE) includes the enrollment of the district used for state aid and budget authority, and all other preschool enrollment
and kindergarten students attending full time.
0
0
0
0
0
1
1
1
1
1
1
2012-2013 2013-2014 2014-2015
0 0 0
Community Services Operations (3300)
9/11/2014 9:25 AM Sumexpen.xlsx Page 16 of 30

USD# 499
Capital Improvements Expenditures (4000)
% %
2012-2013 2013-2014 inc/ 2014-2015 inc/
Actual Actual dec Budget dec
General 22,165 500 -98% 0 -100%
Federal Funds 0 0 0% 0 0%
Supplemental General 0 0 0% 0 0%
At Risk (4yr Old) 0 0 0% 0 0%
At Risk (K-12) 0 0 0% 0 0%
Bilingual Education 0 0 0% 0 0%
Virtual Education 0 0 0% 0 0%
Capital Outlay 195,415 157,638 -19% 285,000 81%
Driver Training 0 0 0% 0 0%
Declining Enrollment 0 0 0% 0 0%
Extraordinary School Program 0 0 0% 0 0%
Food Service 0 0 0% 0 0%
Professional Development 0 0 0% 0 0%
Parent Education Program 0 0 0% 0 0%
Summer School 0 0 0% 0 0%
Special Education 0 0 0% 0 0%
Cost of Living 0 0 0% 0 0%
Vocational Education 0 0 0% 0 0%
Gifts/Grants 0 0 0% 0 0%
Special Liability 0 0 0% 0 0%
School Retirement 0 0 0% 0 0%
Extraordinary Growth Facilities 0 0 0% 0 0%
Special Reserve 0 0 0%
KPERS Spec. Ret. Contribution 0 0 0% 0 0%
Contingency Reserve 0 0 0%
Text Book & Student Material 0 0 0%
Activity Fund 0 0 0% 0 0%
Bond and Interest #1 0 0 0% 0 0%
Bond and Interest #2 0 0 0% 0 0%
No-Fund Warrant 0 0 0% 0 0%
Special Assessment 0 0 0% 0 0%
Temporary Note 0 0 0% 0 0%
SUBTOTAL 217,580 158,138 -27% 285,000 80%
Enrollment (FTE)* 750.0 745.0 -1% 750.0 1%
Amount per Pupil 290 212 -27% 380 79%
Adult Education 0 0 0% 0 0%
Adult Supplemental Education 0 0 0% 0 0%
Tuition Reimbursement 0 0 0% 0 0%
Special Education Coop 0 0 0% 0 0%
TOTAL 217,580 158,138 -27% 285,000 80%
NOTE: Gifts/Grants includes private grants and grants from nonfederal sources.
Amount per pupil excludes the following funds: Adult Education, Adult Supplemental Education, Special Education Coop
and Tuition Reimbursement.
*Enrollment (FTE) includes the enrollment of the district used for state aid and budget authority, and all other preschool enrollment
and kindergarten students attending full time.
0
50,000
100,000
150,000
200,000
250,000
300,000
2012-2013 2013-2014 2014-2015
217,580
158,138
285,000
Capital Improvements (4000)
9/11/2014 9:25 AM Sumexpen.xlsx Page 17 of 30

USD# 499
Debt Services Expenditures (5100)
% %
2012-2013 2013-2014 inc/ 2014-2015 inc/
Actual Actual dec Budget dec
General 0 0 0% 0 0%
Federal Funds 0 0 0% 0 0%
Supplemental General 0 0 0% 0 0%
At Risk (4yr Old) 0 0 0% 0 0%
At Risk (K-12) 0 0 0% 0 0%
Bilingual Education 0 0 0% 0 0%
Virtual Education 0 0 0% 0 0%
Capital Outlay 0 0 0% 0 0%
Driver Training 0 0 0% 0 0%
Declining Enrollment 0 0 0% 0 0%
Extraordinary School Program 0 0 0% 0 0%
Food Service 0 0 0% 0 0%
Professional Development 0 0 0% 0 0%
Parent Education Program 0 0 0% 0 0%
Summer School 0 0 0% 0 0%
Special Education 0 0 0% 0 0%
Cost of Living 0 0 0% 0 0%
Vocational Education 0 0 0% 0 0%
Gifts/Grants 0 0 0% 0 0%
Special Liability 0 0 0% 0 0%
School Retirement 0 0 0% 0 0%
Extraordinary Growth Facilities 0 0 0% 0 0%
Special Reserve 0 0 0%
KPERS Spec. Ret. Contribution 0 0 0% 0 0%
Contingency Reserve 0 0 0%
Text Book & Student Material 0 0 0%
Activity Fund 0 0 0% 0 0%
Bond and Interest #1 0 0 0% 0 0%
Bond and Interest #2 266,650 441,493 66% 323,095 -27%
No-Fund Warrant 0 0 0% 0 0%
Special Assessment 0 0 0% 0 0%
Temporary Note 0 0 0% 0 0%
SUBTOTAL 266,650 441,493 66% 323,095 -27%
Enrollment (FTE)* 750.0 745.0 -1% 750.0 1%
Amount per Pupil 356 593 67% 431 -27%
Adult Education 0 0 0% 0 0%
Adult Supplemental Education 0 0 0% 0 0%
Tuition Reimbursement 0 0 0% 0 0%
Special Education Coop 0 0 0% 0 0%
TOTAL 266,650 441,493 66% 323,095 -27%
NOTE: Gifts/Grants includes private grants and grants from nonfederal sources.
Amount per pupil excludes the following funds: Adult Education, Adult Supplemental Education, Special Education Coop
and Tuition Reimbursement.
*Enrollment (FTE) includes the enrollment of the district used for state aid and budget authority, and all other preschool enrollment
and kindergarten students attending full time.
0
50,000
100,000
150,000
200,000
250,000
300,000
350,000
400,000
450,000
2012-2013 2013-2014 2014-2015
266,650
441,493
323,095
Deb Services (5100)
9/11/2014 9:25 AM Sumexpen.xlsx Page 18 of 30

USD# 499
Transfers (5200)
% %
2012-2013 2013-2014 inc/ 2014-2015 inc/
Actual Actual dec Budget dec
General 1,388,474 1,334,229 -4% 1,364,993 2%
Federal Funds 0 0 0% 0 0%
Supplemental General 989,075 914,520 -8% 1,728,548 89%
At Risk (4yr Old) 0 0 0% 0 0%
At Risk (K-12) 0 0 0% 0 0%
Bilingual Education 0 0 0% 0 0%
Virtual Education 0 0 0% 0 0%
Capital Outlay
Driver Training 0 0 0% 0 0%
Declining Enrollment 0 0 0% 0 0%
Extraordinary School Program 0 0 0% 0 0%
Food Service 0 0 0% 0 0%
Professional Development 0 0 0% 0 0%
Parent Education Program 0 0 0% 0 0%
Summer School 0 0 0% 0 0%
Special Education 0 0 0% 0 0%
Cost of Living 0 0 0% 0 0%
Vocational Education 0 0 0% 0 0%
Gifts/Grants 0 0 0% 0 0%
Special Liability 0 0 0% 0 0%
School Retirement 0 0 0% 0 0%
Extraordinary Growth Facilities 0 0 0% 0 0%
Special Reserve 0 0 0%
KPERS Spec. Ret. Contribution 0 0 0% 0 0%
Contingency Reserve 0 0 0% 0 0%
Text Book & Student Material 0 0 0% 0 0%
Activity Fund 0 0 0% 0 0%
Bond and Interest #1 0 0 0% 0 0%
Bond and Interest #2 0 0 0% 0 0%
No-Fund Warrant 0 0 0% 0 0%
Special Assessment 0 0 0% 0 0%
Temporary Note 0 0 0% 0 0%
SUBTOTAL 2,377,549 2,248,749 -5% 3,093,541 38%
Enrollment (FTE)* 750.0 745.0 -1% 750.0 1%
Amount per Pupil 3,170 3,018 -5% 4,125 37%
Adult Education 0 0 0% 0 0%
Adult Supplemental Education 0 0 0% 0 0%
Tuition Reimbursement 0 0 0% 0 0%
Special Education Coop 0 0 0% 0 0%
TOTAL 2,377,549 2,248,749 -5% 3,093,541 38%
NOTE: Gifts/Grants includes private grants and grants from nonfederal sources.
Amount per pupil excludes the following funds: Adult Education, Adult Supplemental Education, Special Education Coop
and Tuition Reimbursement.
*Enrollment (FTE) includes the enrollment of the district used for state aid and budget authority, and all other preschool enrollment
and kindergarten students attending full time.
0
500,000
1,000,000
1,500,000
2,000,000
2,500,000
3,000,000
3,500,000
2012-2013 2013-2014 2014-2015
2,377,549 2,248,749
3,093,541
Transfers (5200)
9/11/2014 9:25 AM Sumexpen.xlsx Page 19 of 30
USD# 499
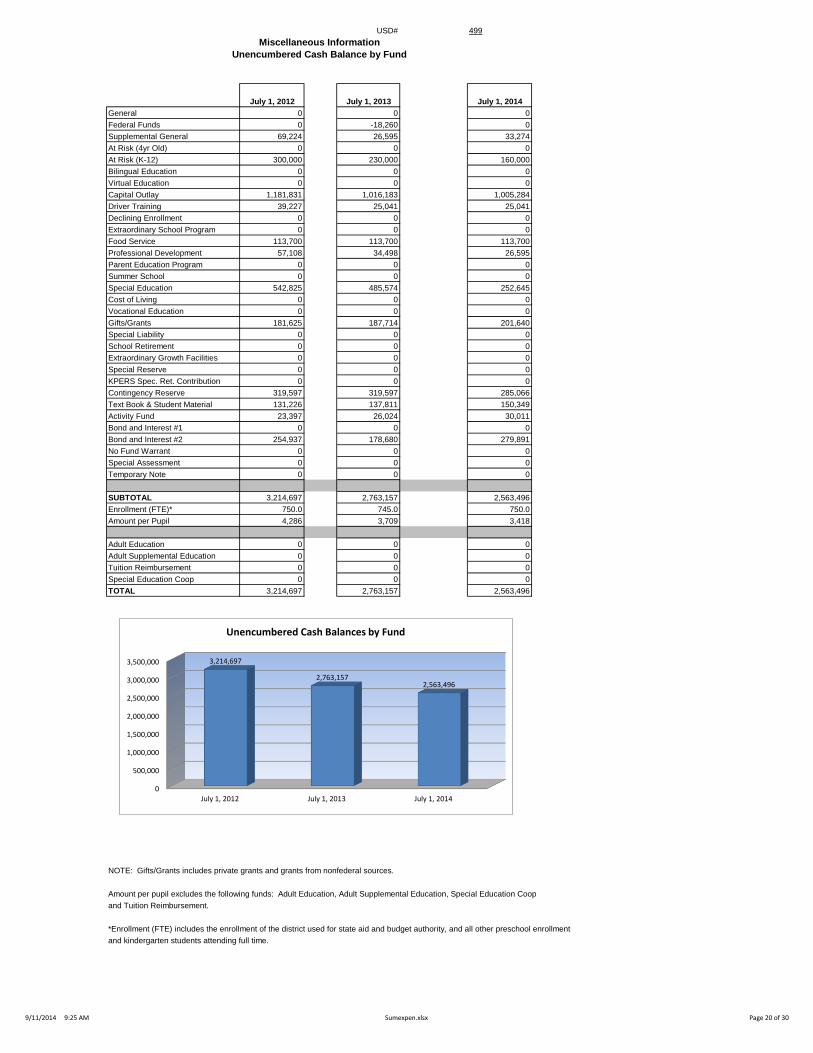
Miscellaneous Information
Unencumbered Cash Balance by Fund
July 1, 2012 July 1, 2013 July 1, 2014
General 0 0 0
Federal Funds 0 -18,260 0
Supplemental General 69,224 26,595 33,274
At Risk (4yr Old) 0 0 0
At Risk (K-12) 300,000 230,000 160,000
Bilingual Education 0 0 0
Virtual Education 0 0 0
Capital Outlay 1,181,831 1,016,183 1,005,284
Driver Training 39,227 25,041 25,041
Declining Enrollment 0 0 0
Extraordinary School Program 0 0 0
Food Service 113,700 113,700 113,700
Professional Development 57,108 34,498 26,595
Parent Education Program 0 0 0
Summer School 0 0 0
Special Education 542,825 485,574 252,645
Cost of Living 0 0 0
Vocational Education 0 0 0
Gifts/Grants 181,625 187,714 201,640
Special Liability 0 0 0
School Retirement 0 0 0
Extraordinary Growth Facilities 0 0 0
Special Reserve 0 0 0
KPERS Spec. Ret. Contribution 0 0 0
Contingency Reserve 319,597 319,597 285,066
Text Book & Student Material 131,226 137,811 150,349
Activity Fund 23,397 26,024 30,011
Bond and Interest #1 0 0 0
Bond and Interest #2 254,937 178,680 279,891
No Fund Warrant 0 0 0
Special Assessment 0 0 0
Temporary Note 0 0 0
SUBTOTAL 3,214,697 2,763,157 2,563,496
Enrollment (FTE)* 750.0 745.0 750.0
Amount per Pupil 4,286 3,709 3,418
Adult Education 0 0 0
Adult Supplemental Education 0 0 0
Tuition Reimbursement 0 0 0
Special Education Coop 0 0 0
TOTAL 3,214,697 2,763,157 2,563,496
NOTE: Gifts/Grants includes private grants and grants from nonfederal sources.
Amount per pupil excludes the following funds: Adult Education, Adult Supplemental Education, Special Education Coop
and Tuition Reimbursement.
*Enrollment (FTE) includes the enrollment of the district used for state aid and budget authority, and all other preschool enrollment
and kindergarten students attending full time.
0
500,000
1,000,000
1,500,000
2,000,000
2,500,000
3,000,000
3,500,000
July 1, 2012 July 1, 2013 July 1, 2014
3,214,697
2,763,157 2,563,496
Unencumbered Cash Balances by Fund
9/11/2014 9:25 AM Sumexpen.xlsx Page 20 of 30

USD# 499
Reserve Funds
Unencumbered Cash Balance
July 1, 2012 July 1, 2013 July 1, 2014
Special Reserve 0 0 0
TOTAL OTHER 0 0 0
Amount per Pupil $0 $0 $0
*School districts are authorized by law to self insure rather than purchase insurance for the following categories: Worker's Comp,
Health Insurance, Life Insurance, Property and Casualty (Risk Management) and Disability Income Insurance. Monies are placed
in the Self Insured Fund to pay for claims which may arise from the categories listed above.
0
0
0
0
0
1
1
1
1
1
1
July 1, 2012 July 1, 2013 July 1, 2014
0 0 0
Unencumbered Cash Balances by Fund (Reserve Funds Only)
9/11/2014 9:25 AM Sumexpen.xlsx Page 21 of 30

USD# 499
2010-2011 2011-2012 % 2012-2013 % 2013-2014 % 2014-2015 %
Actual Actual inc/ Actual inc/ Actual inc/ Budget inc/
dec dec dec dec
Enrollment (FTE)* 785.8 780.2 -1% 774.9 -1% 800.2 3% 800.0 0%
Enrollment (FTE)** 740.0 750.0 1% 750.0 0% 745.0 -1% 750.0 1%
Number of Students -
Free Meals 476 468 -2% 487 4% 529 9% 510 -4%
Number of Students -
Reduced Meals 128 143 12% 116 -19% 99 -15% 100 1%
*FTE for state aid and budget authority purposes for general fund (excludes 4 yr old at-risk).
** FTE includes 9/20 enrollment used for state aid purposes and adding the additional FTE for preschool programs, headstart, and all-day
kindergarten. For example, preschool students attending half days on September 20th would be counted as .5 FTE. Kindergarten
students attending full time every day would be counted as 1.0 FTE.
Enrollment Information
734.0
736.0
738.0
740.0
742.0
744.0
746.0
748.0
750.0
2010-2011 2011-2012 2012-2013 2013-2014 2014-2015
740.0
750.0 750.0
745.0
750.0
Enrollment (FTE)** Used for Calculating "Amount per Pupil"
0
100
200
300
400
500
600
2010-2011 2011-2012 2012-2013 2013-2014 2014-2015
476 468 487 529 510
128 143 116 99 100
Low Income Students
Free Meals
Reduced Meals
760.0
765.0
770.0
775.0
780.0
785.0
790.0
795.0
800.0
805.0
2010-2011 2011-2012 2012-2013 2013-2014 2014-2015
785.8
780.2
774.9
800.2 800.0
FTE Enrollment for Budget Authority
9/11/2014 9:25 AM Sumexpen.xlsx Page 22 of 30

USD# 499
Miscellaneous Information
Mill Rates by Fund
2012-2013 2013-2014 2014-2015
Actual Actual Budget
General 20.000 20.000 20.000
Supplemental General 33.142 27.279 17.011
Adult Education 0.000 0.000 0.000
Capital Outlay 0.000 0.000 0.000
Declining Enrollment 0.000 0.000 0.000
Cost of Living 0.000 0.000 0.000
Special Liability 0.000 0.000 0.000
School Retirement 0.000 0.000 0.000
Extraordinary Growth Facilities 0.000 0.000 0.000
Bond and Interest #1 0.000 0.000 0.000
Bond and Interest #2 0.000 6.963 14.024
No Fund Warrant 0.000 0.000 0.000
Special Assessment 0.000 0.000 0.000
Temporary Note 0.000 0.000 0.000
TOTAL USD 53.142 54.242 51.035
Historical Museum 0.996 0.823 1.000
Public Library Board 0.000 0.000 0.000
Public Library Brd & Emp Benf 0.000 0.000 0.000
Recreation Commission 0.000 0.000 0.000
Rec Comm Employee Bnfts 0.000 0.000 0.000
TOTAL OTHER 0.996 0.823 1.000
0.000
10.000
20.000
30.000
40.000
50.000
60.000
70.000
80.000
2012-2013 2013-2014 2014-2015
53.142 54.242 51.035
Total USD Mill Rates
General 39%
Supplemental General 33%
Bond and Interest #2
28%
2014-15 Miscellaneous Information Mill Rates by Fund (Total USD)
General
Supplemental General
Adult Education
Capital Outlay
Special Liability
School Retirement
Declining Enrollment
Cost of Living
Bond and Interest #1
Bond and Interest #2
Extraordinary Growth Facilities
No Fund Warrant
Special Assessment
Temporary Note
9/11/2014 9:25 AM Sumexpen.xlsx Page 23 of 30

USD# 499
Other Information
2012-2013 2013-2014 2014-2015
Actual Actual Budget
Assessed Valuation $14,744,027 $16,457,768 $16,855,001
Bonded Indebtedness $680,000 $430,000 $7,760,000
$13,500,000
$14,000,000
$14,500,000
$15,000,000
$15,500,000
$16,000,000
$16,500,000
$17,000,000
2012-2013 2013-2014 2014-2015
$14,744,027
$16,457,768
$16,855,001
Assessed Valuation
$0
$1,000,000
$2,000,000
$3,000,000
$4,000,000
$5,000,000
$6,000,000
$7,000,000
$8,000,000
2012-2013 2013-2014 2014-2015
$680,000 $430,000
$7,760,000
Bonded Indebtedness
9/11/2014 9:25 AM Sumexpen.xlsx Page 24 of 30
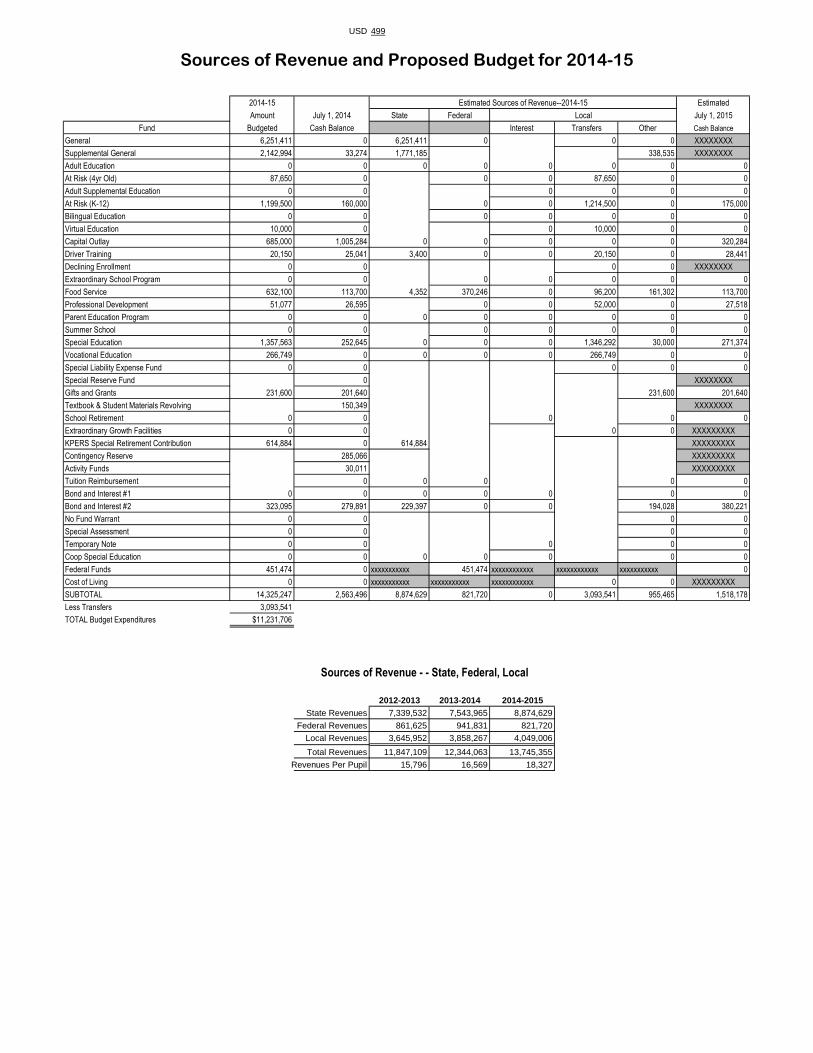
USD 499
2014-15 Estimated Sources of Revenue--2014-15 Estimated
Amount July 1, 2014 State Federal Local July 1, 2015
Fund Budgeted Cash Balance Interest Transfers Other Cash Balance
General 6,251,411 0 6,251,411 0 0 0 XXXXXXXX
Supplemental General 2,142,994 33,274 1,771,185 338,535 XXXXXXXX
Adult Education 0 0 0 0 0 0 0 0
At Risk (4yr Old) 87,650 0 0 0 87,650 0 0
Adult Supplemental Education 0 0 0 0 0 0
At Risk (K-12) 1,199,500 160,000 0 0 1,214,500 0 175,000
Bilingual Education 0 0 0 0 0 0 0
Virtual Education 10,000 0 0 10,000 0 0
Capital Outlay 685,000 1,005,284 0 0 0 0 0 320,284
Driver Training 20,150 25,041 3,400 0 0 20,150 0 28,441
Declining Enrollment 0 0 0 0 XXXXXXXX
Extraordinary School Program 0 0 0 0 0 0 0
Food Service 632,100 113,700 4,352 370,246 0 96,200 161,302 113,700
Professional Development 51,077 26,595 0 0 52,000 0 27,518
Parent Education Program 0 0 0 0 0 0 0 0
Summer School 0 0 0 0 0 0 0
Special Education 1,357,563 252,645 0 0 0 1,346,292 30,000 271,374
Vocational Education 266,749 0 0 0 0 266,749 0 0
Special Liability Expense Fund 0 0 0 0 0
Special Reserve Fund 0 XXXXXXXX
Gifts and Grants 231,600 201,640 231,600 201,640
Textbook & Student Materials Revolving 150,349 XXXXXXXX
School Retirement 0 0 0 0 0
Extraordinary Growth Facilities 0 0 0 0 XXXXXXXXX
KPERS Special Retirement Contribution 614,884 0 614,884 XXXXXXXXX
Contingency Reserve 285,066 XXXXXXXXX
Activity Funds 30,011 XXXXXXXXX
Tuition Reimbursement 0 0 0 0 0
Bond and Interest #1 0 0 0 0 0 0 0
Bond and Interest #2 323,095 279,891 229,397 0 0 194,028 380,221
No Fund Warrant 0 0 0 0
Special Assessment 0 0 0 0
Temporary Note 0 0 0 0 0
Coop Special Education 0 0 0 0 0 0 0
Federal Funds 451,474 0 xxxxxxxxxxx 451,474 xxxxxxxxxxxx xxxxxxxxxxxx xxxxxxxxxxx 0
Cost of Living 0 0 xxxxxxxxxxx xxxxxxxxxxx xxxxxxxxxxxx 0 0 XXXXXXXXX
SUBTOTAL 14,325,247 2,563,496 8,874,629 821,720 0 3,093,541 955,465 1,518,178
Less Transfers 3,093,541
TOTAL Budget Expenditures $11,231,706
2012-2013 2013-2014 2014-2015
State Revenues 7,339,532 7,543,965 8,874,629
Federal Revenues 861,625 941,831 821,720
Local Revenues 3,645,952 3,858,267 4,049,006
Total Revenues 11,847,109 12,344,063 13,745,355
Revenues Per Pupil 15,796 16,569 18,327
Sources of Revenue and Proposed Budget for 2014-15
Sources of Revenue - - State, Federal, Local

USD 499 - Galena - Summary
0
1,000,000
2,000,000
3,000,000
4,000,000
5,000,000
6,000,000
7,000,000
8,000,000
Summary of Total Expenditures by Function (All Funds)
0
500,000
1,000,000
1,500,000
2,000,000
2,500,000
3,000,000
General and Supplemental General Fund Expenditures by Function
5,800,000
6,000,000
6,200,000
6,400,000
6,600,000
6,800,000
7,000,000
7,200,000
7,400,000
2012-2013 2013-2014 2014-2015
Instruction Expenditures
760.0
770.0
780.0
790.0
800.0
810.0
2010-2011 2011-2012 2012-2013 2013-2014 2014-2015
FTE Enrollment for Budget Authority
0.0002.0004.0006.0008.000
10.00012.00014.00016.00018.00020.000
2014-2015 Mill Levies by Fund
010,00020,00030,00040,00050,00060,00070,00080,000
Average Salary
0.000
10.000
20.000
30.000
40.000
50.000
60.000
70.000
80.000
2012-2013 2013-2014 2014-2015
Total USD Mill Rates
0
2,000
4,000
6,000
8,000
10,000
12,000
14,000
16,000
Amount Per Pupil By Function (All Funds)

Intentionally left blank

Intentionally left blank

Intentionally left blank

Intentionally left blank
Top Related