


Languages
Pages
Legal


MARCH 2017
OMNI-VISIONE-commerce sales continue to thrive as
retailers focus on omni-channel
THE MALL DEVOLVESOnce the symbol of a thriving retail sector, the mall is now characterized by declining traffi c, store closures, and vacancies fi lled by non-traditional anchors
VOLUME
238
Retail
NOTHING SPECIALSpecialty apparel sector sees
bankruptcies and liquidations
OFF THE CHARTSOff-price retailers continue to experience
sales gains

© 2017 Great American Group, LLC. All Rights Reserved.
In This Issue MONITOR RETAILGREATAMERICAN.COM
MARCH 2017
800-45-GREAT
VOLUME
238
04
05
06
08
09
10
11
12
13
14
15
16
17
18
Overview
Department Stores
Specialty Apparel Stores
Off-Price/Dollar Stores/Mass Merchants
E-commerce
Jewelry
Books
Arts and Crafts
Experience
About Great American Group
Footwear
Sporting Goods
Appraisal & Valuation Team
Consumer Electronics
Deals are a moving target. A constantly shifting mix of people, numbers,
and timing. We’re here to simplify this process for you. Our experts are
dedicated to tracking down and fl ushing out the values you need, even on
the most complex deals. So when the time comes to take your shot with
Great American, you’re always—right on the money.

Top Trends
1234
Declining mall traffi c hits department stores and specialty apparel
hardest.
E-commerce sales reached $102.7 billion in the fourth quarter,
representing 12% of retail sales, excluding gas and autos. Amazon's
fourth quarter North America sales increased 22% to $26 billion.
The retail sector continues to see bankruptcies, liquidations, mergers,
and acquisitions.
GA’s Retail Monitor highlights key industry drivers within the
retail sector and how they relate to GA’s valuation process
and current trends in recovery values. As the retail industry is
impacted by consumer spending patterns and various macro
and microeconomic factors, timely and accurate information
is essential. GA strives to contextualize important indicators to
provide an informed perspective of the market for our clients’
needs. Such indicators include general industry trends,
comparable store sales trends, gross margin changes, and
discounting activity. Any comparable store sales illustrated
in this monitor refl ect fi gures as they have been reported by
public retailers. The methodology for calculating comparable
store sales may vary by company.
GA welcomes the opportunity to make our expertise
available to you.
Should you need any further information or wish to discuss
recovery ranges for a particular segment, please feel free
to contact your GA Business Development Offi cer using the
contact information shown in this and all Retail Monitor issues.
GA’s Retail Monitor provides an overview highlighting specifi c
sectors of the retail industry. The information contained
herein is based on a composite of GA’s industry expertise,
contact with industry personnel, liquidation and appraisal
experience, and data compiled from a variety of well-
respected sources believed to be reliable. GA does not make
any representation or warranty, expressed or implied, as to
the accuracy or completeness of the information contained
in this issue. Neither GA nor any of its representatives shall
be liable for use of any of the information in this issue or any
errors therein or omissions therefrom.
Monitor Information
An increase in e-commerce sales drove total retail sales up 4% during
the holidays.
3 | MONITOR RETAIL MARCH 2017

Overview
According to data from Prodco Retail Traffi c Index and Fung
Global Retail Tech, foot traffi c was down approximately
10% during the fi rst half of the holiday season, following an
approximate 9% decline in the prior year. However, some
retailers experienced an uptick in traffi c during the last week
before the holidays, when last-minute gift givers visited stores
as opposed to websites.
Mall-based retailers, especially department stores, continue
to right size store bases. Major players like Macy's, JC
Penney, and Sears have all announced plans for store
closures recently. Specialty apparel retailers have also been
announcing store closures. BCBG will be closing close to 120
stores, and The Limited has closed all of its stores. Closings
of traditional retailers have led some malls to replace stores
with non-traditional options, such as fi tness centers, grocery
stores, and car dealerships.
Contrary to brick-and-mortar sales, in total, e-commerce sales
continue to grow. During the fourth quarter, e-commerce sales
represented 12.0% of total retail sales, excluding sales of
automobiles and gasoline, reaching $102.8 billion, according
to the U.S. Commerce Department. While there is a shift
toward online purchasing, many retailers fi nd that brick-and-
mortar locations and online sales go hand-in- hand. Some
retailers have found that online sales decline in markets in
which a store closes, as consumers like to have the option of
returning online purchases to a local store if needed.
Amazon continues to prove that a primarily online presence
can take market share from traditional retailers. Amazon's
Prime membership has left many consumers with the
expectation of two-day shipping.
This has left many retailers struggling to fi gure out how to
compete, while remaining profi table. Wal-Mart has been
trying to take aim at Amazon. After scrapping its similar free-
shipping membership program, it started offering free two-
day shipping on orders of at least $35. Amazon countered
by lowering its free-shipping threshold for non-Prime orders
from $49 to $35. As the online channel continues to drive
sales at many retailers, the brand value of retailers' intellectual
property has risen. For example, Sycamore Partners
reportedly submitted the winning bid of $26.8 million for
The Limited's intellectual property, including its e-commerce
business.
Outside of the mall, results have varied by sector. The sporting
goods sector has seen consolidation. Conversely, within the
off-price sector, major players have reported comparable store
sales gains and store openings.
While the retail sector is shifting, retail sales in total have
been on a positive trajectory, with total holiday sales up 4.0%,
according to The National Retail Federation, and sales thus
far in 2017 have also been positive. Going forward, the NRF
is projecting 2017 retail sales to increase between 3.7% and
4.2% over 2016.
Retailers will be keeping an eye on the effects of the Trump
Administration, which remain to be seen. While some
companies could potentially see tax decreases, tariff increases
could have an adverse impact on retailers. Regardless, the
e-commerce and off-price sectors are expected to continue
to perform well in 2017, while department stores and
specialty apparel retailers could face further store closures, as
businesses right-size.
The retail sector continues to change. Many retailers reported mixed
fourth quarter results, with mall-based retailers suffering from declining
customer traffi c and weaker brick-and-mortar sales.
4 | MONITOR RETAIL MARCH 2017

KEY INDUSTRY DRIVERS
• Customer traffi c: Department store traffi c continues
to decline due to a shift to online shopping, a decline
in tourism in key markets, a highly promotional retail
environment, and competition from off-price and fast-
fashion retailers.
• Store closures and activity: Department stores continue
to right-size their store base. Recent announcements
include Macy’s (68 stores), JC Penney (up to 140 stores),
Sears (26 stores), and K-mart (78 stores). While talk of
Hudson's Bay Company potentially acquiring Macy's
has stalled, reports indicate HBC could acquire Neiman
Marcus.
• E-commerce/omni-channel initiatives: For many
department stores, e-commerce sales have been
increasing, despite brick-and-mortar comparable store
sales declines. Department stores continue to execute
omni-channel strategies, such as allowing customers to
order online, but pick up the items in stores.
• Off-price and outlet formats: Department stores face
steep competition from off-price and fast-fashion retailers.
Even luxury department stores have seen a downturn in
sales recently, as in the age of social media, high-end
fashion is broadcast seconds after it hits the runway, with
inexpensive knock-offs available soon after at fast-fashion
retailers. By the time it reaches luxury department stores,
demand has waned. In order to compete, many have
worked to reduce lead times. Several department stores
have shifted focus to off-price counterparts and outlets.
• Customer traffi c drivers: Department stores have been
focused on different product categories to drive customer
traffi c. Many have also introduced shop-in-shop formats to
introduce new brands and products to attract customers.
5 | MONITOR RETAIL MARCH 2017
Most Recent Quarter
Prior QuarterTwo Quarters
Ago
Three Quarters
Ago
Neiman Marcus (6.8%) (8.0%) (4.1%) (5.0%)
Saks 0.1% (4.6%) (1.3%) (5.7%)
Hudson’s Bay/Lord & Taylor
0.6% (2.4%) 1.1% 2.3%
Nordstrom (2.7%) 0.9% (2.3%) (4.3%)
Macy’s (2.7%) (3.3%) (2.6%) (6.1%)
Dillard’s (6.0%) (4.0%) (5.0%) (5.0%)
JC Penney (0.7%) (0.8%) 2.2% (0.4%)
Kohl’s (2.2%) (1.7%) (1.8%) (3.9%)
Sears (12.3%) (10.0%) (7.0%) (7.1%)
*Note(s): The most recent quarter reported for all companies ended January 28, 2017.
Some retailers report results including e-commerce sales.
Department Stores
COMPARABLE STORE SALES TRENDS
Trend Tracker
NOLVsConsistent
Decreasing
Sales Trends Decreasing
Gross Margin Mixed
Discounting Mixed

6 | MONITOR RETAIL MARCH 2017
KEY INDUSTRY DRIVERS
• Store closures/bankruptcies: As has been seen over the
past few years, bankruptcies and liquidations continue
to be prevalent within the specialty retail sector. Most
recently, The Limited, Wet Seal, and American Apparel
have all declared bankruptcy. While some specialty
retailers have closed all of their stores, others continue
to right-size the business. For example, BCBG will be
closing approximately 120 stores, and others close
underperforming locations as leases expire.
• Declining mall traffi c: Continued declines in mall traffi c
impact sales at specialty retailers. As department
stores have suffered, so too have specialty retailers that
historically benefi ted from customers stopping in on their
way to an anchor store.
• E-commerce: Specialty apparel retailers have been
leveraging omni-channel initiatives to offset brick-and-
mortar sales declines with e-commerce growth.
• Varying performance: While retailers of teen and women’s
apparel in particular have struggled in recent quarters,
retailers of children’s apparel, as well as those catering to
niche markets, such as plus-size, have fared better than
other specialty retailers.
• Competition: The specialty apparel sector faces internal
and external competition. In addition to vying for customers
from other specialty retailers, there is competition from
lower-priced options such as off-price retailers, highly
promotional department stores, and fast fashion retailers
offering the latest trends at low price points.
• Lack of fashion: There has been a lack of a “must-have”
fashion trend to get customers into the stores.
Specialty Apparel Stores
Trend Tracker
NOLVsConsistent
Decreasing
Sales Trends Decreasing
Gross Margin Mixed
Discounting Mixed
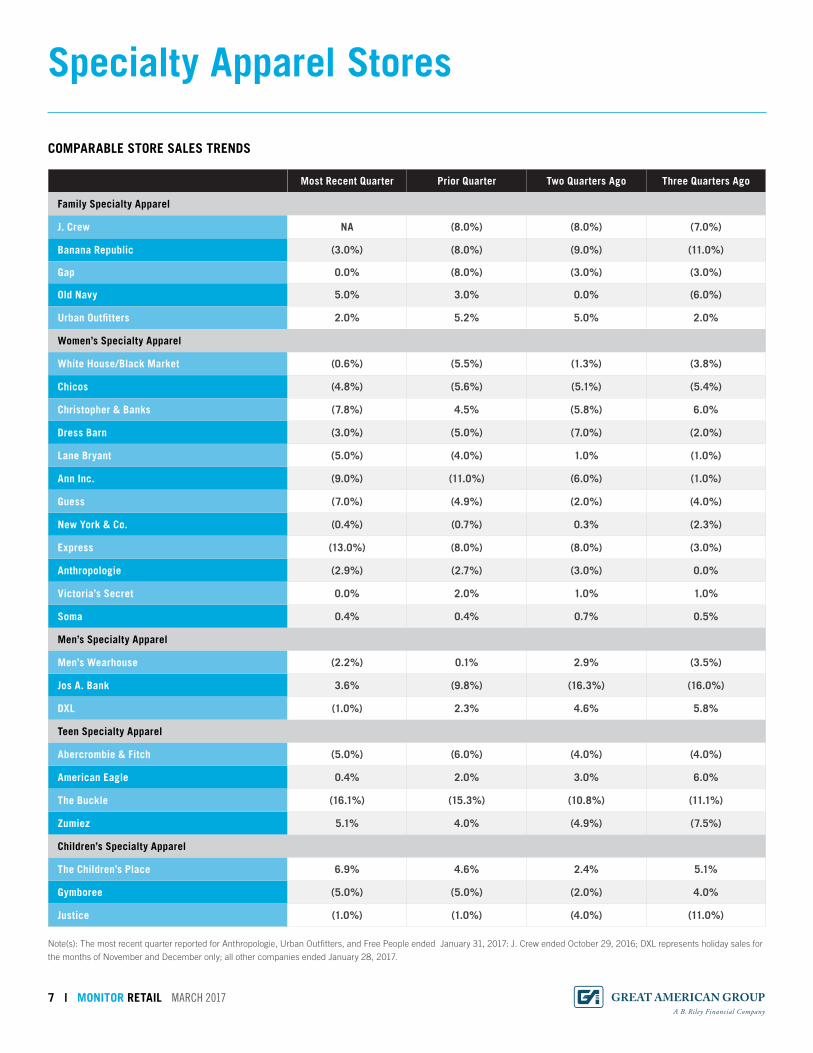
Specialty Apparel Stores
COMPARABLE STORE SALES TRENDS
Most Recent Quarter Prior Quarter Two Quarters Ago Three Quarters Ago
Family Specialty Apparel
J. Crew NA (8.0%) (8.0%) (7.0%)
Banana Republic (3.0%) (8.0%) (9.0%) (11.0%)
Gap 0.0% (8.0%) (3.0%) (3.0%)
Old Navy 5.0% 3.0% 0.0% (6.0%)
Urban Outfi tters 2.0% 5.2% 5.0% 2.0%
Women’s Specialty Apparel
White House/Black Market (0.6%) (5.5%) (1.3%) (3.8%)
Chicos (4.8%) (5.6%) (5.1%) (5.4%)
Christopher & Banks (7.8%) 4.5% (5.8%) 6.0%
Dress Barn (3.0%) (5.0%) (7.0%) (2.0%)
Lane Bryant (5.0%) (4.0%) 1.0% (1.0%)
Ann Inc. (9.0%) (11.0%) (6.0%) (1.0%)
Guess (7.0%) (4.9%) (2.0%) (4.0%)
New York & Co. (0.4%) (0.7%) 0.3% (2.3%)
Express (13.0%) (8.0%) (8.0%) (3.0%)
Anthropologie (2.9%) (2.7%) (3.0%) 0.0%
Victoria’s Secret 0.0% 2.0% 1.0% 1.0%
Soma 0.4% 0.4% 0.7% 0.5%
Men’s Specialty Apparel
Men’s Wearhouse (2.2%) 0.1% 2.9% (3.5%)
Jos A. Bank 3.6% (9.8%) (16.3%) (16.0%)
DXL (1.0%) 2.3% 4.6% 5.8%
Teen Specialty Apparel
Abercrombie & Fitch (5.0%) (6.0%) (4.0%) (4.0%)
American Eagle 0.4% 2.0% 3.0% 6.0%
The Buckle (16.1%) (15.3%) (10.8%) (11.1%)
Zumiez 5.1% 4.0% (4.9%) (7.5%)
Children’s Specialty Apparel
The Children’s Place 6.9% 4.6% 2.4% 5.1%
Gymboree (5.0%) (5.0%) (2.0%) 4.0%
Justice (1.0%) (1.0%) (4.0%) (11.0%)
Note(s): The most recent quarter reported for Anthropologie, Urban Outfi tters, and Free People ended January 31, 2017: J. Crew ended October 29, 2016; DXL represents holiday sales for
the months of November and December only; all other companies ended January 28, 2017.
7 | MONITOR RETAIL MARCH 2017

8 | MONITOR RETAIL MARCH 2017
NOLVs Increasing
Sales Trends Increasing
Gross Margin Mixed
Discounting Mixed
Trend Tracker
KEY INDUSTRY DRIVERS
• Consumer preference: Off-price retailers, dollar stores,
and mass merchants continue to be top choices for
consumers looking to save, as consumers increasingly
seek to spend more money on experiences such as dining
out, while saving on everyday needs and apparel.
• Growing store counts: While other sectors have been
reducing store counts due to declining customer traffi c,
the off-price and dollar store sectors continue to expand.
Examples include Dollar General, Marshalls, TJ Maxx,
Burlington Stores, Nordstrom Rack, and Ross Stores,
among others. Off-price retailers can benefi t from
bankruptcies and store closures of full price retailers, as
more inventory becomes available in the marketplace for
low prices, and there is the potential to gain market share.
• E-commerce: While dollar stores and many regional off-
price stores are not major players in the e-commerce
arena, more recently, Wal-Mart has been focused on
growing its online sales as opposed to its brick-and-
mortar store base. It has been making moves to compete
with Amazon. TJX continues to grow its online sales,
and Target has been working to have an omni-channel
business model as well.
• Grocery: Dollar stores and mass merchants have
been focused on expanding and improving grocery
departments in order to drive sales in this category.
• Profi tability: Within all sectors, retailers continually work
to improve profi tability. Lower-priced stores, especially
in the dollar store sector, have reported that increases
in minimum wages have been adversely impacting
profi tability.
Off-Price/Dollar Stores/Mass Merchants
COMPARABLE STORE SALES TRENDS
*Note(s): The most recent quarter reported for Wal-Mart ended January 27, 2017, includes
Sam’s Club and excludes fuel; Costco ended February 12, 2017 and excludes fuel; all
other companies ended January 28, 2017.
Most Recent Quarter
Prior Quarter
Two Quarters Ago
Three Quarters
Ago
TJX 3.0% 5.0% 4.0% 7.0%
Ross Stores 4.0% 7.0% 4.0% 2.0%
Burlington Stores 4.6% 3.7% 5.4% 4.3%
Saks Off 5th (5.9%) (8.4%) (11.4%) (4.1%)
Nordstrom Rack 4.3% 3.9% 5.3% 4.6%
Stein Mart (5.5%) (4.6%) (1.4%) (3.4%)
Wal-Mart 1.8% 1.2% 1.6% 1.0%
Target (1.5%) (0.2%) (1.1%) 1.2%
K-Mart (8.0%) (4.4%) (3.3%) (5.0%)
Costco 3.0% 1.0% 2.0% 3.0%
Dollar General 1.0% (0.1%) 0.7% 2.2%
Dollar Tree 1.2% 1.7% 1.2% 2.2%

9 | MONITOR RETAIL MARCH 2017
• Intellectual property: As e-commerce continues to
drive sales at many retailers, the intellectual property
associated with a retailer has gained value. Sycamore
Partners reportedly bid $26.8 million for The Limited's
intellectual property, including its e-commerce business;
Wet Seal's sold for $3.0 million to Gordon Brothers.
• Technological enhancements: Retailers have worked
to drive web and mobile sales. This includes improved
mobile websites, more personalized, targeted marketing,
enhanced websites, and using tablets in stores. Others
have focused on personalized service, and features such
as Chatbots.
E-commerce
KEY INDUSTRY DRIVERS
• Shift away from stores: E-commerce continues to grow,
benefi ting total retail sales, but also contributing to the
general decline in mall traffi c that has adversely impacted
many retailers' comparable store sales. E-commerce
represented 12.0% of total retail sales in the fourth
quarter of 2016, excluding gas and automobile sales.
Multi-channel retailers have found that stores and
websites are not mutually exclusive; in markets in which
a store closes, online sales dip, as consumers often like
being able to return online purchases in stores if needed.
• Amazon dominates: Amazon continues to dominate the
e-commerce sector, as its North American net sales
increased 22% in the fourth quarter of 2016, with revenue
reaching $26 billion.
• Shipping: Amazon's Prime membership has made the
expectation for free two-day shipping commonplace,
and has left other retailers striving to compete. Wal-Mart
in particular, after scrapping its similar free-shipping
membership program, started offering free two-day
shipping on orders of at least $35. Amazon countered
by lowering its free-shipping threshold for non-Prime
orders from $49 to $35. Other retailers have found that
offering free shipping adversely impacts profi tability, and
have been reducing the offer. Even LL Bean, a pioneer in
offering free shipping, may be changing its policy.
• Marketplace: Amazon's marketplace continues to allow it
to generate sales without taking the inventory risk. Some
retailers have also been offering products on Amazon,
and some use marketplaces to offer products from other
companies on their websites. Others offer expanded
assortments online, with products fulfi lled directly from
vendors.
SALES TRENDS
Fourth Quarter 2016
Third Quarter 2016
Second Quarter 2016
First Quarter 2016
% of Retail Sales 12.0% 11.9% 11.6% 11.2%
Change Year Over Year
14.3% 15.7% 15.8% 15.5%
Source: www.census.gov/retail. Results are revised estimates, calculated using information
in the most recent press release for the fourth quarter of 2016, excluding sales of
automobiles and gasoline.
NOLVs Mixed
Sales TrendsConsistent
Increasing
Gross Margin Mixed
Discounting Increasing
Trend Tracker

Footwear
KEY INDUSTRY DRIVERS
• Varying results: Within the footwear sector, results vary by
product category. Athletic footwear had been performing
well due to the athleisure trend; however, more recently
sales have been adversely impacted by store closures
within the sporting goods industry, particularly the loss of
The Sports Authority. Conversely, leisure footwear has
been performing well, as have retro or throwback styles,
and celebrity-designed or endorsed lines.
• Competition: Major brands have increasingly been
aiming to sell directly to consumers. Examples include
Nike and Under Armour, which have been growing
their store bases. This adds increased competition
to traditional footwear retailers. In addition, Amazon
is a formidable competitor within the footwear arena,
as it owns Zappos. Traditional shoe stores have been
challenged by competition from department stores, mass
merchandisers, and off-price stores.
• Omni-channel: Retailers have been working to increase
and revamp their online presence, as well as improve the
overall experience for customers in stores and online.
Many have been integrating technology into the shopping
experience, such as by allowing customers to preselect
items to try on in stores, or implementing touch screens
in stores to request help. Some also allow customers and
sales associates to view the store’s entire selection and
order additional styles online.
COMPARABLE STORE SALES TRENDS
Most Recent Quarter
Prior Quarter
Two Quarters
Ago
Three Quarters
Ago
DSW (7.0%) (2.0%) (1.2%) (1.6%)
Johnston & Murphy (1.0%) 1.0% 3.0% 6.0%
Foot Locker 5.0% 4.7% 4.7% 2.9%
Finish Line NA 0.7% 5.1% 1.5%
Famous Footwear 0.3% 2.1% (1.1%) 1.0%
Journeys (6.0%) (8.0%) (4.0%) 1.0%
Skechers 3.6% 3.2% 1.5% 9.8%
Steve Madden 1.1% 1.3% 5.4% 10.7%
Deckers 4.7% (3.2%) (7.3%) 2.6%
Crocs (Americas) (5.6%) (2.8%) (2.5%) 2.9%
*Note(s): The most recent quarter for Finish Line ended November 26, 2016; Crocs, Steve
Madden, Skechers, and Deckers ended December 31, 2016; all other companies ended
January 28, 2017.
Trend Tracker
NOLVsConsistent
Decreasing
Sales TrendsDecreasing
Mixed
Gross Margin Mixed
Discounting Mixed
10 | MONITOR RETAIL MARCH 2017

11 | MONITOR RETAIL MARCH 2017
Sporting Goods
KEY INDUSTRY DRIVERS
• Consolidation: Following some large-scale liquidations over
the past year and a half, including the 463 Sports Authority
Stores (mid-2016), 47 Sport Chalet stores (mid-2016), and
26 City Sports stores (late 2015), the industry continues
to see some activity, such as 66 MC Sports stores closing
(early 2017). The parent company of Eastern Mountain
Sports fi led for bankruptcy, and Gander Mountain is closing
32 of 162 stores. Consolidation results in opportunities for
remaining retailers to gain market share. Some retailers
have reported that during the Sports Authority liquidation,
sales dipped, but since the stores have closed, comparable
store sales have benefi ted.
• Industry activity: In addition to store closures, the industry
has also seen other types of activity. For example, Finish
Line recently sold its specialty running store chain
JackRabbit to a private investment fi rm. It remains to be
seen whether Bass Pro Shops' proposed acquisition of
Cabela’s will go through.
• Firearms and ammunition: For many sporting goods
retailers, fi rearms and ammunition are major categories.
Demand for fi rearms and ammunition remains strong;
however, following increases leading up to the election,
there has not been a rush to arms. President Trump is
not anticipated to make gun purchasing diffi cult. Some
retailers reported weaker gun sales recently, as sales are
compared to spikes following the San Bernardino shooting
in late 2015.
• Varying results by product: In general, sales of sporting
goods have been challenged at many retailers, except in
markets in which competitors have closed. Wholesalers
have noted challenging sales due to recent store closures.
Golf in particular continues to be a challenging category.
COMPARABLE STORE SALES TRENDS
Most Recent Quarter
Prior QuarterTwo Quarters
Ago
Three Quarters
Ago
Dick’s 5.0% 5.2% 2.8% 0.5%
Cabela’s (6.5%) (2.3%) 1.5% (4.3%)
Hibbett (2.2%) 0.7% 0.8% 1.1%
Big 5 3.1% 6.8% (1.7%) (1.9%)
Sportsman’s Warehouse
NA 2.1% 2.9% (2.2%)
*Note(s): Results for Dick’s include Dick’s Sporting Goods stores, Golf Galaxy, and the
e-commerce business; Cabela’s represents consolidated comparable store sales including
Canada. The most recent quarter for Dick’s and Hibbett ended January 28, 2017; Cabela’s
ended December 31, 2016; Big 5 ended January 1, 2017; Sportsman’s Warehouse ended
October 29, 2016.
• Channels: E-commerce remains a focus within the
sporting goods industry, and many retailers aim to offer an
omni-channel presence. In addition, retailers have faced
competition, as more wholesalers aim to sell directly to the
consumer.
Trend Tracker
NOLVs Mixed
Sales Trends Mixed
Gross Margin Consistent
Discounting Consistent
12 | MONITOR RETAIL MARCH 2017
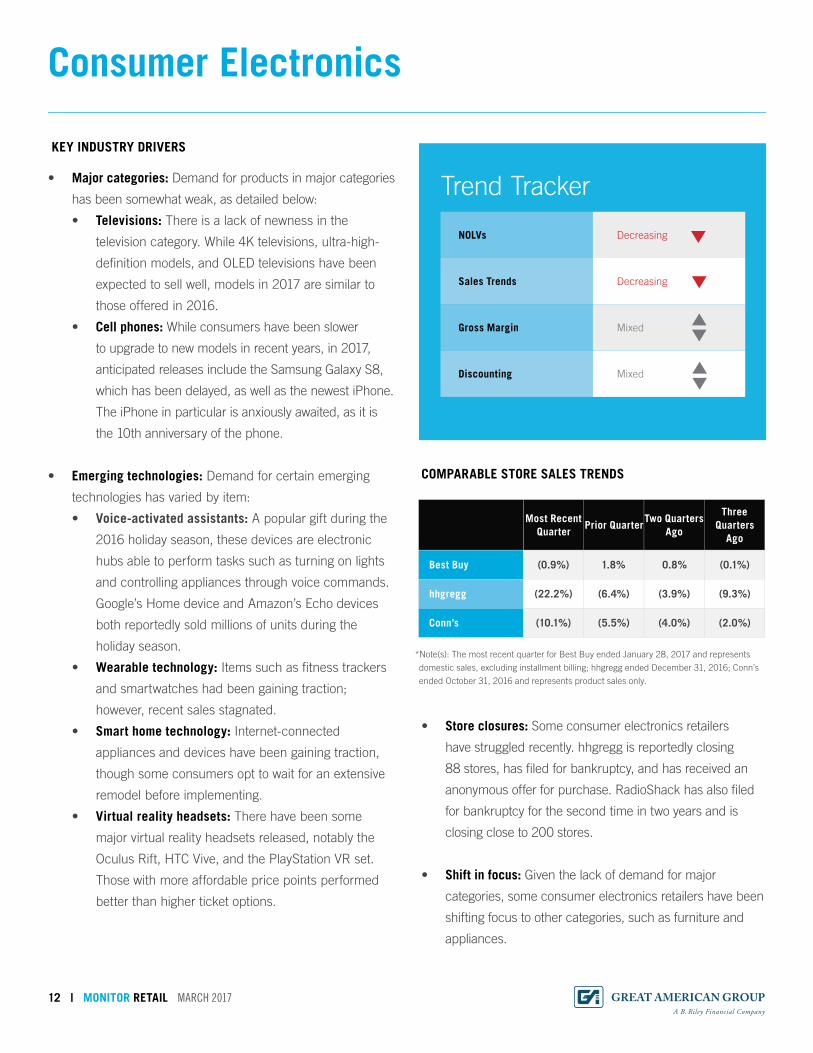
Consumer Electronics
KEY INDUSTRY DRIVERS
• Major categories: Demand for products in major categories
has been somewhat weak, as detailed below:
• Televisions: There is a lack of newness in the
television category. While 4K televisions, ultra-high-
defi nition models, and OLED televisions have been
expected to sell well, models in 2017 are similar to
those offered in 2016.
• Cell phones: While consumers have been slower
to upgrade to new models in recent years, in 2017,
anticipated releases include the Samsung Galaxy S8,
which has been delayed, as well as the newest iPhone.
The iPhone in particular is anxiously awaited, as it is
the 10th anniversary of the phone.
• Emerging technologies: Demand for certain emerging
technologies has varied by item:
• Voice-activated assistants: A popular gift during the
2016 holiday season, these devices are electronic
hubs able to perform tasks such as turning on lights
and controlling appliances through voice commands.
Google’s Home device and Amazon’s Echo devices
both reportedly sold millions of units during the
holiday season.
• Wearable technology: Items such as fi tness trackers
and smartwatches had been gaining traction;
however, recent sales stagnated.
• Smart home technology: Internet-connected
appliances and devices have been gaining traction,
though some consumers opt to wait for an extensive
remodel before implementing.
• Virtual reality headsets: There have been some
major virtual reality headsets released, notably the
Oculus Rift, HTC Vive, and the PlayStation VR set.
Those with more affordable price points performed
better than higher ticket options.
COMPARABLE STORE SALES TRENDS
Most Recent Quarter
Prior QuarterTwo Quarters
Ago
Three Quarters
Ago
Best Buy (0.9%) 1.8% 0.8% (0.1%)
hhgregg (22.2%) (6.4%) (3.9%) (9.3%)
Conn’s (10.1%) (5.5%) (4.0%) (2.0%)
*Note(s): The most recent quarter for Best Buy ended January 28, 2017 and represents
domestic sales, excluding installment billing; hhgregg ended December 31, 2016; Conn’s
ended October 31, 2016 and represents product sales only.
• Store closures: Some consumer electronics retailers
have struggled recently. hhgregg is reportedly closing
88 stores, has fi led for bankruptcy, and has received an
anonymous offer for purchase. RadioShack has also fi led
for bankruptcy for the second time in two years and is
closing close to 200 stores.
• Shift in focus: Given the lack of demand for major
categories, some consumer electronics retailers have been
shifting focus to other categories, such as furniture and
appliances.
Trend Tracker
NOLVs Decreasing
Sales Trends Decreasing
Gross Margin Mixed
Discounting Mixed

13 | MONITOR RETAIL MARCH 2017
Jewelry
KEY INDUSTRY DRIVERS
• Sales trends: According to the Bureau of Economic
Analysis, sales of jewelry and watches combined totaled
$80.9 billion in 2016, an increase of 4.8%. Jewelry sales
increased 4.8% to $71.4 billion, while watch sales grew
5.3% to $9.5 billion. Although sales increased in 2016,
the industry is facing several challenges. Even with an
improving economy, consumers continue to look for
bargains and are gravitating toward less expensive jewelry
pieces and fashion-driven costume jewelry. Millennial
shopping habits are also affecting the industry. Recent
studies have shown Millennials to be less interested in
fi ne jewelry, favoring lower-priced fashion jewelry. And,
similar to trends seen within apparel, Millennial shoppers
are directing more of their spending toward experiences
and electronics versus jewelry.
• Big players report disappointing holiday results: Luxury
retailer Tiffany struggled this holiday season as its U.S.-
based stores suffered declining sales. The decline was
driven by a drop in tourism given the strength of the U.S.
dollar, as well as a 14% decline in sales at the Company’s
fl agship store in New York. The store’s proximity to Trump
Tower affected foot traffi c, given all the recent protests.
In February 2017, the retailer announced that its Chief
Executive Offi cer was stepping down. To appeal to a
younger customer base, the company has been working
to step up its online presence by partnering with Net-A-
Porter. Mid-tier leader Signet did not perform as well as
expected this holiday season and plans to close up to 170
stores. Its stores rely heavily on mall traffi c to drive sales,
and mall traffi c continues to decline. Moreover, despite
efforts to boost its omni-channel shopping experience,
technical diffi culties with the company’s e-commerce
platform disrupted sales during the key holiday season.
COMPARABLE STORE SALES TRENDS
• Commodity pricing: Although prices fl uctuate, gold prices
are currently lower than the highs seen a few years ago.
In addition, diamond prices in 2016 were down 5%.
These pricing trends have allowed consumers the ability
to buy higher-quality gold and diamond jewelry products
compared to a few years ago, when such items were too
expensive.
NOLVs Decreasing
Sales Trends Mixed
Gross Margin Increasing
Discounting Consistent
Trend Tracker
Most Recent Quarter
Prior QuarterTwo Quarters
Ago
Three Quarters
Ago
Signet/Sterling (4.9%) (3.8%) (3.1%) 2.3%
Zale US (4.9%) (1.5%) (2.2%) 2.4%
Tiffany & Co. (2.0%) (2.0%) (9.0%) (10.0%)
Blue Nile (4.4%) 0.0% (3.2%) (4.8%)
*Note(s): The most recent quarter for Signet ended January 28, 2017. Tiffany & Co. ended
January 31, 2017. Signet/Sterling represents Kay and Jared. Zale US is owned by Signet.
Blue Nile ended October 2, 2016 and represents net sales. Blue Nile was acquired by
Bain Capital in February 2017.

Books
KEY INDUSTRY DRIVERS
• Let's get physical: Unit sales of print books increased
again in 2016 by 3.3%, the third year in a row that sales
increased. Sales via mass merchants (such as Wal-Mart
and Costco) dropped 5.3%. Sales through retail and club
(chain bookstores, Amazon, and independents) increased
5.0%. However, much of the growth in the retail and club
channel is coming from Amazon, where unit sales of print
books increased by 35 million, or 15% in 2016. This is as
Barnes & Noble sold 10 million less than 2015. Experts
attribute Amazon’s continued dominance not only to the
ongoing shift toward online purchasing, but Amazon’s
strategy of discounting print titles after the agency pricing
model prevented the retailer from discounting e-books.
• E-book sales: e-books declined for the second year in a
row. Nielsen, which tracks e-book sales from 30 traditional
publishers, reported that unit sales of e-books declined
16% in 2016. E-book sales continue to be impacted by the
return to the agency pricing model, which effectively raised
the average price of e-books by $3 to $8. In comparison,
self-published e-books average $3 and are not tracked by
Nielsen. This portion of e-books, estimated at between
10% and 20% of the market, is still growing. A recent study
estimated Amazon’s e-book sales grew 4% in 2016.
• Retail trends: Brick-and-mortar players continue to
expand non-book categories and in-store events to drive
traffi c. However, the industry is still grappling with falling
customer traffi c. Barnes & Noble reported comparable
store sales during the nine-week holiday period declined
9.1%, due primarily to lower traffi c and comparisons to
last year's strong sales of adult coloring books and Adele's
CD. Barnes & Noble expects comparable store sales to
decline 7% in fi scal 2017.
COMPARABLE STORE SALES TRENDS
Amazon continues to expand its store base, but these
locations are more like showrooms that not only feature
books, but also give customers a glimpse of other
Amazon products, like Kindles, Fire tablets, and Echo.
• Textbooks: College textbook sales have been challenged
by declining student enrollment and growth in rentals.
In addition, Amazon continues to slowly penetrate the
college market. To expand its customer base, Barnes &
Noble Education acquired MBS Textbook Exchange in
February 2017. Together, the combined entity will operate
over 1,490 physical and virtual bookstores and serve
more than six million students.
NOLVs Decreasing
Sales Trends Decreasing
Gross Margin Consistent
Discounting Consistent
Trend Tracker
Most Recent Quarter
Prior QuarterTwo Quarters
Ago
Three Quarters
Ago
Barnes & Noble (8.3%) (3.2%) (6.0%) (0.8%)
*Note(s): The most recent quarter for Barnes & Noble ended January 28, 2017.Represents
core comparable bookstore sales and excludes sales of NOOK products and textbooks.
14 | MONITOR RETAIL MARCH 2017

Arts and Crafts
KEY INDUSTRY DRIVERS
• Product sales: The arts and crafts industry is driven by
trend-right products. In recent years, retailers benefi ted
from products such as the Rainbow Loom, adult coloring
books, and other kids crafts items. However, recently there
has been no new major trend to drive sales, and several
retailers have experienced declines in comparable store
sales as a result. While children's crafts and activities
remain a solid seller, the popularity of other categories,
such as scrapbooking, has waned.
• Competition: In addition to there being no hot product to
drive sales, arts and crafts retailers face competition from
a variety of sources. Mass merchants such as Wal-Mart
and Target, as well as online-giant Amazon, have taken
some market share from typical arts and crafts retail stores.
Recently, the industry has seen consolidation, as Hancock
Fabrics liquidated its 185 stores in 2016.
• Online infl uence: The industry continues to be infl uenced
by social media and online trends. Pinterest’s popularity,
for example, continues to increase as crafters use the
site to share crafting ideas, inspiration, instructions, and
images. Users now have the option to easily buy certain
pinned items directly from the platform. In addition, Etsy
has also continued to encourage the growth of DIY as the
site allows crafters to sell their arts and crafts products
online. More recently, Etsy announced Etsy Studio, which
will allow users to search for and purchase craft supplies
based on specifi c needs, such as size, color, material,
shape, and use. The new concept could further challenge
traditional retailers.
COMPARABLE STORE SALES TRENDS
• DIY: Despite mixed results at some arts and crafts retailers,
the industry as a whole has benefi ted as DIY projects
remain popular, having originally taken off during the 2007
to 2009 recession. Crafts often relate to home décor,
weddings, and parties. Fashion and jewelry projects
(particularly bracelets) also remain popular, as does
crochet, knitting, quilting, and sewing.
NOLVs Mixed
Sales Trends Decreasing
Gross Margin Consistent
Discounting Consistent
Trend Tracker
Most Recent Quarter
Prior QuarterTwo Quarters
Ago
Three Quarters
Ago
Michaels (1.0%) (2.0%) 0.7% 0.9%
Etsy 25.4% 33.0% 39.1% 39.8%
*Note(s): The most recent quarter for Michaels ended January 27, 2017; the most recent
quarter for Etsy ended December 31, 2016, and represents comparable revenue.
15 | MONITOR RETAIL MARCH 2017

16 | MONITOR RETAIL MARCH 2017
These experiences, in addition to numerous others, provide
GA with valuable insight into the market trends and the
consumer response that can be expected in a liquidation.
They give us an understanding as to recovery values that can
be achieved for retailers within these industries. In addition to
this liquidation experience, GA has worked with and appraised
numerous retailers, including industry leaders within each
sector. While our clients remain confi dential, GA’s extensive
list of appraisal experience includes:
• Numerous retailers of apparel and accessories, including
major department store retailers and a variety of specialty
retailers that are found in malls throughout the country.
• Several e-commerce and multi-channel retailers, as
well as fl ash sale websites and auction websites. In
particular, GA has appraised 73 of the top 500
e-commerce companies as reported by Internet Retailer.
Leading off-price retailers of apparel and accessories,
including major national and regional chains.
• Retailers of consumer electronics, including
smaller, more localized chains, as well as regional,
national, and international retailers with close to
4,500 store locations.
• Many jewelry retailers, including one of the largest in the
United States, with locations throughout the country and
net sales exceeding $1.4 billion annually.
• Major national and regional discount and dollar stores,
including one of the country’s largest chains, with over
10,000 stores.
• Leading book retailers, including one with over 700 store
locations and sales of upwards of $4.5 billion.
• Sporting goods retailers that specialize in a number of
products, including those for outdoor sports, recreational
ball sports, hunting, camping, and fi shing,
and a variety of other equipment for outdoor enthusiasts.
• Major regional grocery store chains including one with
a store base of upwards of 800 and net sales in excess
of $10.0 billion, as well as smaller local grocery store
retailers and pharmacies.
In addition to our internal personnel, GA maintains contacts
within the retail industry that we utilize for insight and
perspective on recovery values.
GA is one of the largest liquidators of retail inventory and has been involved in a variety of liquidations, ranging from the
disposition of excess inventory and the closing of underperforming stores, to full-scale liquidations of national retailers with
hundreds of stores. GA has experience with full and partial liquidations of companies throughout a variety of retail sectors, some
of which are detailed below:
Experience
Target Canada MC Sports Offi ce Depot/Max Circuit City Macy’s Fashion Bug
Mervyns Family Christian Stores GapFrederick’s of
HollywoodFortunoff RadioShack
Linens ‘N Things Naartjie Whitehall Jewelers Borders Hancock Fabrics Boot Town
A&P Tower Records Gordmans Love CultureOrchard Supply
HardwareEddie Bauer

17 | MONITOR RETAIL MARCH 2017
Appraisal & Valuation Team
John Bankert
President
(781) 429-4054
Nicole Hines
Project Manager
(781) 429-4072
David Triompo
Managing Director
(781) 429-4067
Kipp Visi
Project Manager
(312) 777-7957
Scott Carpenter
President, GA Retail Solutions
(818) 884-3737
Tracy Foohey
Associate Director
(781) 429-4059
Louise Shimazu
Associate Project Manager
(818) 746-9339
Robert Vaughn
Project Manager
(818) 746-9351
Adam Alexander
President, GA Global Partners
(818) 884-3737
BUSINESS DEVELOPMENT
OPERATIONS
ASSET DISPOSITION TEAM
Mike Marchlik
National Sales & Marketing Director
(818) 917-8175
Drew Jakubek
Managing Director
Southwest Region
(214) 455-7081
Ryan Mulcunry
Executive Vice President
Northeast Region, Canada & Europe
(857) 231-1711
Jennie Kim
Vice President,
Western Region
(818) 974-0602
David Seiden
Executive Vice President,
Southeast Region
(404) 808-8153
Daniel J. Williams
Managing Director,
New York Region
(908) 251-3580
Bill Soncini
Senior Vice President,
Midwest Region
(773) 495-4534
Kelly Chapman
Associate Project Manager
(312) 596-5752
Leslie Ward
Associate Project Manager
(781) 429-4065

About Great American Group
© 2017 Great American Group, LLC. All Rights Reserved.
MONITOR RETAILGREATAMERICAN.COM
MARCH 2017
800-45-GREAT
VOLUME
LOS ANGELES (HQ)21255 Burbank Blvd.
Suite 400
Woodland Hills, CA 91367
T 818.884.3737
F 818.884.2976
CHARLOTTE, NC15720 Brixham Hill Ave.
Suite 300
Charlotte, NC 28277
T 704.227.7161
F 704.227.7171
ATLANTA1200 Abernathy Rd.
Suite 1700
Atlanta, GA 30328
T 770.551.8115
WILTON, CT73 Old Ridgefi eld Road
Suite 6
Wilton, CT 06897
T 203.663.5101
NEW YORKGraybar Building
420 Lexington Avenue
Suite 3001
New York, NY 10170
T 917.464.1521
MILWAUKEE10850 West Park Place
Suite 970
Milwaukee, WI 53224
T 414.831.2850
BOSTON300 First Avenue
Suite 201
Needham, MA 02494
T 781.444.1400
F 781.444.1401
GERMANYPrinzregentenstr 18
Fifth Floor
80538 Munchen,
Germany
DALLAS2745 North Dallas Parkway
Suite 660
Plano, TX 75093
T 972.996.5630
F 972.996.5639
CHICAGO10 South LaSalle St.
Suite 2170
Chicago, IL 60603
T 312.777.7950
F 312.777.7948
AUSTRALIALevel 29, Chifl ey Tower
2 Chifl ey Square
Sydney, NSW 2000
Australia
238
Great American Group is a leading provider of asset
disposition solutions and valuation and appraisal services to a
wide range of retail, wholesale, and industrial clients, as well
as lenders, capital providers, private equity investors, and
professional services fi rms. For more information, please visit
www.greatamerican.com.
Great American Group, LLC is a wholly owned subsidiary of
B. Riley Financial, Inc. (NASDAQ: RILY), a diversifi ed provider
of collaborative fi nancial and business advisory services
through several subsidiaries, including: B. Riley & Co. LLC, a
leading investment bank and a FINRA & SIPC member, which
provides corporate fi nance, research, and sales & trading to
corporate, institutional and high net worth individual clients;
Great American Group, LLC; B. Riley Capital Management,
LLC, an SEC registered Investment Advisor, which includes B.
Riley Asset Management, a provider of investment products to
institutional and high net worth investors, and B. Riley Wealth
Management (formerly MK Capital Advisors), a multi-family
offi ce practice and wealth management fi rm focused on the
needs of ultra-high net worth individuals and families; and Great
American Capital Partners, a provider of senior secured loans
and second lien secured loan facilities to middle market public
and private U.S. companies.
B. Riley Financial, Inc. is headquartered in Los Angeles with
offi ces in major fi nancial markets throughout the United
States and Europe. For more information on B. Riley Financial,
Inc., please visit www.brileyfi n.com. For B. Riley’s research
access, please contact a B. Riley representative at 310-966-
1444.
Headquarters
21255 Burbank Blvd. Suite 400
Woodland Hills, CA 91367
800-45-GREAT
www.greatamerican.com
Top Related