


Languages
Pages
Legal

1
FY18 EARNINGS May 17, 2018
This statement may contain estimated financial data, information on future projects and
transactions and future business results/performance. Such forward-looking data are provided for
estimation purposes only. They are subject to market risks and uncertainties and may vary
significantly compared with the actual results that will be published. The estimated financial data
have been presented and approved by the Board of Directors on 05/17/18 and have not been
audited by the Statutory Auditors. (Additional information is specified in the most recent Ubisoft
Registration Document filed on July 21, 2017 with the French Financial Markets Authority (l’Autorité
des marchés financiers)).
D I S C L A I M E R
Yves Guillemot, President and Chief Executive Officer
Alain Martinez, Chief Financial Officer
DISCLAIMER
2

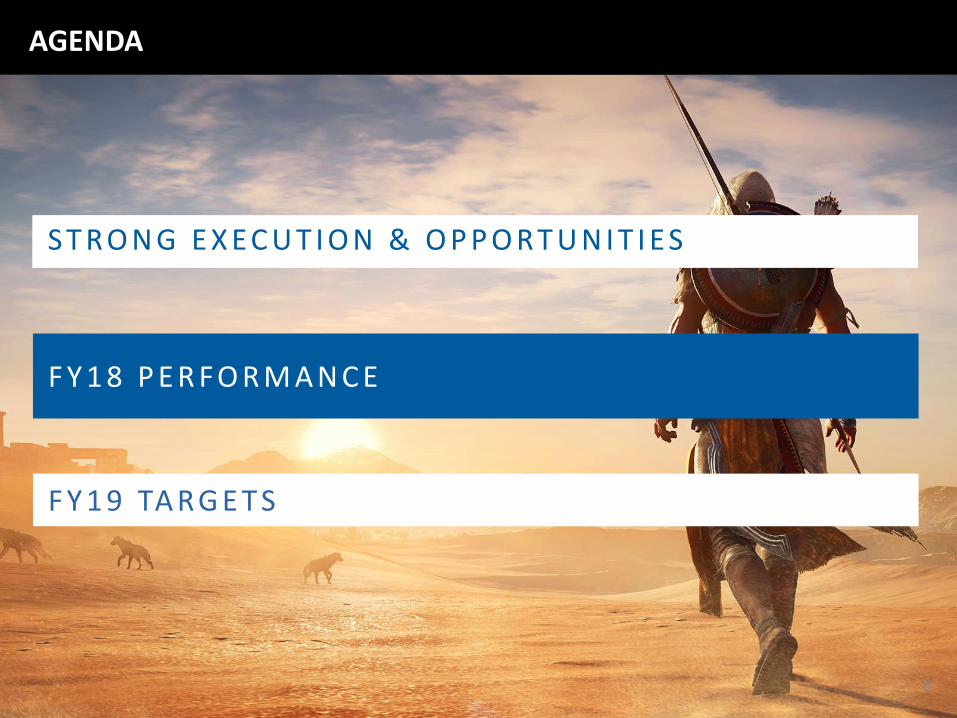
AGENDA
F Y 1 8 P E R F O R M A N C E
F Y 1 9 TA RG E T S
S T RO N G E X EC U T I O N & O P P O RT U N I T I E S
3

MORE PLAYERS SPENDING MORE TIME PLAYING AND ENJOYING MORE & MORE OUR HIGHLY POLISHED EXPERIENCES
MORE PEOPLE ON MORE PLATFORMS THROUGH EVEN MORE BUSINESS MODELS
"God of War is PS4’s fastest-selling exclusive by a mile"
03/05/2018
"Far Cry 5 is Ubisoft’s second biggest launch ever"
04/04/2018
"New Call of Duty game sales double last year’s version"
08/11/2017
"Monster Hunter World is the the fastest-sellingCapcom game in history"
09/02/201807/11/2017
"Assassin’s Creed Origins sells twice as fast as Syndicate"
21/04/2018
"The history of Battle Royale : from mod toworldwide phenomenon"
OUR INDUSTRY IS THRIVING
4
5
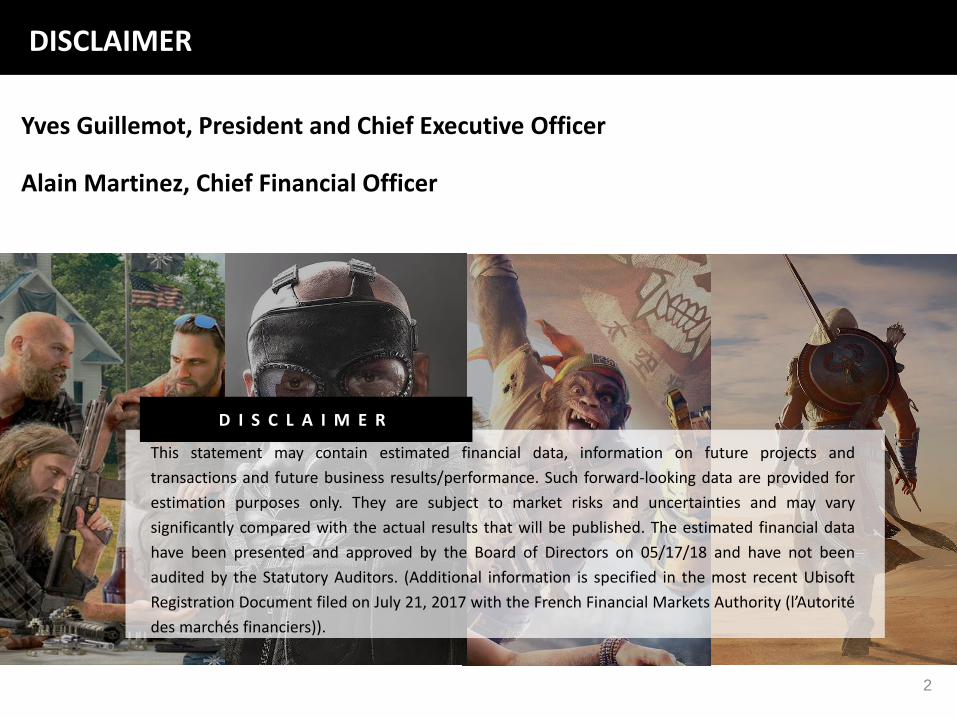
STRONG FOCUS ON EXECUTION & SHAREHOLDERS VALUE CREATION
TOTAL SHAREHOLDER RETURN
Since IPO* 5-year 2-year 1-year
UBISOFT +4 421% +897% +221% +86%
Activision Blizzard +6 719% +399% +95% +29%
Take-Two +2 864%** +606% +225% +69%
Electronic Arts +1 789% +491% +81% +22%
NASDAQ +518% +129% +59% +22%
CAC40 Net Return +340% +57% +34% +6%
Euro Stoxx Media Supersector Return +108% +55% +10% +2%
Source: FactSet as of May 11, 2018
*Ubisoft IPO as of July 1, 1996
** Since IPO on April 15, 1997

KEY STRENGTHS OF LONG TERM STRATEGY
INVESTING INOUR TEAMS’SKILLS
DEPENDABLEPRODUCTIONORGANIZATION
A MORE ADAPTABLE COMPANY
TRACK RECORD INENGAGING WITHCOMMUNITIES
IP OWNERSHIP
6

7
TOPLINE GROWTH & PROFITABILITY PROGRESSION OPPORTUNITIES
UBISOFT IS JUST STARTING TO REAP THE BENEFITS OF THE DIGITAL TRANSFORMATION
SHORT & MEDIUM TERM OPPORTUNITIES
Mobile & PC marketsDigital
China Esports
LONG TERM OPPORTUNITIES
New forms of gaming (streaming…) significant expansion of TAM
Investment in Ubisoft Club, AI & machine learning taylor players experiences
AGENDA
F Y 1 8 P E R F O R M A N C E
F Y 1 9 TA RG E T S
S T RO N G E X EC U T I O N & O P P O RT U N I T I E S
8

FY18 : STRONG EXECUTION ACROSS THE BOARD
9
SALES: 1 732 M€, + 19 % yoy, vs target of 1 640 M€
Record launch
Stronger than expected Season Pass
Strong dynamic expected for FY19
Record revenue for an AC game in Q4
FY19

10
> 10 million players
Very solid engagement
(Splinter Cell mission)
> 30 million players
Esports viewership* + 300% yoy
New dedicatedservers & services
= Communitysentiment
FY18: STRONG EXECUTION ACROSS THE BOARD
* Viewership Six Invitational 2018 vs 2017
> 20 million players
FY19

11
FY18: STRONG EXECUTION ACROSS THE BOARD
New PCU
& MAUs (up 22% yoy)
Records
88 M unique active players*
New friends relations + 40%
Record Uplay PC MAU & PCU
Mobile DAUs
up 130 %
* On PC & consoles in FY18

FY18
SALES
1 005 M€, + 38% yoy, 58% of total rev (vs 50% last year)
826 M€, + 27% yoy, 48% of total rev (vs 45% last year)
12-MONTH
1 732 M€, + 19% yoy, vs target of 1 640 M€
BACK-CATALOG
DIGITAL REVENUES
PLAYER RECURRING INVESTMENT
483 M€, + 59% yoy, 28% of total rev (vs 21% last year))
12
FY18: STRONG EXECUTION ACROSS THE BOARD

FY15 FY16 FY17 FY18
Physical
Digital Distribution
Player RecurringInvestment*
* Includes ingame items, DLCs/season pass,subscription & advertising
383
269
447
315
132
729
DIGITAL SPLIT(in M€)
425
304
TOTAL REVENUE SPLIT DIGITAL 58%
42% 30%
28%
522
483
1 005
FY18: STRONG EXECUTION ACROSS THE BOARD
113
MOBILE : + 66%, 5% of total revenues
13

FY18: STRONG EXECUTION ACROSS THE BOARD
14
Back-catalog (in % of sales)
12% 15% 20% 16% 23% 16%25%
45%
FY10 FY11 FY12 FY13 FY14 FY15 FY16 FY17 FY18
48%
VERY SOLID BACK-CATALOG: 826 M€
FY19
INCREASINGLY RECURRING NATURE OF OUR BUSINESS

15
OUR GAMES BENEFIT FROM THE MORE RECURRING PROFILE…
MORE ENGAGEMENT ROCKETING PLAYTIME
MORE RECURRING PROFIT
BETTER EXPERIENCEREVIEWS AND COMMUNITY
SENTIMENT ++
MORE DEVELOPMENT TIME

16
… AND IT SHOWS!
AC OriginsSouth Park FBWMario + Rabbids
Far Cry 5
COD WWIIDestiny 2
Star Wars BFIIFIFA 18
NFS PaybackMadden 18
NBA 2K18WWE 2K18
FY18Average
(PS4, XBO, PC, Switch)
83818581
7785
67826082
8266
83
81
73
74
FY18: STRONG EXECUTION ACROSS THE BOARD

FY18 :STRONG EXECUTION ACROSS THE BOARD
17
RECORD OPERATING INCOME: 300 M€, vs target of 270 M€
CASH FLOW FROM OPERATION: 215 M€FY18

Gross margin up 246 M€ & 1,5 points
R&D up 139 M€ & up 2,5 points
SG&A up 44 M€ & down 2 points : topline growth leverage + marketing efficiency from digital and back-
catalog impact
variable marketing expenses : 233 M€ or 13,5% of total sales (219 M€ & 15.0% in FY17)
fixed structure costs : 241 M€ or 13.9% of total sales (211 M€ & 14.5% in FY17)
7 M€ one-off costs related to Vivendi exit
FY17-18 : NON-IFRS P&L
18
€ million, except for per share data2017-18 2016-17
% %
Sales 1 731,9 1 459,9
Gross profit 1 435,1 82,9 1 189,0 81,4
Non-IFRS R&D expenses (661,1) (38,2) (521,7) (35,7)
Non-IFRS Selling expenses (335,9) (19,4) (313,1) (21,4)
Non-IFRS G & A expenses (138,0) (8,0) (116,4) (8,0)
Non-IFRS SG & A expenses (473,9) (27,4) (429,5) (29,4)
Non IFRS operating income 300,1 17,3 237,7 16,3
Net Financial Income (5,7) (9,0)
Share in profit of associates (0,2) (0,3)
Income Tax (73,6) (54,0)
Non IFRS Net Income 220,6 174,3
Non IFRS Diluted earnings per share 1,80 1,46
Non IFRS nbr of shares fully diluted 122 444 119 677

139 M€ increase in total R&D P&L : stronger line-up and post launch plans + additional
depreciation costs on to be released titles, ahead of a very competitive year
5% increase in Capitalized R&D
19
FY17-18: R&D
€ million 2017-18 2016-17
Depreciation of in-house software-related production 438,2 388,1
Depreciation of external software-related production and licenses 24,1 19,7
Royalties 15,5 12,3
Non Capitalized R&D & others* 183,4 101,6
Total R&D P&L 661,1 521,7
Capitalized in-house software-related production 498,5 476,2
Capitalized external software-related production and licenses22,7 20,5
(excluding future commitments)
Royalties 15,5 12,3
Non Capitalized R&D & others* 183,4 101,6
Total R&D Cash 720,2 610,5
*mostly Post-Launch content

20
FY17-18 : IFRS / NON-IFRS RECONCILIATION
Non-current operating expenses : 40 M€ related to brand and goodwill depreciation
Net Financial charge adjustment : 8 M€ related to the implicit convertible bond option costs
Tax rate : 25%
€ million,
except for per share data
2017-18 2016-17
IFRS Adjustment Non IFRS IFRS Adjustment Non IFRS
Sales 1 731,9 1 731,9 1 459,9 1 459,9
Total Operating expenses (1 509,6) 77,8 (1 431,8) (1 284,1) 61,9 (1 222,2)
Stock-based compensation (39,6) 39,6 0 (36,8) 36,8 0
Non-current operating income
and expenses(38,2) 38,2 0 (25,1) 25,1 0
Operating Income 222,3 77,8 300,1 175,8 61,9 237,6
Net Financial income (13,4) 7,7 (5,7) (16,2) 7,2 (9,0)
Share in profit of associates (0,2) (0,2) (0,3) - (0,3)
Income tax (69,2) (4,4) (73,6) (51,4) (2,6) (54,0)
Net Income 139,5 81,1 220,6 107,8 66,5 174,3
Diluted earnings per share 1,18 0,62 1,80 0,92 0,54 1,46

21
105 M€ increase in CF from operations : EBIT growth + narrowing of R&D P&L/Cash gap
45 M€ increase in WCR : 63 M€ impact from absence of factoring
179 M€ Net acquisitions/disposals : 100 M€ from the SWAP agreement related to Vivendi exit (deposit treated
guarantee, should return to liquidities by Sept. 2018)
412 M€ in Net acquisition of own shares :
Including 300 M€ from the pre-paid forward agreement (Vivendi exit)
FY17-18 : CASH FLOWS & CLOSING CASH POSITION
€ million 2017-18 2016-17
Opening cash position(80,4) (41,7)
Cash flows from operations214,9 110,3
Change in WCR(45,0) 38,8
Cash flows from operating activities 169,9 149,1
Net investment in capital assets (59,3) (63,4)
Net free cash flow110,5 85,7
Net acquisitions/disposals(179,3) (105,6)
Proceeds from issue of capital and other financial flows 49,0 9,5
Net acquisitions/disposals of own shares(411,5) (67,8)
Effect of exchange rate fluctuations(27,9) (0,1)
Equity component(8,4) 39,6
Decrease/(increase) in net debt (467,6) (38,7)
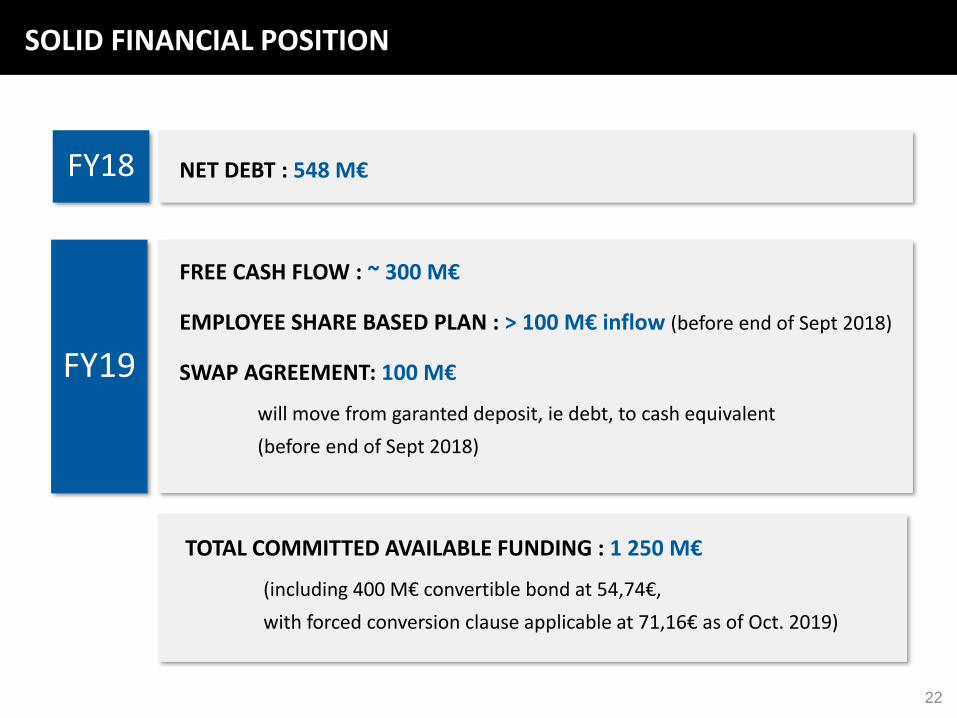
Closing cash position(548,1) (80,4)
22
FREE CASH FLOW : ~ 300 M€
EMPLOYEE SHARE BASED PLAN : > 100 M€ inflow (before end of Sept 2018)
SWAP AGREEMENT: 100 M€
will move from garanted deposit, ie debt, to cash equivalent
(before end of Sept 2018)
SOLID FINANCIAL POSITION
NET DEBT : 548 M€
FY19
TOTAL COMMITTED AVAILABLE FUNDING : 1 250 M€
(including 400 M€ convertible bond at 54,74€,
with forced conversion clause applicable at 71,16€ as of Oct. 2019)
FY18

AGENDA
F Y 1 8 P E R F O R M A N C E
F Y 1 9 TA RG E T S
S T RO N G E X EC U T I O N & N E W O P P O RT U N I T I E S
23

DIGITAL: ~ 65% of net bookings, vs ~ 60% prev.
PRI: ~ 30% of net bookings, vs > 25% prev.
BACK-CATALOG: ~ 50% of net bookings, vs > 45% prev.driven by ACO + significant reorders on FC5 + mobile growth + Live titles
FY19 NET BOOKINGS: ~ 2 050 M€ (vs 2 100 M€ prev.) / Q1 NET BOOKINGS: ~ 350 M€
FY19 IFRS 15 SALES: ~ 2 000 M€ / Q1 IFRS 15 SALES: ~ 350 M€
NON-IFRS OPERATING INCOME: ~440 M€
FREE CASH FLOW: ~ 300 M€
FY19: FURTHER EARNINGS GROWTH
.
.
3 new AAA releases: 19 M units (vs 4 AAA and 23 M units prev.)
+ 1 unannounced franchise
FY19
24

25
Top Related