


Languages
Pages
Legal

2495-08
Joint ICTP-IAEA Workshop on Nuclear Data for Analytical Applications
Massimo Chiari
21 - 25 October 2013
I.N.F.N. Florence
Fundamentals of the Particle Induced Gamma-ray Emission (PIGE) technique, experimental procedures and examples of PIGE analysis

Fundamentals of the Particle Induced Gamma-ray Emission (PIGE)technique, experimental procedures
and examples of PIGE analysis
Massimo Chiari / I.N.F.N. Florence
max0068
Joint ICTP-IAEA Workshop on Nuclear Data for Analytical Applications, Trieste - Italy, 21 - 25 October 2013
Outline
• Fundamentals of PIGE technique
• Elemental bulk analysis by PIGE
• Depth profiling by PIGE
• Examples of PIGE bulk analysis (thick targets, thin targets)
• Essential bibliography
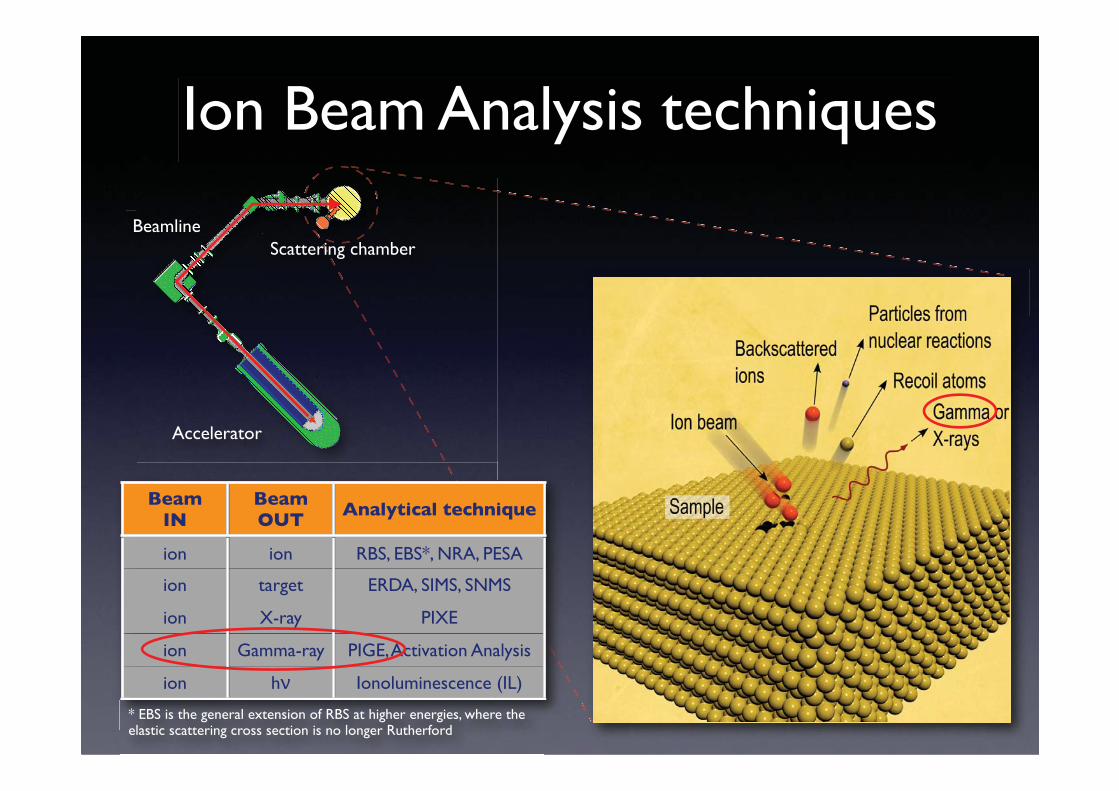
Ion Beam Analysis techniques
Accelerator
BeamlineScattering chamber
BeamIN
BeamOUT Analytical technique
ion ion RBS, EBS*, NRA, PESA
ion target ERDA, SIMS, SNMS
ion X-ray PIXE
ion Gamma-ray PIGE, Activation Analysis
ion h Ionoluminescence (IL)
* EBS is the general extension of RBS at higher energies, where the elastic scattering cross section is no longer Rutherford
General features of IBA
• Multielemental
• Quantitative analysis
• High sensitivity (1-100 ppm in at/cm3; 1011-1012 in at/cm2)
• Surface analysis (10 Å - 10 m)
• Depth profiling
• Non-destructive
• No sample pre-treatment
• Microanalysis (lateral resolution <1 m)
• 2D mapping
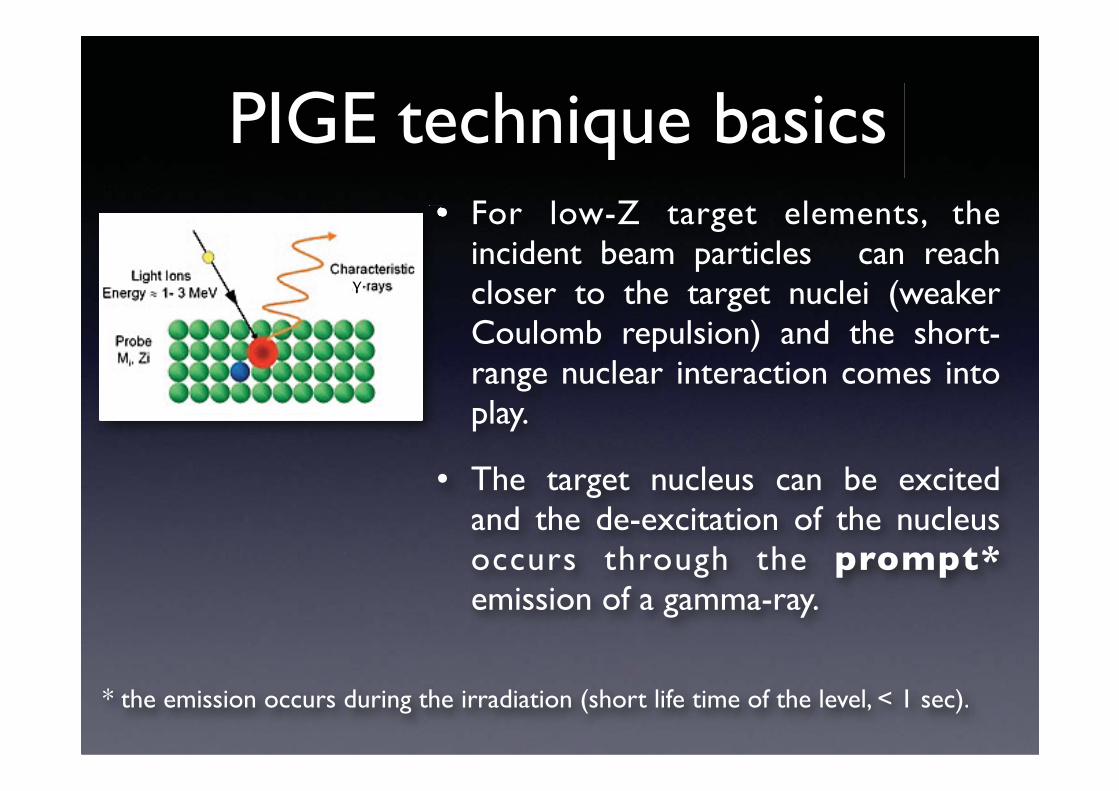
PIGE technique basics• For low-Z target elements, the
incident beam particles can reach closer to the target nuclei (weaker Coulomb repulsion) and the short-range nuclear interaction comes into play.
• The target nucleus can be excited and the de-excitation of the nucleus occurs through the prompt*emission of a gamma-ray.
* the emission occurs during the irradiation (short life time of the level, < 1 sec).

PIGE technique basics• Nuclear energy levels are specific for
each isotope, hence the gamma-ray energ ies , are a character i s t ic “fingerprint” of every single isotope.
• The detection of gamma-ray energies allows to identify and quantify the low-Z isotopes in the target sample.1236
1348
1357
110
197
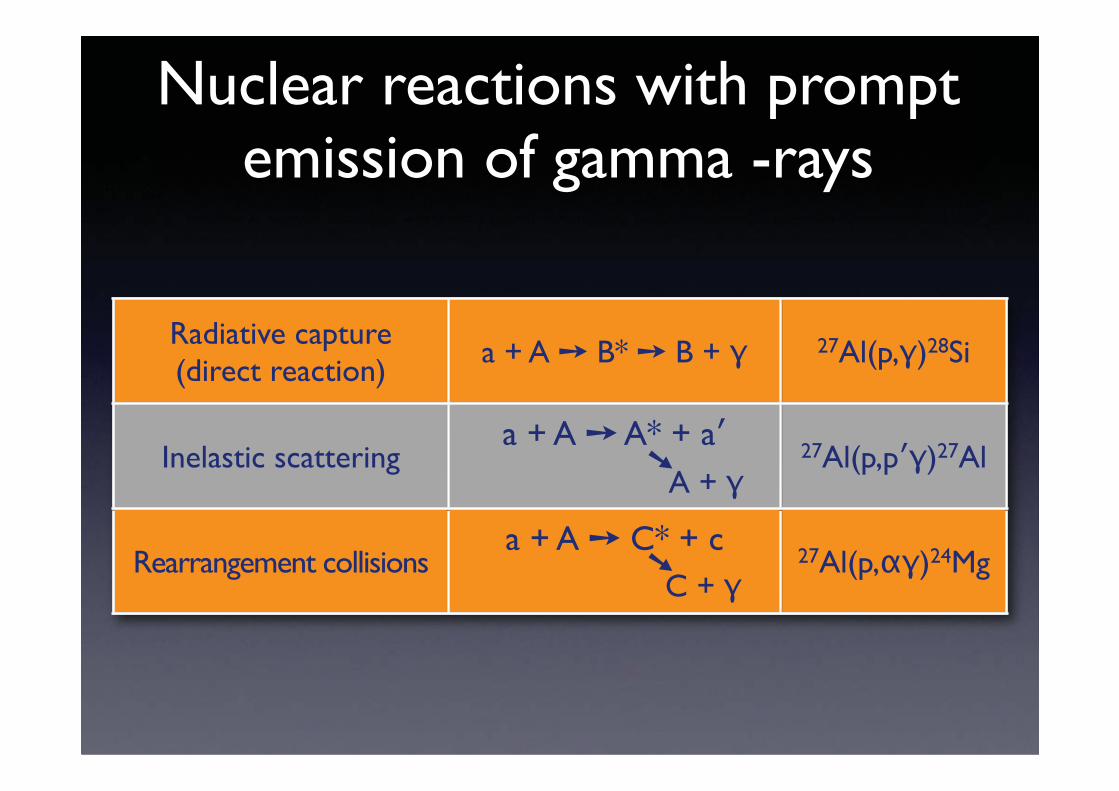
Nuclear reactions with prompt emission of gamma -rays
Radiative capture(direct reaction)
a + A B* B + 27Al(p, )28Si
Inelastic scatteringa + A A* + a
A + 27Al(p,p )27Al
Rearrangement collisionsa + A C* + c
C + 27Al(p, )24Mg
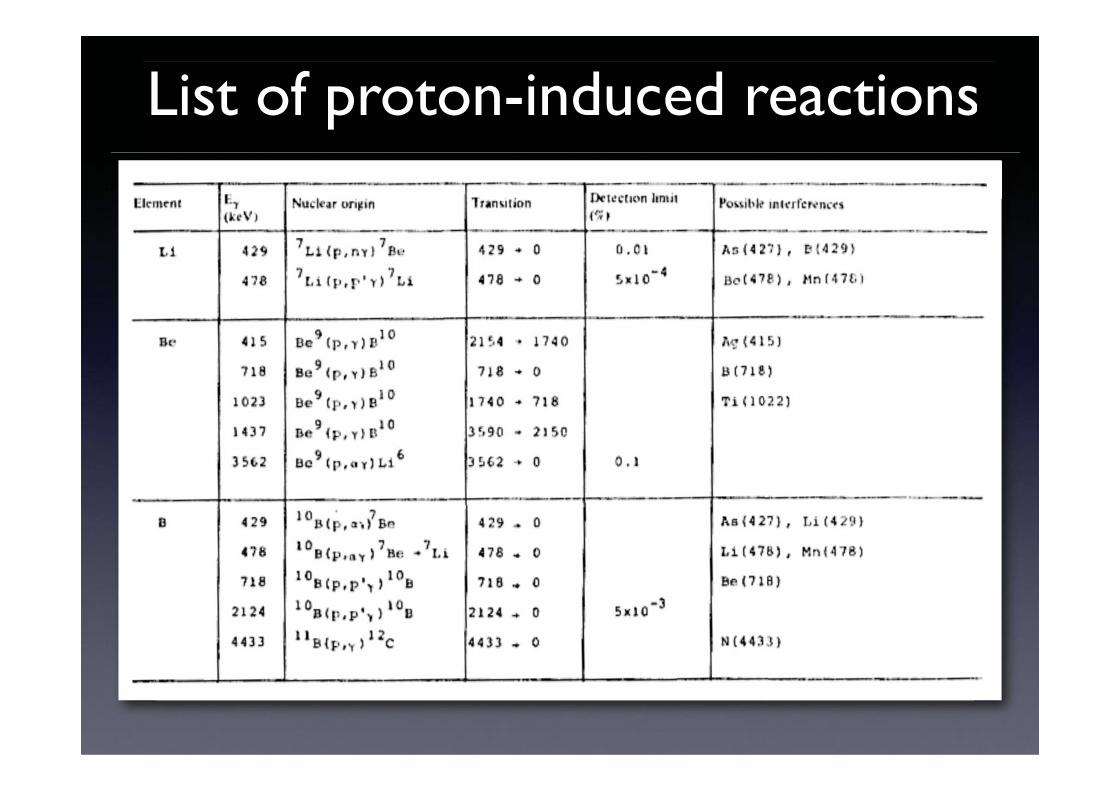
List of proton-induced reactions

List of proton-induced reactions
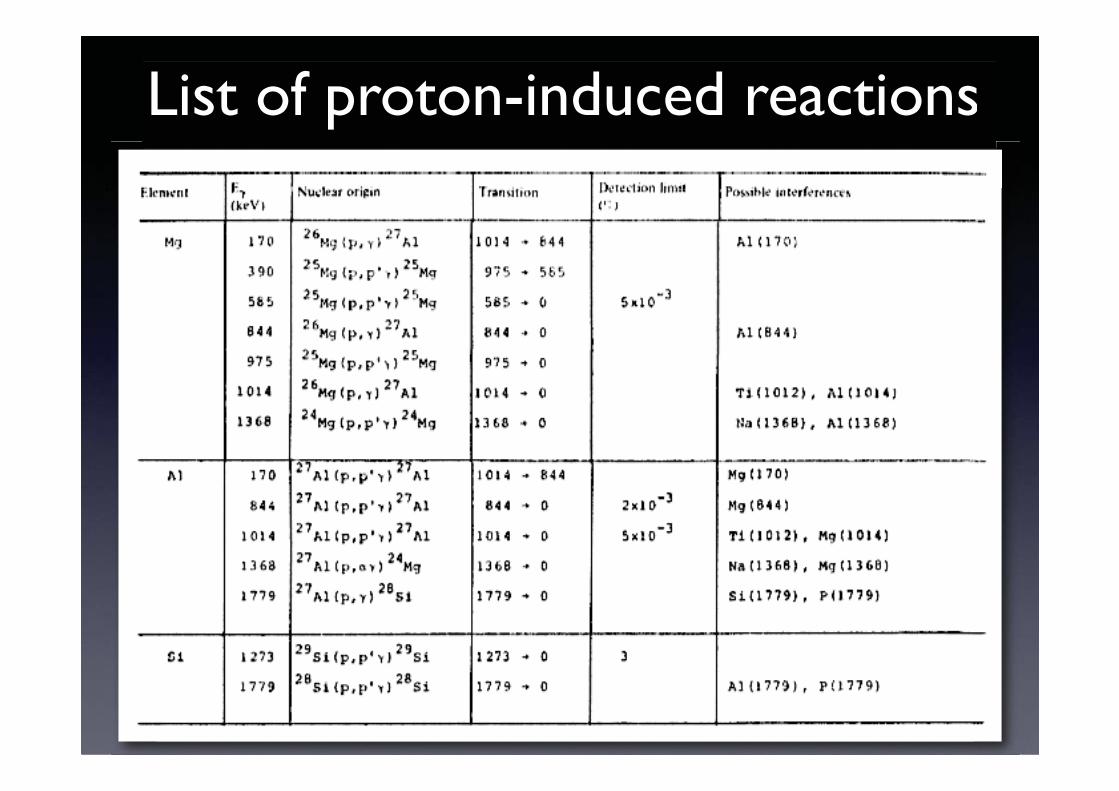
List of proton-induced reactions
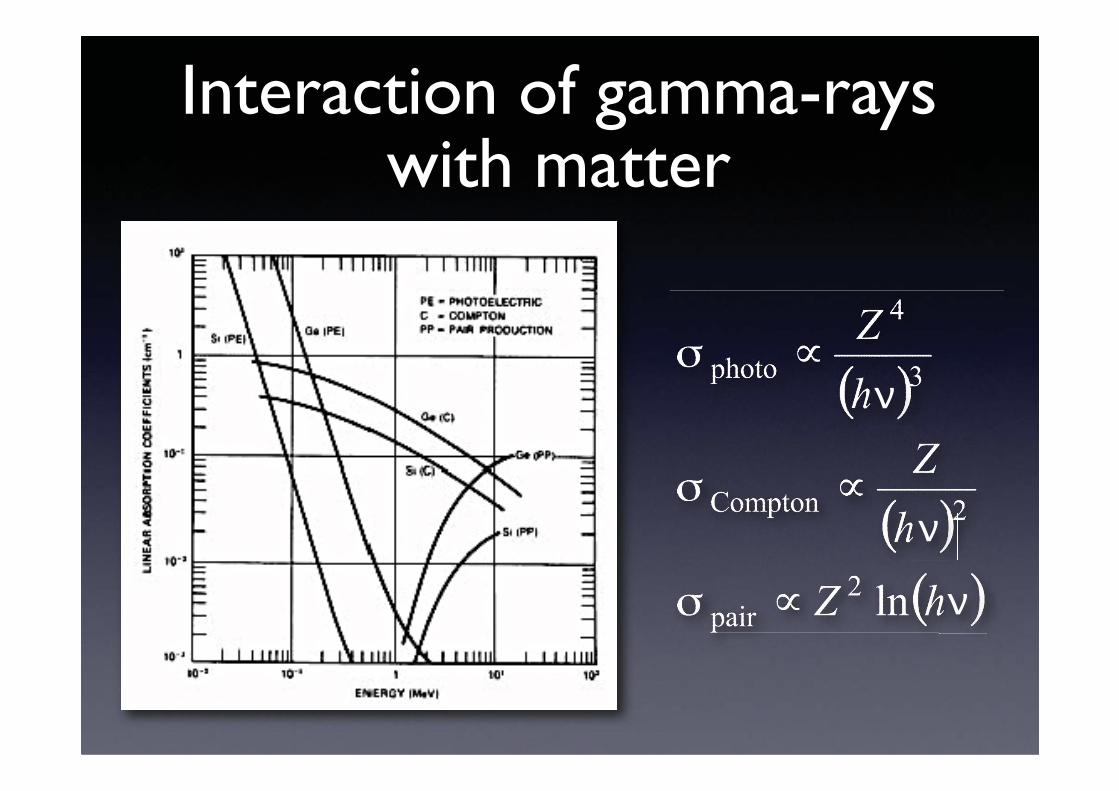
Interaction of gamma-rayswith matter
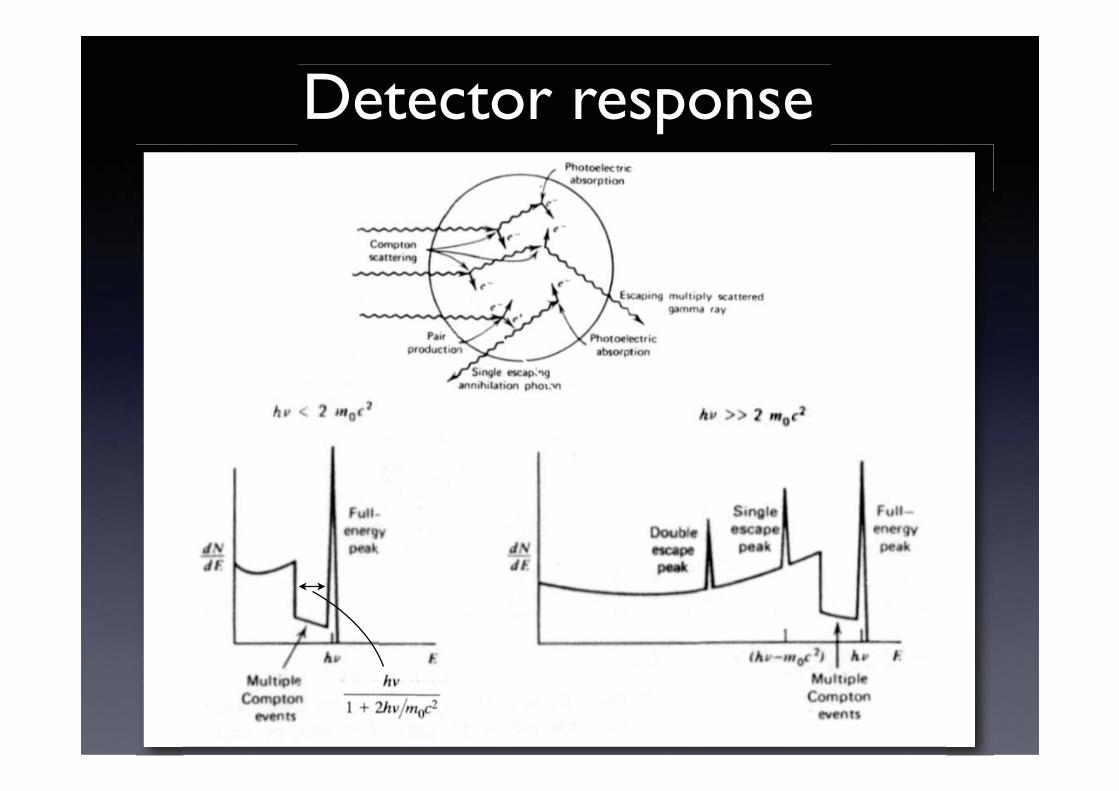
Detector response
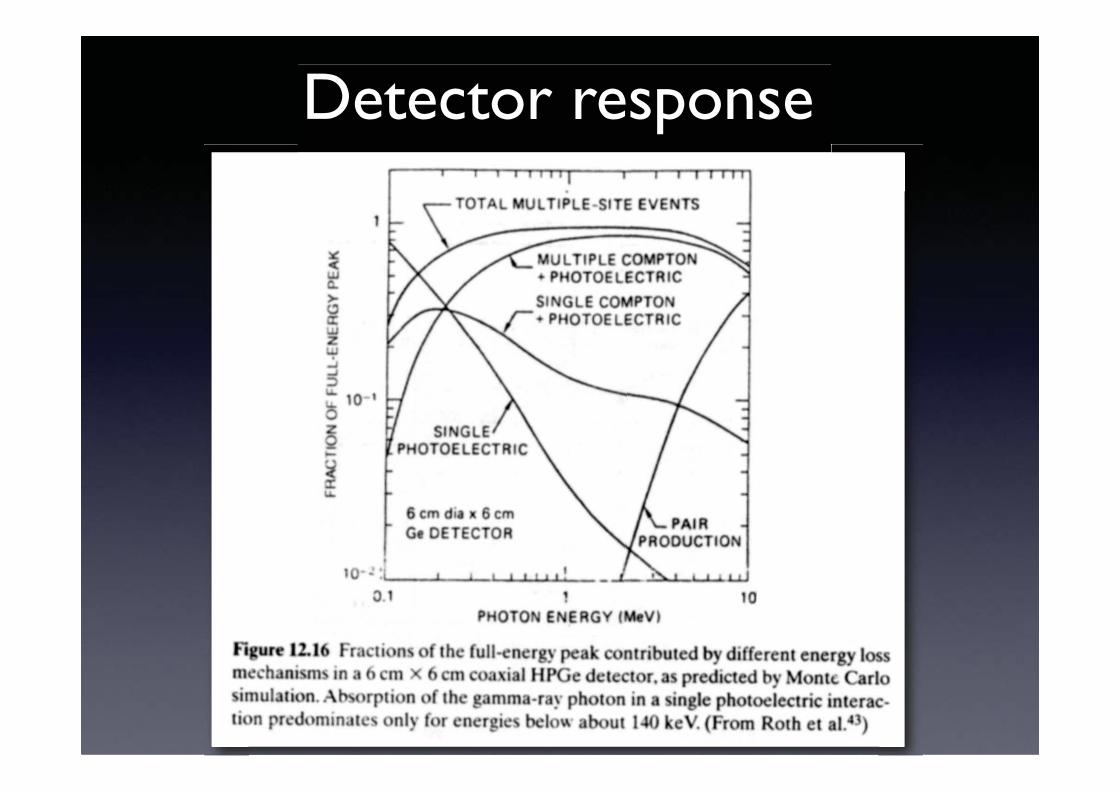
Detector response
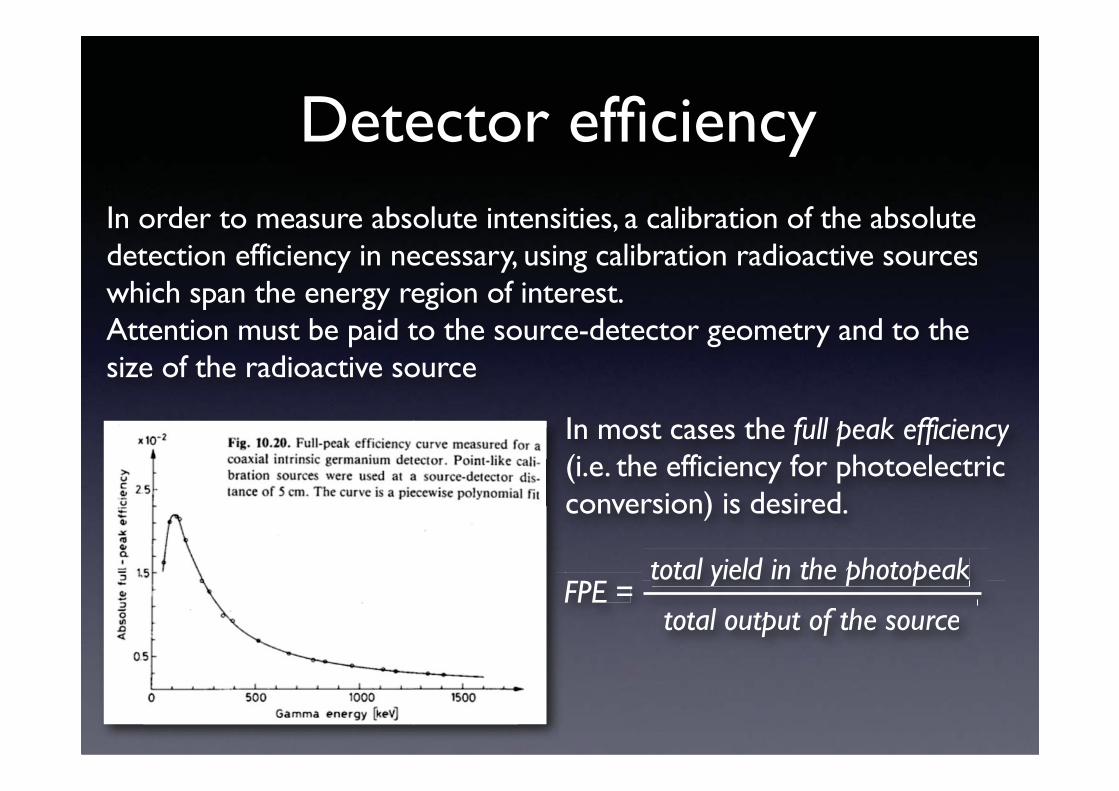
Detector efficiencyIn order to measure absolute intensities, a calibration of the absolute detection efficiency in necessary, using calibration radioactive sourceswhich span the energy region of interest.Attention must be paid to the source-detector geometry and to the size of the radioactive source
In most cases the full peak efficiency (i.e. the efficiency for photoelectric conversion) is desired.
FPE = total output of the source
total yield in the photopeak=
total output of the source
y p p

Boro-silicate glassSoda-lime glass
Examples of PIGE spectra
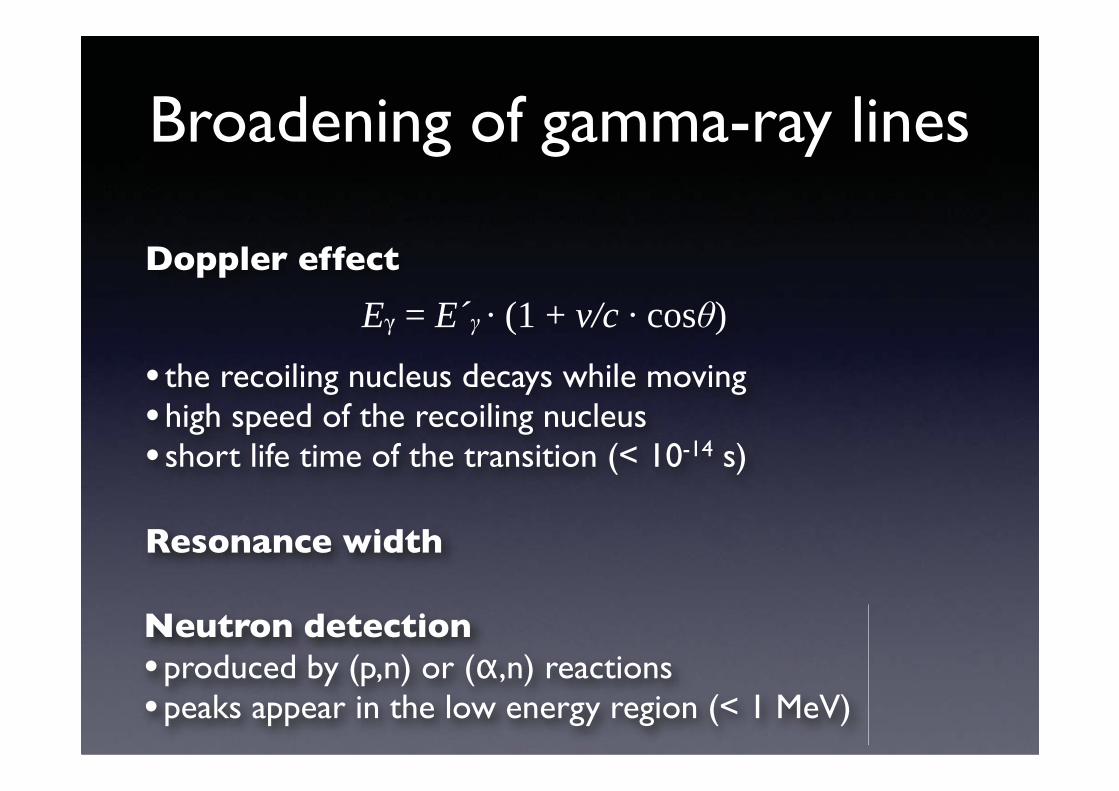
Broadening of gamma-ray lines
Doppler effect
E = E´ (1 + v/c cos )
• the recoiling nucleus decays while moving•high speed of the recoiling nucleus• short life time of the transition (< 10-14 s)
Resonance width
Neutron detection•produced by (p,n) or ( ,n) reactions•peaks appear in the low energy region (< 1 MeV)
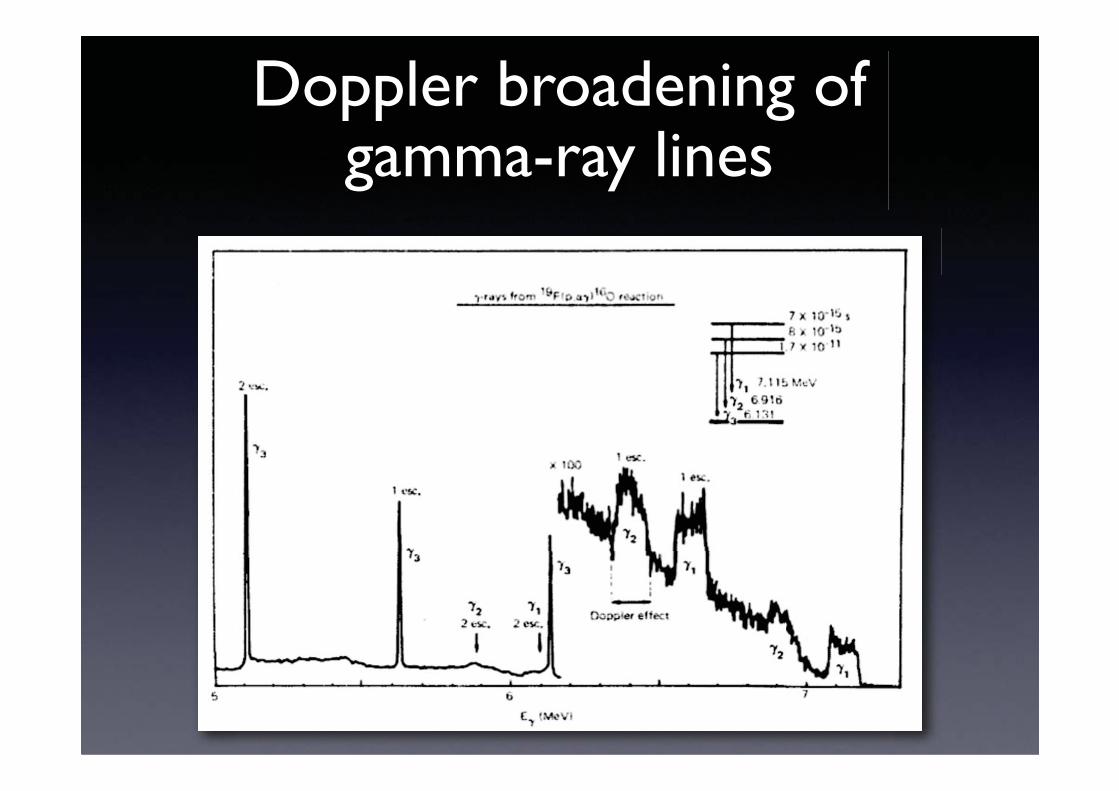
Doppler broadening ofgamma-ray lines

E = 197 keV E = 440 keV
E = 478 keV E = 429 keV
PIGE cross sectionsThe cross sections are the superimposition of resonances (Breit-Wigner) on a continuum due to direct nuclear reactions
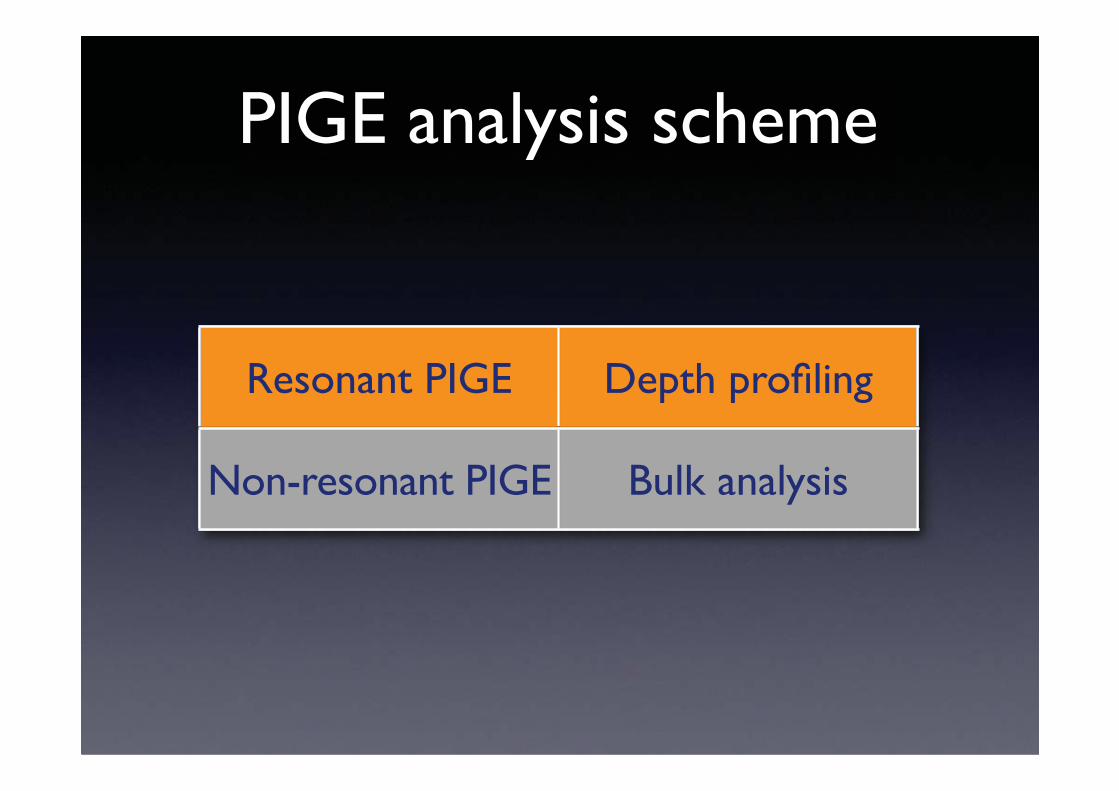
PIGE analysis scheme
Resonant PIGE Depth profiling
Non-resonant PIGE Bulk analysis
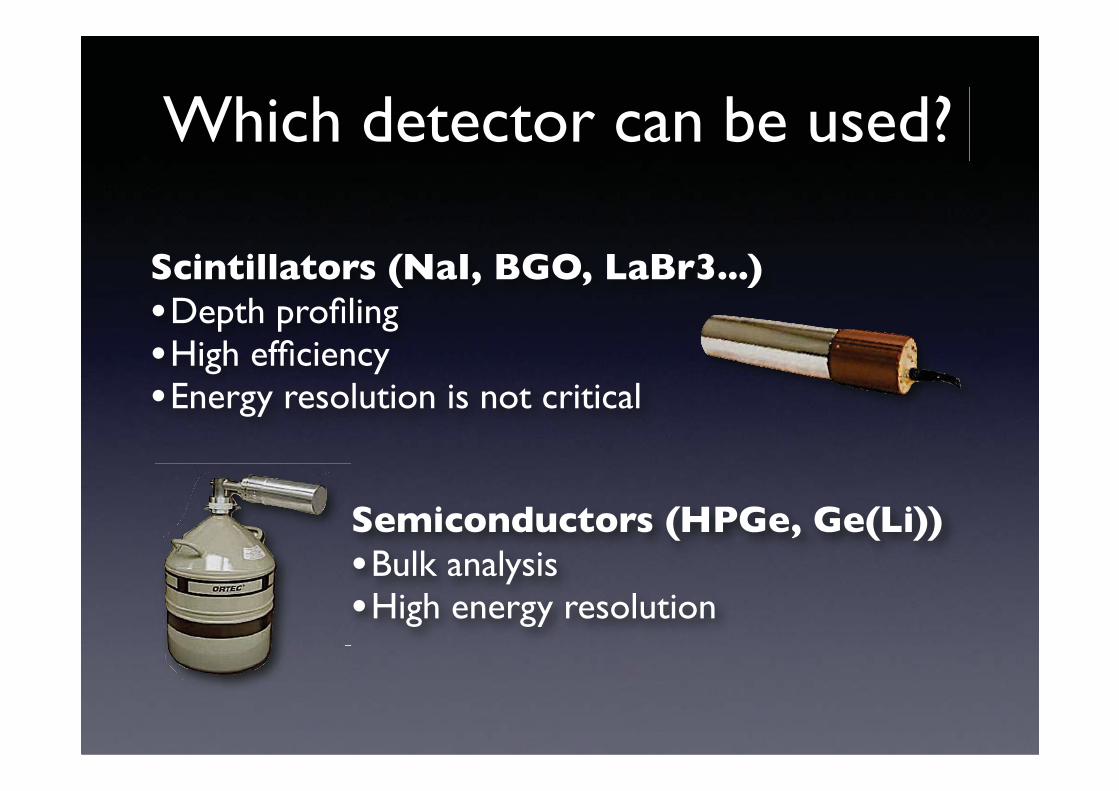
Which detector can be used?
Scintillators (NaI, BGO, LaBr3...)•Depth profiling•High efficiency•Energy resolution is not critical
Semiconductors (HPGe, Ge(Li))•Bulk analysis•High energy resolution

Spectra obtained with differentdetectors
NaI(Tl)Ge(Li)
PIGE bulk analysis

PIGE elemental analysis
The elemental concetrations (NT) are obtained from measured quantities (i.e. gamma-ray peak areas) using physical models implementing the sample structure and the physical microscopicdata and processes:
The principal needed microscopic data are stopping powers and differential cross sections of the interaction (as well asthe detector absolute efficiency)
PIGE bulk analysis of thick targets
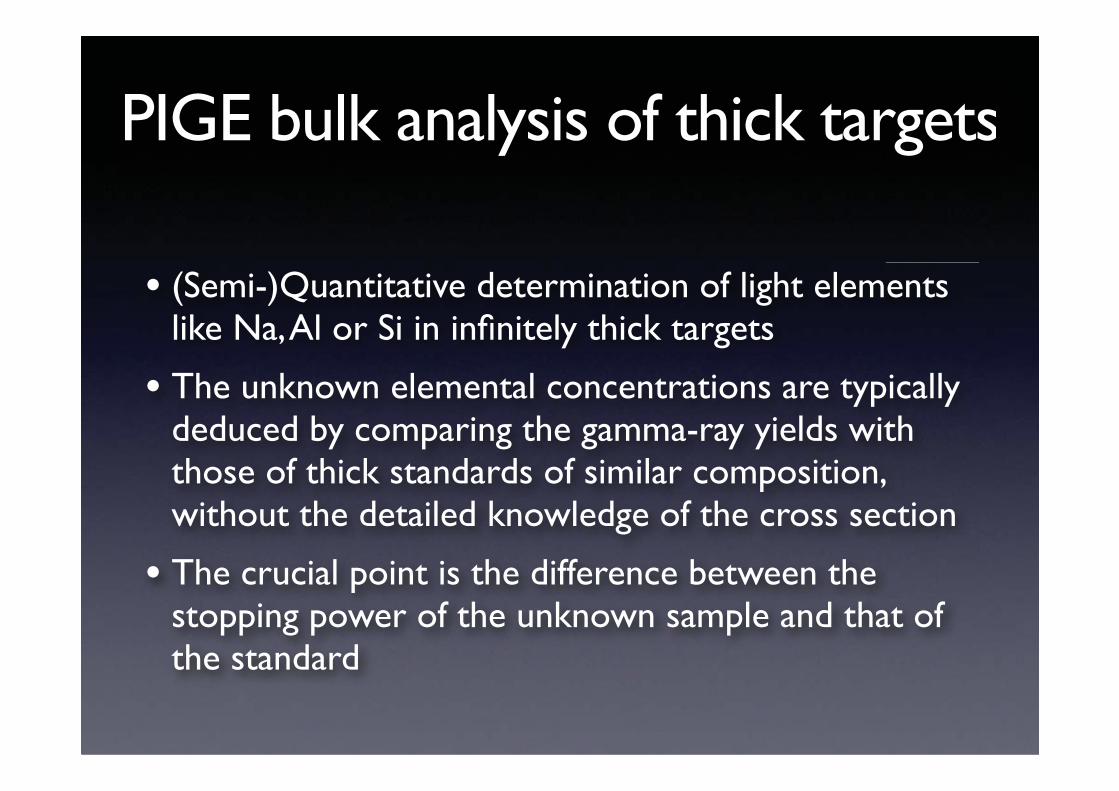
• (Semi-)Quantitative determination of light elements like Na, Al or Si in infinitely thick targets
• The unknown elemental concentrations are typically deduced by comparing the gamma-ray yields with those of thick standards of similar composition, without the detailed knowledge of the cross section
• The crucial point is the difference between the stopping power of the unknown sample and that of the standard
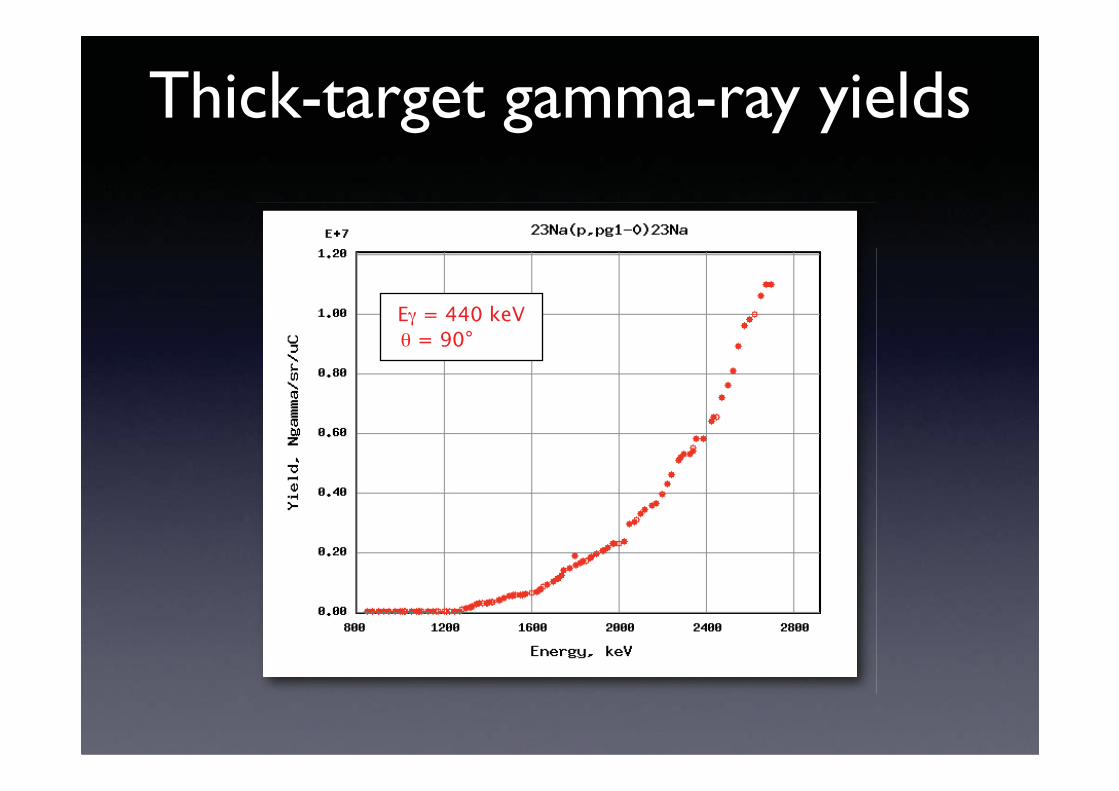
E = 440 keV
= 90°
Thick-target gamma-ray yields

E such as:
Y(E0) = 2 Y(E )
The “E ” method is valid as long as the excitation
function varies slowly with the energy
PIGE quantitative analysis: comparison with thick standards
Csamp = Cstd Ysamp (E0)/Ystd (E0) Ssamp (E )/Srif (E )
E0E
Y = 0.60
Y = 0.30
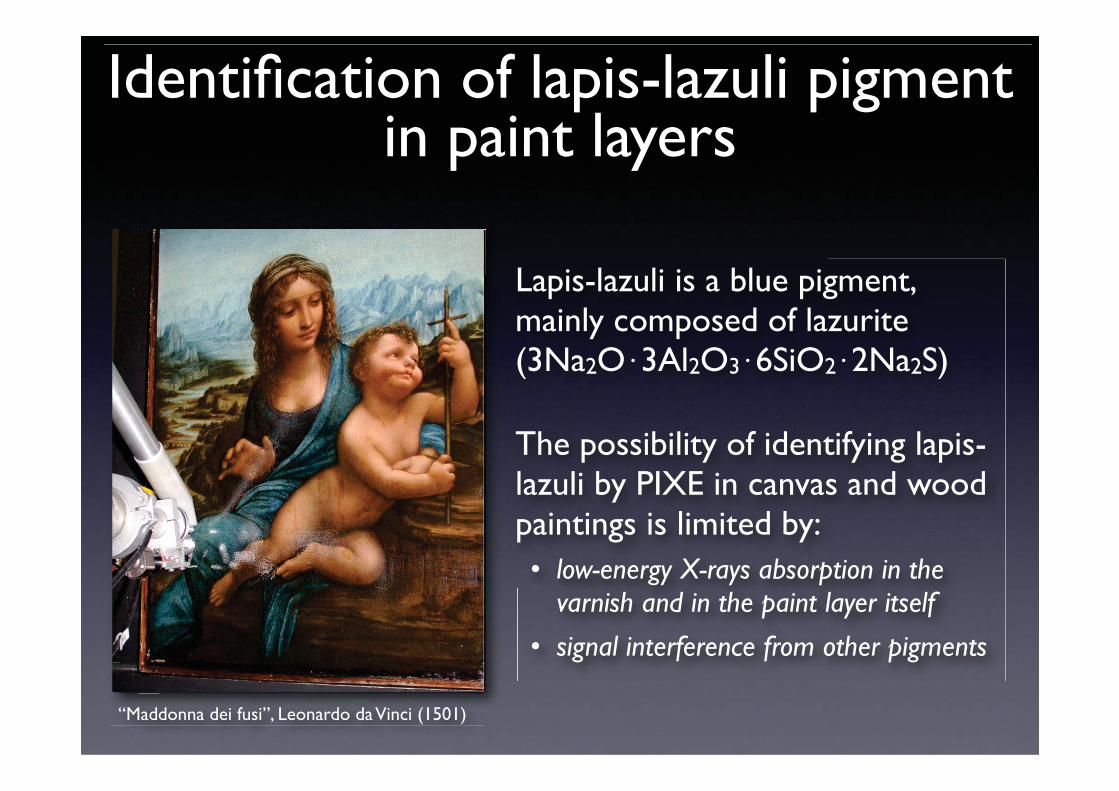
Identification of lapis-lazuli pigment in paint layers
Lapis-lazuli is a blue pigment, mainly composed of lazurite (3Na2O 3Al2O3 6SiO2 2Na2S)
The possibility of identifying lapis-lazuli by PIXE in canvas and wood paintings is limited by:• low-energy X-rays absorption in the
varnish and in the paint layer itself
• signal interference from other pigments
“Maddonna dei fusi”, Leonardo da Vinci (1501)
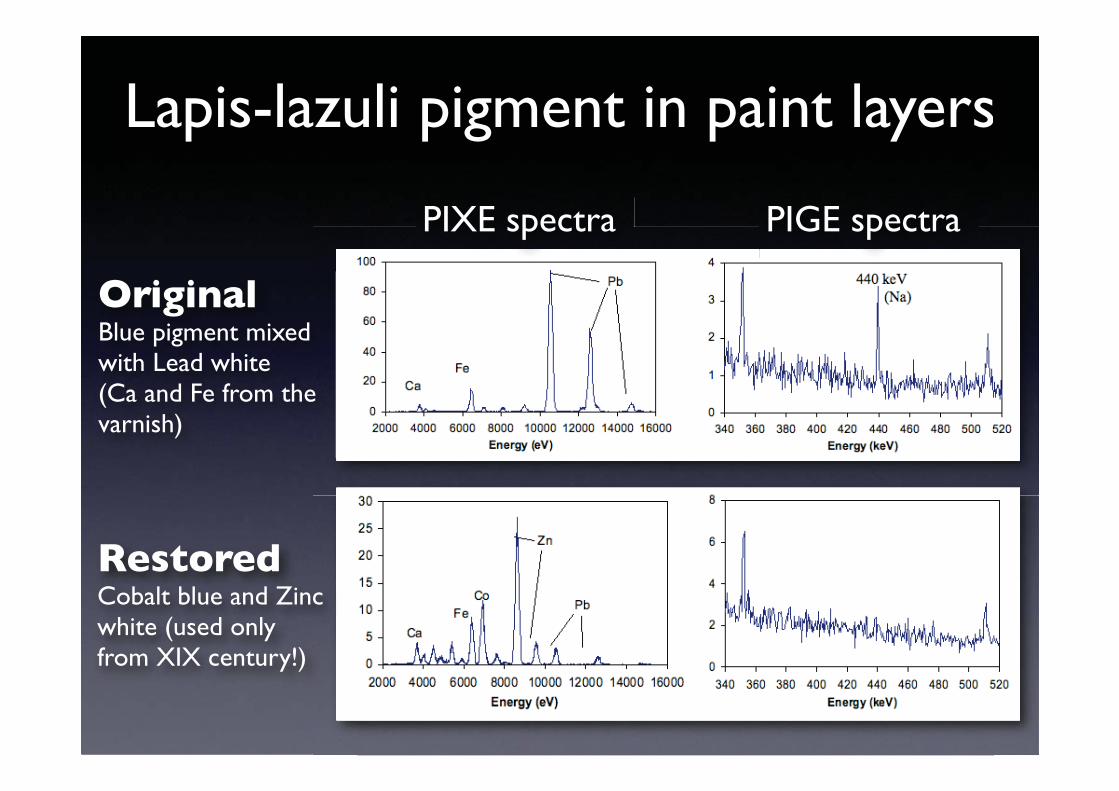
Lapis-lazuli pigment in paint layers
PIXE spectra PIGE spectra
OriginalBlue pigment mixed with Lead white(Ca and Fe from the varnish)
RestoredCobalt blue and Zinc white (used only from XIX century!)
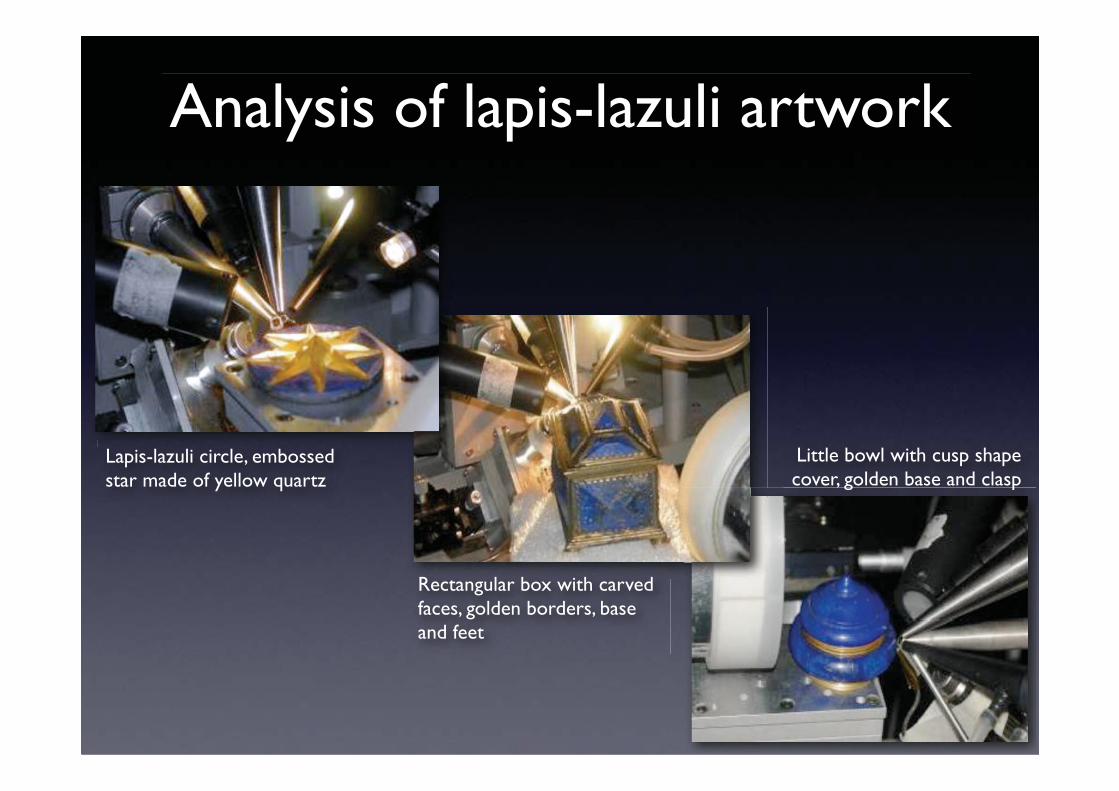
Analysis of lapis-lazuli artwork
Lapis-lazuli circle, embossed star made of yellow quartz
Rectangular box with carved faces, golden borders, base and feet
Little bowl with cusp shape cover, golden base and clasp

Analysis of lapis-lazuli artwork
• Na and S: lazurite• Ca and Mg: diopside• F, K and Mg: phlogopite
Elemental maps from the “little bowl with cover”
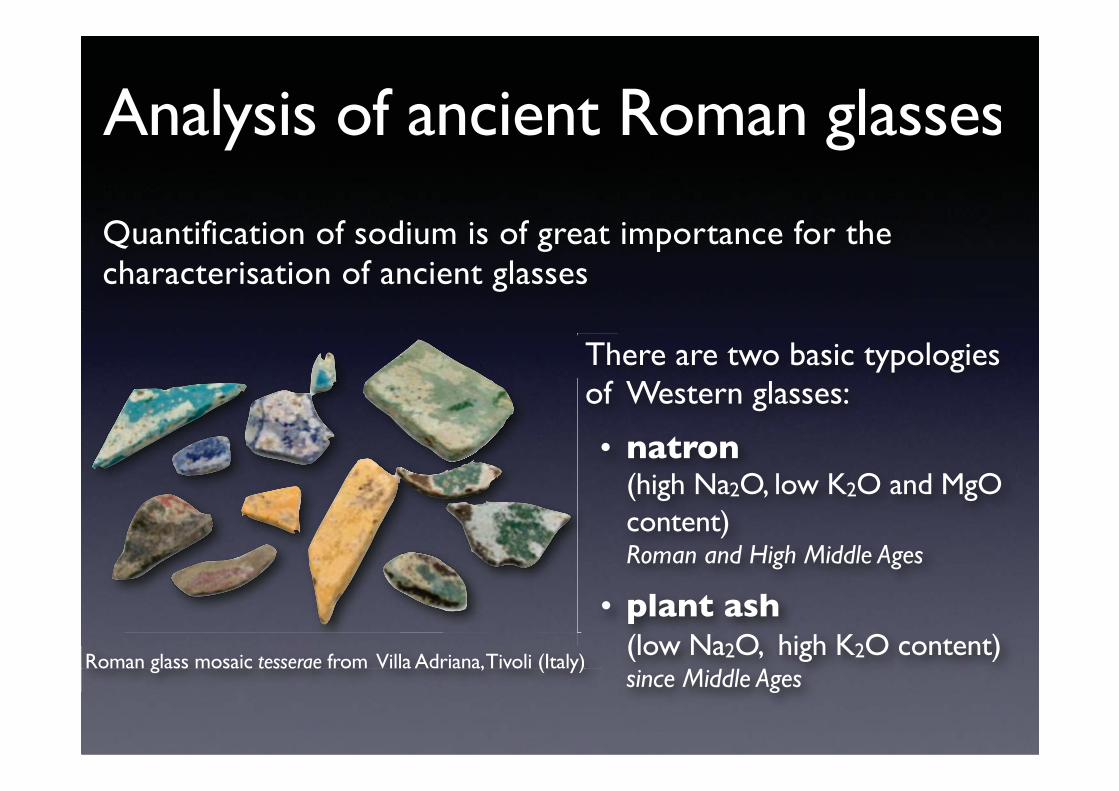
Analysis of ancient Roman glasses
Roman glass mosaic tesserae from Villa Adriana, Tivoli (Italy)y)y)
There are two basic typologies of Western glasses:
• natron(high Na2O, low K2O and MgO content)Roman and High Middle Ages
• plant ash(low Na2O, high K2O content)since Middle Ages
Quantification of sodium is of great importance for the characterisation of ancient glasses
Testo
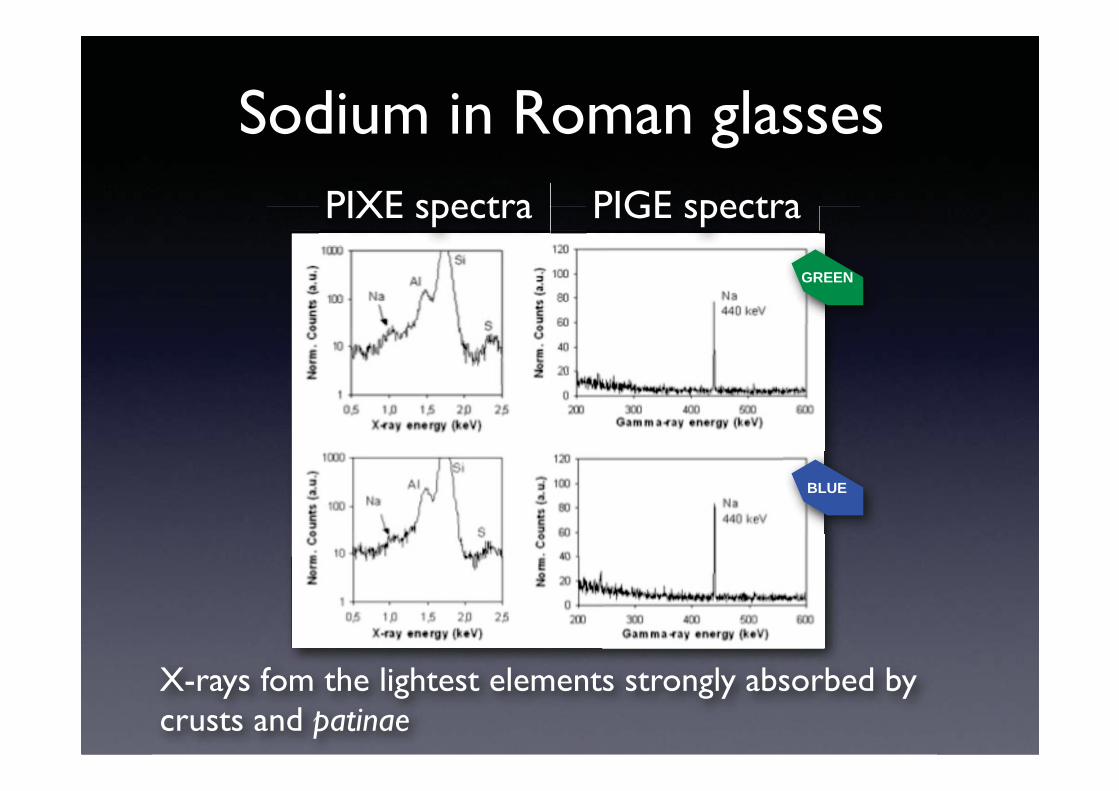
Sodium in Roman glasses
GREEN
BLUE
PIXE spectra PIGE spectra
X-rays fom the lightest elements strongly absorbed by crusts and patinae
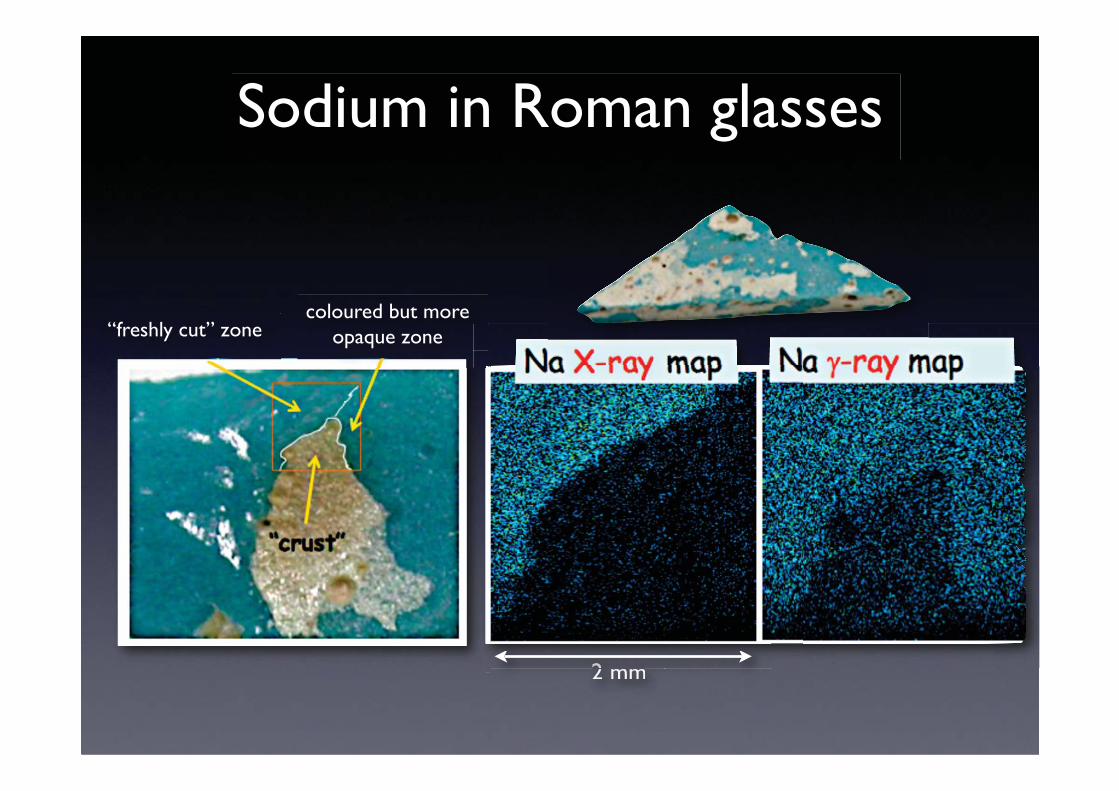
Sodium in Roman glasses
“freshly cut” zonecoloured but more
opaque zone
2 mm2222 mmmmmmmm2222

Sodium in Roman glasses
Concentration ranges perfectly compatible with the typical Roman soda-lime-silica glass
Estimate of Na content by comparing gamma-ray yields to those of thick glass standards (NIST SRM) with certified Na2O concentration

The corrosion of glass implies the leaching of some elements (Ca, K, Na) from the interaction with moisture or water
Identification of corroded glass
Formation of hydrate silicates on the surface

Leaching of Ca, K, Na from the interaction with moisture or water and formation of surface hydrate silicates
RBS study of glass corrosion
4 MeV protonsexternal beam
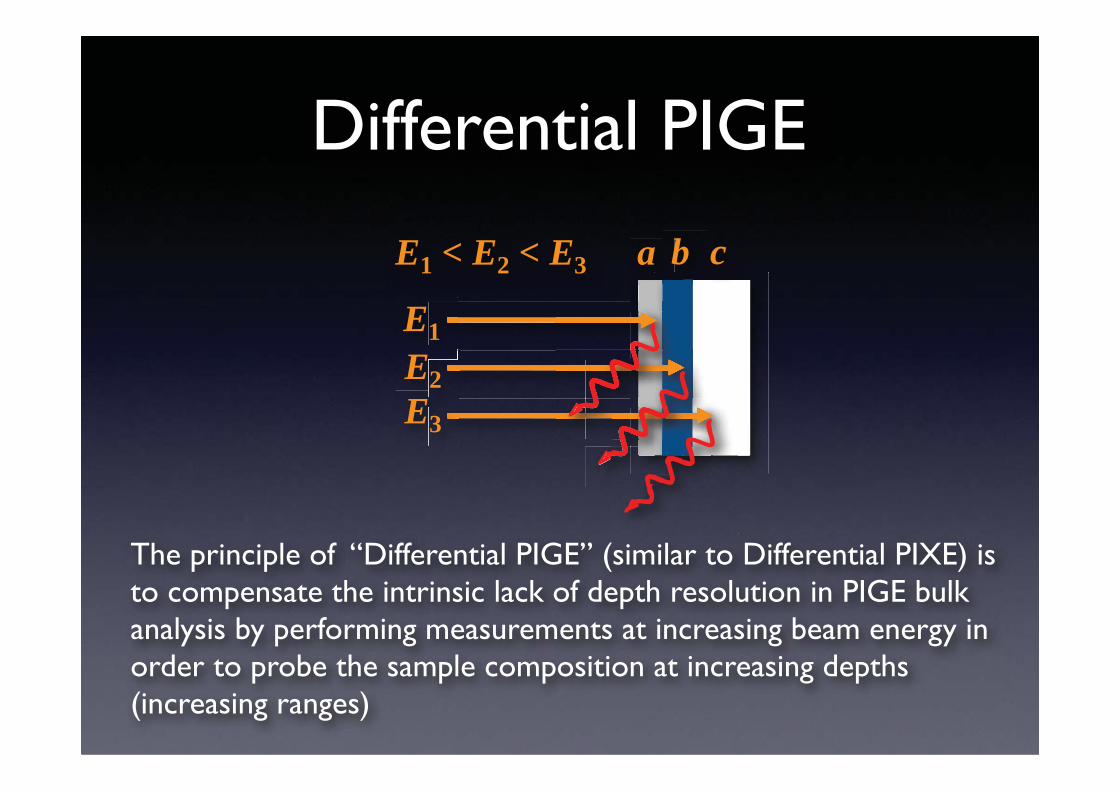
The principle of “Differential PIGE” (similar to Differential PIXE) isto compensate the intrinsic lack of depth resolution in PIGE bulk analysis by performing measurements at increasing beam energy in order to probe the sample composition at increasing depths (increasing ranges)
a b c
E1
E2
E3
E1 < E2 < E3
Differential PIGE

Analysis of ancient glasses from Roman age.
Measurement with protons of energy from 1.6 to 5 MeV(each energy step corresponds to about 3.2 mg/cm2).
Surface alteration!
Example of Differential PIGE

PIGE bulk analysis of thin targets
• Quantitative determination of light elements (F, Na or Al) with no self-absorption of emitted radiation inside the sample (i.e. analysis of aerosol particles)
• The unknown elemental concentrations are deduced by comparing the gamma-ray yields with those of a thin elemental standard
• Choosing the beam energy is crucial since the gamma emission cross sections have to be constant over the beam energy loss in the sample

Example: PIGE measurements can be used to correct the underestimation of PIXE due to low-energy X-rays absorption in the aerosol particles
Aerosol particles are a thin target (for 3 MeV protons E is about 120 keV for “coarse mode” particles, i.e. PM10)
If the PIGE cross sections are constant over the energy range E then:
The unknown concentrations can be deduce by comparing the gamma-ray yield to those of thin elemental standards
PIGE bulk analysis of thin targets
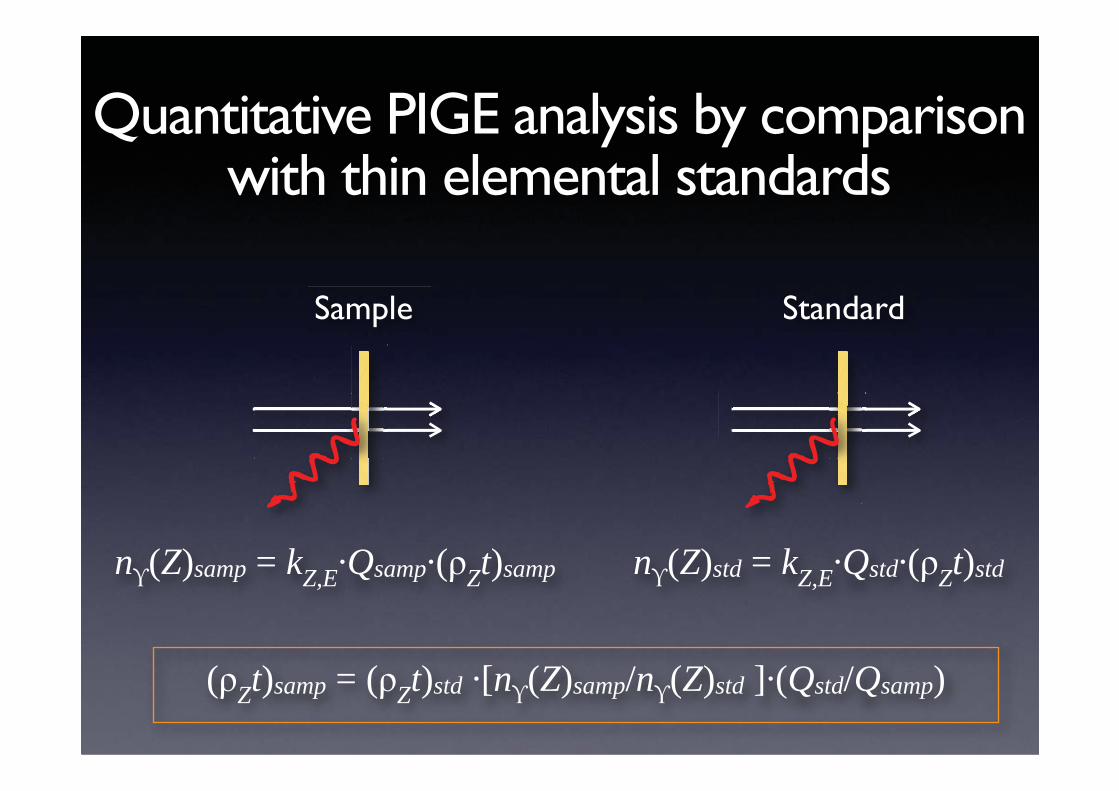
n (Z)std = kZ,E
Qstd (Zt)std
Quantitative PIGE analysis by comparisonwith thin elemental standards
(Zt)samp = (
Zt)std [n (Z)samp/n (Z)std ] (Qstd/Qsamp)
n (Z)samp = kZ,E
Qsamp (Zt)samp
Sample Standard
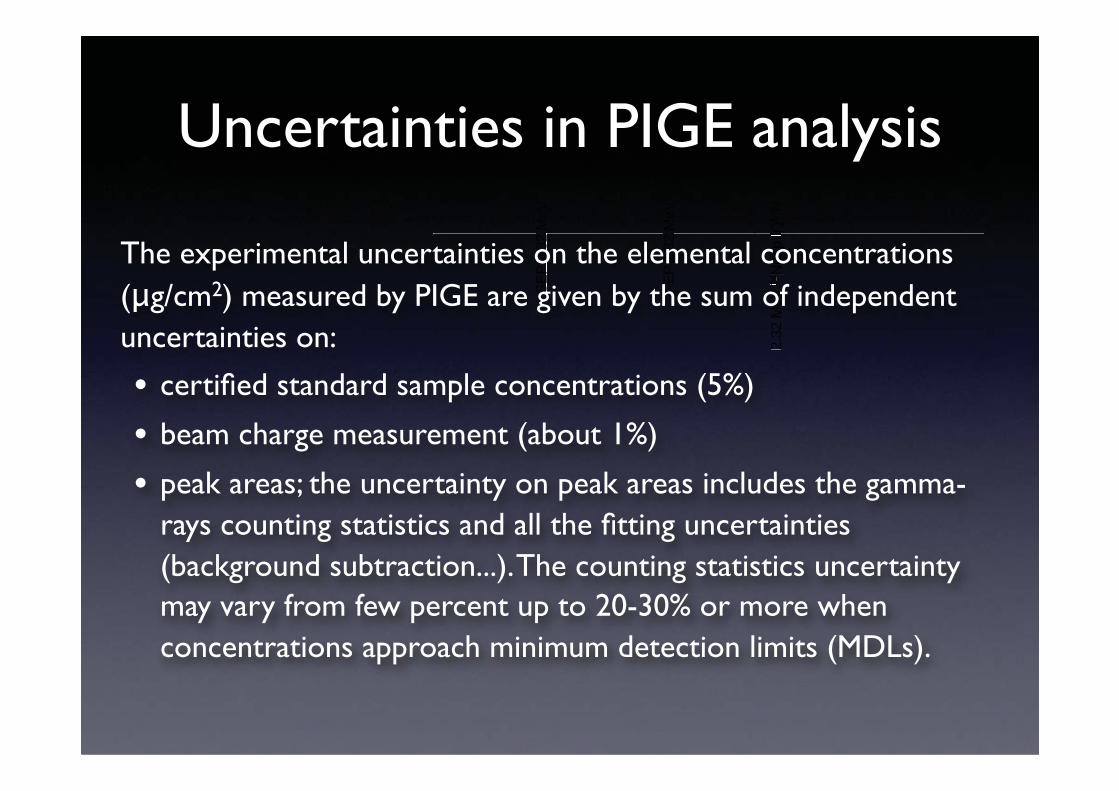
Uncertainties in PIGE analysis
2.32
MeV
14N
(p,p
1)14
N
FE
P 2
.32
MeV
SE
P 2
.32
MeV
2.32
MeV
14N
(p,p
1
FE
P 2
.32
SE
P 2
.32
The experimental uncertainties on the elemental concentrations ( g/cm2) measured by PIGE are given by the sum of independent uncertainties on:
• certified standard sample concentrations (5%)
• beam charge measurement (about 1%)
• peak areas; the uncertainty on peak areas includes the gamma-rays counting statistics and all the fitting uncertainties (background subtraction...). The counting statistics uncertainty may vary from few percent up to 20-30% or more when concentrations approach minimum detection limits (MDLs).

Spreading the beam for PIGE
• Finding energy intervals where prompt gamma-ray emission cross sections are costant and high enough.
• Prerequisite to provide an analytical methodwith good sensityvity and not affected by sample weight and matrix effects, suitable to large-scale analysis.
• Smooth the fluctuations in the PIGE cross sections (i.e. use a diffuser).
Use an external beam ! C. Boni et al., NIM B 40/41, 1989
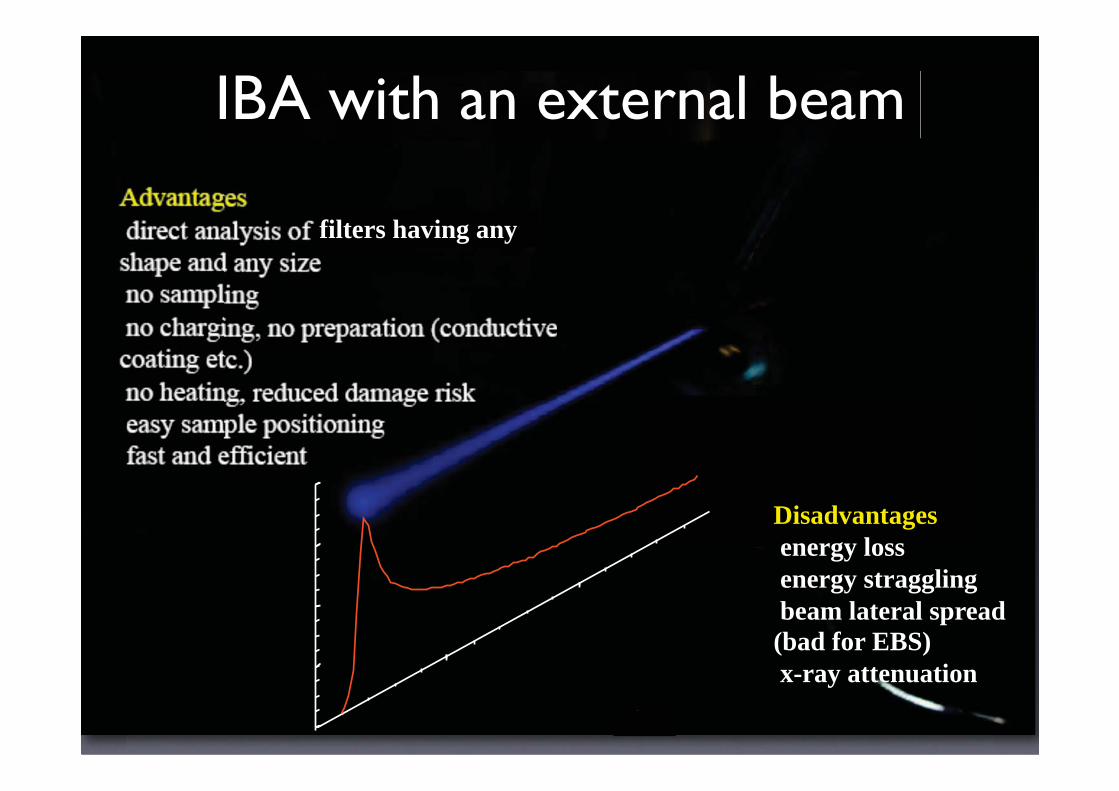
IBA with an external beam
filters having any
Disadvantages
energy loss
energy straggling
beam lateral spread
(bad for EBS)
x-ray attenuation

Material Thickness Energy loss*Energy straggling*,
FWHM
Kapton/Upilex 7.5-8 m 145 keV 20 keV
Si3N4 0.5 m 40 keV 12 keV
Typical extraction windows
7.5 μm Upilex 0.5 μm Si3N4
* For 3 MeV protons, including the effect of 1 cm of He traversed by the beam before impinging on the sample

External beam PIGE yields
G. Calzolai et al., NIM B 268, 2010

Energy plateau region for PIGE
2.32
MeV
14N
(p,p
1)14
N
FE
P 2
.32
MeV
SE
P 2
.32
MeV
2.32
MeV
14N
(p,p,pppppppppppppppppppppppppppppppppppppppppppppppppppppppppppppppppppppppppppppppppppppppppppppppppppppppppppppppppppppppppppppppppppppppppppppppppppppppppppppppppppppppppppppppppppppppppppppppppppppppppppppppppppppppppppppppppppppppp 111111111111111111111111111111111111111111111111111
))))))14NNNNNNN
FEEEEEEEEEEEE
P 2
.2.2222222323232323232322222232223232222232222222222323222223222222222232232222222222222232222323222222223222232232232232322223223232232322222222222322232232222222222323222232223222223223232222222223232322222223222232322222323222232323222322222222322232232222322232222232322323222223222232232322322232323232323232323232222333333333333333333333333333333333333333333333333333333333333333333333333333333333333333333333333333333333333333333
MMMMMMMMMMMMMMMMMMMMMMMMMMMMMMMMMMMMMMMMMMMMMMMMMMMMMMMMMMMMMMMMMMMMMMMMMMMMMMMMMMMMMMMMMMMMMMMMMMMMMMMMMMMMMMMMMMMMMMMMMMMMMMMMMMMMMMMMMMMMMMMMMMMMMMMMMMMMMMMMMMMMMMMMMMMMMMMMMMMMMMMMMMMMMMMMMMMMMMMMMMMMMMMMMMMMMMMMMMMMMMMMMMMMMMMMMMMMMMMMMMMMMMMMMMMMMMMMMMMMMVeVeVVVVeVeeeeeeeeeeeeeeeeeeeeeeeeeeeeeeeeeeeeeeeeeeeeeeeeeeeeeeeeeeeeeeeeeeeeeeeeeeeeeeeeeeeeeeeeeeeeeeeeeeeeeeeeeeeeeeeeeeeeeeeeeeeeeeeeeeeeeeeeeeeeeeeeeeeeeeeeeeeeeeeeeeeeeeeeeeeeeeeeeeeeeeeeeeeeeeeeeeeeeeeeeeeeeeeeeeeeeeeeeeeeeeeeeeeeeeeeeeeeeeeeeeeeeeeeeeeeeeeeeeeeee
SE
P 2
.2222222232
MMMMMMMMMMMMMMMMMMMMMMMMMMMMMMMMMMMMMMMMMMMMMMMMMMMMMMMMMMMMMMMMMMMMMMMMMMMMMMMMMMMMMMMMMMMMMMMMMMMMMMMMMMMMMMMMMMMMMMMMMMMMMMMMMMMMMMMMMMMMMMMMMMMMMMMMMMMMMMMMMMMMMMMMMMMMMMMMMMMMMMMMMMMMMMMMMMMMMMMMMMMMMMMMMMMMMMMMMMMMMMMMMMMMMMMMMMMMMMMMMMMMMMMMMMMMMMMMMMMMMMMMMMMMMMMMMMMMMMMMMMMMMMMMMMMMMMMMMMMMMMMMMMMMMMMVVVVVVVVeV

Energy plateau for Na measurement
Ep (MeV)
MDL (ng/cm2)
4.67 4.45 4.10 3.65 3.53 2.98
73 133 93 70 60 37
2222222.98
37
440
keV
23N
a(p,
p 1)23
Na
2.32
MeV
14N
(p,p
1)14
N
FE
P 2
.32
MeV
SE
P 2
.32
MeV
PM10 on Nuclepore
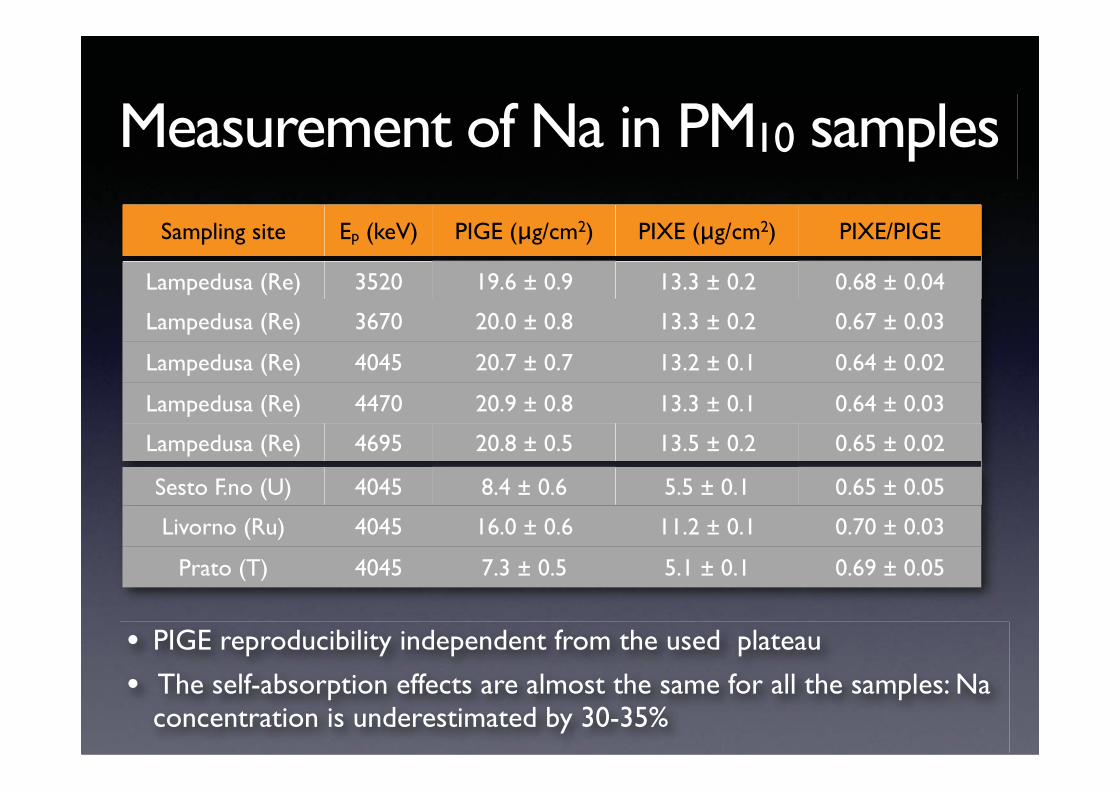
Measurement of Na in PM10 samples
• PIGE reproducibility independent from the used plateau
• The self-absorption effects are almost the same for all the samples: Na concentration is underestimated by 30-35%
Sampling site Ep (keV) PIGE ( g/cm2) PIXE ( g/cm2) PIXE/PIGE
Lampedusa (Re) 3520 19.6 ± 0.9 13.3 ± 0.2 0.68 ± 0.04
Lampedusa (Re) 3670 20.0 ± 0.8 13.3 ± 0.2 0.67 ± 0.03
Lampedusa (Re) 4045 20.7 ± 0.7 13.2 ± 0.1 0.64 ± 0.02
Lampedusa (Re) 4470 20.9 ± 0.8 13.3 ± 0.1 0.64 ± 0.03
Lampedusa (Re) 4695 20.8 ± 0.5 13.5 ± 0.2 0.65 ± 0.02
Sesto F.no (U) 4045 8.4 ± 0.6 5.5 ± 0.1 0.65 ± 0.05
Livorno (Ru) 4045 16.0 ± 0.6 11.2 ± 0.1 0.70 ± 0.03
Prato (T) 4045 7.3 ± 0.5 5.1 ± 0.1 0.69 ± 0.05
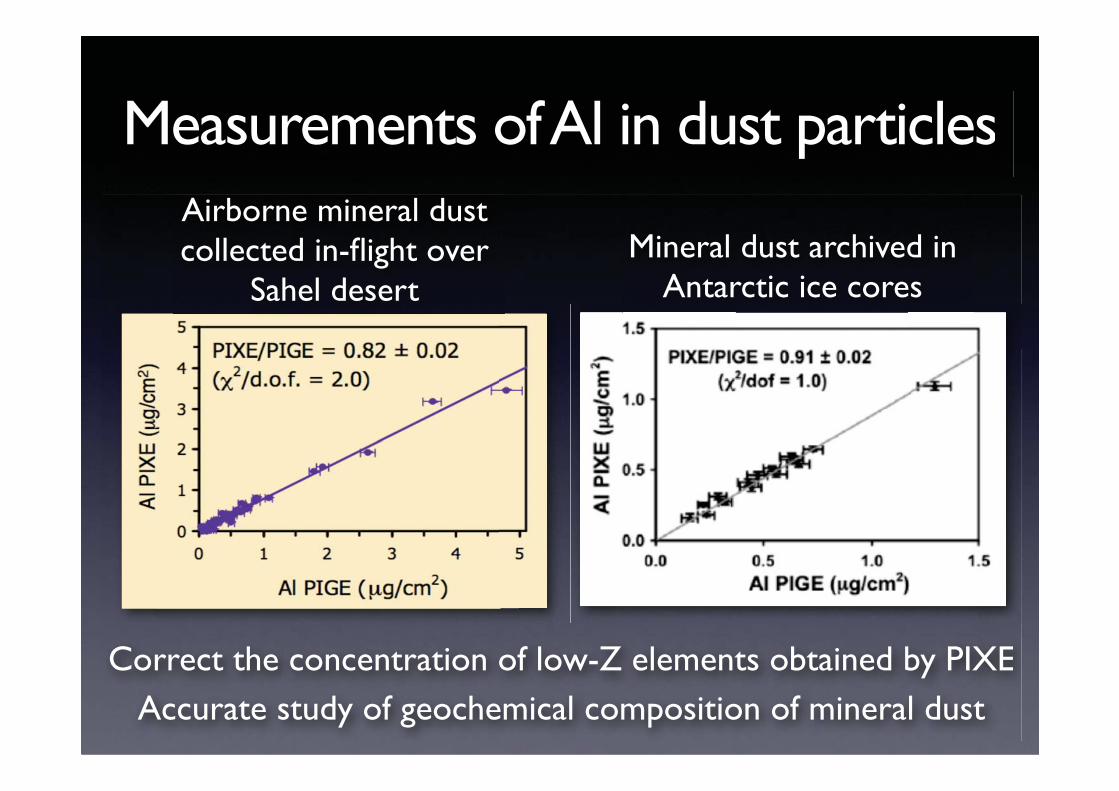
Measurements of Al in dust particlesAirborne mineral dust collected in-flight over
Sahel desertMineral dust archived in
Antarctic ice cores
Correct the concentration of low-Z elements obtained by PIXEAccurate study of geochemical composition of mineral dust

Study of geochemical composition of mineral dust
Scheme of the evaluation of the attenuation for the light elements in a dust sample, in the hypothesis that it is mainly composed by a mix of pure minerals, namely Kaolinite, Illite, K-feldspar and Quartz.
B. Holynska and A. Markowicz, XRS 10, 1981
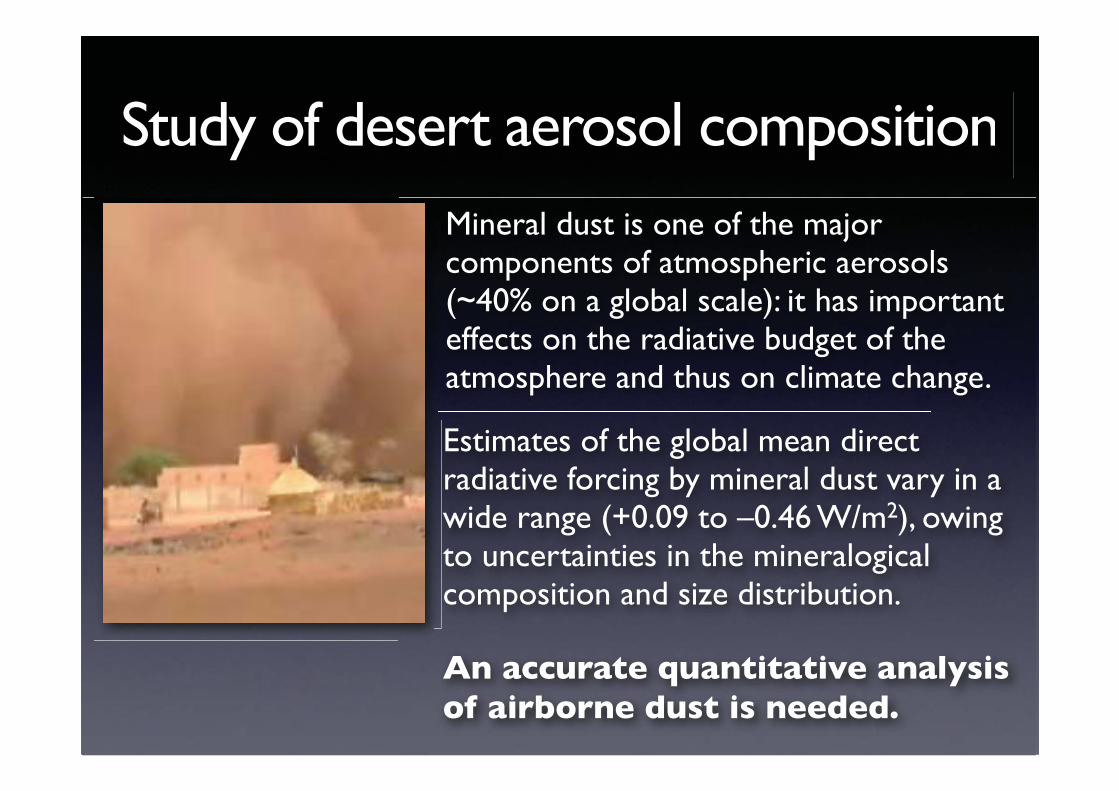
Study of desert aerosol compositionMineral dust is one of the major components of atmospheric aerosols (~40% on a global scale): it has important effects on the radiative budget of the atmosphere and thus on climate change.
Estimates of the global mean direct radiative forcing by mineral dust vary in a wide range (+0.09 to –0.46 W/m2), owing to uncertainties in the mineralogical composition and size distribution.
An accurate quantitative analysis of airborne dust is needed.

Study of desert aerosol composition
• Airborne aerosols collected in flight over the Sahel desert during two sampling campaigns
• In winter, the collected dust originated from northern Africa and was transported towards the sampling area in well defined “plumes”
• In summer, the dust was more frequentlyproduced locally over the Sahel by erosion processes
• The average size distributions were indeed expected to be different: in summer the dust is more enriched in coarse particles than in winter
AMMA SOP0/DABEXwinter 2006AF = 0-25%
GERBILSsummer 2007AF = 15-50%

Fingerprinting the desert dust• Interelemental ratios in mineral dust
measured at a receptor site can be used to differentiate source regions.
• If not corrected, elemental ratios prevent the possibility of distinguishing the origin of the dust.
I. Chiapello et al., J. Geophys. Res. 102, 1997
d l l i
II CChhiapellllo et all JJ GGeophhys RRes 110022 1199
Sahel sector
south and central Sahara sector
north and west Sahara sector
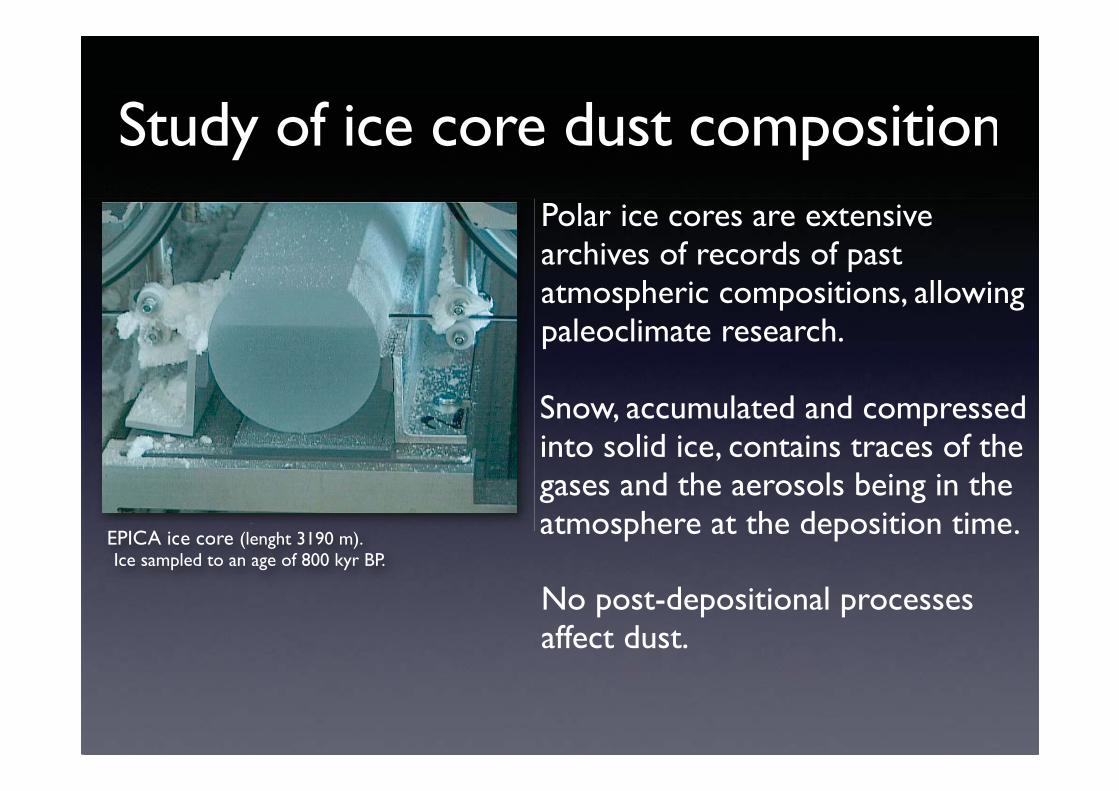
Study of ice core dust composition
EPICA ice core
Polar ice cores are extensive archives of records of past atmospheric compositions, allowing paleoclimate research.
Snow, accumulated and compressed into solid ice, contains traces of the gases and the aerosols being in the atmosphere at the deposition time.
No post-depositional processes affect dust.
EPICA ice coreEPICA (lenght 3190 m).Ice sampled to an age of 800 kyr BP.
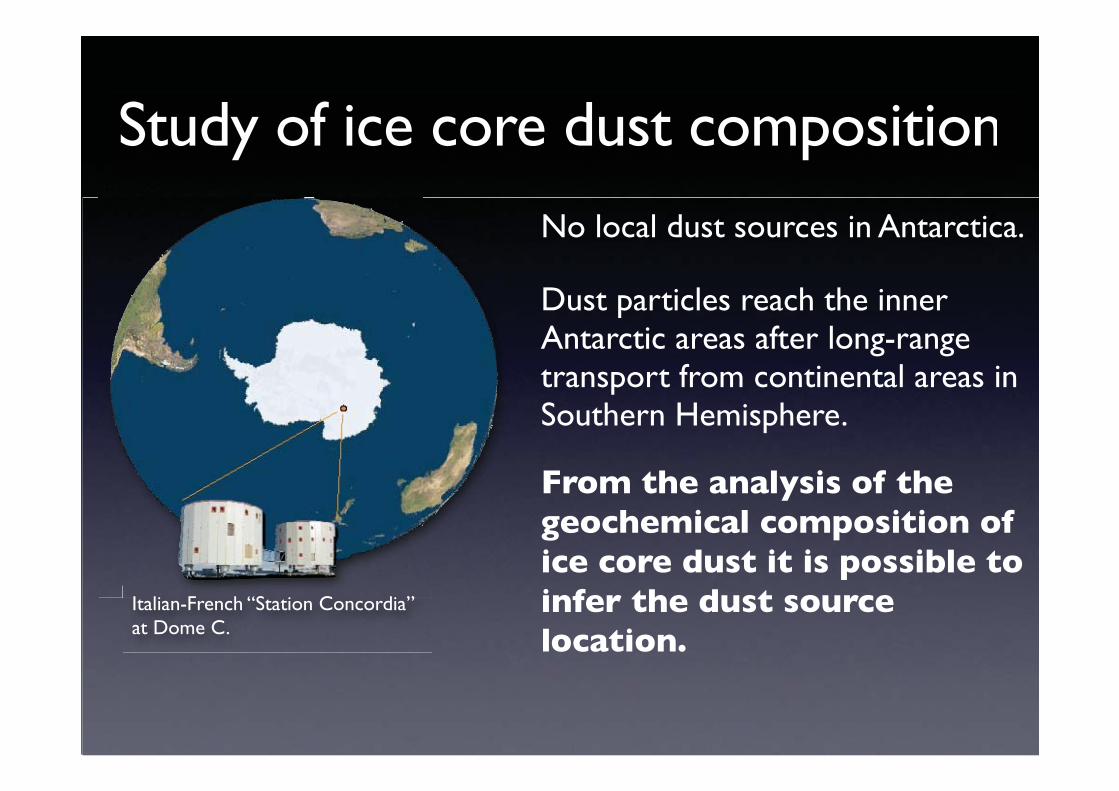
Italian-French “Station Concordia” at Dome C.
No local dust sources in Antarctica.
Dust particles reach the inner Antarctic areas after long-range transport from continental areas in Southern Hemisphere.
I li F h “S i C di ”
From the analysis of the geochemical composition of ice core dust it is possible to infer the dust source location.
Study of ice core dust composition

Ice core and PSA dust composition
Glacials & SSA
Holocene & AUS
Geochemical composition of Ice dust and PSA (Potential Source Area) sediments
The study of the composition of dust particles deposited over the Antarctic icesheet and archived in ice core samples (spanning the last 220 kyr) helps toinvestigate global climate changes (EPICA project)
SSA(SouthernS. America)
AUS(Australia)
SouthAfrica
EDC
EDML
ASSSAhern(((((((SSSSSoouth((SS
iAS
DML
thhca
E
AUS(Australia)
F. Marino et al., Geophys. Res. Lett. 36, 2009
PIGE depth profiling
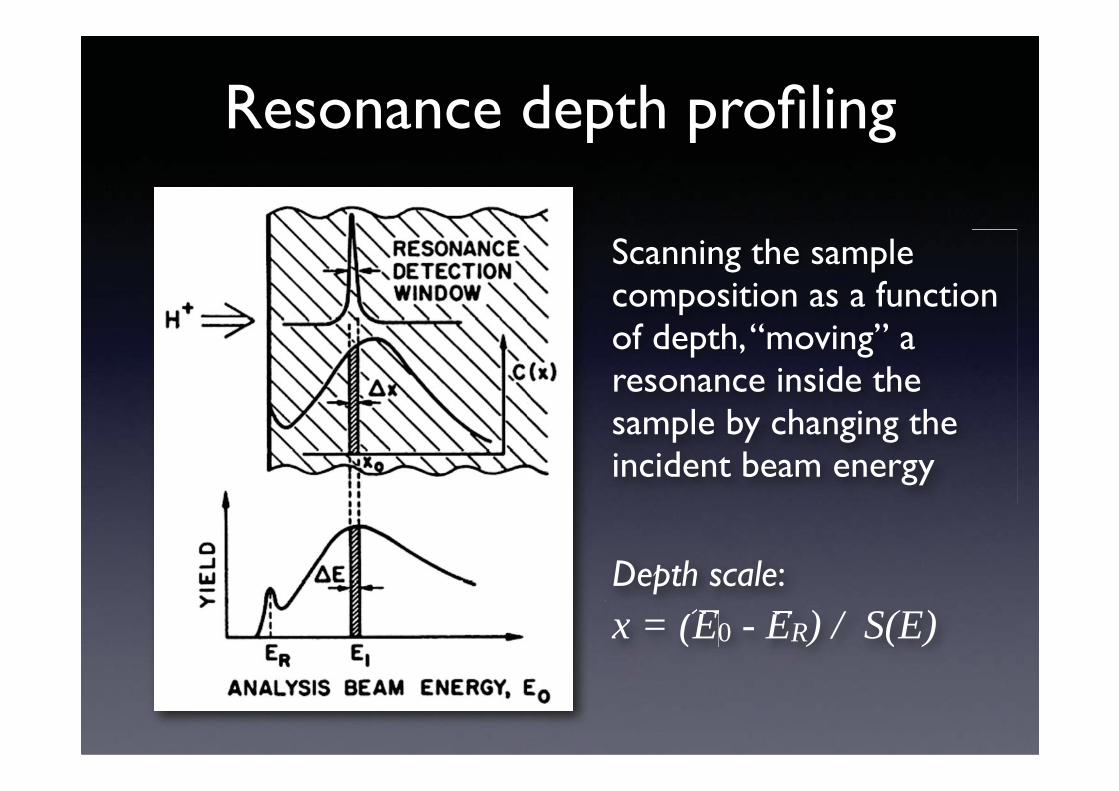
Resonance depth profiling
x = (E0 - ER) / S(E)
Depth scale:
Scanning the sample composition as a function of depth, “moving” a resonance inside the sample by changing the incident beam energy

Excitation curve
N(E) = G(E) (E) T(E) C(x)
G(E) beam + Doppler energy spread(E) resonance lineshape
T(E) beam energy straggling
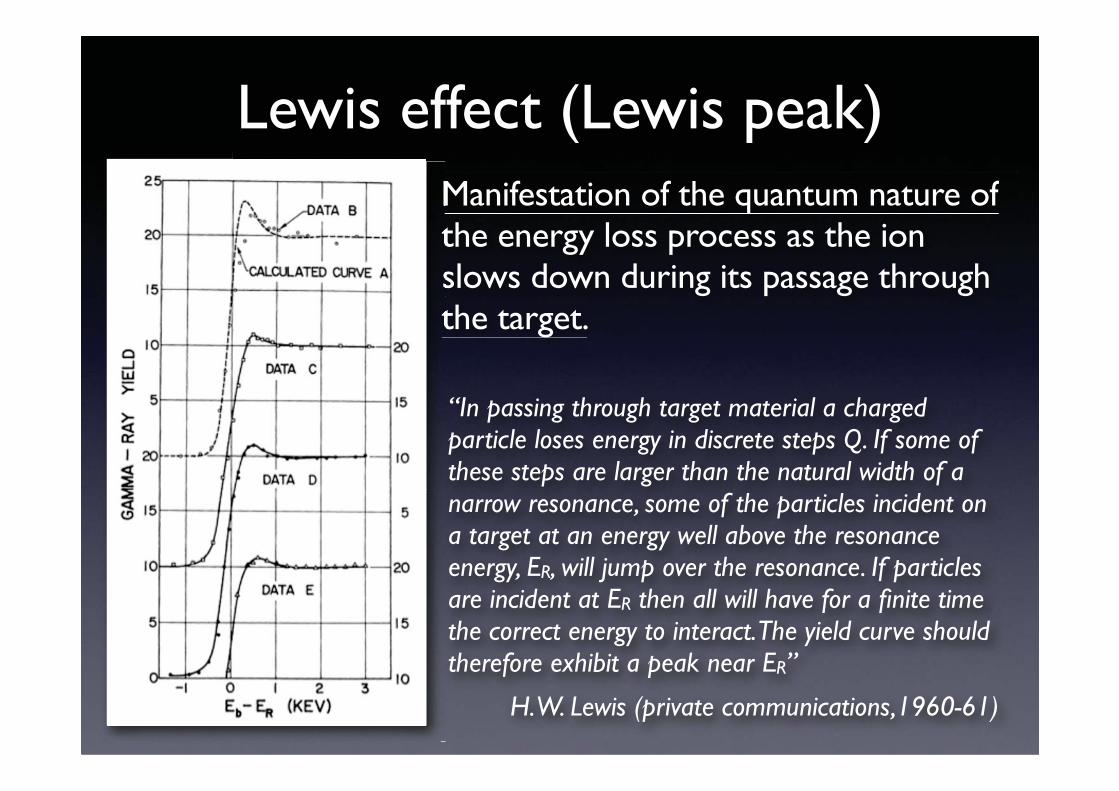
Lewis effect (Lewis peak)Manifestation of the quantum nature ofthe energy loss process as the ion slows down during its passage through the target.
“In passing through target material a charged particle loses energy in discrete steps Q. If some of these steps are larger than the natural width of a narrow resonance, some of the particles incident on a target at an energy well above the resonance energy, ER, will jump over the resonance. If particles are incident at ER then all will have for a finite time the correct energy to interact. The yield curve should therefore exhibit a peak near ER”
H. W. Lewis (private communications,1960-61)
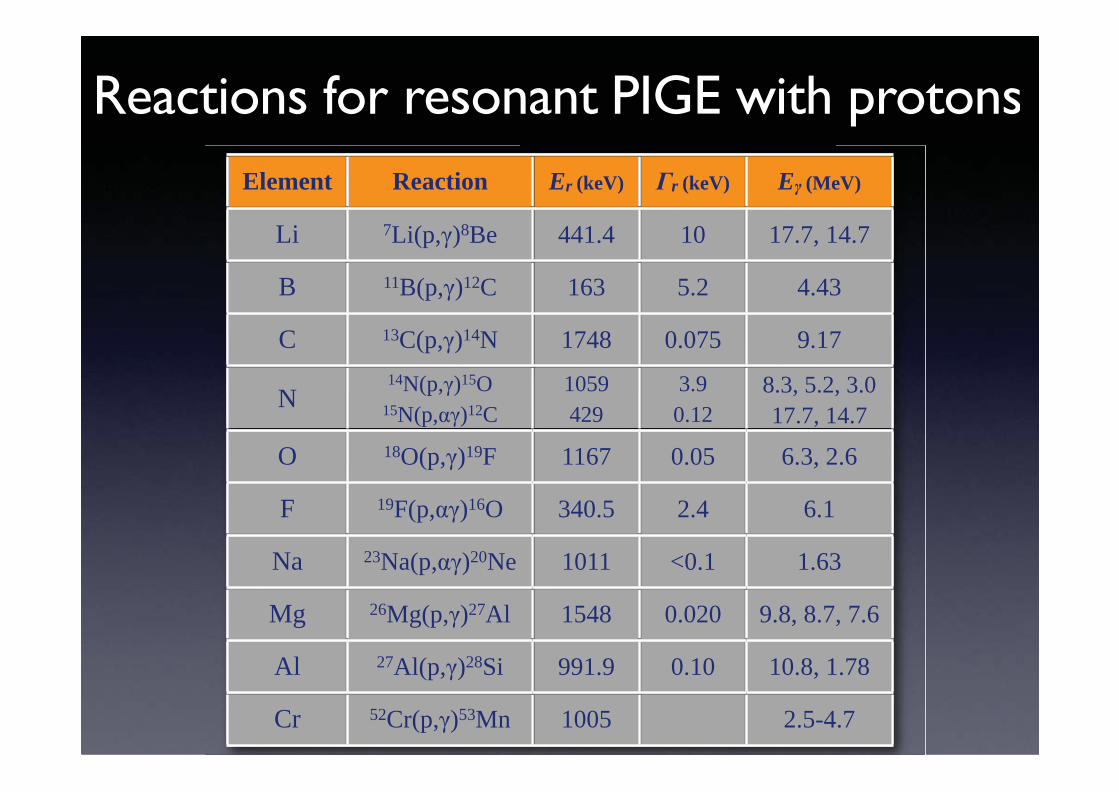
Reactions for resonant PIGE with protons
1H(15N, )12C1H(15N, )12C
Element Reaction Er (keV) r (keV) E (MeV)
Li 7Li(p, )8Be 441.4 10 17.7, 14.7
B 11B(p, )12C 163 5.2 4.43
C 13C(p, )14N 1748 0.075 9.17
N14N(p, )15O 1059 3.9 8.3, 5.2, 3.0
15N(p, )12C 429 0.12 17.7, 14.7
O 18O(p, )19F 1167 0.05 6.3, 2.6
F 19F(p, )16O 340.5 2.4 6.1
Na 23Na(p, )20Ne 1011 <0.1 1.63
Mg 26Mg(p, )27Al 1548 0.020 9.8, 8.7, 7.6
Al 27Al(p, )28Si 991.9 0.10 10.8, 1.78
Cr 52Cr(p, )53Mn 1005 2.5-4.7

Reactions for resonant PIGE with alphas
1H(15N, )12C1H(15N, )12CElement Reaction Er (keV) r (keV) E (MeV)
Li 7Li( , )11B 953 4 9.7, 4.8, 4.4, 2.53
B 10B( ,p )13C1507 25
3.85, 3.681645 22
N 14N( , )18F 1531 <0.1 4.52, 2.47, 1.08
Ne 20Ne( , )24Mg 1929 9.56

Depth resolution
x = TOT(x) / S(x)
2TOT(x) = 2
b + 2D + 2
surf + 2r + 2
str(x)
b beam ernergy resolution
D = (2 M1 E0 kT / M2) Doppler broadening due to target atom vibrations
surf = x S(E) sample surface roughness ( x)
r resonance width
str(x) beam energy straggling
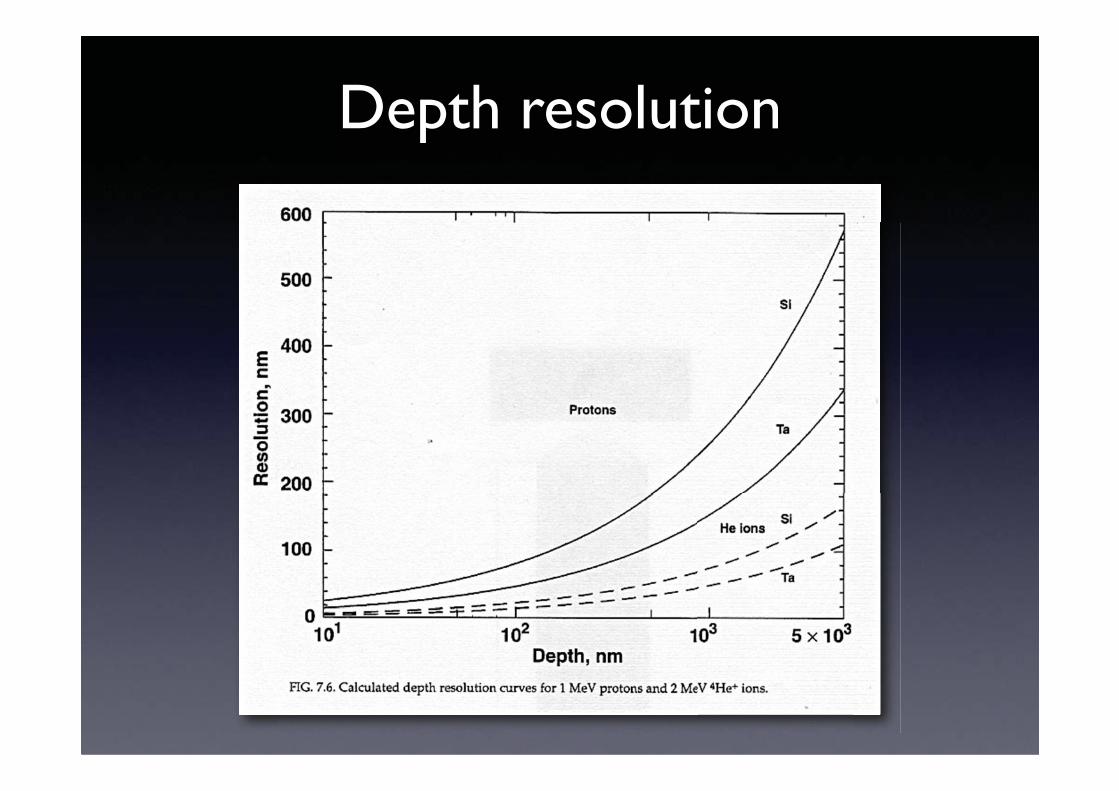
Depth resolution
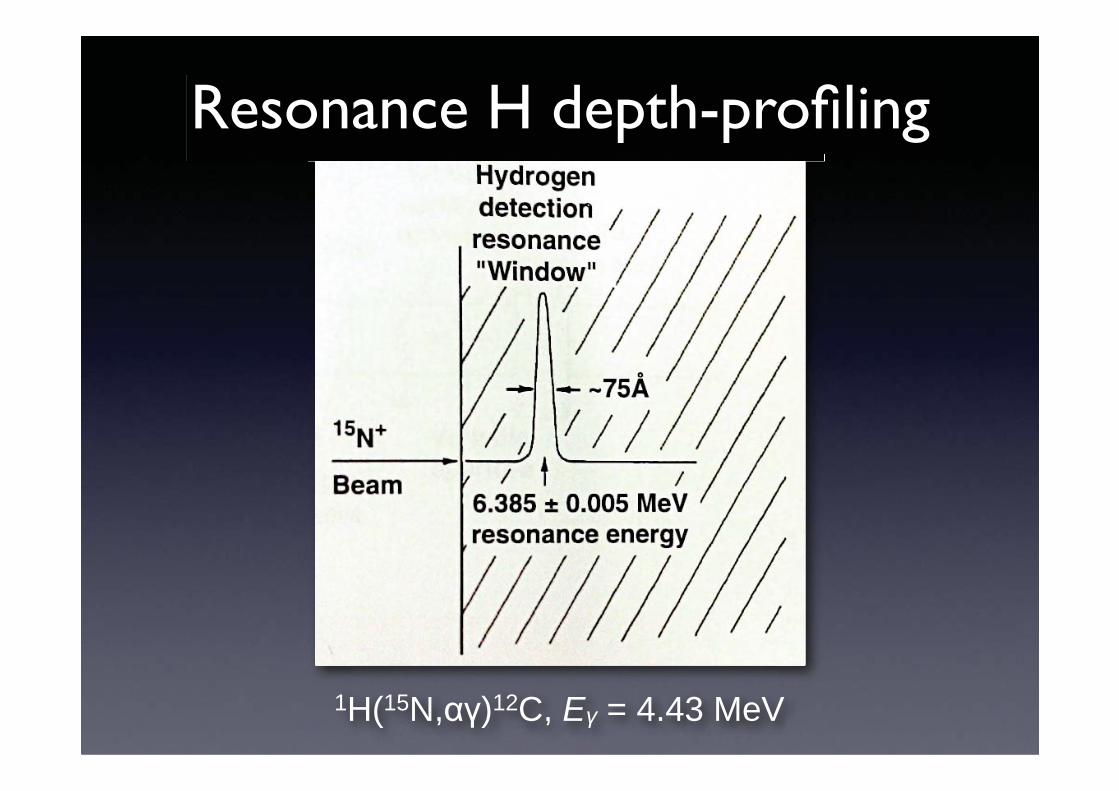
Resonance H depth-profiling
1H(15N, )12C, E = 4.43 MeV
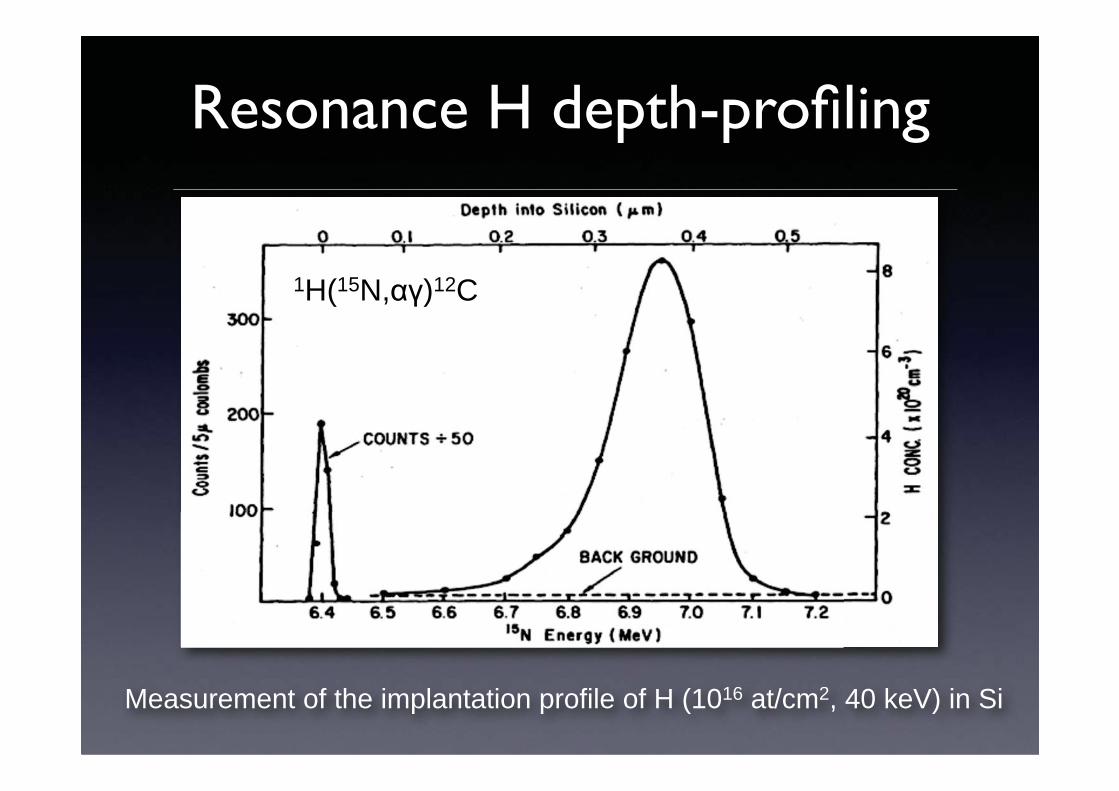
Resonance H depth-profiling
Measurement of the implantation profile of H (1016 at/cm2, 40 keV) in Si
1H(15N, )12C
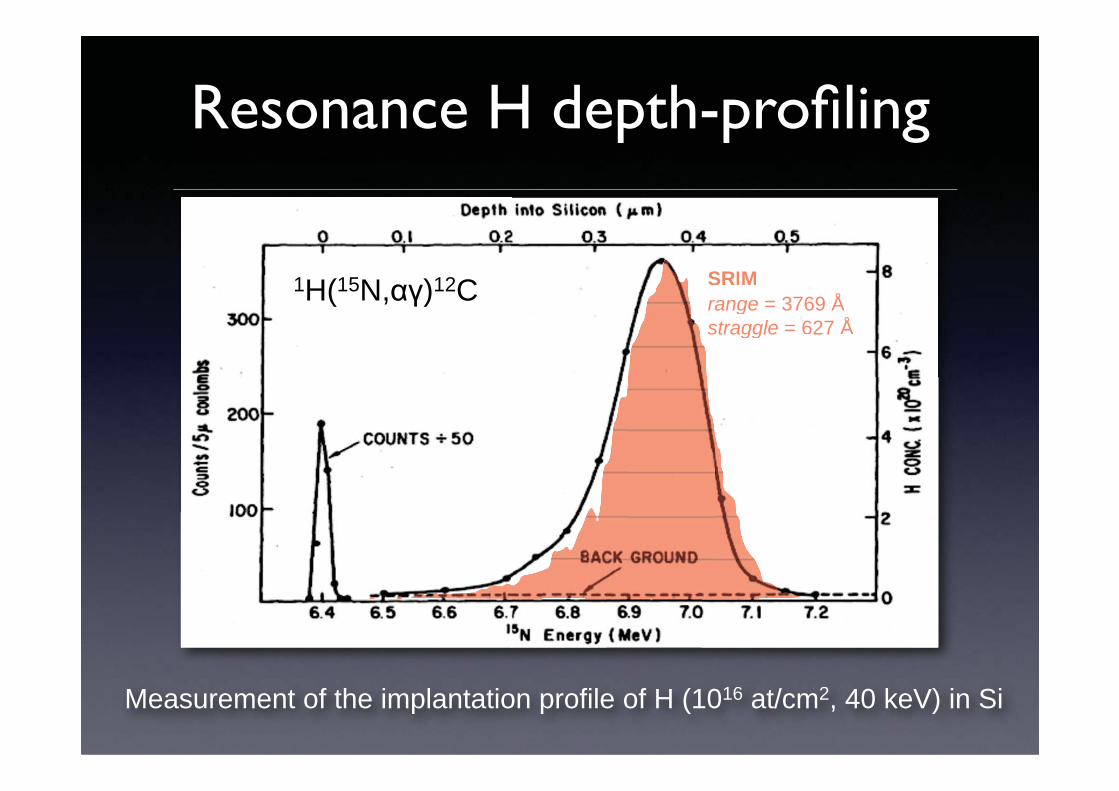
Resonance H depth-profiling
Measurement of the implantation profile of H (1016 at/cm2, 40 keV) in Si
1H(15N, )12C SRIM
range = 3769 Åstraggle = 666627 Å
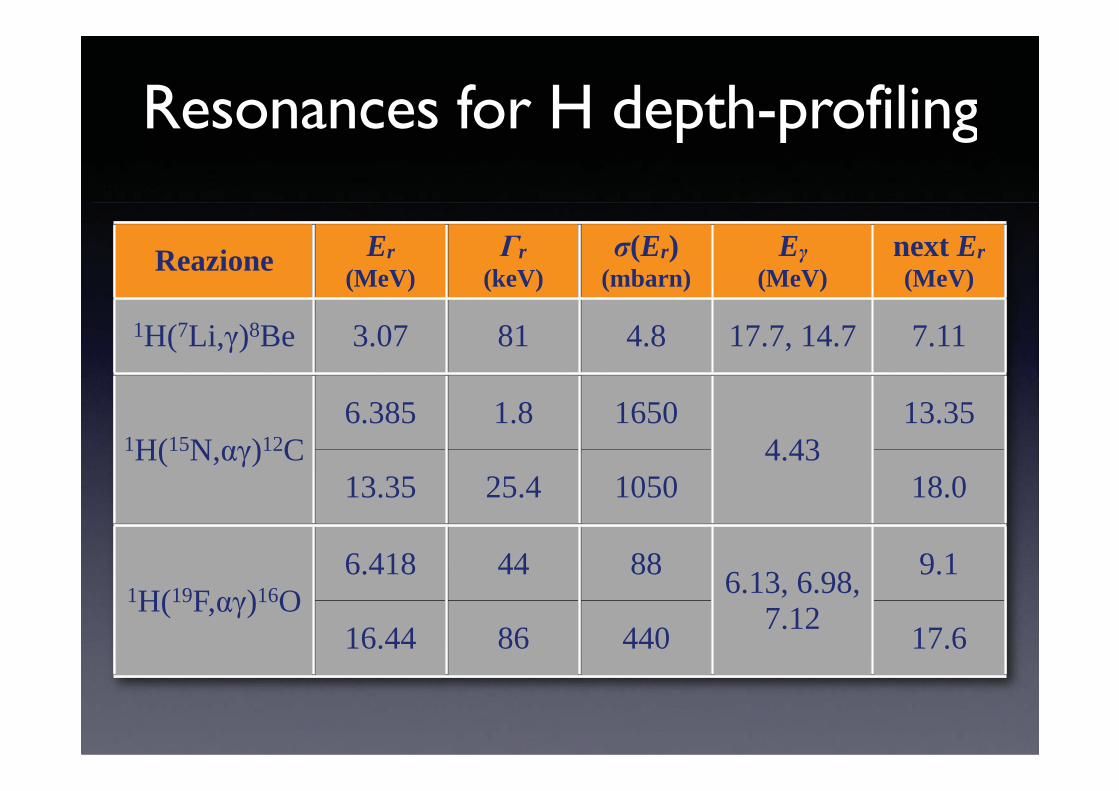
Resonances for H depth-profiling
1H(15N, )12C1H(15N, )12CReazione
Er
(MeV)
r
(keV)
(Er) (mbarn)
E
(MeV)
next Er
(MeV)
1H(7Li, )8Be 3.07 81 4.8 17.7, 14.7 7.11
1H(15N, )12C
6.385 1.8 1650
4.43
13.35
13.35 25.4 1050 18.0
1H(19F, )16O
6.418 44 886.13, 6.98,
7.12
9.1
16.44 86 440 17.6
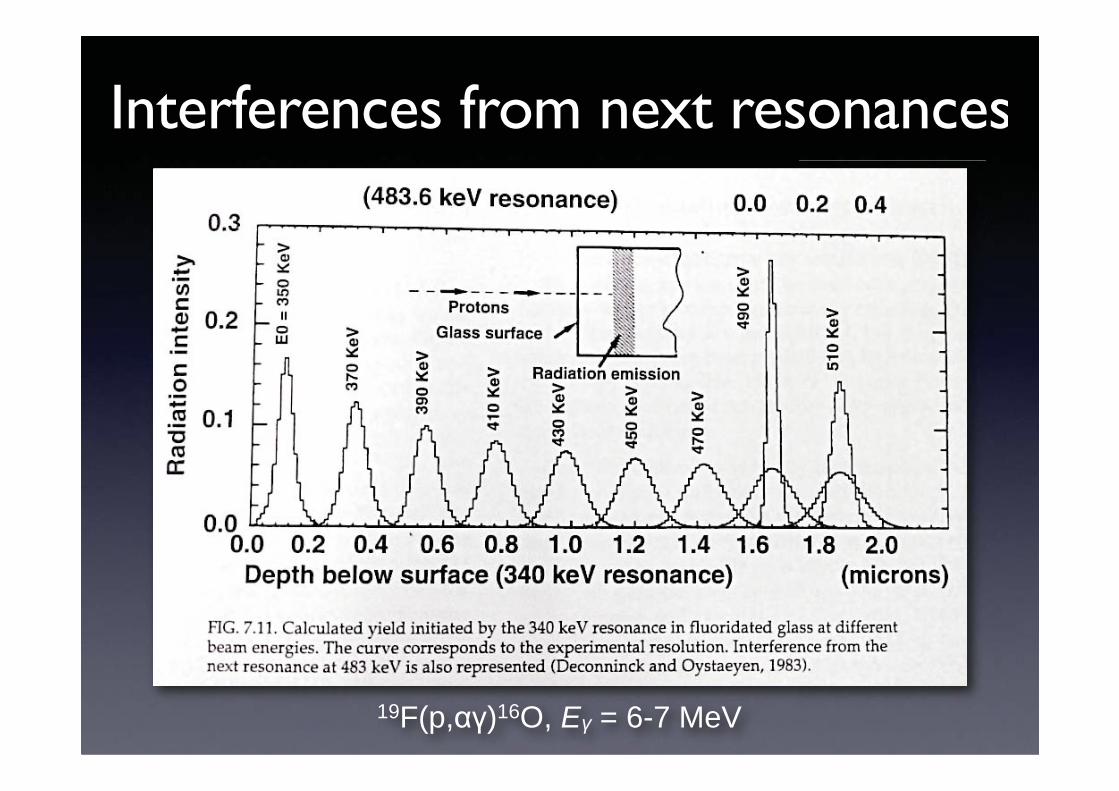
Interferences from next resonances
19F(p, )16O, E = 6-7 MeV

Thanks for your attention!
Essential bibliography
• Y. Wang, M. Nastasi ed.s “Handbook of Modern Ion Beam Materials Analysis”MRS
• G. Deconninck et al. “Prompt gamma-ray spectroscopy and its use in elemental analysis” At. Energy Rev. suppl. no. 2 (1981) 151
• G.F. Knoll “Radiation Detection and Measurements” John Wiley & Sons
Top Related