


Languages
Pages
Legal


Name ID
Jannatul kauser Bushra 15-290806-2
Rahman, Muhammad
Tasinur 15-30577-3
Ria, Taslima Rahman 15-30680-3
Tabassum Tasnim 15-30672-3
COUNTRY ANALYSIS
GDP growth rate : 7.28%
GDP per capital : $ 1,602 (2017)
Population :163 million
Inflation rate : 6.04%
Unemployment rate : 4.10
Risk rate : 10.81 %
Bank rate : 5%
Two stock exchange DSE AND CSE
INDUSTRY ANALYSIS
A non-bank financial institution (NBFL)is a financial
institution that does not have a full banking license or is
not supervised by a national or international banking
regulatory agency .
Non banking financial institutions , are financial
institution that provide banking services but do not hold
a banking license .
These institutions are not allowed to take deposits the
public.
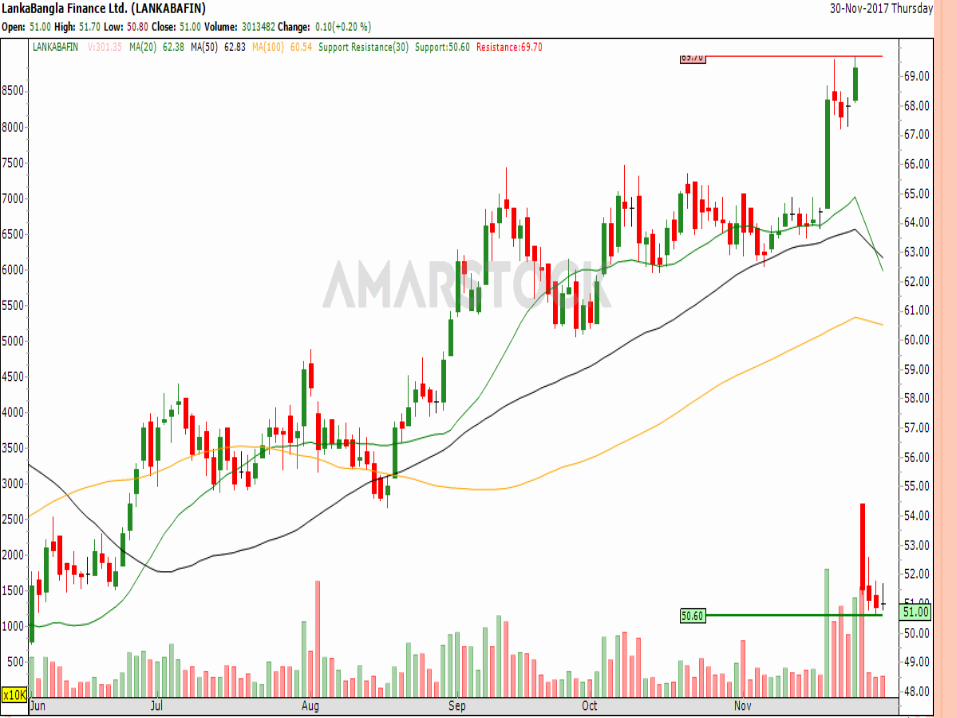
COMPANY ANALYSIS
Lanka Bangla Finance Ltd engages in the provision of
Non –Banking Financial services .
Establishing DATE : November 5, 1996.
Face value: TK 10
Earning per share : +27.54%
Net income : +28.76%
Revenue +22.18%
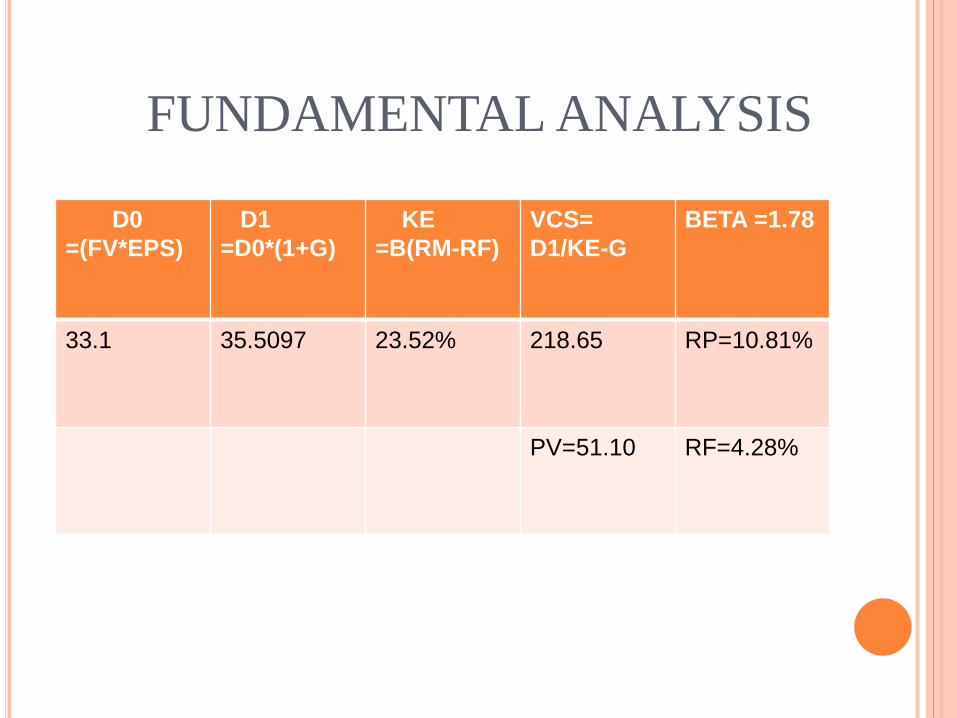
FUNDAMENTAL ANALYSIS
D0
=(FV*EPS)
D1
=D0*(1+G)
KE
=B(RM-RF)
VCS=
D1/KE-G
BETA =1.78
33.1 35.5097 23.52% 218.65 RP=10.81%
PV=51.10 RF=4.28%
TECHNICAL ANALYSIS
Technical analysis involves the development of trading
rules based on past price and volume data for individual
stocks and overall stock market .
DO not attempt to measure intrinsic value
Instead look for patterns and indicators on charts to
determine future performance

TEPYS OF CHART
Bar chart :
Bar charts are one of the most commonly used types of
graph because they are simple to create and very easy to
interpret. They are also a flexible chart type and there are
several variations of the standard bar chart including
horizontal bar charts, grouped or component charts, and
stacked bar charts

CANDLE STICK
A candlestick is a chart that displays the high, low,
opening and closing prices of a security for a specific
period.
The wide part of the candlestick is called the "real body"
and tells investors whether the closing price was higher
or lower than the opening price.
Black/red indicates that the stock closed lower and
white/green indicates that the stock closed higher


MOVING AVERAGE
. A moving average (MA) is a trend-following or lagging
indicator because it is based on past prices.
The two basic and commonly used MAs are the simple
moving average (SMA), which is the simple average of a
security over a defined number of time periods,
the exponential moving average (EMA), which gives
bigger weight to more recent prices. The most common
applications of MAs are to identify the trend direction
and to determine support and resistance levels.

RSI ( RELATIVE STRENGTH
INDEX)
It represents ratio of the average ‘gains’ to average ‘losses’
calculated over a number of time periods.
RSI is considered overbought when above 70 and
oversold when below 30
RSI can also be used to identify the general trend


MONEY FLOW INDEX
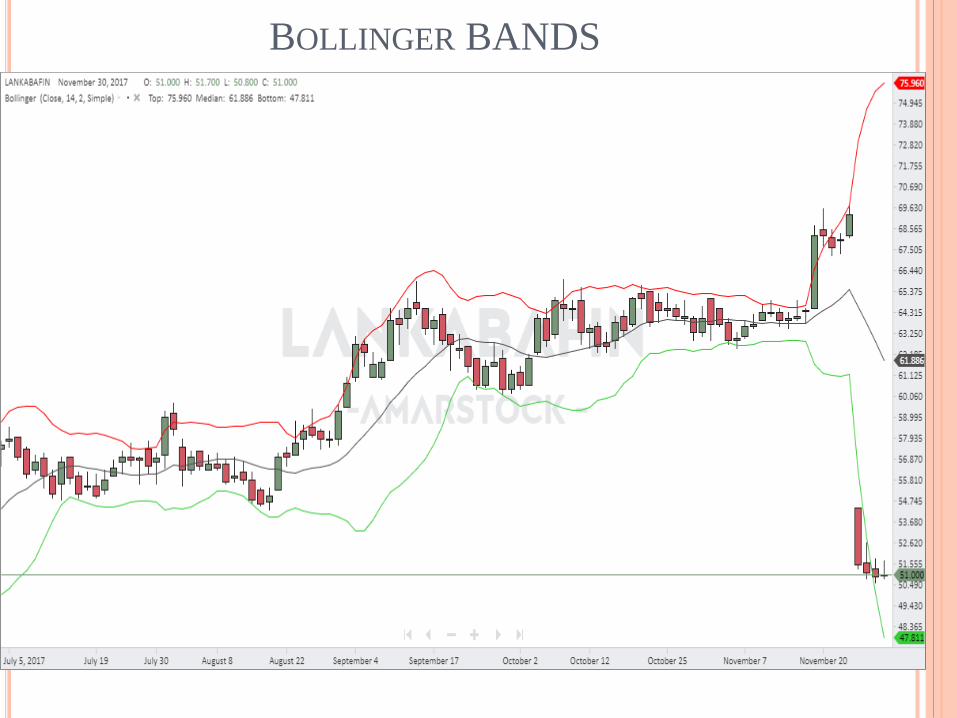
BOLLINGER BANDS

RESISTANCE AND SUPPORT
Support : price level below the current price at which
buying interest should be able to overcomes selling
pressure and thus keep the price from going any lower .
Resistance : price level above the current market price ,
at which selling pressure should be strong enough to
overcome buying pressure thus keep the price from
going any higher .

Top Related