


Languages
Pages
Legal

Fuel Economy and CO2 Emissions of Light-Duty
Vehicles in Egypt
Centre for Environment and Development in the Arab Region and Europe
(CEDARE)
January, 2015
Prepared by
Ahmed El-Dorghamy
Contributors
Hossam Allam
Amr Al-Abyad
Mattias Gasnier

2
CONTENTS
1 Introduction ...................................................................................................................................................... 5
1.1 Objectives ................................................................................................................................................. 5
2 Background ....................................................................................................................................................... 6
2.1 Local air pollution and carbon emissions ................................................................................... 6
2.2 Vehicle Stock ........................................................................................................................................... 7
2.3 Mode split ................................................................................................................................................. 8
2.4 Automotive Industry ......................................................................................................................... 10
3 Regulations and policy environment ................................................................................................... 13
3.1 Traffic law 121/2008........................................................................................................................ 13
3.2 Taxi replacement program ............................................................................................................. 13
3.3 Fuel Subsidies ...................................................................................................................................... 14
3.4 Gasoline Prices .................................................................................................................................... 15
3.5 Social Aspects and subsidy rationalization ............................................................................. 15
3.6 Customs and taxation ....................................................................................................................... 16
3.7 Advent of auto credit facilities ...................................................................................................... 17
4 Methodology .................................................................................................................................................. 18
5 Results and Discussion .............................................................................................................................. 19
5.1 Average annual fuel economy in global context .................................................................... 21
5.2 Ownership vs. Consumption .......................................................................................................... 22
5.3 CNG Bi-Fuel Vehicles ......................................................................................................................... 24
6 Conclusions ..................................................................................................................................................... 25
6.1 Mainstreaming the Fuel Economy metric ................................................................................. 25
6.2 Monitoring, Evaluation and Information Exchange ............................................................. 26
6.3 Future Studies ..................................................................................................................................... 27
7 References ....................................................................................................................................................... 28
Annexes
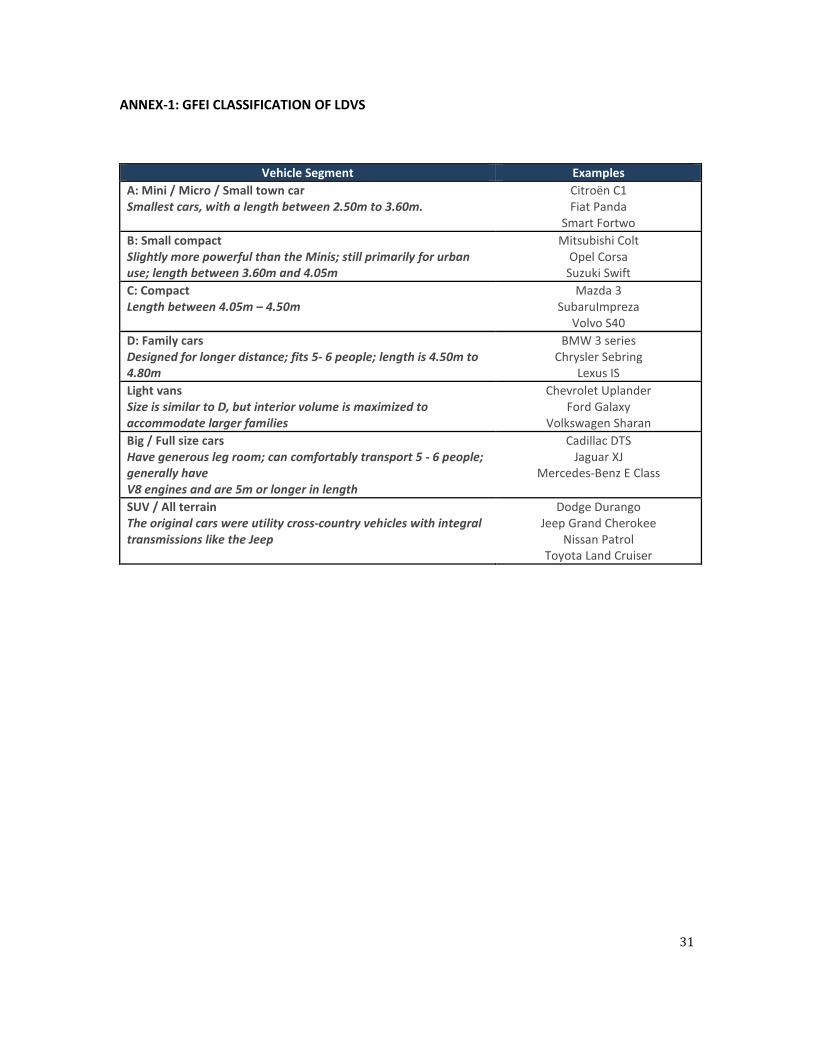
ANNEX-1: GFEI CLASSIFICATION OF LDVS
ANNEX-2: SAMPLE OF LDV DATA

3
List of tables
Table 1: Top 10 selling car models in Egypt in 2012 ................................................................................................... 11
Table 2: Gasoline prices in Egypt in 2006 and 2014 ................................................................................................... 15
Table 3: Annual average fuel economy of new LDVs in context (units: l/100km, based on NEDC
driving cycle) ................................................................................................................................................................................. 22
List of figures
Figure 1: Source-attribution of PM10 air pollution in Cairo (USAID, 2004) ....................................................... 7
Figure 2: Vehicle stock in Egypt by license type (Source: CAPMAS, 2013) ......................................................... 8
Figure 3: Modal split in Greater Cairo for daily trips of 500m or more (JICA 2002 and ETCE 2014) ..... 9
Figure 4: Passenger cars sales in 2010 by engine size (AMIC 2010 data) ......................................................... 11
Figure 5: Annual LDV sales in Egypt ................................................................................................................................... 19
Figure 6: Trend of annual average engine sizes of annual LDV sales in Egypt. ............................................... 20
Figure 7: Trend of annual average fuel economy of new LDVs in Egypt (normalized to the NEDC
driving cycle) ................................................................................................................................................................................. 21
Figure 8: Trend of annual average CO2 emission rate of new LDVs in Egypt (normalized to the NEDC
driving cycle) ................................................................................................................................................................................. 21
Figure 9: Total LDVs licensed as passenger cars including taxis throughout 2003-2013 (CAPMAS and
own estimates) ............................................................................................................................................................................. 22
Figure 10: Road sector gasoline and diesel fuel consumption in Egypt (World DataBank data, 2014)
............................................................................................................................................................................................................. 23
Acknowledgment
The authors wish to express great appreciation for the kind support and cooperation from Mr.
Karim Tinawi, Board Member of the Automotive Marketing Cooperation Council (AMIC) who has
provided helpful feedback and information exchange throughout the course of the study.

4
TABLE OF ACRONYMS
ACRONYM DESCRIPTION
AMIC Automotives Marketing Information Council
CAFE Corporate Average Fuel Economy
CBU Completely Built Up
CEDARE Center for Environment and Development for the Arab Region and Europe
CO2 Carbon Dioxide
CKD Completely Knocked Down
EAFA Egyptian Auto Feeders Association
GC Greater Cairo
GFEI Global Fuel Economy Initiative
IDSC Information and Decision Support Center
ITDP Institute for Transportation & Development Policy
ITS Intelligent Transportation Systems
JICA Japan International Cooperation Agency
LDV Light Duty Vehicle
NEDC New European Driving Cycle
PED Price Elasticity of Demand
SUV Sports Utility Vehicle
UNEP United Nations Environment Programme
USAID United States Agency for International Development
WB World Bank
5
1 INTRODUCTION
As part of the Global Fuel Economy Initiative (GFEI) and the strategic partnership between the
Center for Environment and Development for the Arab Region and Europe (CEDARE) and the
United Nations Environment Programme (UNEP) under the program entitled "Improving Fuel
Quality and Fuel Economy in Middle East & West Asia (MEWA)", the present study aims to
assess fuel economy and carbon emissions of light duty vehicles in Egypt and to review relevant
regulations. This case study contributes to the global effort to reduce fuel-dependence, improve
vehicle fleet technologies, and mitigate the environmental and economic impact of inefficient
vehicles in pursuit of a more sustainable transport sector.
The scope of this report is limited to new Light Duty Vehicles (LDVs). Future studies may also
address on-the-road vehicles (i.e. the entire stock) and the rest of vehicle classifications.
The report firstly presents background about the context surrounding the automotive industry
in Egypt and the associated environmental, economic and social aspects. An overview of the
industry is then presented with a brief summary of the relevant regulations related to the LDVs
in Egypt and the policy environment. The methodology for data collection, calculations and
analysis is then explained and the results are presented and discussed. Recommendations for
regulations and future studies are presented in the final section of the report.
1.1 OBJECTIVES
The overall aim of this study is to present the case study of Egypt in terms of the state of the
vehicle fuel economy and carbon emission trends of new LDVs in the past years. It is presented
in the context of the Global Fuel Economy Initiative (GFEI) target to reduce the global average of
new LDVs from 8 L/100 km today to 4 L/100 km (50%) by 2030, and to further achieve this 50%
reduction for the entire LDV stock by 2050, the 50-by-50 target.
The specific objectives of this study are as follows:
1. Report on the average fuel economy for new light duty vehicles in Egypt and its trend over
the years 2005, 2008, 2010 and 2012.
2. Present follow-up recommendations for policy-makers and regulators.
6
2 BACKGROUND
Carbon Dioxide (CO2) emissions from the transport sector alone represent about a quarter of
global CO2 emissions from fossil fuels. As with current trends of the transportation sector
worldwide, there is consensus among advocates of sustainability that a paradigm shift toward
low-carbon mobility is needed, requiring investment in public transportation, facilitation of
intermodality, and reduction of private vehicle use among other travel demand measures, as
well as encouraging use of more efficient vehicle technologies (Litman 2012, ITDP 2010, UNEP
2011).
Despite the increasing understanding of threats associated with car dependence globally, today
car ownership remains in continuous increase globally, with projections of largest markets in
developing countries (IMF, 2008). This is equally the case in Egypt, where one study showed that
the period of 2001-2006 alone saw an increase in private vehicle licensing at a high rate of 7.4%
annually, 58% of which is in Greater Cairo (GC) alone (IDSC 2007, IDSC 2008).
2.1 LOCAL AIR POLLUTION AND CARBON EMISSIONS
The improvement of fuel economy of vehicles and carbon emissions often accompany
improvement in other types of local pollutants as well due to the overall improvement of vehicle
fleet technologies. This implies a synergy between carbon-reducing efforts and other efforts to
reduce local pollutants. Air pollution is a high priority in the development agenda of the
government of Egypt due to high levels of local pollutants experienced in dense cities.
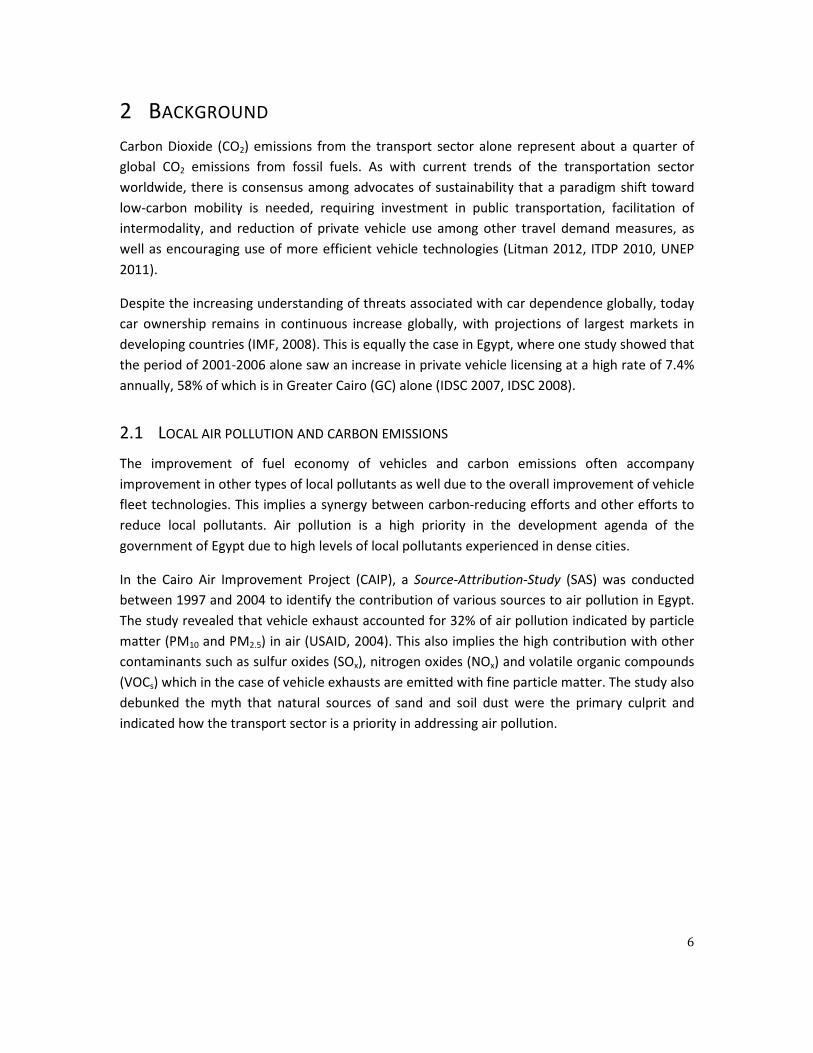
In the Cairo Air Improvement Project (CAIP), a Source-Attribution-Study (SAS) was conducted
between 1997 and 2004 to identify the contribution of various sources to air pollution in Egypt.
The study revealed that vehicle exhaust accounted for 32% of air pollution indicated by particle
matter (PM10 and PM2.5) in air (USAID, 2004). This also implies the high contribution with other
contaminants such as sulfur oxides (SOx), nitrogen oxides (NOx) and volatile organic compounds
(VOCs) which in the case of vehicle exhausts are emitted with fine particle matter. The study also
debunked the myth that natural sources of sand and soil dust were the primary culprit and
indicated how the transport sector is a priority in addressing air pollution.
7
Figure 1: Source-attribution of PM10 air pollution in Cairo (USAID, 2004)
Other empirical evidence has further confirmed that vehicle exhaust is the dominant source of
various pollutants in Cairo such as black carbon (BC) and the carcinogenic VOCs, benzene,
toluene, ethylbenzene and xylenes (BTEXS), and hydrocarbons (HCs) in street dusts (Mahmoud
et al. 2008; Khoder, 2004; Mostafa et al. 2008).
Further to local pollutants, a substantial portion of all greenhouse gases (GHGs) emissions in
Egypt are attributed to the transport sector. According to the Egypt Second National
Communication for the United Nations Framework Convention for Climate Change (UNFCCC),
26% of all GHG emissions from fuel combustion (the major source) is attributed to
transportation alone (UNFCCC, 2010). The government has adopted several measures for
reducing GHG emissions from the sector. Approaches mentioned include improving public
transport, improving fuel efficiency of vehicles, and monitoring on-road vehicle emissions,
among other measures. However, the translation of strategies into plans and practical
implementation has not been assessed.
2.2 VEHICLE STOCK
It is important to clearly differentiate between indicators of the total vehicle stock and the
indicators of the new vehicles entering the market. In this section, as background, an overview
of the total vehicle stock is presented. The overall upgrade in the stock is mainly a result of
improved new vehicles on one hand, and scraping of end-of-life vehicles on the other. There
have been no estimates to date, to the author’s knowledge, that estimate the rate of vehicle
scrapping.
8
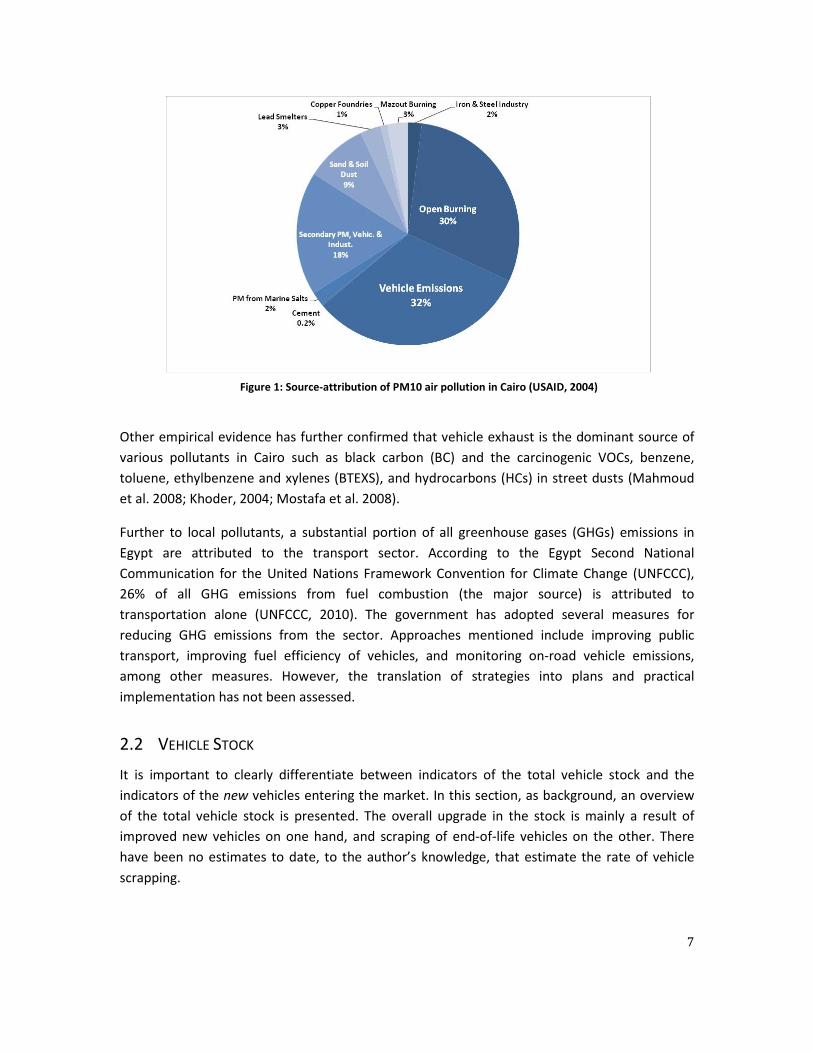
Regarding the vehicle stock in Egypt, in 2013, the total number of licensed vehicles in Egypt
were 7.04 million vehicles, and about half of them are in the capital, Greater Cairo (CAPMAS,
2013a, CAPMAS 2013b). Approximately half of all vehicles in Egypt are cars, specifically 3.83
million cars. The distributions of the types of vehicles are provided in Figure 2below.
Figure 2: Vehicle stock in Egypt by license type (Source: CAPMAS, 2013)
The proportion of all types of vehicles using diesel fuel is24% according the Central Agency for
Public Mobilization and Statistics of Egypt (CAPMAS, 2013b). However, almost all of them are
heavy duty vehicles and various sizes of buses. Regarding the national stock of passenger cars,
the proportion of cars that are diesel fueled are negligible. However, a portion of cars have been
converted to use Compressed Natural Gas (CNG) as part of a national program for vehicle
scrapping targeting Taxis. They are manufactured however as gasoline-fueled cars. This is
discussed in the results section.
2.3 MODE SPLIT
Private car ownership in Egypt remains among the lowest worldwide at 44 cars per 1000
inhabitants in 2013 (CAPMAS, 2014). This is an order of magnitude lower than most EU
countries. The ownership is also low even if considering the urban agglomerates separately.
Approximately 11% of households in Greater Cairo metropolitan region own a car (Sims, 2010).
The ownership rate for the rest of the governorates is significantly lower. The relatively low
ownership rate implies an opportunity to leapfrog into a paradigm of sustainable mobility
without going through stages of escalating car-dependence. However, car ownership is not a
sufficient indicator of car dependence, but rather the kilometers travelled or trips made by
commuters through different modes, i.e. the modal split (see Figure 3).
9
In the case of Egypt, although there have been no nation-wide surveys to determine the
national modal split, there was a large survey made for Greater Cairo region in 2001, which is
representative of about a quarter of Egypt’s population (JICA, 2002). This may be seen as
representative of the modal split in urban areas.
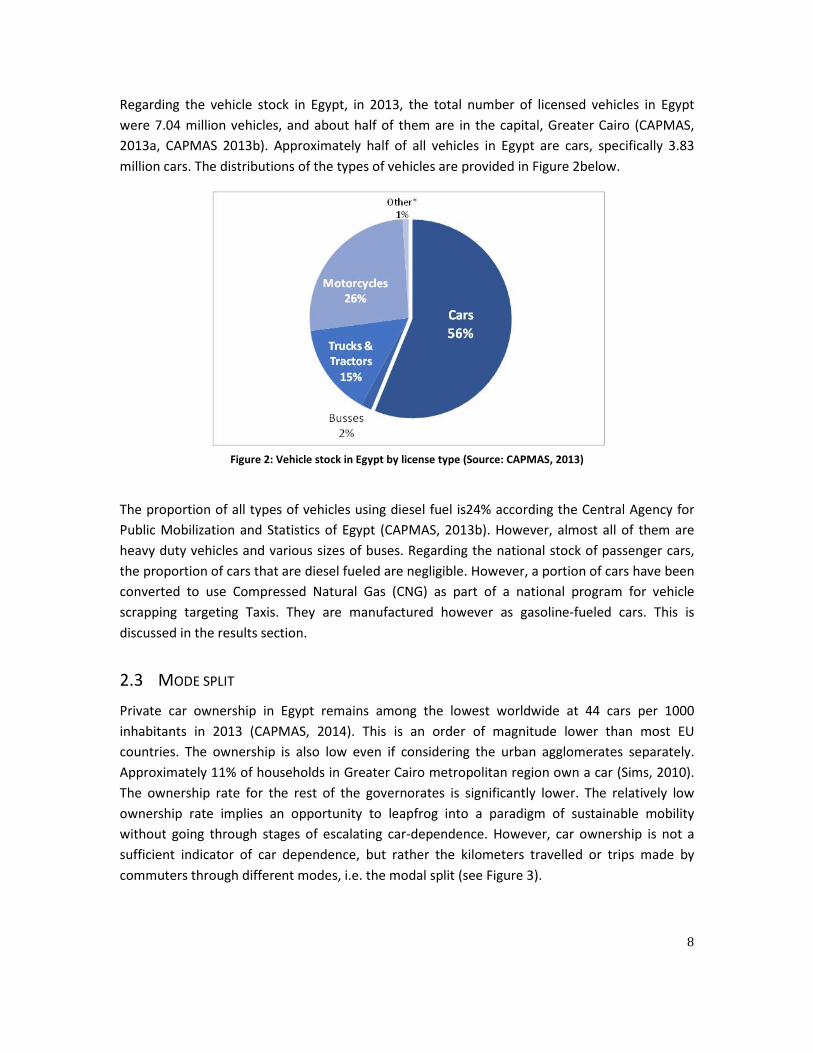
JICA (2002) found that private vehicle use in Greater Cairo account for only 16.4% of all
motorized trips of 500m or more as shown in Figure 3. Public transportation on the other hand
is widely used although diminishing; it accounts for 68% of all motorized trips (JICA 2002). Buses
contribute to 82% of all these public transportation trips; large buses, minibuses, microbuses,
and to a much lesser extent, minibuses of transport cooperatives. For the rest of the public
transport trips, almost all are by the three Metro Lines with further minor contribution from
light rail (the aging tramway system), and much less from the Nile ferries. Construction of new
Metro lines is notably slow (for various reasons) to keep up with growth in travel demand. There
are also motorized three-wheelers that serve mostly in informal settlements but have not been
subject to nation-wide licensing yet.
Figure 3: Modal split in Greater Cairo for daily trips of 500m or more (JICA 2002 and ETCE 20141)
Understanding indicators such as car ownership rates and the modal split is important to help
evaluate the implication of any LDV-related regulations on the daily trips of citizens and to help
understanding the relative social impact.
1 Personal communication with Egypt Transportation Transport of Excellence (ETCE), Ministry of Transport of
Egypt, confirms validity of the same mode split applying in 2014 due to similar expected linear growth in all
modes according to expert assumptions.
10
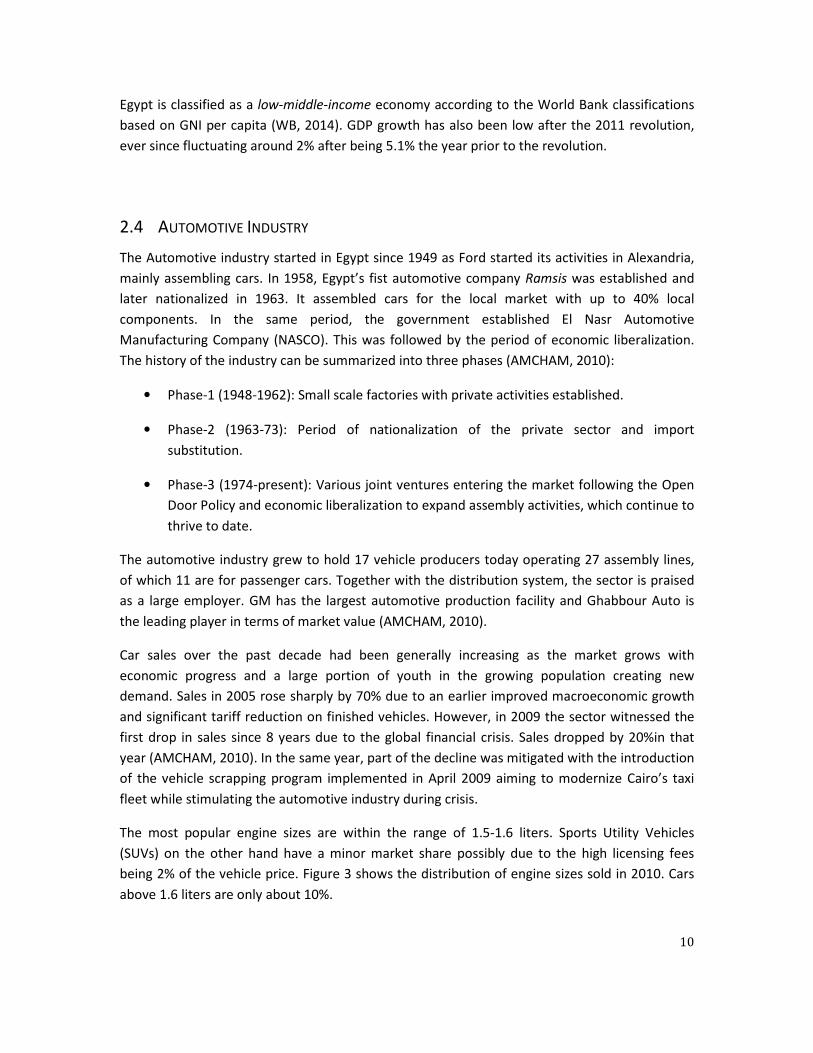
Egypt is classified as a low-middle-income economy according to the World Bank classifications
based on GNI per capita (WB, 2014). GDP growth has also been low after the 2011 revolution,
ever since fluctuating around 2% after being 5.1% the year prior to the revolution.
2.4 AUTOMOTIVE INDUSTRY
The Automotive industry started in Egypt since 1949 as Ford started its activities in Alexandria,
mainly assembling cars. In 1958, Egypt’s fist automotive company Ramsis was established and
later nationalized in 1963. It assembled cars for the local market with up to 40% local
components. In the same period, the government established El Nasr Automotive
Manufacturing Company (NASCO). This was followed by the period of economic liberalization.
The history of the industry can be summarized into three phases (AMCHAM, 2010):
• Phase-1 (1948-1962): Small scale factories with private activities established.
• Phase-2 (1963-73): Period of nationalization of the private sector and import
substitution.
• Phase-3 (1974-present): Various joint ventures entering the market following the Open
Door Policy and economic liberalization to expand assembly activities, which continue to
thrive to date.
The automotive industry grew to hold 17 vehicle producers today operating 27 assembly lines,
of which 11 are for passenger cars. Together with the distribution system, the sector is praised
as a large employer. GM has the largest automotive production facility and Ghabbour Auto is
the leading player in terms of market value (AMCHAM, 2010).
Car sales over the past decade had been generally increasing as the market grows with
economic progress and a large portion of youth in the growing population creating new
demand. Sales in 2005 rose sharply by 70% due to an earlier improved macroeconomic growth
and significant tariff reduction on finished vehicles. However, in 2009 the sector witnessed the
first drop in sales since 8 years due to the global financial crisis. Sales dropped by 20%in that
year (AMCHAM, 2010). In the same year, part of the decline was mitigated with the introduction
of the vehicle scrapping program implemented in April 2009 aiming to modernize Cairo’s taxi
fleet while stimulating the automotive industry during crisis.
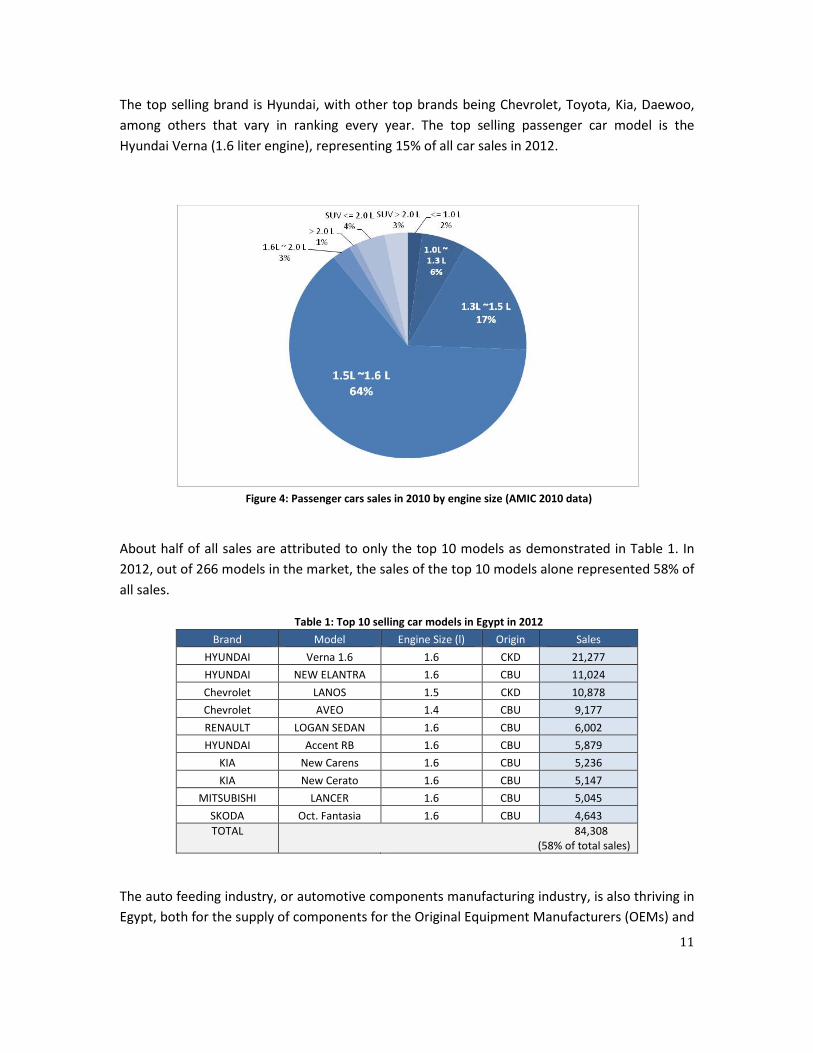
The most popular engine sizes are within the range of 1.5-1.6 liters. Sports Utility Vehicles
(SUVs) on the other hand have a minor market share possibly due to the high licensing fees
being 2% of the vehicle price. Figure 3 shows the distribution of engine sizes sold in 2010. Cars
above 1.6 liters are only about 10%.
11
The top selling brand is Hyundai, with other top brands being Chevrolet, Toyota, Kia, Daewoo,
among others that vary in ranking every year. The top selling passenger car model is the
Hyundai Verna (1.6 liter engine), representing 15% of all car sales in 2012.
Figure 4: Passenger cars sales in 2010 by engine size (AMIC 2010 data)
About half of all sales are attributed to only the top 10 models as demonstrated in Table 1. In
2012, out of 266 models in the market, the sales of the top 10 models alone represented 58% of
all sales.
Table 1: Top 10 selling car models in Egypt in 2012
Brand Model Engine Size (l) Origin Sales
HYUNDAI Verna 1.6 1.6 CKD 21,277
HYUNDAI NEW ELANTRA 1.6 CBU 11,024
Chevrolet LANOS 1.5 CKD 10,878
Chevrolet AVEO 1.4 CBU 9,177
RENAULT LOGAN SEDAN 1.6 CBU 6,002
HYUNDAI Accent RB 1.6 CBU 5,879
KIA New Carens 1.6 CBU 5,236
KIA New Cerato 1.6 CBU 5,147
MITSUBISHI LANCER 1.6 CBU 5,045
SKODA Oct. Fantasia 1.6 CBU 4,643
TOTAL 84,308
(58% of total sales)
The auto feeding industry, or automotive components manufacturing industry, is also thriving in
Egypt, both for the supply of components for the Original Equipment Manufacturers (OEMs) and

12
for the aftermarket sales (AMCHAM, 2010). The latter absorbs three quarters of total
component sales due to the long vehicle lives in Egypt. Egypt also produces vehicles for exports,
mostly to Africa and the Middle East and acts as a vehicle-assembling base for many
manufacturers.

13
3 REGULATIONS AND POLICY ENVIRONMENT
Both the business and the policy environment in Egypt aim to stimulate the growth of the
automotive sector by promoting foreign investment, seeking opportunities for labor-intensive
growth, reaching mutually beneficial international trade agreements, and improving the local
capacity for production. Measures have also recently been taken to retire old vehicles in order
to renew the vehicle stock.
3.1 TRAFFIC LAW 121/2008
In 2008, the Ministry of Interior enacted traffic law no. 121 of 2008, which stipulates that all
passenger transport vehicles (taxis, buses and microbuses) exceeding 20 years old cannot renew
their license to operate, effective as of August 1, 2008. The law acted as an incentive to
accelerate vehicle replacement and improve air quality, and came at a time when the
automotive industry needed stimulation during the economic crisis.
The law however did not mention how the old vehicles will be handled, such as through proper
scrapping and recycling to ensure that the old inefficient technology is not reused elsewhere
(UNFCCC, 2009). A taxi replacement scheme was therefore implemented to manage the
replacement of old taxis in the form of a vehicle scrapping and recycling program. Other
schemes for other vehicle types are yet to be introduced.
3.2 TAXI REPLACEMENT PROGRAM
In 2007, the Egyptian Environmental Affairs Agency started a pilot project for replacing 100 old
taxis exceeding 35 years of age with new vehicles running on Compressed Natural Gas (CNG)
with the initial motive of improving air quality (MSEA, 2008). The success of the program led it
to later expansion with the participation of the Ministry of Finance and the development of a
larger scheme of taxi replacement with both CNG-fueled and efficient gasoline-fueled cars.
The program became structured as a Public Private Partnership (PPP), with different parties
contributing to its overall operation. The parties include: the Ministry of Finance, the Ministry of
Interior, three participating commercial banks, five car companies, an insurance company and
an advertising company, among other stakeholders.
For taxi owners, they may voluntarily hand in their old vehicle in return for 5000 EGP (approx.
570 Euros) and a new locally-assembled car is provided without a down payment (AMCHAM,
2010). The automotive industry is stimulated in the process. The owner then pays fixed monthly
installments for five years, with exemption from sales taxes.
Fuel efficiency was estimated for the new and old vehicles in order to estimate the carbon-
reduction potential for the program and its feasibility as a carbon-reduction project. Carbon
14
reduction projects may produce Certified Emission Reductions (CERs) and benefit from carbon
trade revenues if accepted and registered in the United Nations Framework Convention for
Climate Change (UNFCCC). Estimates for fuel efficiency of old and new vehicles respectively
were estimated as averages for a sample population as follows (Mowafi, 2012):
• Baseline average fuel efficiency (old vehicles): 13.16 liters/100km (Gasoline) and 13.26
m3/100km (CNG)
• Project average fuel efficiency (new vehicles): 9.39 liters/100 km (Gasoline) and 8.34
m3/100 km (CNG)
Old vehicles then undergo managed scrapping and recycling. Advertisement on the taxi vehicles
also provides revenue to reduce the net costs for the owner. A second phase to the project was
implemented in 2010 with some changes to the process, including adding new brands and
extension of the repayment period. More than 26,000 new taxis were sold in 2010 alone,
representing 14% of total passenger car sales (AMIC, 2011).
The new taxis operate with gasoline or converted to also operate on Compressed Natural Gas
(CNG), i.e. retrofitted to be bi-fuel vehicles. CNG had been promoted with the introduction of
the taxi replacement program as a cleaner fuel for better air quality, and the CNG price was
initially significantly lower than gasoline. However, CNG was later subject to significant increase
in price, thereby reducing the incentive for gasoline-to-CNG conversion. The space taken in the
car trunk for the CNG fuel tank is a further disincentive, as well as the lower availability of CNG
fueling stations compared to gasoline. There has been no study however to evaluate the
impacts of the program to date, which is needed in order to constructively plan similar programs
in the future.
3.3 FUEL SUBSIDIES
Subsidies for transportation fuels in Egypt have long been amongst the highest worldwide. In
2012, Egypt was among the three countries with lowest gasoline retail prices in Africa, the other
two countries being Libya and Algeria (GIZ, 2014). In 2012 for example, gasoline in Egypt was
less than half the retail price of gasoline compared to other countries that were also subsidizing
fuel, such as Tunisia and Ghana, and also an entire order of magnitude less than several
countries across Africa such as Morocco, Eritrea, Kenya and South Africa, among others (GIZ,
2014).Retail prices are presented in section 3.4 below. The subsidies in Egypt have been however
subject to gradual phase-outs. The key challenge is removing the subsidy without affecting the
poorer segments of society.
Throughout 2002-2013the expenditure on fuel subsidies grew at a compound annual growth
rate of 26%, a substantial fiscal burden that consumes 7% (EGP 120 billion in 2013) of Egypt’s
Gross Domestic Product (GDP) (IISD, 2014).Expenditure on fuel subsidies remains more than
expenditures on subsidies for health, education, and infrastructure combined (IISD, 2014).

15
3.4 GASOLINE PRICES
In the recent attempts to lift the subsidies on gasoline, the price of gasoline was increased in
July 2006 by 30% for the octane-90 gasoline, and by 20-25% for other petroleum products2.
Prices were increased once more in July 2014; 80-octane gasoline was raised by 78% and 92-
octane gasoline was raised by 41%, but still remaining below the cost of production.
Furthermore, 95-octane which serves a small minority has also been subject to more frequent
increases. Current prices are as follows:
Table 2: Gasoline prices in Egypt in 2006 and 2014
Gasoline 80 Gasoline 92 Gasoline 95
2006 EGP/liter 0.90 1.40 2.75
EURO/liter 0.10 0.16 0.31
2014 EGP/liter 1.60 2.60 6.25
EURO/liter 0.18 0.30 0.71
Current prices still remain low however compared to other countries of which many have
eliminated subsidies and sell at market prices or even have fuel taxes, carbon taxes, etc.
Subsidies are planned to be further phased out in Egypt. The correlation between fuel prices and
vehicle ownership and use are discussed in section 5.2, noting how car use continues to grow
despite increments in fuel prices.
3.5 SOCIAL ASPECTS AND SUBSIDY RATIONALIZATION
The government’s discourse with regards to the social aspects of fuel prices revolves around the
following arguments:
• The majority of those who benefit from the current universal fuel subsidies are those of
the higher income strata (richer minority) who own cars and have energy-intensive
lifestyles (ESMAP, 2009). It is therefore in the favor of the poor if savings from subsidy
reductions are achieved and then directing the savings to target the specific needs of
the poor through a carefully designed targeted compensation system and other subsidy
rationalization measures. There have not been however announcements of concrete
mechanisms adopted by the government to operationalise this concept or to indicate
allocation of savings.
2 90-octane gasoline has later been phased out of the market in February 2014, and consumers
mostly shifted to 92-octane gasoline.
16
• In terms of transportation fuel, most of the increase in prices has been in gasoline,
which is the main fuel of passenger cars. However, the poorer strata predominantly use
public transport powered by electricity (metro and tramways) or by diesel (busses and
microbuses), which are being subject to price increments at a much slower pace and
remain low. The present cost of diesel fuel is about 22 Euro-cents per liter, and bus
tickets average 18 Euro-cents, while the Metro line service is offered at a fixed fare of
0.12Euro-cents for all distances. Mobility in Egypt is therefore provided to the poor at
affordable prices through subsidized public transport.
In any case as subsidies are slowly phased out or rationalized it is advisable that explicit safety-
net schemes are put in place to mitigate adverse impacts on the poor segments of society and
to ensure good management of subsidy savings (AFDB, 2012).
3.6 CUSTOMS AND TAXATION
In 1993, a commercial ban on imports of passenger cars was lifted and replaced with import
duties so that the local industry then faces controlled competition (AMCHAM, 2010). In 1998,
multiple decrees were issued to regulate vehicle importation, including the stipulation that all
imported cars must be of the same year of production and brand new.
Tariff rates imposed on imported passenger cars (CBUs) vary according to engine size. The tariffs
currently range from 40% for passenger cars of capacity up to 1600 cc, to 135% for those above
1600 cc (Ministry of Finance, 2014).
Sales taxes also follow similar logic where cars of engine sizes up to 1600 cc are subject to 15%
sales taxes, while those above 1600 cc are subject to 30% sales taxes, or 45% if they are
imported (CBUs) (AMCHAM 2010). Passenger cars with large engine sizes are seen as luxury
goods and hence the higher tariff rate and sales taxes.
International trade agreements however are in place in Egypt, gradually eliminating tariffs
through various schemes. Agreements include the Egypt-EU Association Agreement (EEAA),
Egypt-Turkey Free Trade Agreement (FTA), and the Egypt-European Free Trade Association
(EFTA) (AMCHAM, 2010). The implied competition is expected to incentivize local manufacturing
to reach and maintain international standards in locally-produced cars in order to survive. Such
upgrade in standards due to facilitated imports or improved local manufacturing may improve
the performance of new vehicles in Egypt. However, there has not been any study to monitor
such impact on fuel economy and emissions.
With regards to interventions for promotion of cleaner vehicles, there are no incentives or
disincentives to date explicitly attributed to fuel economy of cars or emission rates except for
adhoc projects or pilot projects. The most significant program of such is the Taxi replacement
17
program, which was accompanied by a decree that terminates the license renewal of any mass
transport vehicle (including taxis) that exceed 20 years of age (see section 3.2).
3.7 ADVENT OF AUTO CREDIT FACILITIES
A significant influence on car sales in the past years has been the rapid advent of various credit
facilities and the spread of the culture of car loans. In 2007-2008 alone, new car purchases using
consumer credit grew from 40% to 60% (AMCHAM, 2010). This new market growth may be
partially attributed to the improved performance of the banking system during its period of
reform leading to the development of new and diverse services.
Other than banks, auto credit providers also offer similar facilities. Car dealers and
manufacturers may as well offer loan financing programs.
The various schemes and models offered allow a larger segment of consumers to purchase cars.
Standards related to environmental performance of vehicles however have not been
mainstreamed into any of the schemes.

18
4 METHODOLOGY
The methodology used was in principle based on the Global Fuel Economy Initiative (GFEI)
methodology provided through the online GFEI toolbox3. It is used to harmonize global efforts in
constructing baselines and identifying trends of national fuel economy and CO2 emissions of
light-duty vehicles (LDVs). LDVs include mini, small, compact, family and big cars in addition to
light vans and sport utility vehicles (SUVs) (Annex 1).
The new LDVs data are compiled from sales data and cross-checked with data from the
Automotive Marketing Information Council (AMIC) of Egypt for the years 2005, 2008, 2010 and
2012. A sample of the data set is presented in Annex 2. The data set includes the following
vehicle characteristics:
- Vehicle make
- Vehicle model
- Model production year
- Engine size (in cubic meters – cc)
- Vehicle origin, i.e. whether it is an imported Completely Built Unit (CBU) or a locally
assembled Completely Knocked Down Unit (CKD)
Furthermore, vehicle licensing data was also obtained to provide an indication of the context of
overall vehicle stock as presented in earlier sections.
Based on the available data, the fuel economy figures were obtained for each vehicle as
available from manufacturers and normalized to the New European Driving Cycle (NEDC) so that
they are all comparable. The CO2 emission rates were then calculated according the conversion
factor noted in the ICCT tool converting the fuel economy figures to resultant CO2 emissions4.
Data on total vehicle stock was also surveyed in order to put results into perspective and
facilitate the analysis.
3 GFEI toolbox: http://www.unep.org/transport/gfei/autotool/about.asp 4 ICCT conversion tool: http://www.theicct.org/info/data/GlobalStdReview_Conversionfactor.xlsx
19
5 RESULTS AND DISCUSSION
A record of more than 630,000 LDVs has been collected for the target years 2005, 2008, 2010,
and 2012. Each LDV is provided with the minimum information of the brand, model, engine size,
manufacturing year, and whether it is a Complete Built Up (CBU) or a Complete Knock Down
(CKD), and all obtained from sales data.
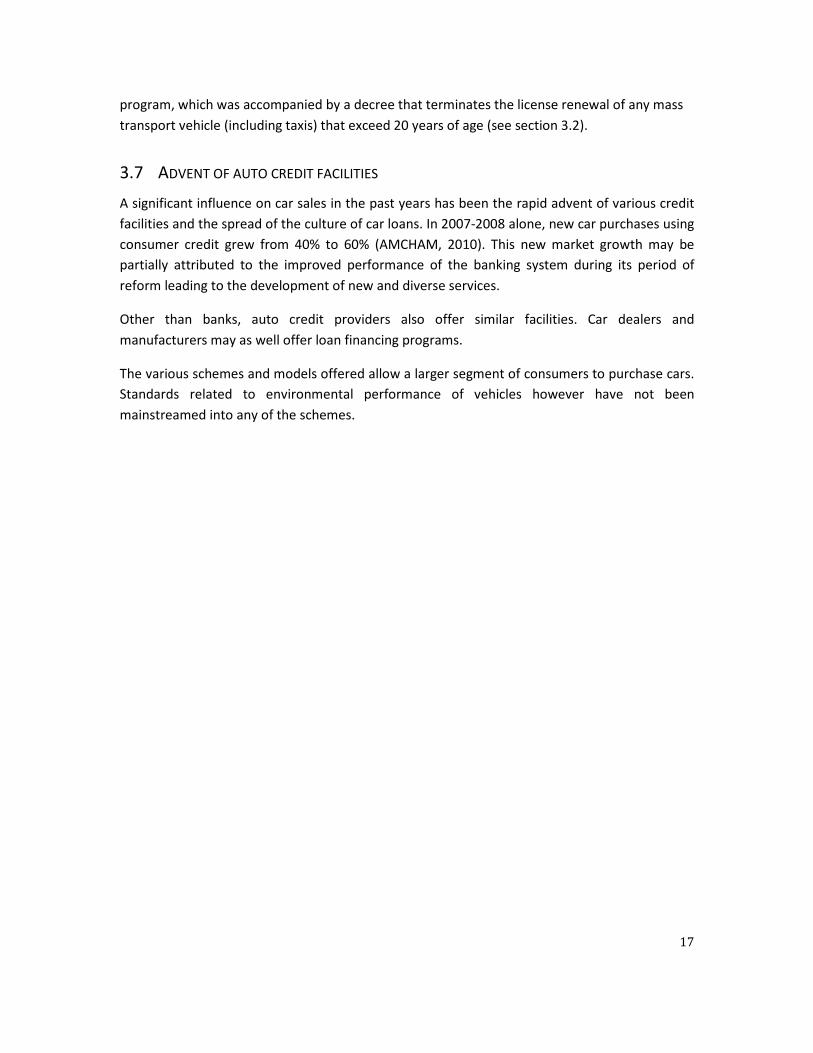
51brands in total have been selling in Egypt in the 4 target years with a total of 527 models
indicating the diversity of the Egyptian market. Figure 5below shows the annual sales of LDVs in
the target years.
Figure 5: Annual LDV sales in Egypt
Throughout the study, it was possible to assign the fuel economy figures for 88% of the models
from the figures provided by the manufacturers. The conversion factors provided in the ICCT
tool were then used to determine the equivalent emission rate of each model.
Figure 5 shows that there were growing annual sales since 2005 that have eventually leveled off
and decreased significantly between 2010 and 2012 throughout the period of economic
difficulties after the 2011 revolution.
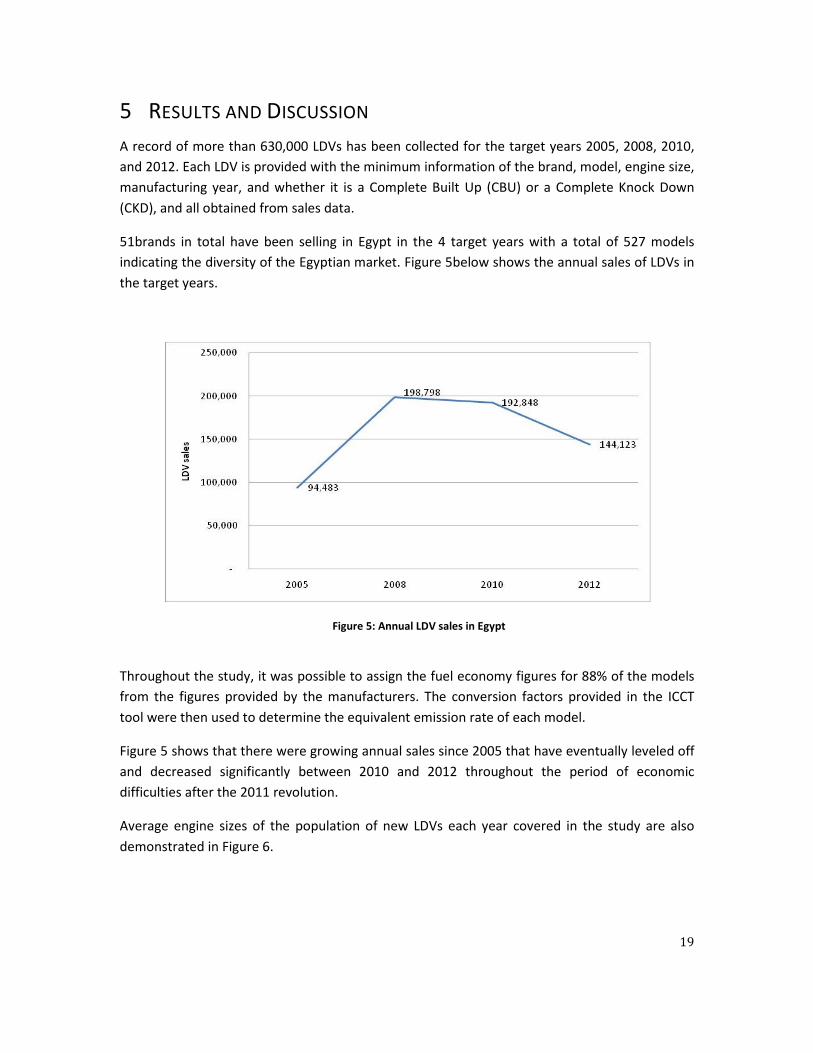
Average engine sizes of the population of new LDVs each year covered in the study are also
demonstrated in Figure 6.
20
Figure 6: Trend of annual average engine sizes of annual LDV sales in Egypt.
Sales of large engine sizes have also decreased throughout 2010-2012. This is expected to be
largely due to the increasing demand on vehicles of smaller engine sizes correlated with the
economic difficulties in the same years during and after the revolution. Furthermore, the
consumer is not accustomed to other indicators of fuel consumption other than engine size.
However, there has been no survey in Egypt to the author’s knowledge that investigates the
efficiency-related awareness of consumers and whether they understand that engine size is not
the only indicator of the vehicle’s likely fuel efficiency, and whether they actively seek
information about the vehicles fuel economy when making the purchase decision. Such
consideration is promoted when eco-labeling schemes are implemented, to bring more practical
indicators of efficiency to the attention of the consumer, and to facilitate planning more
relevant policies that target emission reduction.
Figure 7shows the annual average fuel economy of the new LDVs covered in the study. When
compared to the trend of the average engine size, it is apparent that the trend may differ
significantly. This is significant in 2008 when average fuel economy declines despite an incline in
the average engine size, signifying a significant improvement in that period in fuel economy
even as engine sizes increase (i.e. improvement in fuel economy surpassing the impact of larger
engine sizes), which may be attributed to better engine technologies and lighter designs.

21
Figure 7: Trend of annual average fuel economy of new LDVs in Egypt (normalized to the NEDC driving cycle)
Figure 8 also presents the results of the corresponding trend of annual average CO2 emission
rates of the new LDVs covered in the study, showing the same overall increase, with the most
recent average CO2 emission rate of 170gCO2/km in 2012.
Figure 8: Trend of annual average CO2 emission rate of new LDVs in Egypt (normalized to the NEDC driving
cycle)
The CO2 emission rates of new LDVs directly correlate to the fuel economy. The status of these
results in the global context is explained in the following section.
5.1 AVERAGE ANNUAL FUEL ECONOMY IN GLOBAL CONTEXT
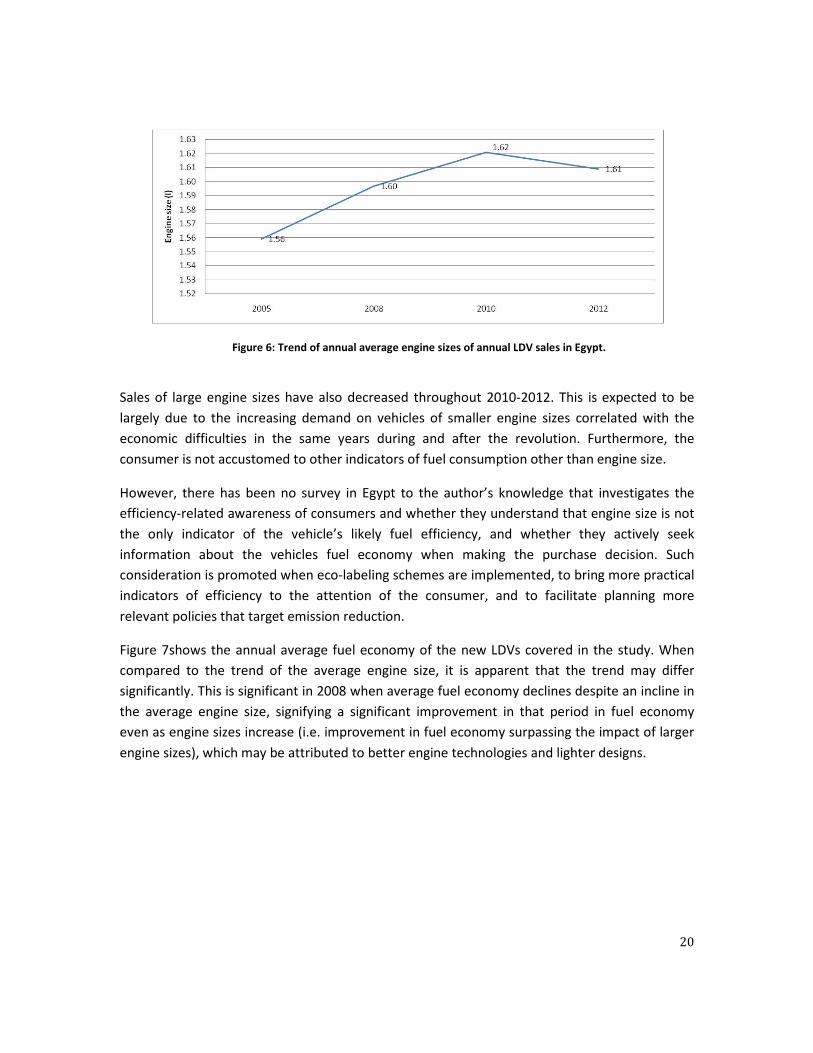
To put the study results into perspective, Table 3compares the figures for Egypt with OECD and
non-OECD country averages as well as the global average.
22
Table 3: Annual average fuel economy of new LDVs in context (units: l/100km, based on NEDC driving cycle)
2005 2008 2010 2012 2030
Egypta
6.95 6.68 7.20 7.28
OECDb
8.21 7.66
Non-OECDb 7.49 7.68
Globalb
8.07 7.67
GFEI b
8.07
4.03 (global target)
a: Source: Own calculations (88% of the LDV models covered)
b: Source: GFEI (2013)
Table 3 shows that Egypt’s baseline average fuel economy in 2005 was significantly lower than
the global baseline. However, despite an initial improvement there has been consecutive
increase later. With regard to the GFEI target of 4.03 l/100km by 2030, it is estimated that the
new LDVs in Egypt would need to lower their average fuel economy at a rate of 3.2% annual
reduction from 2012 until 2030. Had Egypt started such a commitment since 2005, the annual
reduction necessary would have only been 2.2%.
Addressing the issue of fuel economy of new vehicles is important to ensure that the new
vehicles on the road are cleaner as they gradually replace the end-of-life vehicles. However, the
total stock is increasing, and it is important that total consumption and emission is addressed in
studies and not only the new technologies.
5.2 OWNERSHIP VS. CONSUMPTION
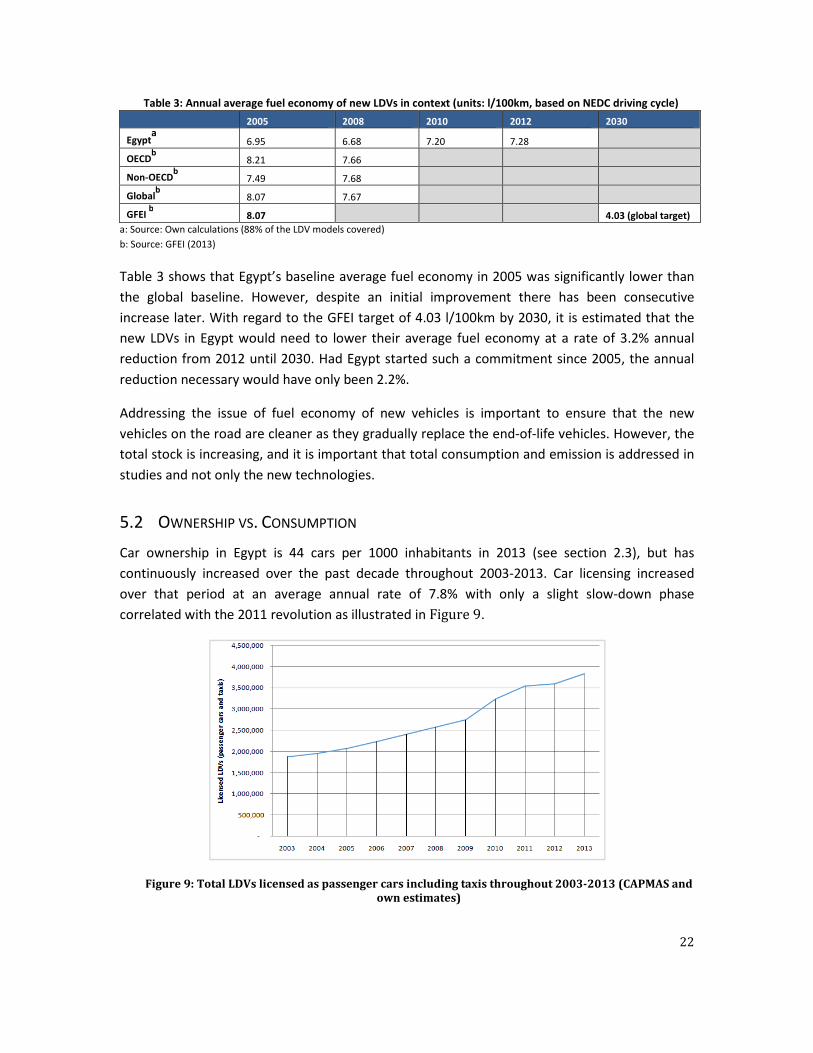
Car ownership in Egypt is 44 cars per 1000 inhabitants in 2013 (see section 2.3), but has
continuously increased over the past decade throughout 2003-2013. Car licensing increased
over that period at an average annual rate of 7.8% with only a slight slow-down phase
correlated with the 2011 revolution as illustrated in Figure 9.
Figure 9: Total LDVs licensed as passenger cars including taxis throughout 2003-2013 (CAPMAS and
own estimates)

23
Car ownership has been steadily increasing in Egypt and is expected to continue increase based
on the expected trajectory of typical economies in transition (IMF, 2008). However, ownership
of cars per-se is not necessarily highly responsive to changes in fuel prices since car ownership
can continue to increase while car use may follow a different behavior. One convenient indicator
of the extent of car use is gasoline consumption (another common metric is vehicle-kilometers-
traveled (VKT), depending on available national surveys). Therefore, when discussing carbon
emissions, the car use (as roughly indicated by gasoline consumption) is more indicative than car
ownership.
In Egypt, gasoline consumption, despite increases in fuel prices, has also continued to increase
significantly as indicated in Figure 10. In order to understand the influence of price increases, a
study of price-elasticity of demand (PED) is needed. If car use is increasing and is highly inelastic,
this means little influence of prices on car use compared to other factors influencing demand.
However, such a study has not been conducted in Egypt. Figure 10 shows gasoline consumption
in Egypt for the years 2005 to 2011. A relatively steady increase is shown, with consumption
almost doubling over the 6 years.
Figure 10: Road sector gasoline and diesel fuel consumption in Egypt (World DataBank data, 2014)
Research on price elasticity would compare the actual trend of consumption compared to a
forecast no-action scenario, and should study the causality between both factors since there are
other factors that would influence gasoline consumption other than fuel price (e.g. urbanization
and cultural change, GDP growth, land-use change, state of alternative modes of transport, car
prices, choice of vehicles, etc). This may be an opportunity for future research on this topic. But
what can be concluded from Figure 10 is that consumption is increasing at a higher rate
(average annual increase of 12%) than the LDV stock (average annual increase of 9%) over the

24
same years. Therefore, not only is the total stock increasing, but the use of each car on average
is increasing as well.
5.3 CNG BI-FUEL VEHICLES
This section discusses a significant gap in research related to Egypt’s experience with CNG
bi-fuel vehicles and expected impact on future studies of fuel economy in Egypt. Although a
carbon-reduction project has been launched for the Taxi replacement program, it has been a
challenge to feasibly monitor the actual project emissions and there is therefore no
information on verifiable emission reductions. Furthermore, being bi-fuel vehicles, it is
another challenge to understand to what extent the driver chooses to use natural gas rather
than gasoline. Although gasoline is more expensive, it may be chosen by the driver due to
higher availability of gasoline stations, or varying preferences in vehicle operation, or a
choice to dismantle the CNG tank to reclaim space in the car trunk, etc.
In any case these considerations are out of the scope of the present study, since taxis as new
LDVs, (i.e. when sold) are dedicated gasoline-fueled cars like the rest of the new LDVs.
Furthermore, even if the retrofitted bi-fuel LDVs are considered new, the figures for fuel
economy will only be more conservative (i.e. showing a slightly higher rate of
consumption).

25
6 CONCLUSIONS
Study results show that the average fuel economy in Egypt in 2005 as a baseline was more than
13% lower than the global average. Had Egypt set a plan since 2005 to reduce its average fuel
economy, the GFEI target average of 4 l/100km by 2030 would have been much easier to reach.
However, the trend shows a growth in average fuel economy, which may be attributed to the
economic growth and the growth of the automotive industry as well as the emergence of credit
facilities encouraging the purchase of larger and high-end cars.
In many countries, sales may grow rapidly while the average rate of fuel consumption may drop
as policies are set in place to improve the technologies and promote cleaner vehicles. In Egypt
however the unfortunate growth in the average rate of fuel consumption continues throughout
the global financial crisis and also through the period of the 2011 revolution although growing at
a much lower rate. Furthermore, international experience suggests that with the recovery of the
economy in the coming years, and with the socio-economic and demographic characteristics of
Egypt, growth in car sales will accelerate once more. Ensuring the new fleets have lower rates of
consumption is therefore fundamental to mitigate the impact of the growing vehicle stock.
It remains to be seen whether the new cars will be of better fuel economy or not. There are no
regulations that specifically target fuel efficiency. Cars with larger engine capacities are indeed
often more expensive, but they do not necessarily consume more fuel per kilometer in all cases.
Also different models of the same engine capacity have significantly different fuel economy
figures. Strategies to improve average vehicle fuel economy therefore do not necessarily
threaten the growth in sales; it merely implies the need to ensure that the sales are better in
overall fuel efficiency.
The automotive sector in Egypt is a large employer and is a significant contributor Egypt’s
economic growth. It is therefore necessary to strike a balance between the environmental and
economic motives of policy makers, or to ideally find synergies between them such as found in
the taxi replacement program. Such a program is recommended to be assessed in terms of its
environmental, economic, and social impact, and to be replicated with other vehicle categories
(e.g. busses and microbuses) based on Cost-Benefit Analysis (CBA) that also take into account
external costs (e.g. disposal costs, etc) and external benefits (e.g. job creation, air pollution
reduction, etc) together with the other common economic indicators.
6.1 MAINSTREAMING THE FUEL ECONOMY METRIC
Without fuel economy standards in place or even performance labeling, the consumer is not
likely to be accurately aware of efficient vehicle choices since the only indicator for fuel
consumption is the engine capacity. Engine capacity however is not suitable guidance and does
not sufficiently differentiate between efficient and inefficient vehicles. The fuel economy or fuel
26
efficiency indicator must therefore come to the attention of the consumer through labeling or
as a standard provision in vehicle specifications according to a unified national standard.
Firstly however, a suitable indicator of fuel economy (e.g. in liters/100km based on the NEDC
driving cycle, or another suitable metric) must be agreed on (with an effective translation)
among stakeholders in order to have a common indicator to avoid confusion (see e.g. Larrick,
2008) and to facilitate comparison and benchmarking. Afterward, based on studies, the metric
must be mainstreamed into laws and regulations related to incentives and disincentive
mechanisms such as tariffs and sales taxes in order to facilitate amending regulations to favor
cleaner vehicles. The same applies to mainstreaming the concept across providers of credit
facilities in order to incorporate environmental and fuel consumption considerations, i.e.
suggesting environmentally-responsible credit facilities that favor efficient cars.
The first step in this direction is to establish the standards to categorize vehicles according to
fuel economy as part of the attributes of every vehicle model in relevant databases, and to
reach agreement between stakeholders on the driving cycle to be used and on the common
vocabulary/metrics used. Notably, in Egypt, the units used by most stakeholders is indeed
l/100km but it is termed Fuel Efficiency as used in presentations and in official project
documents of the taxi replacement program (e.g. Mowafi 2012, UNFCCC, 2009). It is therefore
recommended to translate it as such for efficient communication with local stakeholders instead
of Fuel Economy.
Furthermore, to market a powerful argument in support of this action it would be necessary to
make an assessment of the forecast fuel consumption reduction in Egypt as a result of overall
vehicle stock improvement. This would be of great support to the proposed action since fuel
subsidies in Egypt are a substantial burden to the government and are higher than any other
subsidy. Therefore any initiative to reduce fuel consumption would receive great attention if the
impact on the state budget is clear and the social impact can be feasibly mitigated.
6.2 MONITORING, EVALUATION AND INFORMATION EXCHANGE
Although various sources praise the success of Egypt’s taxi replacement program, there is no
actual measurement and assessment of the various impacts of the project in terms of fuel
economy or emissions in the context of the entire sector, or published assessments of the
program’s replicability (e.g. for other vehicle categories). Monitoring and evaluation of the
performance of new vehicles as well as the vehicle stock is necessary in order to better design
environmental interventions. A first step recommended for the case of Egypt is to assess the
vehicle scrapping program in retrospect, not only from the perspective of the business model
and the administrative success but also from the perspective of fuel consumption and emission
reduction which were the original motives in the very first pilot trial in 2007 before program
expansion.
27
Other than monitoring and evaluation of past programs, the periodic monitoring of the
environmental state-of-cars in Egypt would be very instrumental in planning environmental
interventions since information is greatly lacking in this respect. Such a practice would also
ensure building on the efforts of the present study and would also facilitate information
exchange between stakeholders as well as mainstreaming the metrics of fuel economy and
carbon emissions.
Key stakeholders are the private sector associations: Automotives Marketing Information
Council (AMIC) and the Egyptian Auto Feeders Association (EAFA), as well as the following public
stakeholders: Central Agency for Public Mobilization and Statistics (CAPMAS), the Ministry of
Interior (who compile vehicle registrations and oversee licensing and inspection), the Ministry of
State for Environmental Affairs, the Ministry of Finance (who administer subsidy schemes and
vehicle replacement schemes), and the relevant international organizations such as Center for
Environment and Development in the Arab Region and Europe (CEDARE) and its partners, and
finally other academic and research institutes and NGOs.
It is recommended for future studies on LDVs to investigate the state of the total vehicle stock
to have a more holistic understanding of LDV consumption and emissions and the impact of past
interventions on the entire stock of LDVs (and their use) from the technical, economic, social,
and environmental perspectives. Furthermore new policies and programs should not be
introduced without thorough and extensive evaluation of the past interventions, such as the
impact of the taxi replacement program, impact of past subsidy phase outs (fuel price
increments), and the impact of traffic law of 2008 limiting the age of public buses and taxis, as
well as any other influencing interventions.
6.3 FUTURE STUDIES
The scope of the present study was focused on new LDVs and benchmarked against the GFEI
targets of 2030 for new LDVs. It is recommended as a next step to investigate the state of the
entire LDV stock and their consumption rates and patterns in order to have a more complete
baseline as the next milestone in Egypt’s LDV studies.
To illustrate the importance of such a study, in the samples taken from old and new taxis in the
vehicle scrapping program (see section 3.2) the operating fuel efficiency of the old gasoline cars
were found to be 38% lower than the new cars, not to mention the deterioration of new cars
once in operation. In the meantime, most cars in Egypt are old (exceeding 20 years of age) while
the laws dictating scrapping of old cars is only targeting taxis and busses, but not private cars,
which are the vast majority. In order to conclude with more convincing policy implications, a
study of the total LDV stock in Egypt must be conducted, addressing the issue from the
economic, environmental and social perspectives. This effort would conform to the GFEI global
targets for a 50% improvement in fuel economy of the total LDV stock worldwide and would be
of great value to policy makers in Egypt.
28
7 REFERENCES
1. African Development Bank (2012). Reforming Energy Subsidies in Egypt. Retrieved from:
http://www.afdb.org/fileadmin/uploads/afdb/Documents/Publications/ECON%20Vincent%20no
tes%20mars%202012_ECON%20Vincent%20notes%20mars%202012.pdf
2. A.R. Mostafa, A.H. Hegazi, M.Sh. El-Gayar, J.T. Andersson (2008): Source characterization and the
environmental impact of urban street dusts from Egypt based on hydrocarbon distributions, Fuel
88 (2009) 95–104.
3. Automotive Marketing Information Council (2011): Annual sales excel report data set.
Unpublished raw data.
4. Central Agency for Public Mobilization and Statistics (2013a). Press Release (original in Arabic).
Retrieved from: http://www.capmas.gov.eg/default.aspx
5. Central Agency for Public Mobilization and Statistics (2013b). Survey of Vehicles (original in
Arabic). Retrieved from: http://www.capmas.gov.eg/pdf/news/7asrMarkbat2013.pdf
6. Deutsche Gesellschaft für Internatonale Zusammenarbeit (GIZ) GmbH (2014): International Fuel
Prices 2012/2013, 8th Edition. Retrieved from: http://www.giz.de/expertise/downloads/giz2014-
en-international-fuel-prices-2013.pdf
7. Energy Sector Management Assistance, Program (ESMAP 2009), Arab Republic of Egypt: Energy
Pricing Strategy, Washington, May 2009.eRetrieved from:
https://www.esmap.org/sites/esmap.org/files/Egypt_An_Energy_Pricing_Strategy.pdf
8. Global Fuel Economy Initiative (2013): Global Fuel Economy Initiative: Plan of Action 2012-2015.
Retrieved from:http://www.globalfueleconomy.org/Documents/Publications/workplan.pdf
9. Information and Decision Support Center (2007), Informational Reports: Cars in Egypt, Numbers
and Facts. Information and Decision Support Center, Egyptian Cabinet of Ministers, Cairo,
November 2007.
10. Information and Decision Support Center (2008), Toward Rationalization of Car Use in Egypt,
(White Paper), Information and Decision Support Center, Egyptian Cabinet of Ministers, Cairo,
June 2008.
11. Institute for Transportation & Development Policy (2010), A Paradigm Shift Towards Sustainable
Low-Carbon Transport: Financing the Vision ASAP. ITDP, New York, Aug. 2010.
12. International Monetary Fund (2008). Chapter 4: Climate Change and the Global Fuel Economy,
World Economic Outlook 2008. Retrieved from:
http://www.imf.org/external/pubs/ft/weo/2008/01/pdf/c4.pdf
13. Japan International Cooperation Agency (2002a), Urban Transport Policy and Strategy, CREATS
Phase I Final Report Vol. II: Transport Master Plan and Feasibility Study of Urban Transport
29
Projects in Greater Cairo Region in the Arab Republic of Egypt (Chapter 5). Cairo Regional Area
Transportation Study (CREATS) project, November 2002.
14. K.F. Mahmoud, S.C. Alfaro, O. Favez, M.M. Abdel Wahab, J. Sciare (2008): Origin of black carbon
concentration peaks in Cairo (Egypt), Journal of Atmospheric Research 89 (2008) 161–169.
15. Larrick, R. P., Soll, J. B. (2008): The MPG Illusion. Policy Forum, Vol. 320 no. 5883 pp. 1593-1594.
16. Litman T. (2012), Evaluating Public Transit Benefits and Costs: Best Practices Guidebook, Victoria
Transport Policy Institute, September 2012.
17. M.I. Khoder (2004): Ambient levels of volatile organic compounds in the atmosphere of Greater
Cairo, Air Pollution Research Department, National Research Centre, Dokki, Giza, Egypt Received
28 January 2006; received in revised form 8 July 2006; accepted 17 August 2006.
18. Ministry of Finance (2014): Customs. Retrieved from:
http://www.mof.gov.eg/mofgallerysource/english/new-tariff/customs.htm
19. Ministry of State for Environmental Affairs (2008): Chapter 1: Air Pollution, Annual Report 2007.
Retrieved from: http://www.eeaa.gov.eg/english/main/report_achivements2007.asp
20. Mowafi, S. (2012). Egypt Vehicle Scrapping and Recycling Program, Presentation at Global Fuel
Economy Initiative (GFEI) Africa regional workshop, October 15-16, 2012, Nairobi, Kenya.
Retrieved from:
http://www.unep.org/transport/pcfv/PDF/GFEI_AfricaLaunch/VehicleScrapping_Recycling.pdf
21. Sims, D (2010), City on the Move: A Complementary Informality? Understanding Cairo: The Logic
of a City Out of Control. Cairo: The American University in Cairo Press.
22. The Government of the Arab Republic of Egypt. 9 June 2008. Law #121 for the Year 2008
Concerning the Amendment of Select Traffic Law Articles Issued by Law #66 for the Year 1973.
Article 4, Paragraph 2.
23. The World Bank (2014): Country and Lending Groups, available at:
http://data.worldbank.org/about/country-and-lending-groups#Lower_middle_income, accessed:
December 16, 2014.
24. UNEP, 2011, Towards a Green Economy: Pathways to Sustainable Development and Poverty
Eradication, www.unep.org/greeneconomy, ISBN: 978-92-807-3143-9
25. United Nations Framework Convention for Climate Change (2009): Egypt Vehicle Scrapping and
Recycling Program, Version 1.0, Small-scale CDM programme of activities design document form,
retrieved from:
https://cdm.unfccc.int/ProgrammeOfActivities/poa_db/JMC6IEOPXNUSTA2Q78DFZ4GW9LHKV1/
view
26. USAID (2004): The Cairo Air Improvement Project -Helping Millions Live Healthier Lives, Final
Report, Prepared by Chemonics International Inc., March 2004, available at:

30
http://www.chemonics.com/pv_obj_cache/pv_obj_id_3BD1282E054B3A0286A182C521F1E35BC
F651500/filename/Cairo%20Air%20Improvement.pdf
27. USAID 2004: The Cairo Air Improvement Project: Helping Millions Live Healthier Lives, Final
Report, USAID, March 2004.
28. World DataBank (2014): World Development Indicators, 2013 data, retrieved from:
http://databank.worldbank.org , accessed: December 16 , 2014.
29. World Bank (2014): Country and Lending Groups. Retreived from:
http://data.worldbank.org/about/country-and-lending-groups
30. GIZ (2014): International Fuel Prices 2012/2013, 8th edition. Retrieved from:
http://www.giz.de/expertise/downloads/giz2014-en-international-fuel-prices-2013.pdf
31
ANNEX-1: GFEI CLASSIFICATION OF LDVS
Vehicle Segment Examples
A: Mini / Micro / Small town car
Smallest cars, with a length between 2.50m to 3.60m.
Citroën C1
Fiat Panda
Smart Fortwo
B: Small compact
Slightly more powerful than the Minis; still primarily for urban
use; length between 3.60m and 4.05m
Mitsubishi Colt
Opel Corsa
Suzuki Swift
C: Compact
Length between 4.05m – 4.50m
Mazda 3
SubaruImpreza
Volvo S40
D: Family cars
Designed for longer distance; fits 5- 6 people; length is 4.50m to
4.80m
BMW 3 series
Chrysler Sebring
Lexus IS
Light vans
Size is similar to D, but interior volume is maximized to
accommodate larger families
Chevrolet Uplander
Ford Galaxy
Volkswagen Sharan
Big / Full size cars
Have generous leg room; can comfortably transport 5 - 6 people;
generally have
V8 engines and are 5m or longer in length
Cadillac DTS
Jaguar XJ
Mercedes-Benz E Class
SUV / All terrain
The original cars were utility cross-country vehicles with integral
transmissions like the Jeep
Dodge Durango
Jeep Grand Cherokee
Nissan Patrol
Toyota Land Cruiser

32
ANNEX-2: SAMPLE OF LDV DATA
Brand Model Engine Size (l) Manuf yr. Origin 2005 sales 2008 sales 2010 sales 2012 sales
HYUNDAI Verna 1.6 1.6 2005 CKD 1223 19677 22020 21277
HYUNDAI NEW ELANTRA 1.6 2012 CBU 0 0 0 11024
Chevrolet LANOS 1.5 2008 CKD 0 1416 17011 10878
Chevrolet AVEO 1.4 2005 CBU 1316 1178 1996 9177
RENAULT LOGAN SEDAN 1.6 2008 CBU 0 0 6230 6002
HYUNDAI Accent RB 1.6 2012 CBU 0 0 5879
KIA New Carens 1.6 2008 CBU 0 0 8063 5236
KIA New Cerato 1.6 2008 CBU 0 0 8703 5147
MITSUBISHI LANCER 1.6 2005 CBU 3336 5027 859 5045
SKODA Oct. Fantasia 1.6 2008 CBU 0 0 4705 4643
TOYOTA COROLLA NG 1.6 2008 CBU 0 4908 2256 4591
KIA New Sportage 1.6L 1.6 2010 CBU 0 0 0 3327
KIA New Rio 1.4 2012 CBU 0 0 0 3163
Chevrolet OPTRA 1.6 2005 CBU 2537 11848 7103 2837
KIA New Picanto 1.2 2010 CBU 2794
RENAULT SANDERO H/B 1.6 2010 CBU 0 0 216 2693
SPERANZA Tiggo 1.6 2008 CKD 0 0 3947 2511
SPERANZA A113 1.3 2008 CKD 0 3676 3041 2177
SUZUKI M800 Maruti 0.85 2005 CBU 932 5855 2528 2000
HYUNDAI i10 1.1 2008 CBU 2258 1929 1910
DAIHATSU TERIOS 1.5 2005 CBU 0 2244 2072 1620
RENAULT FLUENCE 1.6 2010 CBU 0 0 1799 1608
VW PASSAT TSI 1.4 2010 CBU 0 0 1519 1328
JEEP CHEROKEE 2.4 2005 CKD 0 0 0 784
PEUGEOT 508 1.6 2012 CBU 0 0 0 773
Top Related