


![Untitled-1 [] Company... · 2018. 1. 16. · Smad Construction Smad Sm Smad Construction mad Construction nstruction MAD Smad Construction MAD' Smad Construction MAD Smad Construction](https://static.fdocuments.in/doc/165x107/60b16e4aa21c90011033e8c0/untitled-1-company-2018-1-16-smad-construction-smad-sm-smad-construction.jpg)


Languages
Pages
Legal


FRONTIER TECHNOLOGIES IN DESIGN AND CONSTRUCTION FOR SUSTAINABLE TRANSPORT
INFRASTRUCTURE
Buddhima Indraratna,
Professor of Civil Engineering, and Director, Centre for Geomechanics & Railway Engineering
University of Wollongong, Australia
(email: [email protected])
Sanjay Nimbalkar,
Research Fellow, Centre for Geomechanics and Railway Engineering
University of Wollongong, Australia
(email: [email protected])
Cholachat Rujikiatkamjorn,
Senior Lecturer, Centre for Geomechanics and Railway Engineering
University of Wollongong, Australia
(email: [email protected])
Abstract
Railways are expected to be one of the main modes of future transport in rapidly developing
countries with high population densities, including Sri Lanka. In spite of recent advances in rail
track geotechnology, ballasted tracks progressively degrade under heavy cyclic and impact
loading. Field studies often provide significant knowledge to better understand track
performance and to extend the current state-of-the-art in design. Therefore, comprehensive
field trials were carried out on two instrumented rail tracks in Bulli and in Singleton, New
South Wales, Australia. In these studies, several track sections were reinforced with different
types of geosynthetics placed beneath the ballast embankment, with the aim of reducing track
settlement, increasing track resiliency, and decreasing ballast degradation. The effects of
impact loads and its mitigation using shock mats are discussed. A series of isotropically
consolidated drained triaxial tests were conducted on both clean and clay-fouled ballast with
varying fouling levels to establish the relationship between the extent of fouling and the
associated strength-deformation properties. The outcomes of this research are now elucidated
in view of industry practices. This keynote paper provides a fresh insight to design and
performance of rail tracks capturing particle degradation, fouling and the use of geosynthetics
in track design.
Keywords: Ballast, Degradation, Impact Loads, Fouling, Geosynthetics
1. Introduction
Rail Transport in Sri Lanka and Australia consists of a heavy rail network serving commuter
and freight traffic. There is a great potential for expanding the freight rail system, but
increasing the traffic tonnages and speed are limited by the conditions of the track and
maintenance costs associated with its subsequent degradation. The large lateral deformations of
ballast due to insufficient track confinement, fouling of ballast by coal from freight trains,
unstable soft formation soils (clay pumping), ballast breakage under cyclic and impact loads are
the primary causes of track deterioration. The complexities associated with the ballast are
attributed to the effects of angularity, anisotropy, particle degradation, and in-situ confining
pressure (Marshal, 1973; Indraratna et al., 1998, 2005, 2010a; Lackenby et al., 2007; Altuhafi
and Coop, 2011), as well as the frequency of loading (Luo et al., 1996; Indraratna et al., 2011a;
Nimbalkar et al. 2012a). Under cyclic loads, the cyclic densification of ballast and associated
rail track deformations are important for the optimum design, safety, and operational efficiency
of tracks.
Recently, few studies dealing with the adverse effects of fouling on the shear behaviour of
ballast have been conducted (Tutumluer et al., 2008; Indraratna et al., 2012). When ballast is
fouled by particle breakage or infiltration of coal or clay fines, the interlocking and frictional
resistance reduces as fine particles clog the ballast voids. When the amount of fouling materials
is excessive, fine particles can dominate the ballast behaviour and ultimately make the track
unstable. The problem becomes more severe under impact loading that causes accelerated
breakage of ballast, especially when the underlying formation soil is stiff. The amplitude and
frequency of impact loads depend on the nature of wheel or rail irregularities as well as on the
dynamic response of the rail track (Jenkins et al., 1974; Indraratna et al., 2011a). Installation of
shock mats in rail tracks can attenuate these impact loads substantially.
The potential use of geosynthetics to improve track stability has been observed in several
laboratory studies (Selig and Waters, 1994; Raymond, 2002; Indraratna and Salim, 2003;
Indraratna and Nimbalkar, 2012). However, only a few studies have assessed the relative merits
of geosynthetics and shock mats under in situ track conditions, while the in-situ performance of
different types of geosynthetics to improve the overall stability of ballasted rail tracks has not
been investigated in a systematic manner. Two extensive field studies are elaborated including
the Bulli and Singleton sites where performances of various track sections were enhanced by
synthetic grids and shock mats. This keynote paper describes the large-scale laboratory studies
and full-scale field trials those advance the current state of the art knowledge in the
geotechnical behaviour of ballast, including shear strength, particle breakage, ballast fouling
and benefits of using geosynthetic grids and shock mats.

2. Extending the current state of the art
2.1 Ballast breakage
Railway tracks are severely affected by the degradation of ballast particles due to conventional
cyclic and occasional high impact loads (Indraratna et al., 2011a,b). The particle breakage is a
complex mechanism that usually starts at the inter-particle contacts (i.e. breakage of asperities),
followed by a complete crushing of weaker particles under further loading. The breakage of
ballast particles due to wheel loading can occur in three ways: (a) the breakage of particles into
approximately equal pieces (particle splitting), (b) the breakage of angular projections and (c)
the grinding off of small-scale asperities (Raymond and Diyaljee, 1979). Lackenby et al. (2007)
showed that most ballast breakage is not attributable to particle splitting, but is instead
primarily the consequence of the corner breakage. Indraratna et al. (2005) introduced a new
Ballast Breakage Index (BBI) which is obtained on the basis of changes in the fraction passing a
range of sieves, as shown in Figure 1. BBI can be calculated using the following equation.
ABBI
A B (1)
where A is shift in the Particle Size Distribution (PSD) curve after the test, and B is the
potential breakage or area between the arbitrary boundary of maximum breakage and the final
particle size distribution. BBI has a lower limit of 0 (no breakage) and an upper limit of 1
(maximum breakage defined by an arbitrary boundary).
Figure 1: Ballast breakage index (BBI) calculation
method (data sourced from Indraratna et al., 2005)
Figure 2: Effect of confining pressure on
particle degradation (data sourced from
Lackenby et al., 2007)
0 50 100 150 200 250
Effective Confining Pressure (kPa)
0
0.02
0.04
0.06
Ba
llast B
rea
kag
e I
nd
ex, B
BI
qmax = 500 kPa
qmax = 230 kPa
(I) (II) (III)0 10 20 30 40 50 60 70
0.0
0.2
0.4
0.6
0.8
1.0
2.36 mm
Fra
ctio
n P
assi
ng
(b
y w
eig
ht)
Particle (Sieve) Size (mm)
A = Shift in PSD
B = Potential breakage
Initial PSD
Final PSD
PSD = Particle size distribution
d95i
= d95
of maximum sieve size
Arb
itary
boundar
y of m
axim
um b
reak
age
dmax
d95i

2.2 Confining pressure
Although the effect of confining pressure is significant, it is usually neglected in conventional
design of the rail track. A series of cyclic triaxial tests were conducted to investigate the effect
of confining pressure on ballast under cyclic loading (Lackenby et al., 2007). Specimens were
prepared to the recommended gradation and initial porosity (i.e. d50 = 38.5 mm, Cu = 1.54, eo =
0.76 where d50 is the diameter of the ballast corresponding to 50% finer in the particle size
distribution curve, Cu is the coefficient of uniformity and e0 is initial void ratio). Effective
confining pressures ( 3 ) ranging from 1 to 240 kPa were applied. As shown in Figure 2, the
degradation of ballast under cyclic loading is categorised into three distinct zones, namely: (I)
the Dilatant Unstable Degradation Zone (DUDZ), (II) the Optimum Degradation Zone (ODZ),
and (III) the Compressive Stable Degradation Zone (CSDZ). These zones are defined by the
magnitude of confining pressure ( 3 ) applied to the specimen (i.e. DUDZ: 3 < 30 kPa, ODZ:
30 kPa < 3 < 75 kPa, CSDZ: 3 > 75 kPa). The maximum deviator stress magnitude (qmax,cyc =
1 max - 3 ) and static peak deviator stress (qpeak,sta) also plays an important role in characterising
these degradation zones.
2.3 Ballast fouling
Ballast generally comprises of highly coarse-graded gravel-size particles, such as crushed or
fractured rock or aggregates with sizes ranging from 10 mm to 63 mm and contains large void
spaces. However, the infiltration of fouling materials reduces the void and restricts track
drainage. The crushed rock fines (due to particle breakage), coal fines (due to spillage from
coal wagons) and clay-silt fines (due to pumping of soft saturated subgrade) accumulate within
the voids of the ballast bed and impair track drainage. For instance, excessive fouling due to
coal and subgrade fines has lead to the formation of mud holes in the Goonyella System located
in Central Queensland of Australia as shown in Figure 3. Several fouling indices are used in
practice to measure the extent of ballast fouling. Selig and Waters (1994) have defined the
fouling index as a summation of percentage (by weight) passing the 4.75 mm (No. 4) sieve and
0.075 mm (No. 200) sieve. They also proposed a percentage of fouling which is the ratio of the
dry weight of fouled material passing through a 9.5 mm (3/8 inch) sieve to the dry weight of the
total sample. These mass based indices give a false measurement of fouling when the fouling
material has a different specific gravity. Feldman and Nissen (2002) defined the Percentage
Void Contamination (PVC) as the ratio of bulk volume of fouling material to the volume of
voids of clean ballast. However, this PVC does not consider the effect of the void ratio,
gradation and specific gravity of the fouling material, which is the main factor affecting ballast
drainage. Therefore, Void Contaminant Index (VCI) is proposed to incorporate these effects
(Indraratna et al., 2010b):
1100
f fsb
b sf b
( e ) MGVCI
e G M (2)
where eb is the void ratio of clean ballast, ef is the void ratio of fouling material, Gsb is the
specific gravity of the ballast material, Gsf is the specific gravity of the fouling material, Mb is
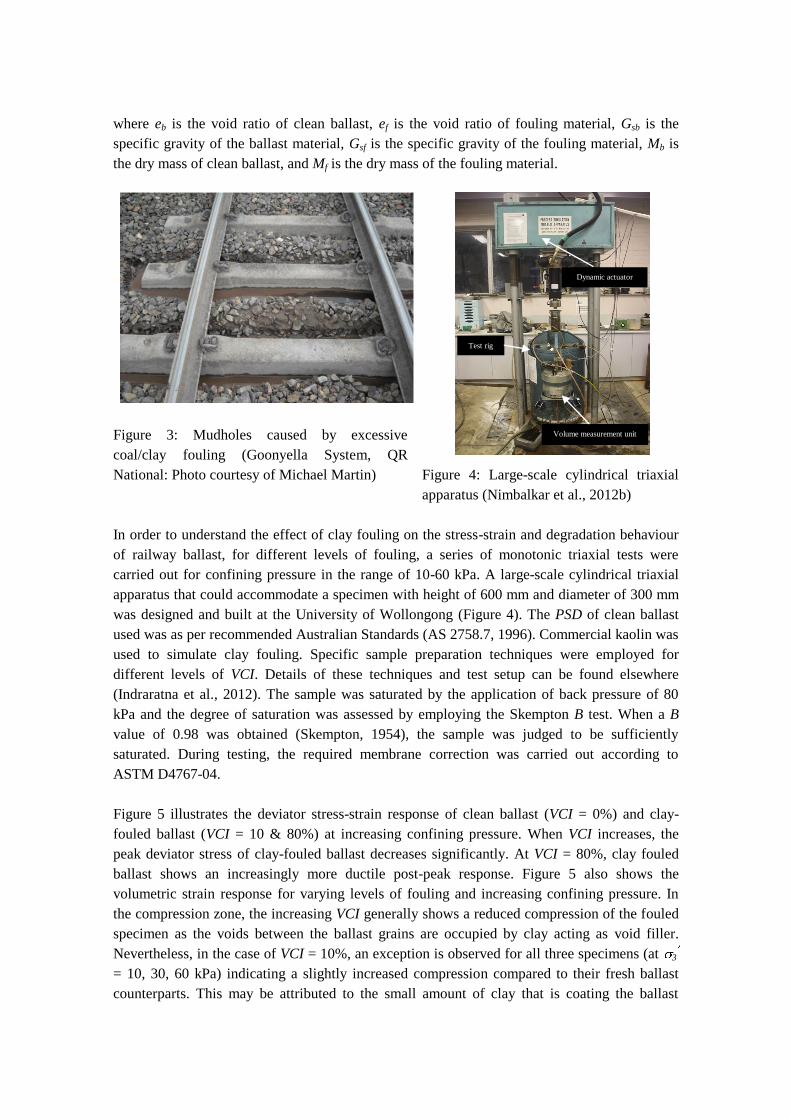
the dry mass of clean ballast, and Mf is the dry mass of the fouling material.
Figure 3: Mudholes caused by excessive
coal/clay fouling (Goonyella System, QR
National: Photo courtesy of Michael Martin)
Figure 4: Large-scale cylindrical triaxial
apparatus (Nimbalkar et al., 2012b)
In order to understand the effect of clay fouling on the stress-strain and degradation behaviour
of railway ballast, for different levels of fouling, a series of monotonic triaxial tests were
carried out for confining pressure in the range of 10-60 kPa. A large-scale cylindrical triaxial
apparatus that could accommodate a specimen with height of 600 mm and diameter of 300 mm
was designed and built at the University of Wollongong (Figure 4). The PSD of clean ballast
used was as per recommended Australian Standards (AS 2758.7, 1996). Commercial kaolin was
used to simulate clay fouling. Specific sample preparation techniques were employed for
different levels of VCI. Details of these techniques and test setup can be found elsewhere
(Indraratna et al., 2012). The sample was saturated by the application of back pressure of 80
kPa and the degree of saturation was assessed by employing the Skempton B test. When a B
value of 0.98 was obtained (Skempton, 1954), the sample was judged to be sufficiently
saturated. During testing, the required membrane correction was carried out according to
ASTM D4767-04.
Figure 5 illustrates the deviator stress-strain response of clean ballast (VCI = 0%) and clay-
fouled ballast (VCI = 10 & 80%) at increasing confining pressure. When VCI increases, the
peak deviator stress of clay-fouled ballast decreases significantly. At VCI = 80%, clay fouled
ballast shows an increasingly more ductile post-peak response. Figure 5 also shows the
volumetric strain response for varying levels of fouling and increasing confining pressure. In
the compression zone, the increasing VCI generally shows a reduced compression of the fouled
specimen as the voids between the ballast grains are occupied by clay acting as void filler.
Nevertheless, in the case of VCI = 10%, an exception is observed for all three specimens (at 3
= 10, 30, 60 kPa) indicating a slightly increased compression compared to their fresh ballast
counterparts. This may be attributed to the small amount of clay that is coating the ballast
Dynamic actuator
Test rig
Volume measurement unit

grains as a lubricant, thereby facilitating the specimens to attain a slightly higher compression.
In the dilation zone, the highly fouled specimens show a decrease in the rate and magnitude of
dilation at axial strains exceeding @ 20%, while the increase in 3 from 10 to 60 kPa
significantly suppresses dilation of all specimens. The addition of kaolin in sufficient quantities
appears to contribute to a „binding‟ effect that diminishes the tendency of the aggregates to
dilate. Moreover, the specimens that are highly fouled (VCI = 80%) begin to dilate swiftly at a
lower axial strain after showing a reduced compression initially compared to clean ballast.
0
100
200
300
400
500
De
via
tor
str
es
s,
q (
kP
a)
Vo
lum
etr
ic s
tra
in,
v (
%)
0% VCI
10% VCI
80% VCI
'3=10kPa
a'3=30kPa
b'3=60kPa
c
0 5 10 15 20 25 303
2
1
0
-1
-2
-3
-4
-5
-6
Axial strain, a (%)Axial strain,
a (%)Axial strain,
a (%)
0 5 10 15 20 25 30
0 5 10 15 20 25 30
Figure 5: Stress-strain behaviour of clean and clay-fouled ballast at confining pressures ( 3 ) of
(a) 10 kPa, and (b) 30 kPa, respectively (data sourced from Tennakoon et al., 2012)
A shear strength envelope for clay-fouled ballast can be presented in a non-dimensional form as
below:
'n
f n
c c
m (3)
where f, n and c are shear stress, effective normal stress and uniaxial compressive strength
of the parent rock. m and n are empirical coefficients and their values are obtained by best fit
(regression) analysis using equations (4) and (5) respectively:
m = 0.07[1 + tanh(VCI/21.5)] (4)
n = 0.56[1 + 0.3tanh(VCI/21.5)] (5)
For a given ballast gradation, if the appropriate reduced peak deviator stress is not carefully
selected on the basis of the anticipated fouling levels, this may over-predict the track bearing
capacity and stability. Therefore, an accurate assessment of behaviour of clay-fouled ballast is
highly beneficial for executing better maintenance schemes of existing tracks.
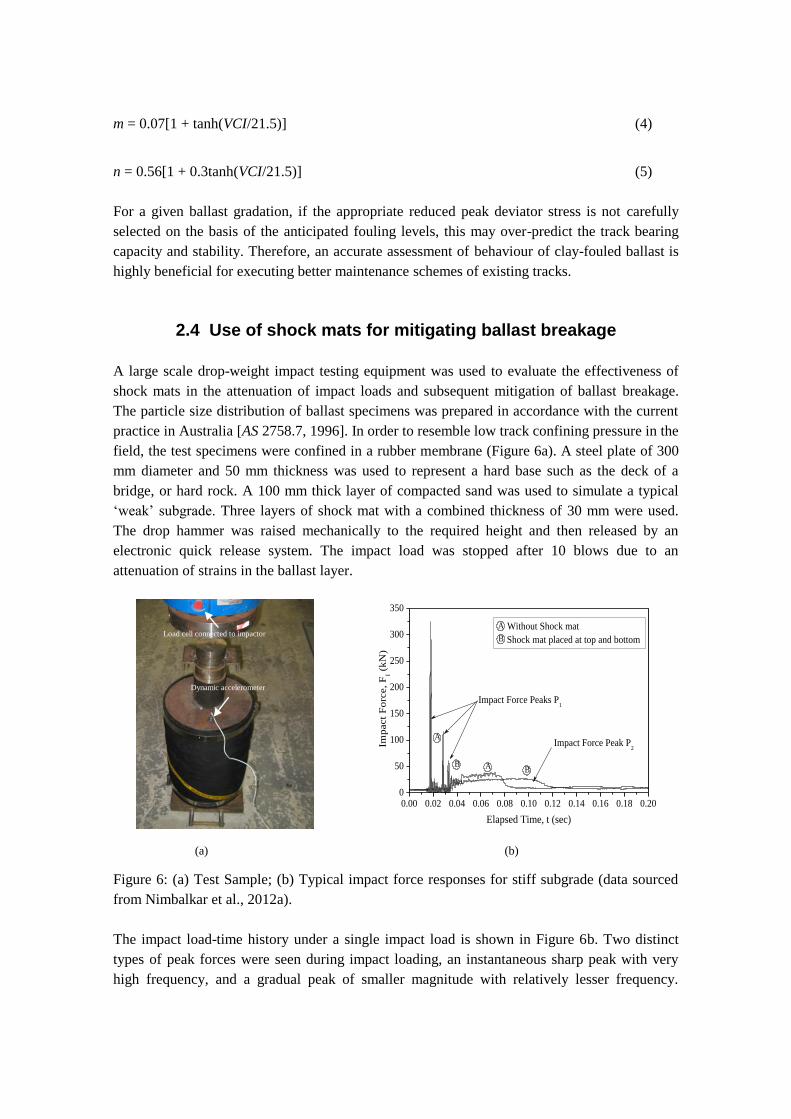
2.4 Use of shock mats for mitigating ballast breakage
A large scale drop-weight impact testing equipment was used to evaluate the effectiveness of
shock mats in the attenuation of impact loads and subsequent mitigation of ballast breakage.
The particle size distribution of ballast specimens was prepared in accordance with the current
practice in Australia [AS 2758.7, 1996]. In order to resemble low track confining pressure in the
field, the test specimens were confined in a rubber membrane (Figure 6a). A steel plate of 300
mm diameter and 50 mm thickness was used to represent a hard base such as the deck of a
bridge, or hard rock. A 100 mm thick layer of compacted sand was used to simulate a typical
„weak‟ subgrade. Three layers of shock mat with a combined thickness of 30 mm were used.
The drop hammer was raised mechanically to the required height and then released by an
electronic quick release system. The impact load was stopped after 10 blows due to an
attenuation of strains in the ballast layer.
(a)
(b)
Figure 6: (a) Test Sample; (b) Typical impact force responses for stiff subgrade (data sourced
from Nimbalkar et al., 2012a).
The impact load-time history under a single impact load is shown in Figure 6b. Two distinct
types of peak forces were seen during impact loading, an instantaneous sharp peak with very
high frequency, and a gradual peak of smaller magnitude with relatively lesser frequency.
0
50
100
150
200
250
300
350
0.00 0.02 0.04 0.06 0.08 0.10 0.12 0.14 0.16 0.18 0.20
Elapsed Time, t (sec)
Impact Force Peaks P1
Impact Force Peak P2Im
pact
Fo
rce,
FI (
kN
)
Without Shock mat
Shock mat placed at top and bottom
A
B
BB
A
A
Load cell connected to impactor
Dynamic accelerometer

Jenkins et al. (1974) termed these peak forces as P1 and P2 respectively. It was also evident that
multiple P1 type peaks followed by the distinct P2 type peak often occurred. The multiple P1
peaks occurred when the drop hammer was not restrained vertically, so that it rebounded after
the first impact and hit the specimen again. The observed benefits of a shock mat are therefore
twofold: (a) it attenuates the impact force and (b) it reduces the impulse frequencies thereby
extending the time duration of impact. After each test, the ballast sample was sieved and
breakage was obtained using BBI as shown in Table 1.
Table 1: Ballast breakage under impact loading (Indraratna et al., 2011a).
Test No. Base type Test Details BBI
1 Stiff Without shock mat 0.170
2 Stiff Shock mat at top and bottom of ballast 0.091
3 Weak Without shock mat 0.080
4 Weak Shock mat at top and bottom of ballast 0.028
The higher breakage of ballast particles can be attributed to the considerable non-uniform stress
concentrations occurring at the corners of the sharp angular particles of fresh ballast under high
impact induced contact stresses. The impact from just 10 blows caused considerable breakage
(i.e. BBI = 17%) when a stiff subgrade was used, but when a shock mat was placed above and
below the ballast bed, particle breakage was reduced by approximately 47% for a stiff subgrade
and approximately 65% for a weak subgrade. The weak subgrade itself acts as a flexible
cushion.
3. From theory to practice: use of geosynthetics and mats
3.1 Field study at Bulli
In order to investigate train induced stresses, track deformations, and the benefits of using
geosynthetics, a field trial was carried out on an instrumented track. The design specifications
were provided by University of Wollongong, while the funding was contributed by RailCorp.
Details of track construction and material specifications can be found in Indraratna et al.,
2010a.
3.1.1 Track instrumentation
The performance of each section of track under the repeated loads of moving trains was
monitored using sophisticated instrumentation. The vertical and horizontal stresses were
measured by pressure cells. Vertical deformations of the track at different sections were
measured by settlement pegs and lateral deformations were measured by electronic
displacement transducers connected to a computer controlled data acquisition system. The

settlement pegs and displacement transducers were installed at the top and bottom of load
bearing ballast layer, as shown in Figure 7.
Figure 7: Installation of settlement pegs and displacement transducers at Bulli site
3.1.2 Track measurements: stresses and deformations
Figure 8(a) shows the maximum cyclic vertical ( v) and horizontal ( h) stresses recorded at
Section 1 due to the passage of a coal train with 100-ton wagons (25 tons axle load). The
stresses were measured under the rail and at the edge of the sleeper. It is evident that v
decreases significantly with depth, while h decreases only marginally with depth. The large
vertical stress and relatively small lateral (confining) stress caused large shear strains in the
track.
(a) (b)
Figure 8: In-situ response of the ballast layer: (a) vertical stresses; (b) lateral deformations (data
sourced from Indraratna et al., 2010a).
Average lateral deformations of ballast are plotted against the number of load cycles (N) in
Figure 8(b). The recycled ballast showed less lateral deformations because of its moderately
graded particle size distribution (Cu = 1.8) compared to the very uniform fresh ballast (Cu =
0 1x10⁵
2x10⁵
3x10⁵
4x10⁵
5x10⁵
6x10⁵
7x10⁵
-14
-12
-10
-8
-6
-4
-2
-0
Av
era
ge l
ate
ral
defo
rmati
on
of
ball
ast
, (S
h) a
vg (
mm
)
Fresh ballast (uniformly graded)
Recycled ballast (broadly graded)
Fresh ballast with geocomposite
Recycled ballast with geocomposite
Number of load cycles, N
450
300
150
00 50 100 150 200 250 300 350 400
Maximum cyclic stresses under rail, v ,
h (kPa)
Dep
th b
elo
w b
ase
of
sleep
er,
z (
mm
)
v
h
N = 9.1 X 10⁵
SU
BB
AL
LA
ST
BA
LL
AS
T

1.5). Recycled ballast often has less breakage because the individual particles are less angular
which prevents corner breakage resulting from high contact stresses. The results presented in
Figure 8b indicate that geocomposite reduced lateral deformation of fresh ballast by about 49 %
and that of recycled ballast by 11 %. The apertures of the geogrid offered strong mechanical
interlocking with the ballast. The capacity of the ballast to distribute loads was improved by the
placement of the geocomposite layer, which substantially reduced settlement under high
repeated loading.
3.2 Field study at Singleton
To investigate the performance of different types of geosynthetics to improve overall track
stability under in situ conditions, an extensive study was undertaken on instrumented track
sections near Singleton, NSW, which were part of the Third Track of the Minimbah Bank Stage
1 Line. The details of track construction and material specifications can be found in Indraratna
et al., (2010a).
3.2.1 Track instrumentation
The strain gauges were installed in groups, 200 mm apart, and on the top and bottom sides of
the grids in both longitudinal and transverse directions (Figure 9a). The strain gauges were a
post yield type suitable to measure strains in the range of 0.1 to 15%. As shown in Figure 9b,
two pressure cells were installed at Sections 1, 6, A and C. At these locations, one pressure cell
was installed at the sleeper-ballast and another at the ballast-sub-ballast interface. At Section B
however, three pressure cells were installed at the synthetic mat-deck interface. Settlement pegs
were also installed at the sleeper-ballast and ballast-sub-ballast interfaces to measure vertical
deformations of the ballast layer, as shown in Figure 9c.
3.2.2 Accumulated settlements of ballast layer
The settlements (Sv) and vertical strains ( v) of the ballast layer after 2.3 105 load cycles are
reported in Table 2. The vertical settlements of sections with reinforcement are generally
smaller than those without reinforcement. This phenomenon is mainly attributed to interlocking
between the ballast particles and grids, thus creating larger track confinement. When Sections
A, B, and C are compared, the results indicate that Sv and v are larger when the subgrade
stiffness becomes smaller, i.e. Sv are smallest on the concrete bridge deck and largest at the
alluvial deposit.
It is also observed that geogrid is more effective in terms of reducing track settlement for softer
subgrades. Similar observation was reported by Ashmawy and Bourdeau (1995) thorough full
scale prototype testing. Geogrid at Section 4 performed better, although the tensile strength
does not differ much with other types. This is attributed to optimum aperture size (40 mm)
which would enable better interlocking between the ballast particles and geogrid.

Figure 9: Details of track instrumentation using (a) strain gauges, (b) pressure cells and (c)
settlement pegs.
Table 2: Vertical settlements and strains of ballast layer after 2.3 105 load cycles.
Instrumented section details
1 2 3 4 5 6 A B C
Settlement Sv (mm) 16.3 21.2 20.6 14.8 16.0 16.3 23.8 8.8 17.8
Vertical strain v (%) 5.4 7.1 6.9 4.9 5.3 5.4 7.9 2.9 5.9
3.2.3 Strains accumulated in geogrids
Accumulated longitudinal ( l) and transverse ( t) strains after 2.3 105 load cycles are given in
Table 3. The transverse strains were generally larger than longitudinal strains, which is
attributed to the relative ease for lateral spreading of the ballast. It was also observed that l and
t are mainly influenced by deformations of the subgrade. The strains of geogrid at Section 5
were relatively large although its higher stiffness could have resulted in smaller strains. This is
because the thick general fill underwent large lateral deformations shortly after the track was
commissioned. Induced transient strains in both longitudinal and transverse directions due
to the passage of trains (axial load of 30 tons) travelling at 40 km/h were of magnitude 0.14-
0.17 %.

Table 3: Accumulated longitudinal and transverse strains in geogrid after 2.3 105 load cycles.
Instrumented section details
1 2 3 4 5 6
Longitudinal strain l (%) 0.80 0.78 0.92 0.61 0.60 0.62
Transverse strain t (%) 0.85 1.50 0.85 0.80 1.80 0.85
4. Conclusions and recommendations
Effects of ballast fouling, geosynthetic reinforcement and shock mats on the performance of
ballasted rail tracks are discussed in this keynote paper. The results highlight that particle
breakage, confining pressure, ballast fouling in addition to loading patterns (cyclic and impact)
have a significant influence on the engineering behaviour of ballast.
The detrimental effects of fouling on the shear strength characteristics were assessed using a
new parameter, VCI. A series of isotropically consolidated drained monotonic triaxial tests
using a large scale cylindrical triaxial apparatus were conducted on clay-fouled ballast. The
shear strength envelope for clay-fouled ballast was expressed as a function of VCI. The use of
shock mats was beneficial in terms of reduced ballast breakage and attenuated impact forces.
Few impact blows caused the considerable ballast breakage (BBI = 17%) in case of stiff
subgrade. Due to placement of shock mat, BBI was reduced by approximately 47% using a stiff
subgrade and by approximately 65% for a weak subgrade.
The performance of instrumented ballasted tracks at Bulli and Singleton was evaluated where
different types of geosynthetics were used. The results of the Bulli field study indicated that the
use of geocomposites as reinforcing elements for tracks using recycled ballast proved to be a
feasible alternative. The results of the Singleton study revealed that the effectiveness of
geogrids is more for relatively weak subgrade. The strains accumulated in geogrids were
influenced by deformation of the subgrade, while the induced transient strains were mainly
affected by the stiffness of geogrids. A better understanding of such a performance would allow
for safer and more effective design and analysis of ballasted rail tracks with geosynthetic
reinforcement and shock mats.
Acknowledgement
The Author wishes to thank the Australian Research Council, CRC for Rail Innovation,
RailCorp, ARTC and Queensland Rail National for their continuous support. The financial
support by CRC for Rail Innovation through grants R3.106 & R3.117 is gratefully
acknowledged. A number of current and past PhD students, namely Dr Joanne Lackenby, Dr
Wadud Salim, research fellow Miss Nayoma Tennakoon and Dr Pongpipat Anantanasakul have
participated to the contents of this paper and their contributions are greatly acknowledged.

References
Altuhafi F and Coop M R (2011) “Changes to particle characteristics associated with the
compression of sands.” Géotechnique 61(6): 459-471.
Ashmawy A K and Bourdeau P L (1995) “Geosynthetic-reinforced soils under repeated
loading: a review and comparative design study.” Geosynthetics International 2(4): 643-678.
Feldman F and Nissen D (2002) “Alternative testing method for the measurement of ballast
fouling: percentage void contamination.” Conference on Railway Engineering Wollongong,
RTSA, 101-109.
Indraratna B and Salim W (2003) “Deformation and degradation mechanics of recycled ballast-
stabilised with geosynthetics.” Soils and Foundations 43(4): 35-46.
Indraratna B, Ionescu D and Christie D (1998) “Shear behaviour of railway ballast based on
large-scale triaxial tests.” Journal of Geotechnical and Geoenvironmental Engineering ASCE
124(5): 439-439.
Indraratna B, Nimbalkar S, Christie D, Rujikiatkamjorn C and Vinod J S (2010a) “Field
assessment of the performance of a ballasted rail track with and without geosynthetics.”
Journal of Geotechnical and Geoenvironmental Engineering ASCE 136(7): 907-917.
Indraratna B, Salim W and Rujikiatkamjorn, C (2011a) Advanced Rail Geotechnology –
Ballasted Track CRC Press/Balkema.
Indraratna B and Nimbalkar S (2012) “Stress-strain-degradation response of railway ballast
stabilised with geosynthetics.” Journal of Geotechnical and Geoenvironmental Engineering
ASCE (accepted, in press).
Indraratna B, Lackenby J and Christie D (2005) “Effect of confining pressure on the
degradation of ballast under cyclic loading.” Géotechnique 55(4): 325-328.
Indraratna B, Nimbalkar S and Tennakoon N (2010b) “The behaviour of ballasted track
foundations: track drainage and geosynthetic reinforcement.” GeoFlorida 2010, ASCE Annual
GI Conference, February 20-24, 2010, West Palm Beach, Florida, USA: 2378-2387.
Indraratna B, Nimbalkar S, Rujikiatkamjorn C and Christie D (2011b) “State-of-the-art design
aspects of ballasted rail tracks incorporating particle breakage, role of confining pressure and
geosynthetic reinforcement.” Proceedings of 9th World Congress on Railway Research WCRR
2011, Lille, France: 1-13.
Indraratna B, Tennakoon N, Nimbalkar S and Rujikiatkamjorn C (2012). “Behaviour of clay
fouled ballast under drained triaxial testing.” Géotechnique (accepted, in press).
Jenkins H M, Stephenson J E, Clayton G A, Morland J W and Lyon D (1974) “The effect of
track and vehicle parameters on wheel/rail vertical dynamic forces.” Railway Engineering
Journal 3: 2-16.
Lackenby J, Indraratna B, McDowel G and Christie D (2007) “Effect of confining pressure on
ballast degradation and deformation under cyclic triaxial loading.” Géotechnique 57(6): 527-
536.
Luo Y, Yin H and Hua C (1996) “Dynamic response of railway ballast to the action of trains
moving at different speeds.” Proceedings of the Institution of Mechanical Engineers, Part F:
Journal of Rail and Rapid Transit 210(2): 95-101.
Marsal R J (1973) Mechanical properties of rock fill In: Hirschfield R. C. and Pools, S. J. (eds)
Embankment Dam Engineering: Casagrande Volume, Wiley, New York: 109-200.
Nimbalkar S, Indraratna B, Dash S K and Christie D (2012a) “Improved performance of
railway ballast under impact loads using shock mats.” Journal of Geotechnical and
Geoenvironmental Engineering ASCE 138(3): 281-294.
Nimbalkar S, Indraratna B, Rujikiatkamjorn C and Martin M (2012b) “Effect of coal fines on
the shear strength and deformation characteristics of ballast.” Proceedings of the 11th Australia
- New Zealand Conference on Geomechanics: Ground Engineering in a Changing World, ANZ
2012, 15-18 July 2012, Melbourne, Australia: 451-456.
Raymond G P and Diyaljee V A (1979) “Railroad ballast load ranking classification.” Journal
of Geotechnical Engineering ASCE 105(10): 1133-1153.
Raymond G P (2002) “Reinforced ballast behaviour subjected to repeated load.” Geotextiles
and Geomembranes 20(1): 39-61.
Selig E T and Waters J M (1994) Track Geotechnology and Substructure Management Thomas
Telford, London.
Skempton A W (1954) “The pore pressure coefficients A and B.” Géotechnique 4(4): 143-147.
Tennakoon N, Indraratna B, Nimbalkar S and Rujikiatkamjorn C (2012) “Deformation and
degradation of clay fouled ballast subjected to monotonic loading.” Proceedings of the
International Conference on Ground Improvement and Ground Control ICGI 2012, 30 Oct.-2
Nov. 2012, University of Wollongong, Australia (accepted, in press).
Tutumluer E, Dombrow W and Huang H (2008) “Laboratory characterization of coal dust
fouled ballast.” Proceedings of the AREMA 2008 Annual Conference and Exposition, 21-24
September 2008, Salt Lake City, Utah. American Railway Engineering and Maintenance-of-
Way Association, Lanham: 93-101.
Top Related