


Languages
Pages
Legal

From Graphs to Tables: The Design of Scalable Systems for Graph Analytics Joseph E. GonzalezPost-doc, UC Berkeley [email protected], GraphLab [email protected]
WWW’14 Workshop on Big Graph Mining
*These slides are best viewed in PowerPoint with animation.
Graphs are Central to Analytics
Raw Wikipedia
< / >< / >< / >XML
Hyperlinks PageRank Top 20 PagesTitle PR
TextTableTitle Body
Topic Model(LDA) Word Topics
Word
Topic
Editor GraphCommunityDetection
User Community
UserCom
.
Term-DocGraph
DiscussionTableUser Disc.
CommunityTopic
TopicCom
.

Update ranks in parallel
Iterate until convergence
Rank of user i Sum of
neighbors
3
PageRank: Identifying Leaders
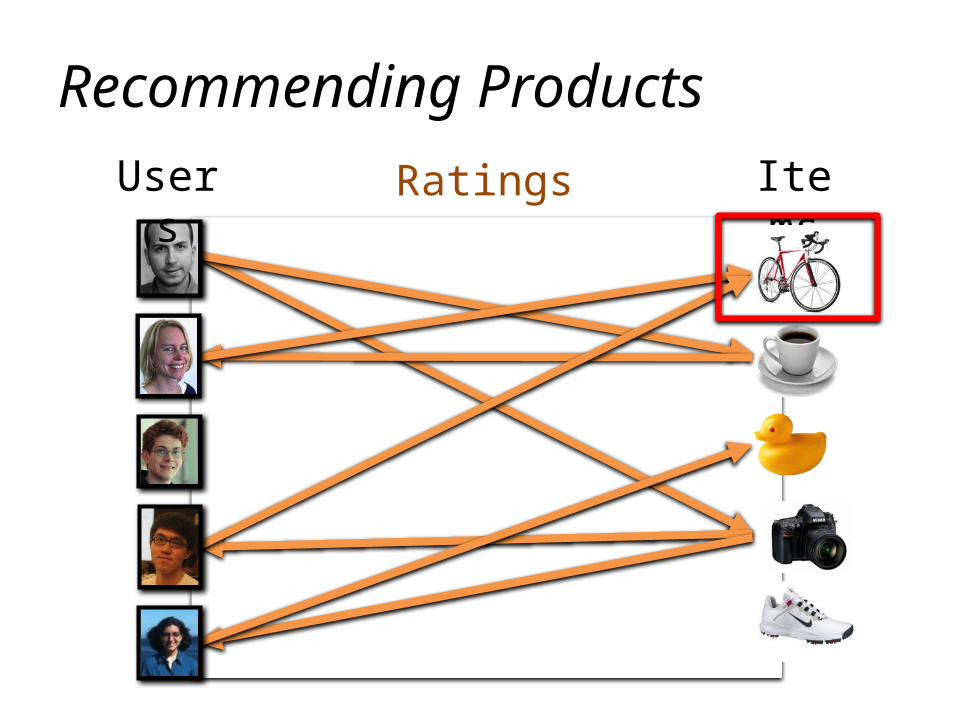
Ratings Items
Recommending ProductsUsers
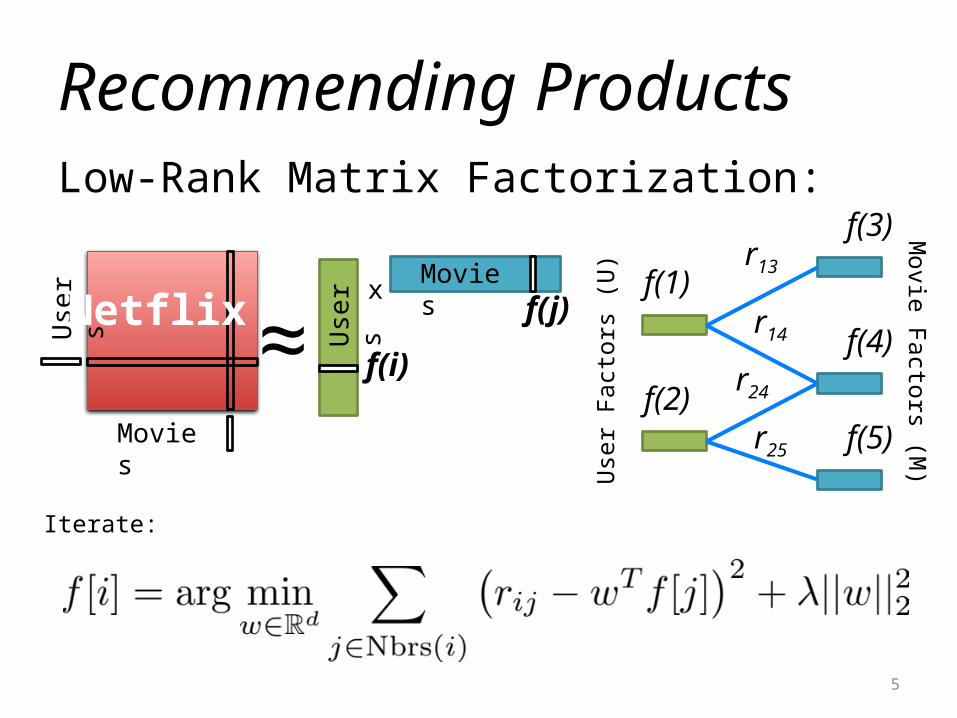
Low-Rank Matrix Factorization:
5
r13
r14
r24
r25
f(1)
f(2)
f(3)
f(4)
f(5)
Use
r Fa
ctors
(U
)
Movie
Facto
rs (M)
Use
rs
MoviesNetflix
Use
rs≈x
Movies
f(i)
f(j)
Iterate:
Recommending Products
LiberalConservati
ve
Post
Post
Post
Post
Post
Post
Post
Post
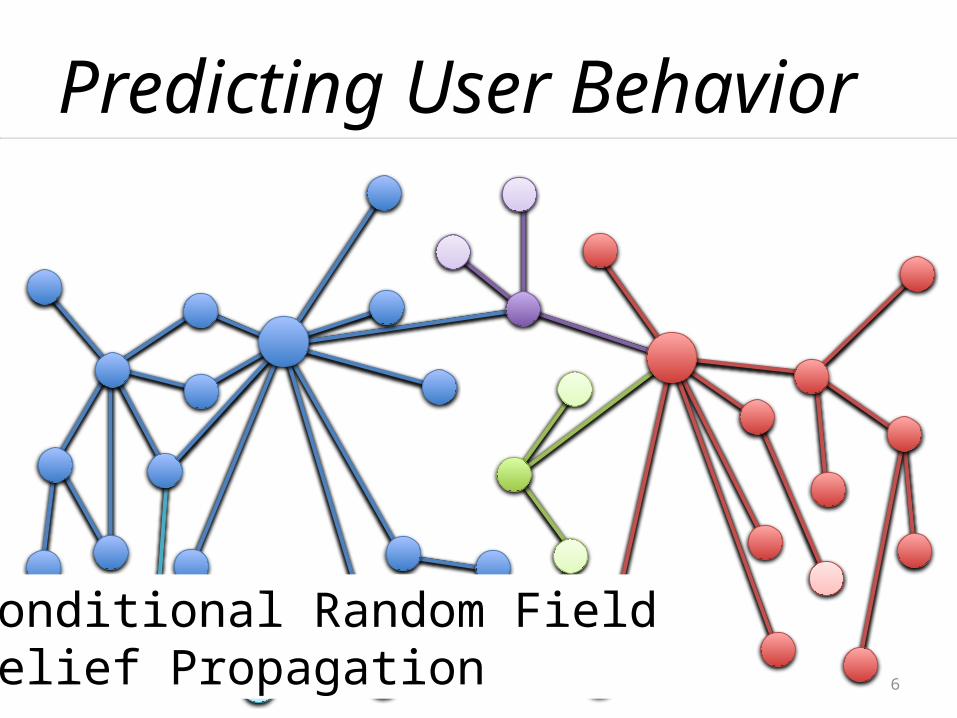
Predicting User Behavior
Post
Post
Post
Post
Post
Post
Post
Post
Post
Post
Post
Post
Post
Post
??
?
?
??
?
? ??
?
?
??
??
?
?
?
?
?
?
?
?
?
?
?
? ?
?
6
Conditional Random FieldBelief Propagation
Post
Post
Post
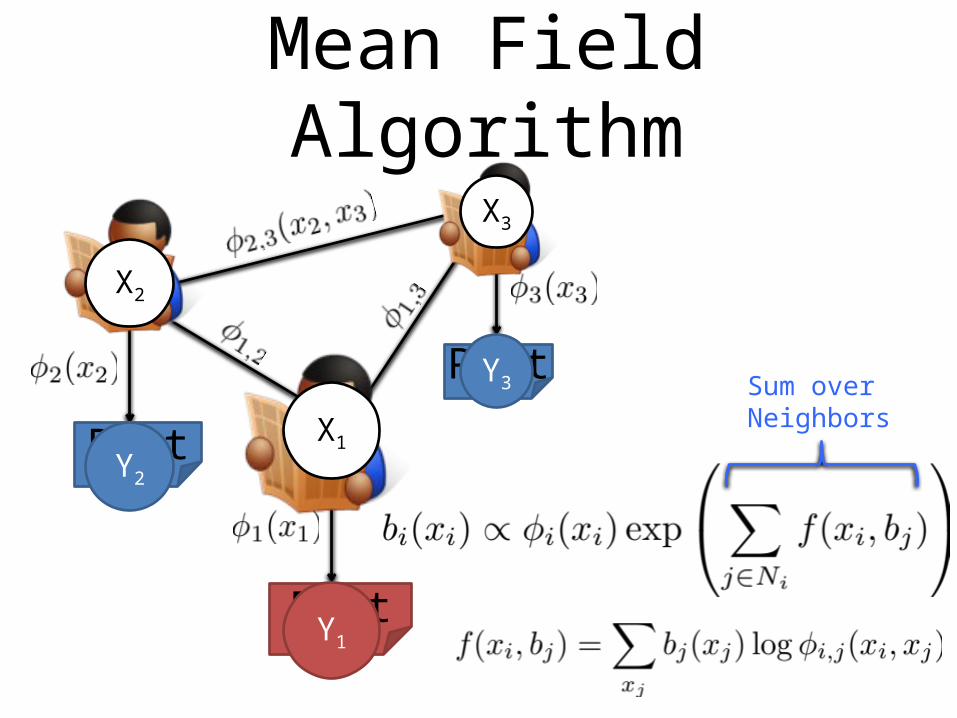
Mean Field Algorithm
Y2
Y1
Y3
X2
X3
X1
Sum over Neighbors
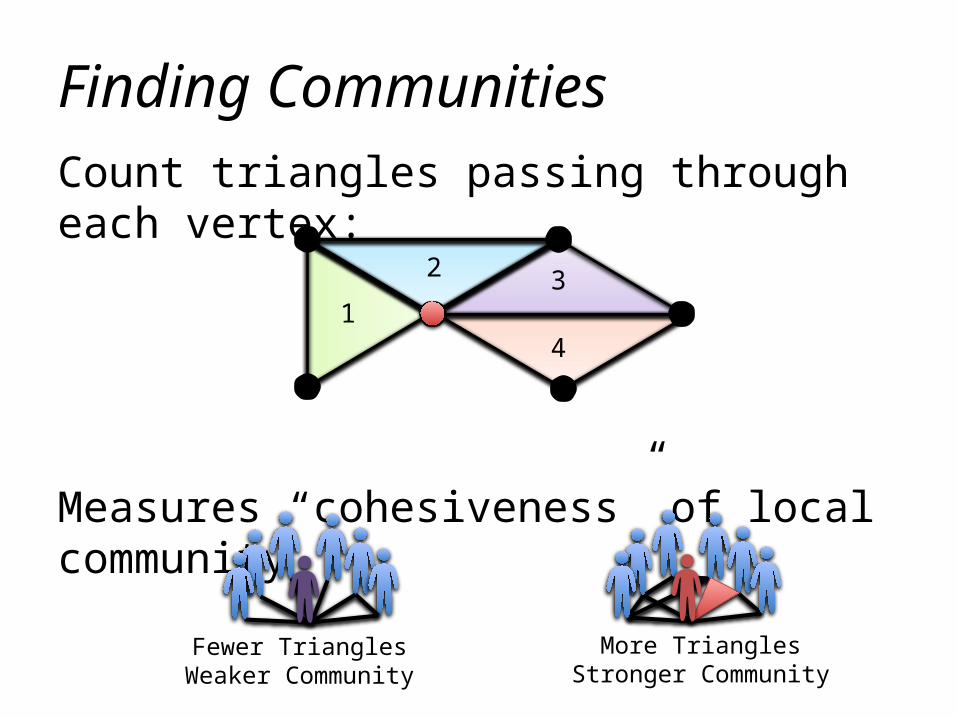
Count triangles passing through each vertex:
Measures “cohesiveness” of local community
More TrianglesStronger Community
Fewer TrianglesWeaker Community
1
2 3
4
Finding Communities

The Graph-Parallel Pattern
9
Model / Alg. State
Computation depends only on the
neighbors

Many Graph-Parallel Algorithms
• Collaborative Filtering– Alternating Least
Squares– Stochastic Gradient
Descent– Tensor Factorization
• Structured Prediction– Loopy Belief
Propagation– Max-Product Linear
Programs– Gibbs Sampling
• Semi-supervised ML
– Graph SSL – CoEM
• Community Detection– Triangle-Counting– K-core Decomposition– K-Truss
• Graph Analytics– PageRank– Personalized PageRank– Shortest Path– Graph Coloring
• Classification– Neural Networks
10

Graph-Parallel Systems
11
Pregel
Expose specialized APIs to simplify
graph programming.
12
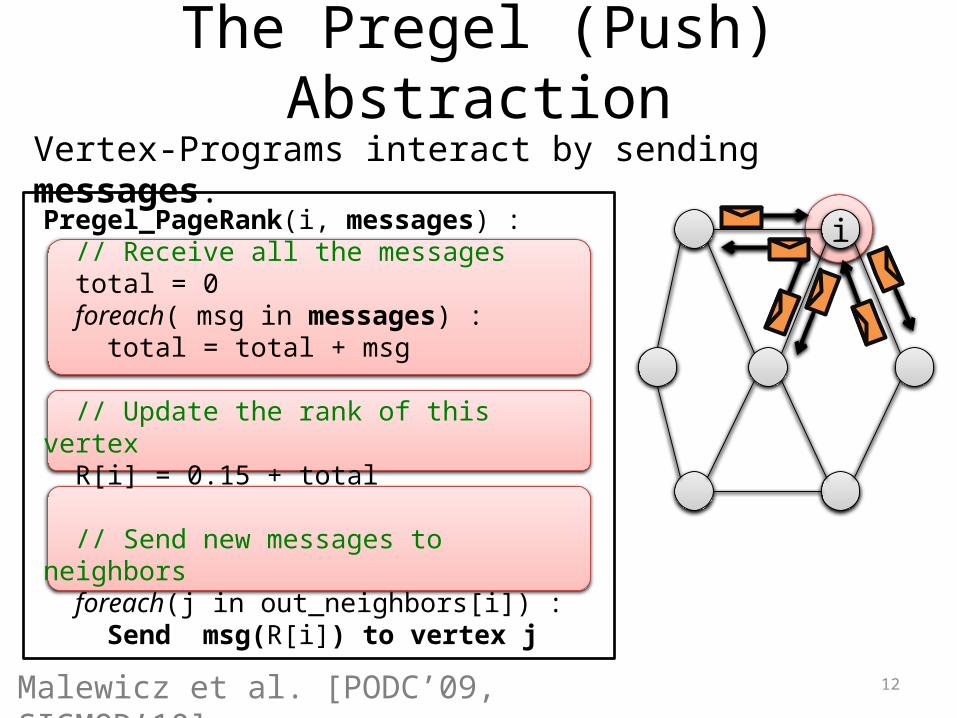
The Pregel (Push) Abstraction
Vertex-Programs interact by sending messages.
iPregel_PageRank(i, messages) : // Receive all the messages total = 0 foreach( msg in messages) : total = total + msg
// Update the rank of this vertex R[i] = 0.15 + total
// Send new messages to neighbors foreach(j in out_neighbors[i]) : Send msg(R[i]) to vertex j
Malewicz et al. [PODC’09, SIGMOD’10]
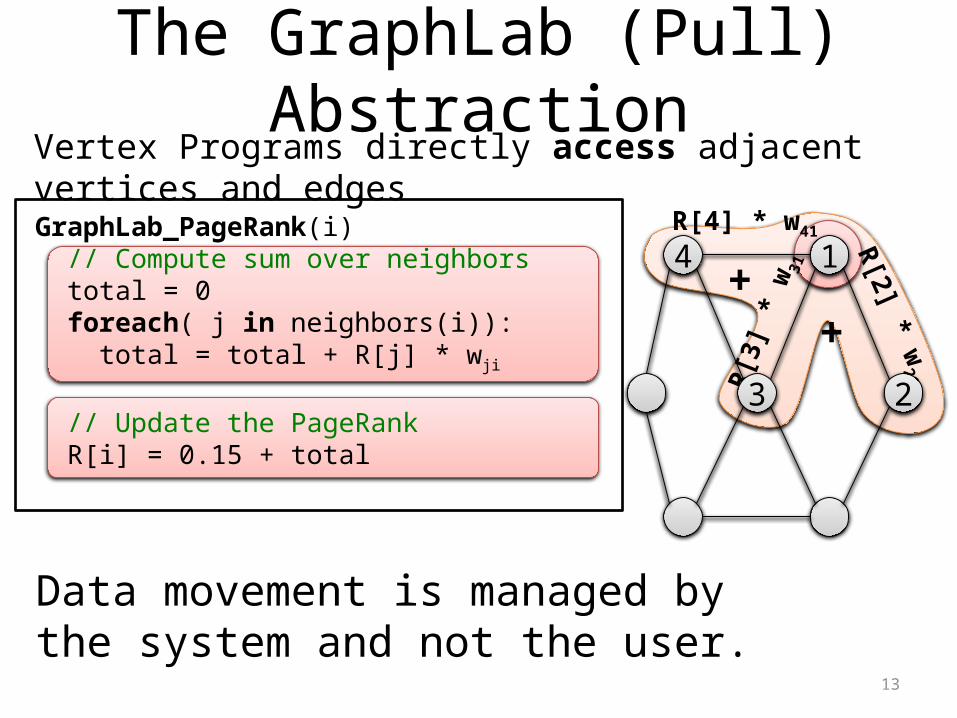
The GraphLab (Pull) Abstraction
Vertex Programs directly access adjacent vertices and edgesGraphLab_PageRank(i) // Compute sum over neighbors total = 0 foreach( j in neighbors(i)): total = total + R[j] * wji
// Update the PageRank R[i] = 0.15 + total
13
R[4] * w41
R[3]
* w
31
R[2] * w21
++
4 1
3 2
Data movement is managed by the system and not the user.
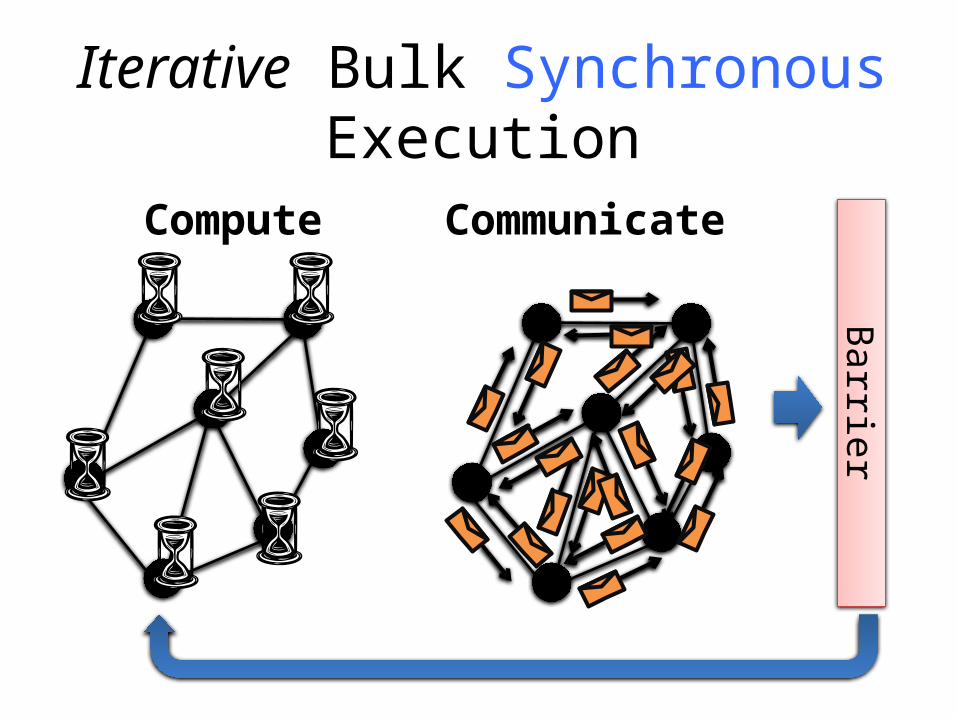
Barrie
rIterative Bulk Synchronous
ExecutionCompute Communicate
Graph-Parallel Systems
15
Pregel
Exploit graph structure to achieve orders-of-magnitude performance
gains over more general data-parallel
systems.
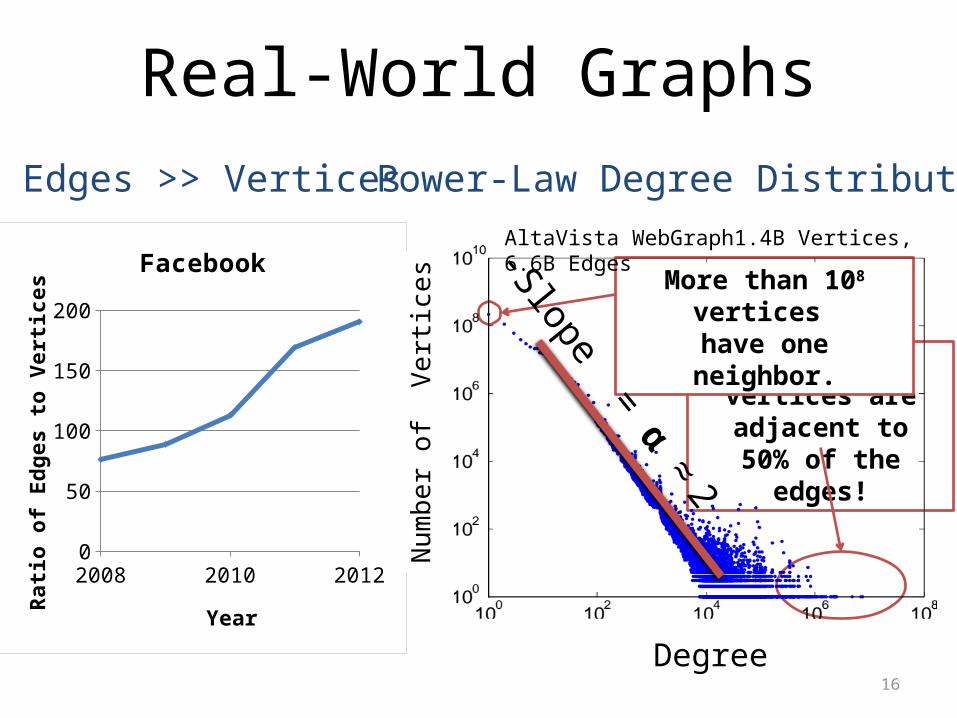
Real-World Graphs
16
Top 1% of vertices are adjacent to50% of the
edges!
More than 108 vertices have one neighbor.
2008 2009 2010 2011 20120
20406080
100120140160180200
Year
Rati
o o
f Ed
ges
to V
ert
ices
Nu
mb
er
of
Vert
ices
AltaVista WebGraph1.4B Vertices, 6.6B Edges
Degree
-Slope = α ≈
2
Power-Law Degree DistributionEdges >> Vertices
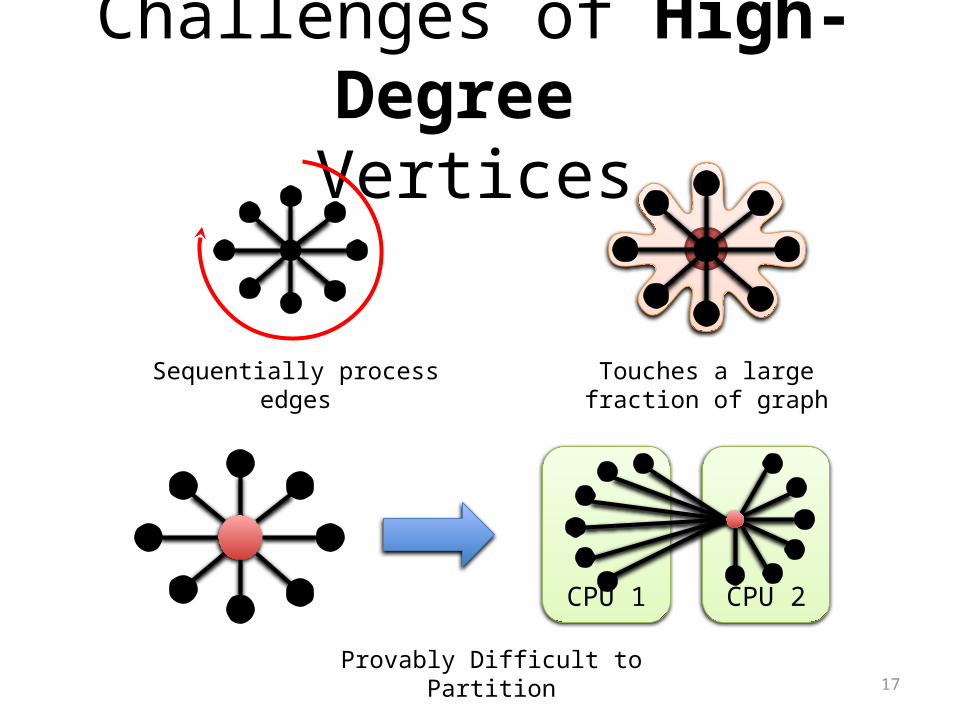
Challenges of High-Degree
Vertices
Touches a largefraction of graph
Sequentially processedges
17
CPU 1 CPU 2
Provably Difficult to Partition
Machine 1 Machine 2
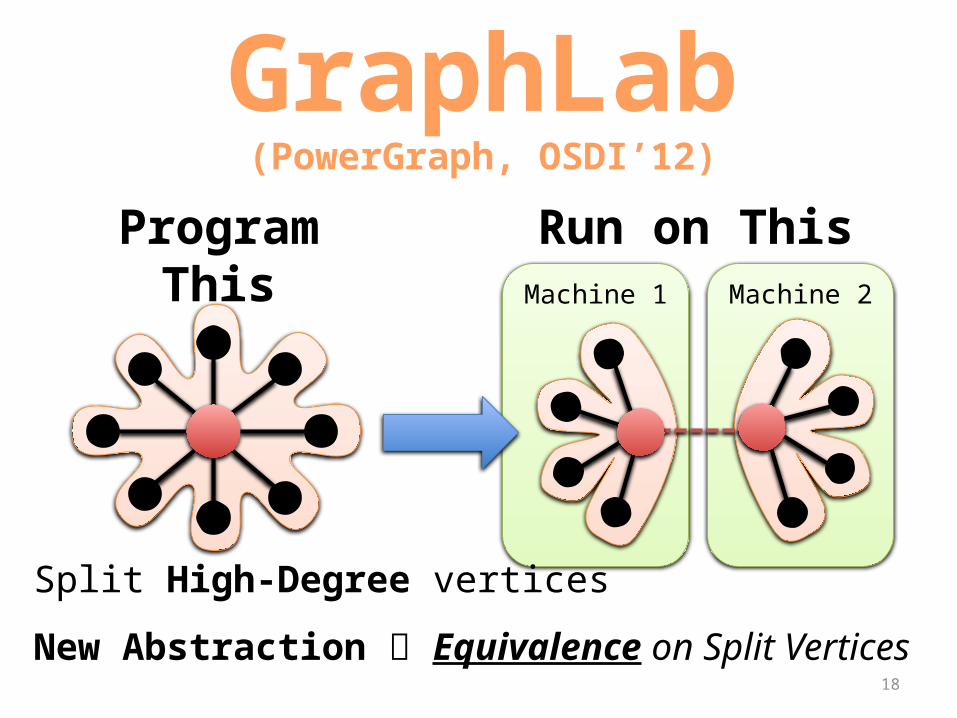
Split High-Degree vertices
New Abstraction Equivalence on Split Vertices
GraphLab(PowerGraph, OSDI’12)
18
Program This
Run on This
Machine 2Machine 1
Machine 4Machine 3
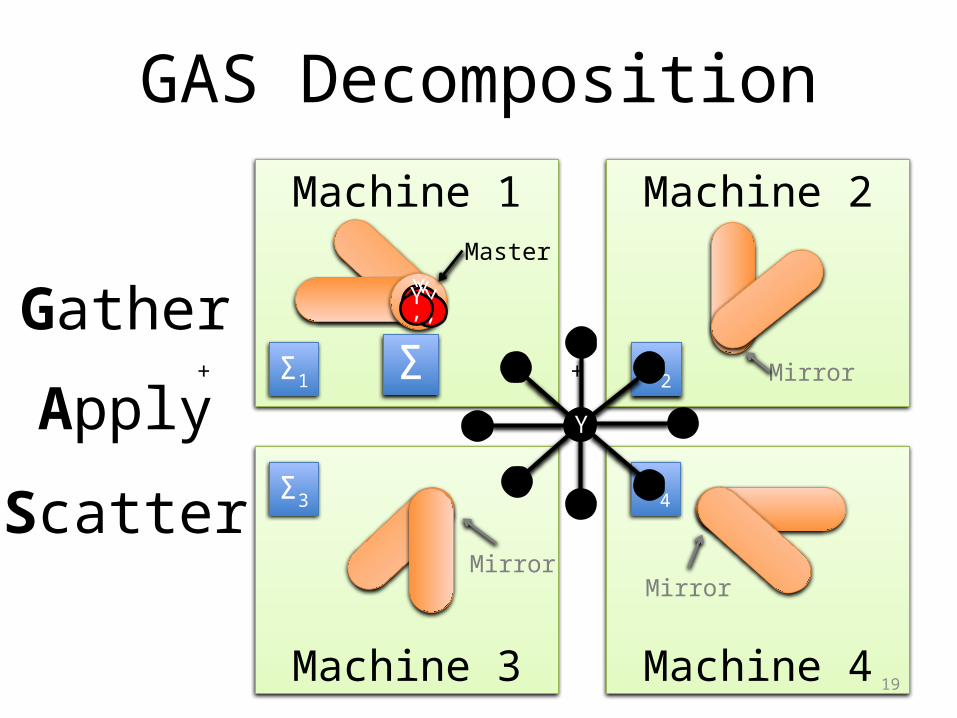
GAS Decomposition
Σ1 Σ2
Σ3 Σ4
+ + +
YYYY
Y’
ΣY’Y’Y’Gather
Apply
Scatter
19
Master
Mirror
MirrorMirror
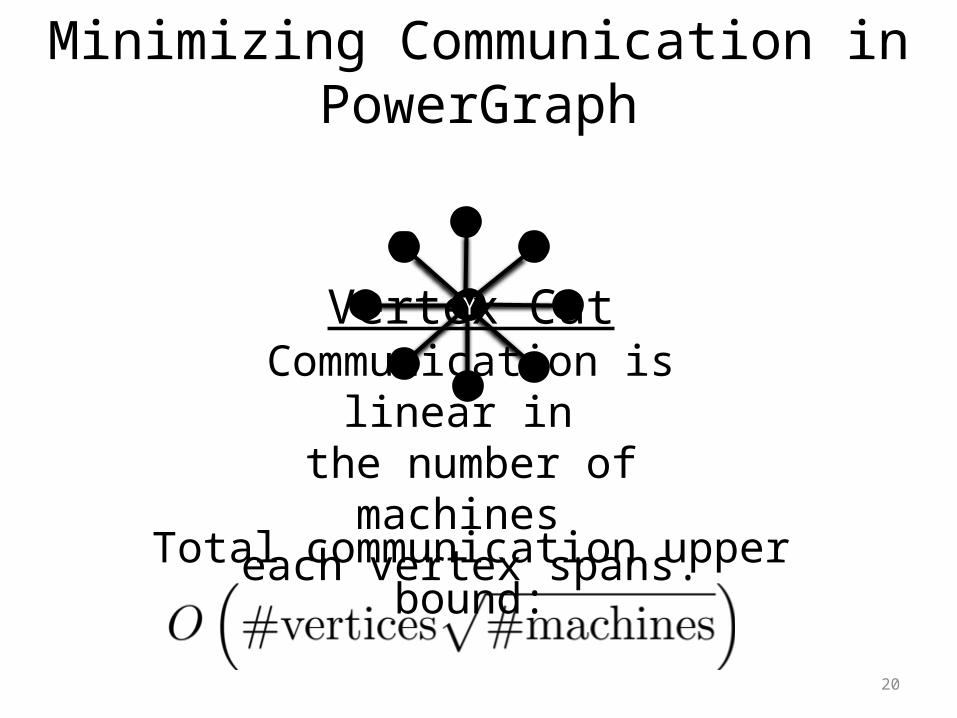
Minimizing Communication in PowerGraph
YYY
20
Vertex CutCommunication is linear
in the number of machines
each vertex spans.Total communication upper bound:

Shrinking Working Sets
0 10 20 30 40 50 60 701
10
100
1000
10000
100000
1000000
10000000
100000000
Number of Updates
Nu
m-V
ert
ices
51% of vertices run only once!PageRank on Web Graph
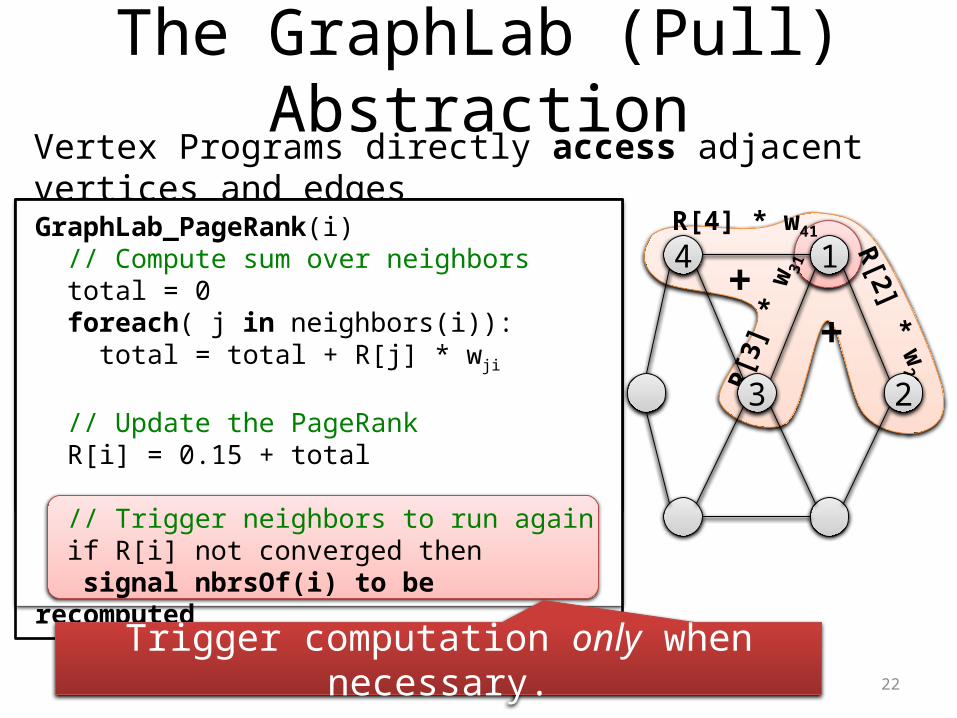
The GraphLab (Pull) Abstraction
Vertex Programs directly access adjacent vertices and edgesGraphLab_PageRank(i) // Compute sum over neighbors total = 0 foreach( j in neighbors(i)): total = total + R[j] * wji
// Update the PageRank R[i] = 0.15 + total
22
R[4] * w41
R[3]
* w
31
R[2] * w21
++
4 1
3 2
GraphLab_PageRank(i) // Compute sum over neighbors total = 0 foreach( j in neighbors(i)): total = total + R[j] * wji
// Update the PageRank R[i] = 0.15 + total
// Trigger neighbors to run again if R[i] not converged then signal nbrsOf(i) to be recomputed
Trigger computation only when necessary.
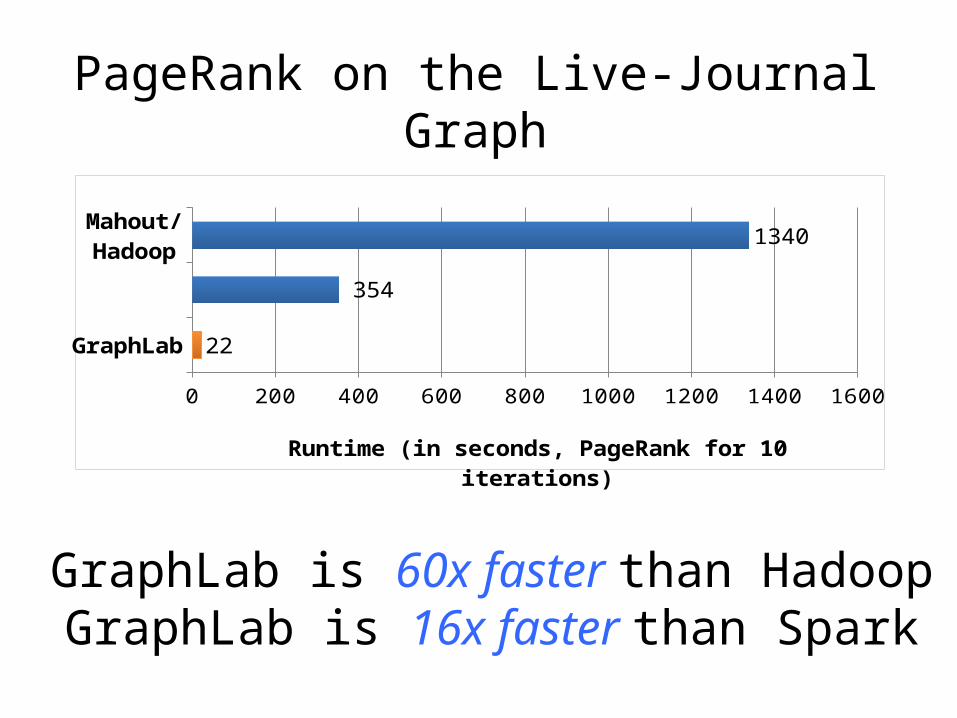
PageRank on the Live-Journal Graph
GraphLab
Naïve Spark
Mahout/Hadoop
0 200 400 600 800 1000 1200 1400 1600
22
354
1340
Runtime (in seconds, PageRank for 10 iter-ations)
GraphLab is 60x faster than HadoopGraphLab is 16x faster than Spark
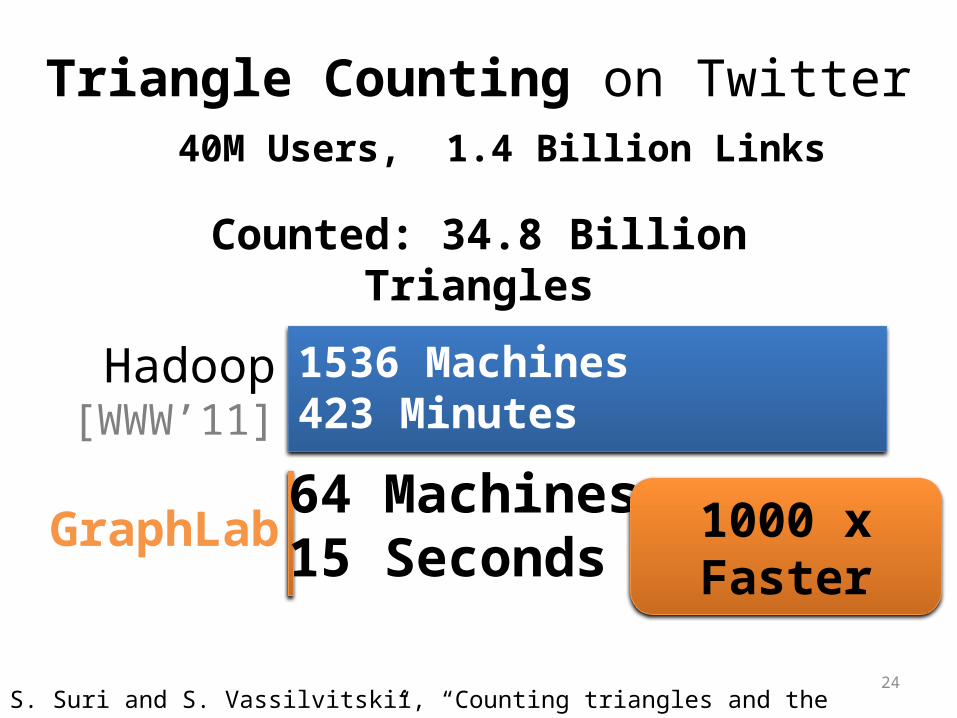
Counted: 34.8 Billion Triangles
24
Triangle Counting on Twitter
64 Machines15 SecondsGraphLab
1536 Machines423 Minutes
Hadoop[WWW’11]
S. Suri and S. Vassilvitskii, “Counting triangles and the curse of the last reducer,” WWW’11
1000 x Faster
40M Users, 1.4 Billion Links

Graph Analytics Pipeline
Raw Wikipedia
< / >< / >< / >XML
Hyperlinks PageRank Top 20 PagesTitle PR
TextTableTitle Body
Topic Model(LDA) Word Topics
Word
Topic
Editor GraphCommunityDetection
User Community
UserCom
.
Term-DocGraph
DiscussionTableUser Disc.
CommunityTopic
TopicCom
.
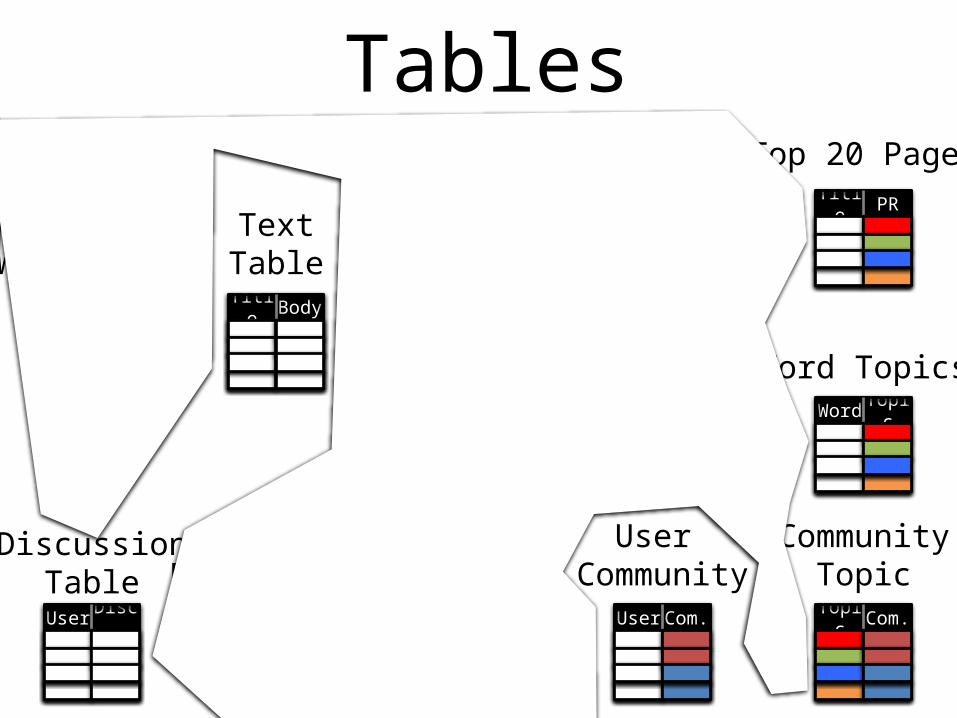
Tables
Raw Wikipedia
< / >< / >< / >XML
Hyperlinks PageRank Top 20 PagesTitle PR
TextTableTitle Body
Topic Model(LDA) Word Topics
Word
Topic
Editor GraphCommunityDetection
User Community
UserCom
.
Term-DocGraph
DiscussionTableUser Disc.
CommunityTopic
TopicCom
.
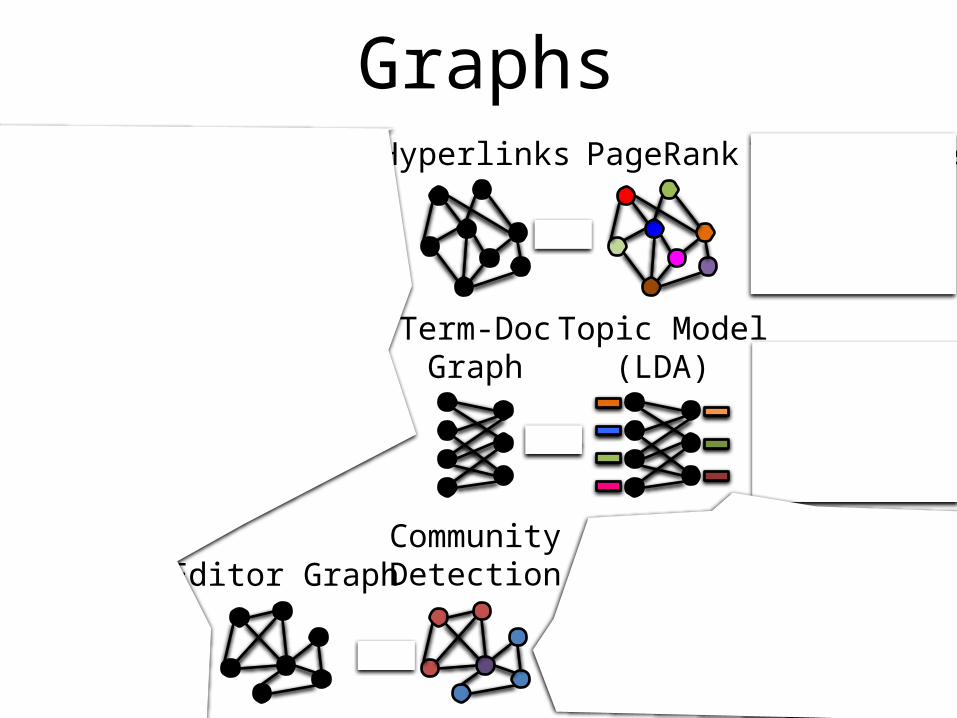
Graphs
Raw Wikipedia
< / >< / >< / >XML
Hyperlinks PageRank Top 20 PagesTitle PR
TextTableTitle Body
Topic Model(LDA) Word Topics
Word
Topic
Editor GraphCommunityDetection
User Community
UserCom
.
Term-DocGraph
DiscussionTableUser Disc.
CommunityTopic
TopicCom
.
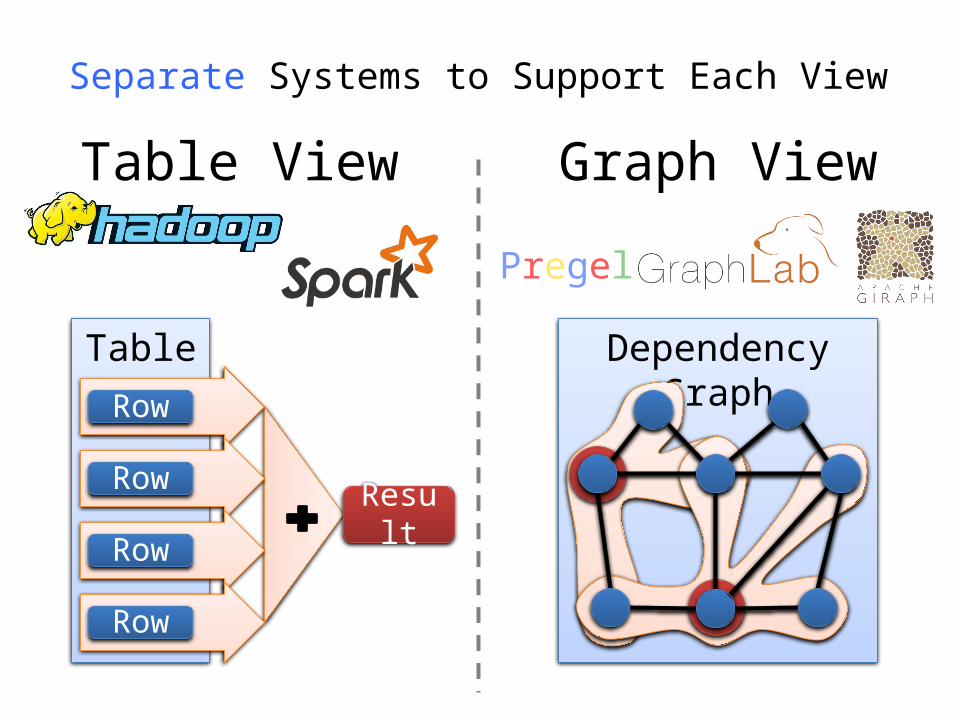
Separate Systems to Support Each View
Table View Graph View
Dependency Graph
Pregel
Table
Result
Row
Row
Row
Row

Separate systems for each view can bedifficult to use and
inefficient
29
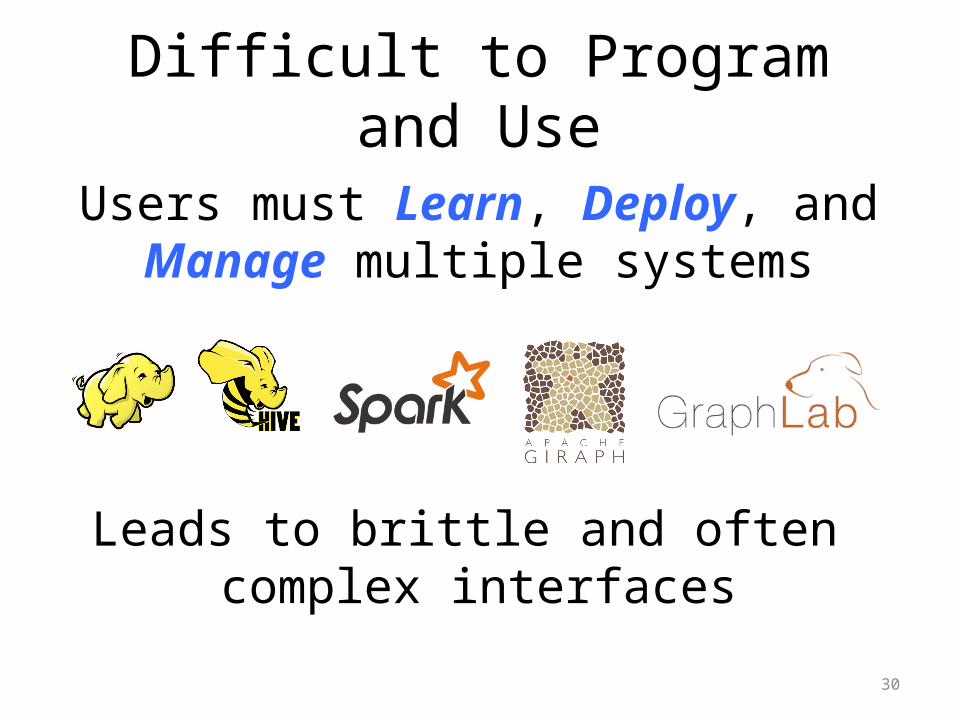
Difficult to Program and Use
Users must Learn, Deploy, and Manage multiple systems
Leads to brittle and often complex interfaces
30
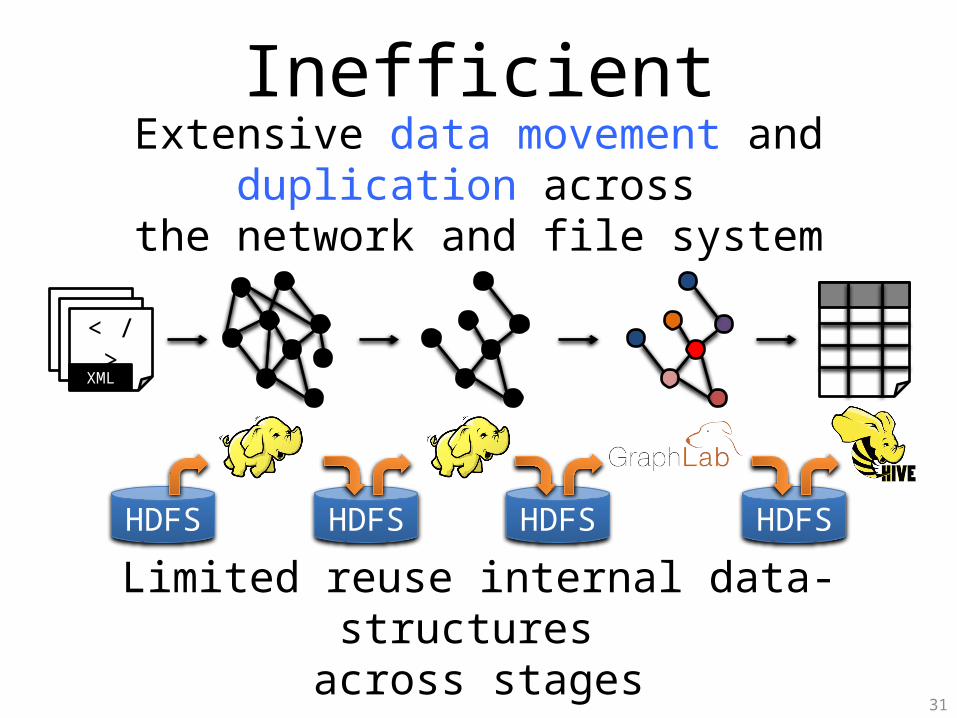
Inefficient
31
Extensive data movement and duplication across
the network and file system
< / >< / >< / >XML
HDFS HDFS HDFS HDFS
Limited reuse internal data-structures across stages
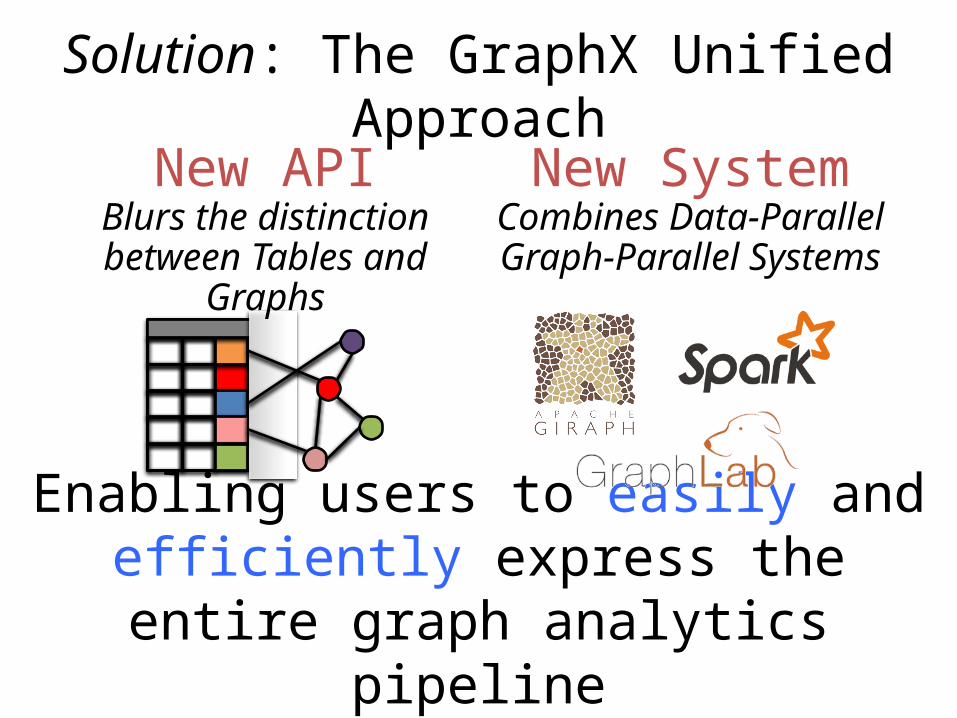
Solution: The GraphX Unified Approach
Enabling users to easily and efficiently express the entire graph
analytics pipeline
New APIBlurs the distinction between Tables and
Graphs
New SystemCombines Data-Parallel Graph-
Parallel Systems
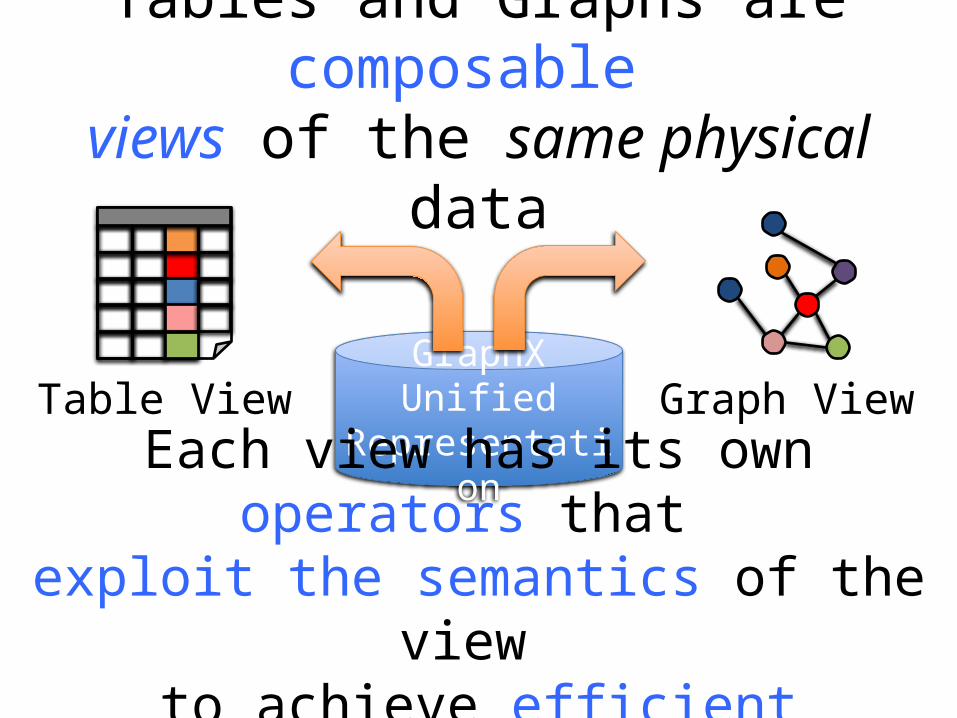
Tables and Graphs are composable
views of the same physical data
GraphX Unified
Representation
Graph ViewTable View
Each view has its own operators that
exploit the semantics of the view to achieve efficient execution
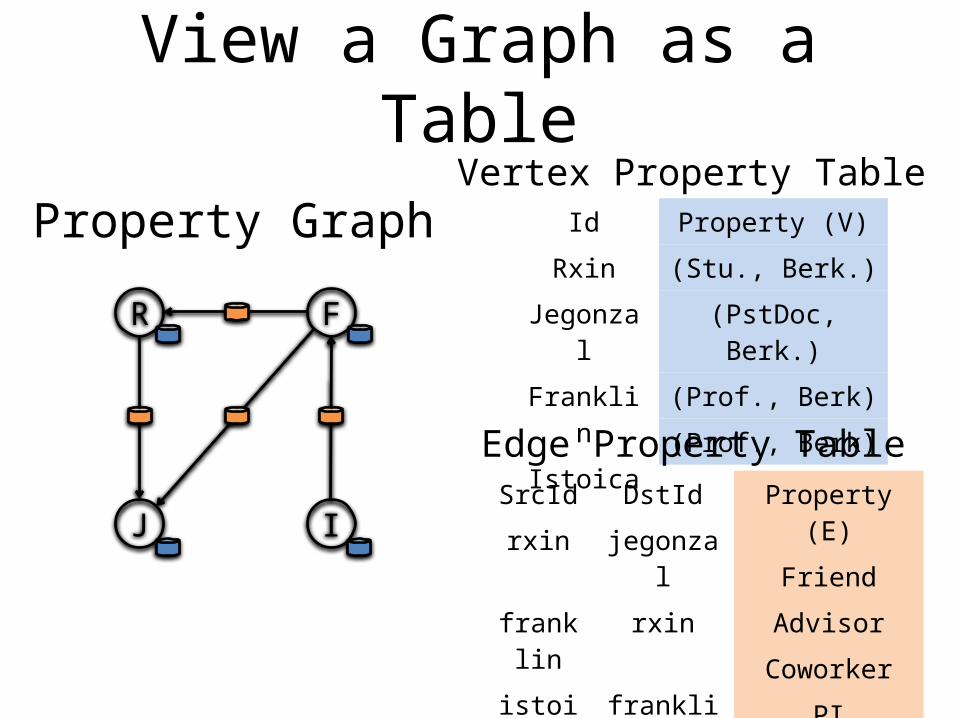
View a Graph as a Table
Id
Rxin
Jegonzal
Franklin
Istoica
SrcId DstId
rxin jegonzal
franklin
rxin
istoica franklin
franklin
jegonzal
Property (E)
Friend
Advisor
Coworker
PI
Property (V)
(Stu., Berk.)
(PstDoc, Berk.)
(Prof., Berk)
(Prof., Berk)
R
J
F
I
Property GraphVertex Property Table
Edge Property Table
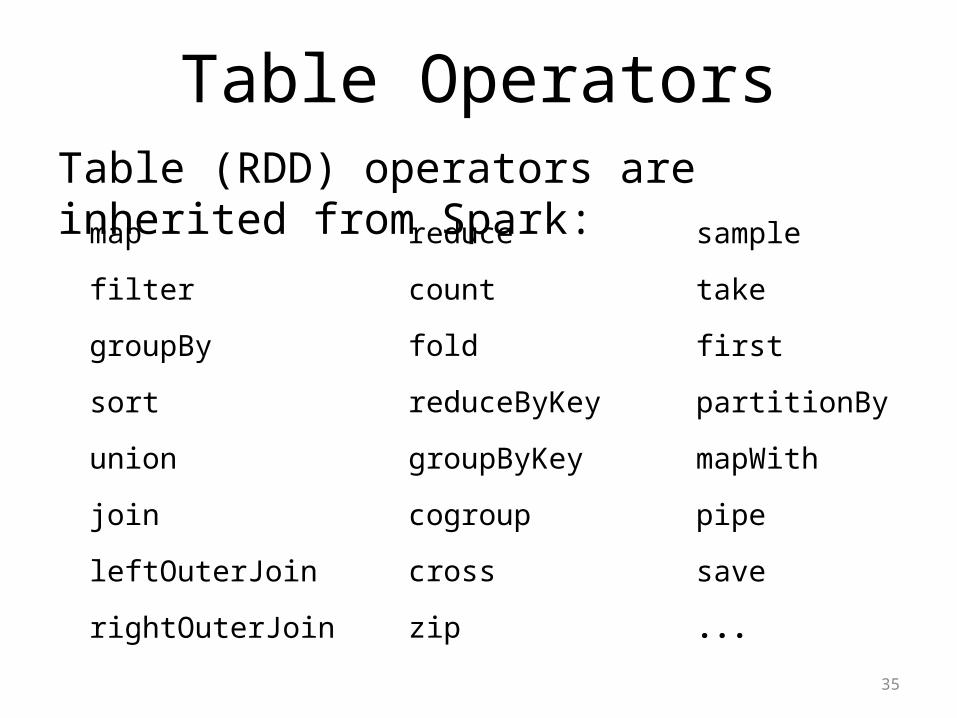
Table OperatorsTable (RDD) operators are inherited from Spark:
35
map
filter
groupBy
sort
union
join
leftOuterJoin
rightOuterJoin
reduce
count
fold
reduceByKey
groupByKey
cogroup
cross
zip
sample
take
first
partitionBy
mapWith
pipe
save
...
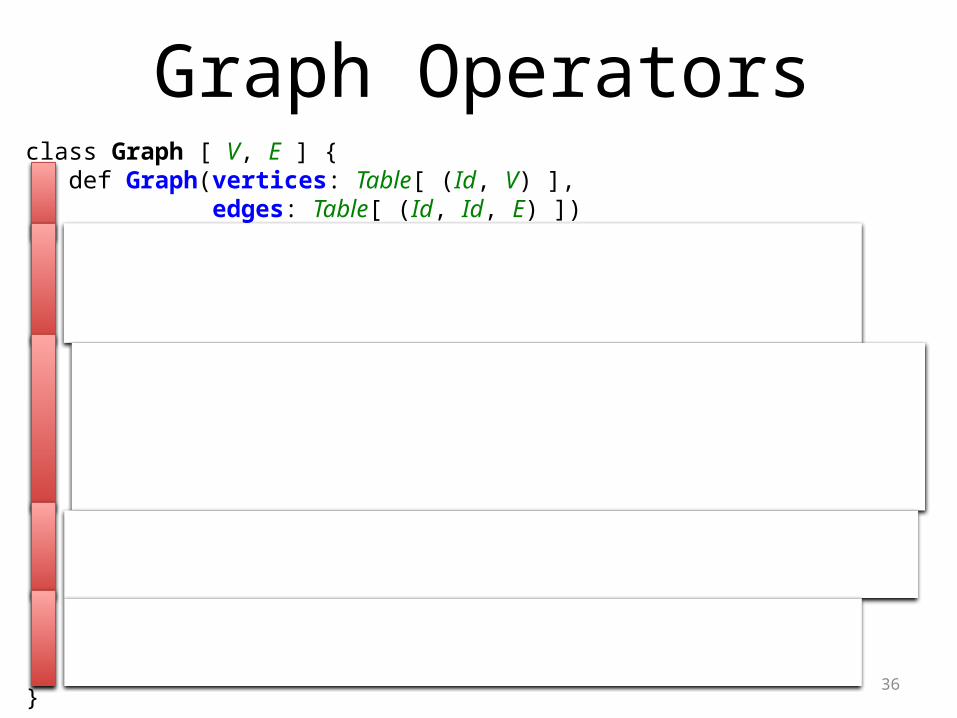
class Graph [ V, E ] { def Graph(vertices: Table[ (Id, V) ], edges: Table[ (Id, Id, E) ])
// Table Views -----------------def vertices: Table[ (Id, V) ]def edges: Table[ (Id, Id, E) ]def triplets: Table [ ((Id, V), (Id, V), E) ]// Transformations ------------------------------def reverse: Graph[V, E]def subgraph(pV: (Id, V) => Boolean,
pE: Edge[V,E] => Boolean): Graph[V,E]def mapV(m: (Id, V) => T ): Graph[T,E] def mapE(m: Edge[V,E] => T ): Graph[V,T]// Joins ----------------------------------------def joinV(tbl: Table [(Id, T)]): Graph[(V, T), E ]def joinE(tbl: Table [(Id, Id, T)]): Graph[V, (E, T)]// Computation ----------------------------------def mrTriplets(mapF: (Edge[V,E]) => List[(Id, T)],
reduceF: (T, T) => T): Graph[T, E]}
Graph Operators
36
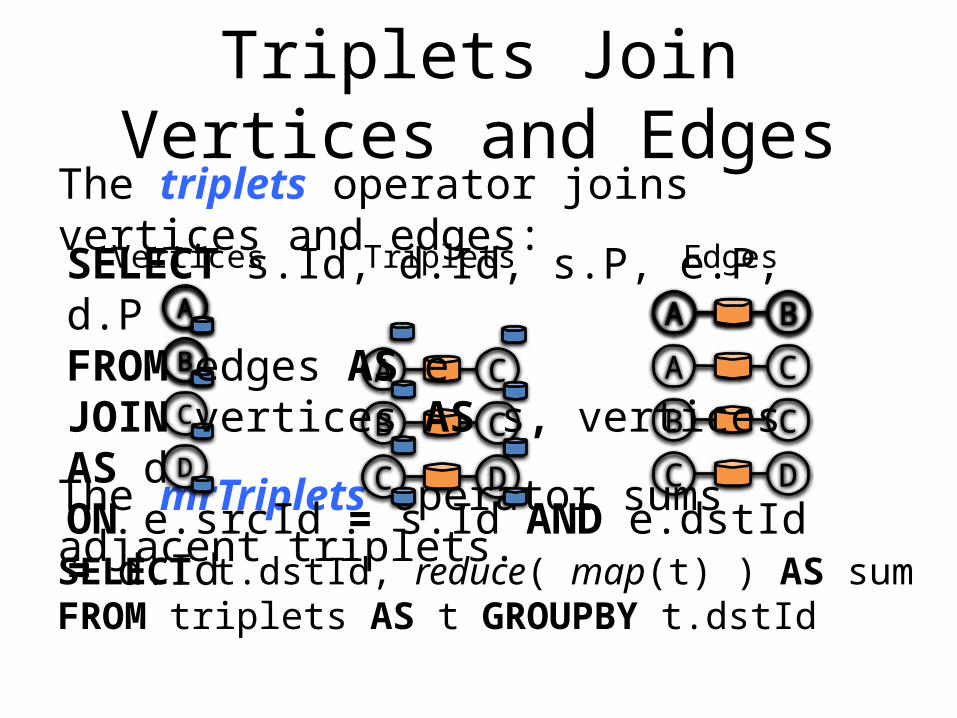
Triplets Join Vertices and Edges
The triplets operator joins vertices and edges:
The mrTriplets operator sums adjacent triplets.SELECT t.dstId, reduce( map(t) ) AS sum FROM triplets AS t GROUPBY t.dstId
TripletsVertices
B
A
C
D
Edges
A B
A C
B C
C D
A BA
B A C
B C
C D
SELECT s.Id, d.Id, s.P, e.P, d.PFROM edges AS eJOIN vertices AS s, vertices AS dON e.srcId = s.Id AND e.dstId = d.Id
We express enhanced Pregel and GraphLab
abstractions using the GraphX operators
in less than 50 lines of code!
38
39
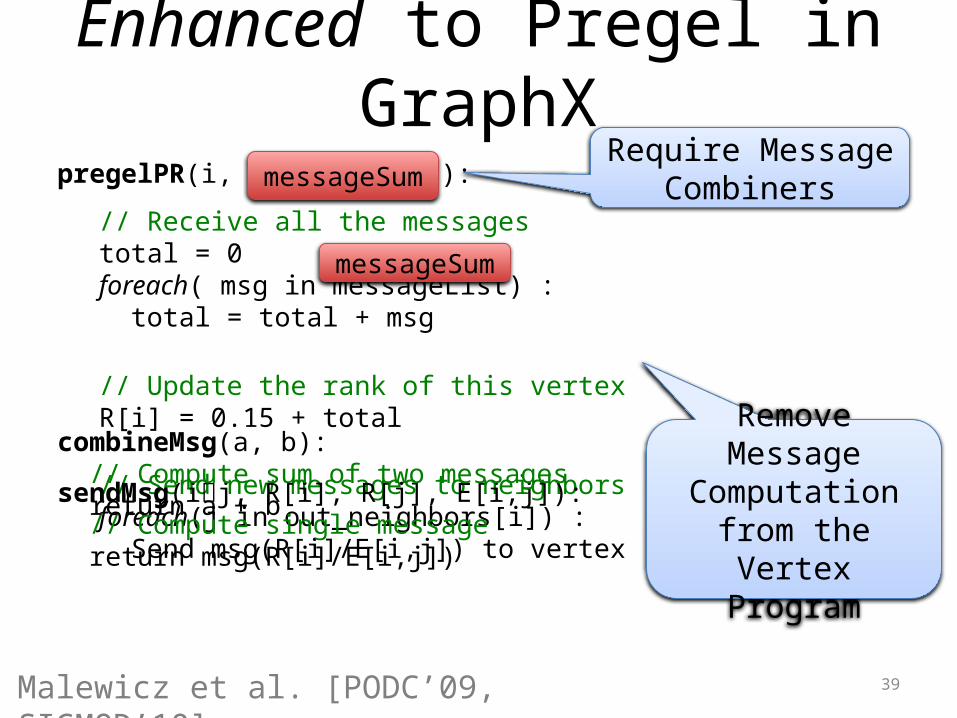
Enhanced to Pregel in GraphX
Malewicz et al. [PODC’09, SIGMOD’10]
pregelPR(i, messageList ):
// Receive all the messagestotal = 0foreach( msg in messageList) : total = total + msg
// Update the rank of this vertexR[i] = 0.15 + total
// Send new messages to neighborsforeach(j in out_neighbors[i]) : Send msg(R[i]/E[i,j]) to vertex
Require Message Combiners
messageSum
messageSum
Remove Message
Computationfrom the
Vertex Program
sendMsg(ij, R[i], R[j], E[i,j]): // Compute single message return msg(R[i]/E[i,j])
combineMsg(a, b): // Compute sum of two messages return a + b

40
Implementing PageRank in GraphX
// Load and initialize the graph
val graph = GraphBuilder.text(“hdfs://web.txt”)
val prGraph = graph.joinVertices(graph.outDegrees)
// Implement and Run PageRank
val pageRank =
prGraph.pregel(initialMessage = 0.0, iter = 10)(
(oldV, msgSum) => 0.15 + 0.85 * msgSum,
triplet => triplet.src.pr / triplet.src.deg,
(msgA, msgB) => msgA + msgB)

We express the Pregel and GraphLab like
abstractions using the GraphX operators
in less than 50 lines of code!
41
By composing these operators we canconstruct entire graph-analytics
pipelines.
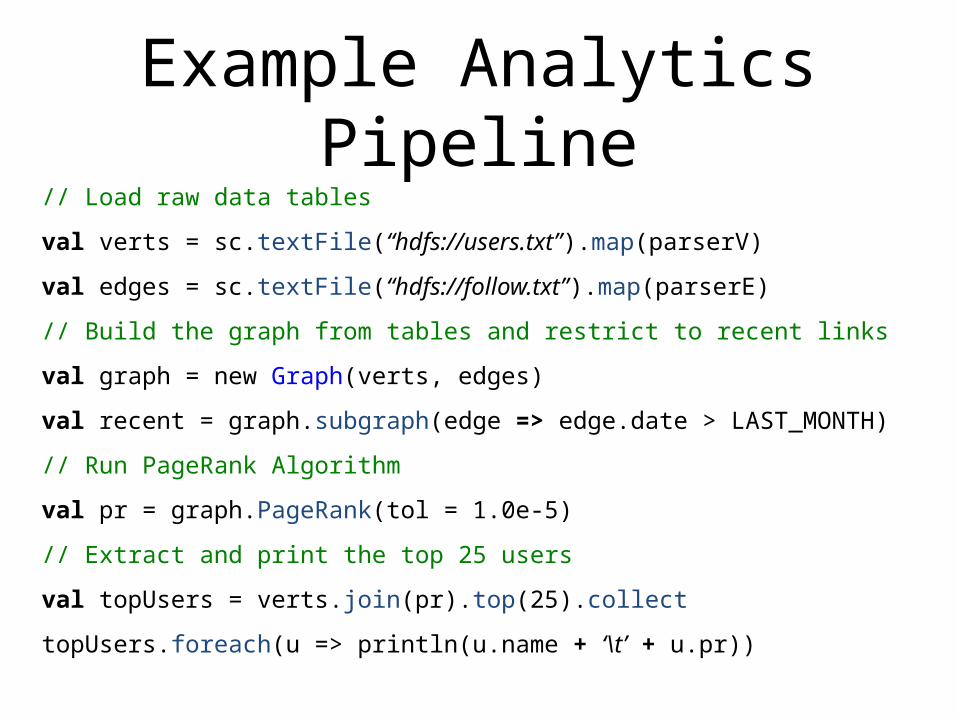
Example Analytics Pipeline
// Load raw data tables
val verts = sc.textFile(“hdfs://users.txt”).map(parserV)
val edges = sc.textFile(“hdfs://follow.txt”).map(parserE)
// Build the graph from tables and restrict to recent links
val graph = new Graph(verts, edges)
val recent = graph.subgraph(edge => edge.date > LAST_MONTH)
// Run PageRank Algorithm
val pr = graph.PageRank(tol = 1.0e-5)
// Extract and print the top 25 users
val topUsers = verts.join(pr).top(25).collect
topUsers.foreach(u => println(u.name + ‘\t’ + u.pr))
GraphX System Design

Part. 2
Part. 1
Vertex Table (RDD)
B C
A D
F E
A D
Distributed Graphs as Tables (RDDs)
D
Property Graph
B C
D
E
AA
F
Edge Table (RDD)A B
A C
C D
B C
A E
A F
E F
E D
B
C
D
E
A
F
Routing
Table (RDD)
B
C
D
E
A
F
1
2
1 2
1 2
1
2
2D Vertex Cut Heuristic
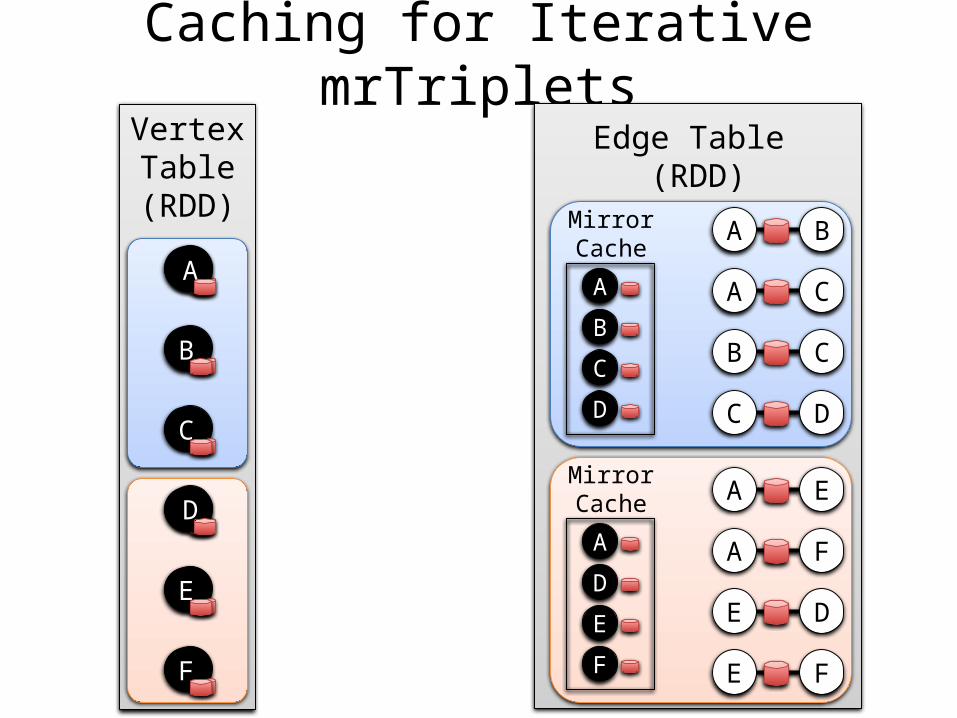
Vertex Table (RDD)
Caching for Iterative mrTripletsEdge Table
(RDD)
A B
A C
C D
B C
A E
A F
E F
E D
MirrorCache
B
C
D
A
MirrorCache
D
E
F
A
B
C
D
E
A
F
B
C
D
E
A
F
A
D
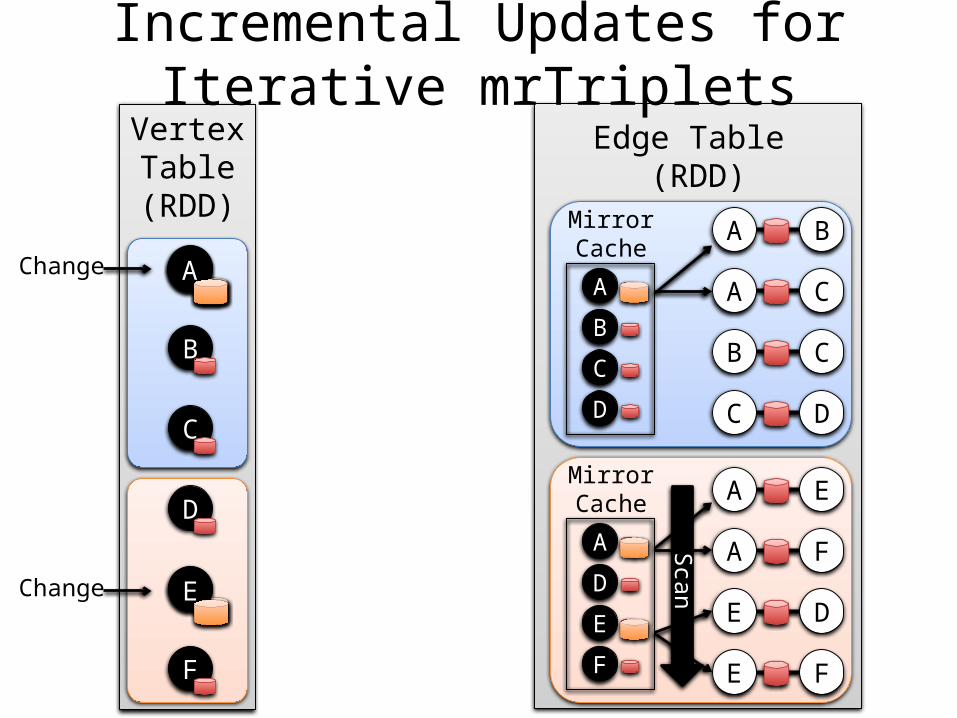
Vertex Table (RDD)
Edge Table (RDD)
A B
A C
C D
B C
A E
A F
E F
E D
MirrorCache
B
C
D
A
MirrorCache
D
E
F
A
Incremental Updates for Iterative mrTriplets
B
C
D
E
A
F
Change AA
Change E
Sca
n

Vertex Table (RDD)
Edge Table (RDD)
A B
A C
C D
B C
A E
A F
E F
E D
MirrorCache
B
C
D
A
MirrorCache
D
E
F
A
Aggregation for Iterative mrTriplets
B
C
D
E
A
F
Change
Change
Sca
n
Change
Change
Change
Change
LocalAggregate
LocalAggregate
B
C
D
F
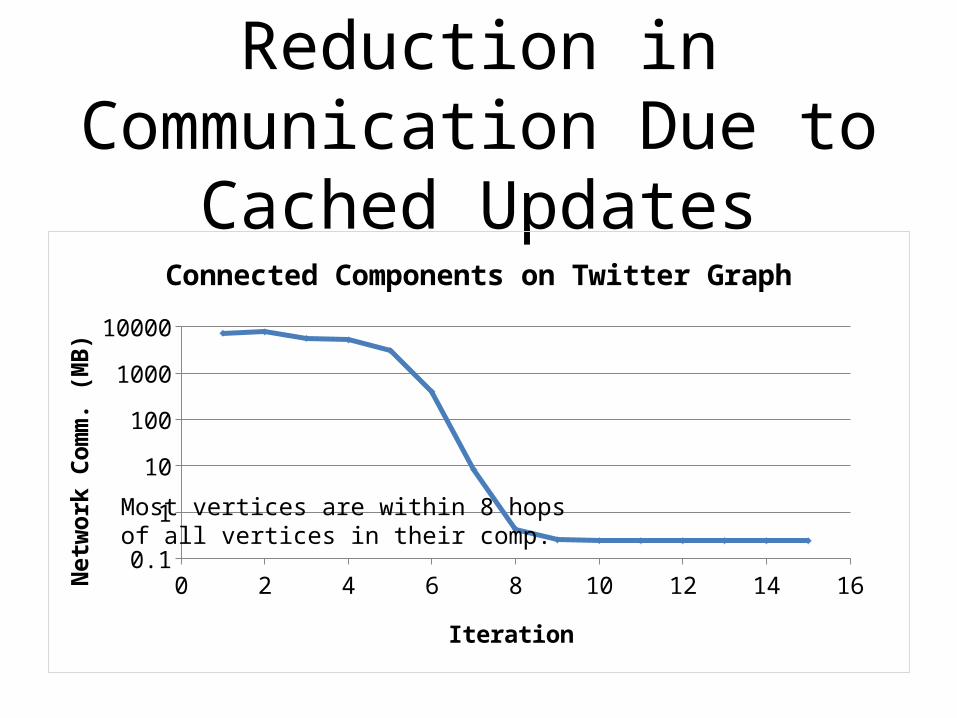
Reduction in Communication Due to
Cached Updates
0 2 4 6 8 10 12 14 160.1
1
10
100
1000
10000
Connected Components on Twitter Graph
Iteration
Netw
ork
Com
m.
(MB
)
Most vertices are within 8 hopsof all vertices in their comp.
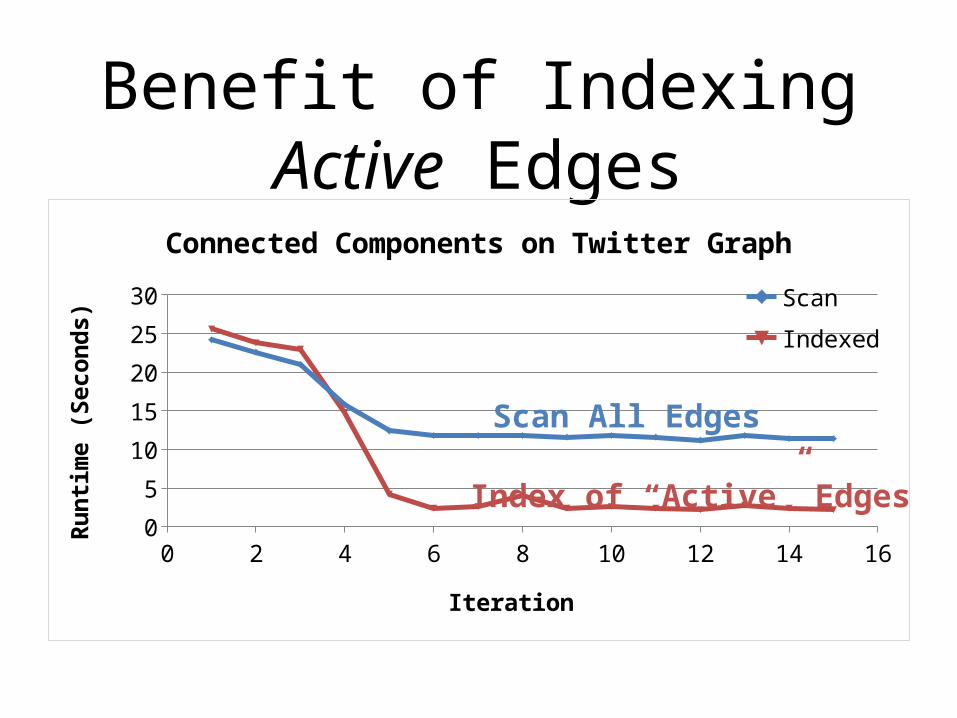
Benefit of Indexing Active Edges
0 2 4 6 8 10 12 14 160
5
10
15
20
25
30
Connected Components on Twitter Graph
Scan
Indexed
Iteration
Ru
nti
me (
Secon
ds)
Scan All Edges
Index of “Active” Edges
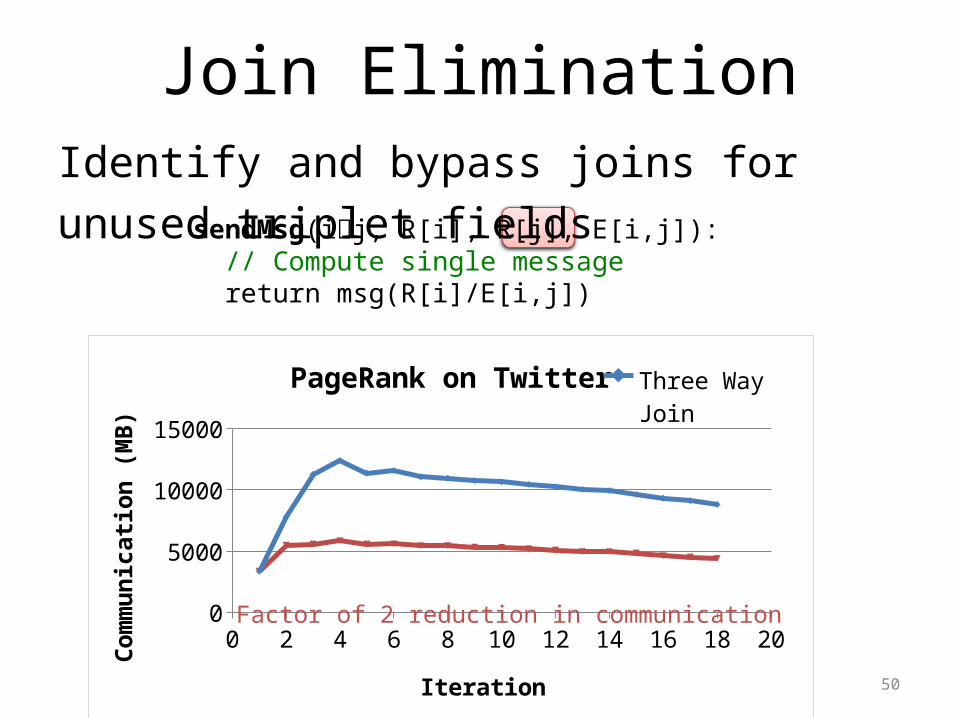
Join EliminationIdentify and bypass joins for unused triplet fields
50
0 2 4 6 8 10 12 14 16 18 200
5000
10000
15000
PageRank on TwitterThree Way Join
Join Elimination
IterationCom
mu
nic
ati
on
(M
B)
Factor of 2 reduction in communication
sendMsg(ij, R[i], R[j], E[i,j]): // Compute single message return msg(R[i]/E[i,j])
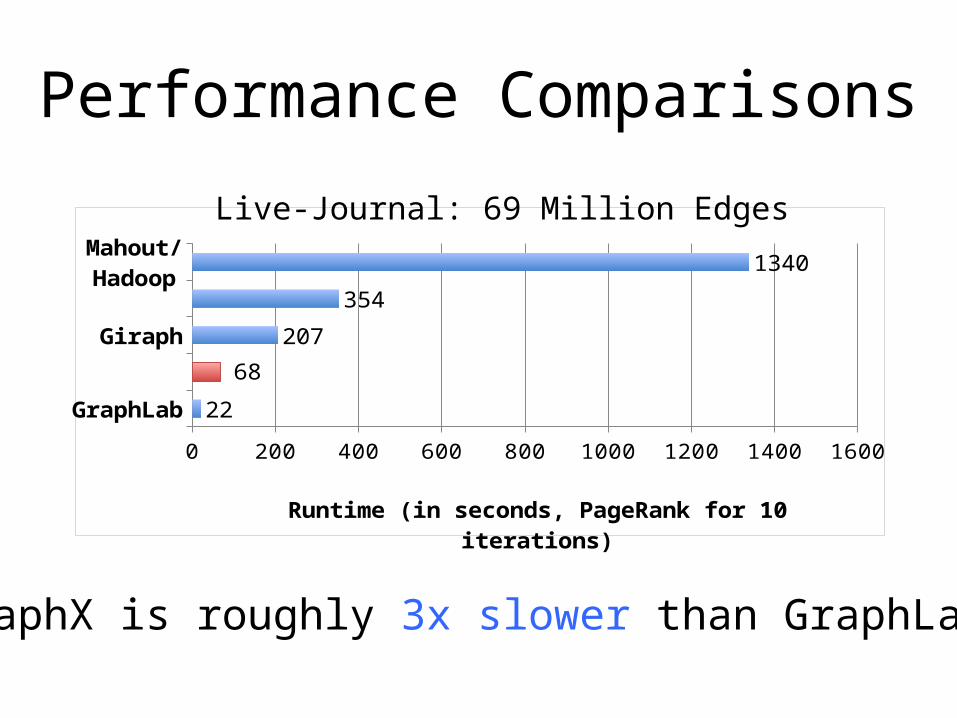
Performance Comparisons
GraphLab
Giraph
Mahout/Hadoop
0 200 400 600 800 1000 1200 1400 1600
22
68
207
354
1340
Runtime (in seconds, PageRank for 10 iter-ations)
GraphX is roughly 3x slower than GraphLab
Live-Journal: 69 Million Edges
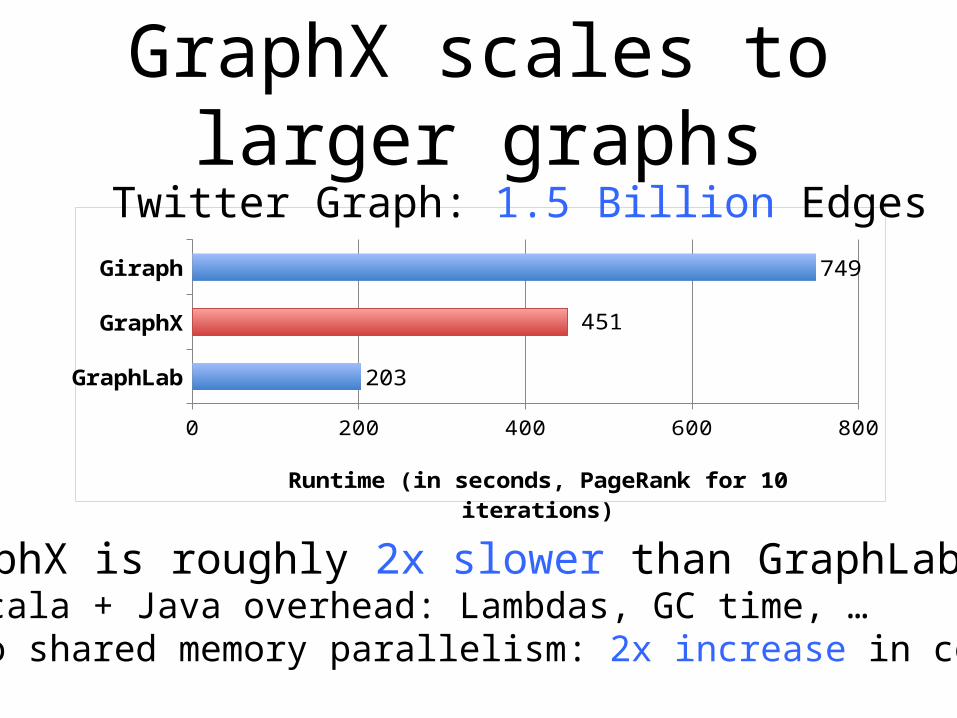
GraphX scales to larger graphs
GraphLab
GraphX
Giraph
0 200 400 600 800
203
451
749
Runtime (in seconds, PageRank for 10 iter-ations)
GraphX is roughly 2x slower than GraphLab»Scala + Java overhead: Lambdas, GC time, …»No shared memory parallelism: 2x increase in comm.
Twitter Graph: 1.5 Billion Edges
PageRank is just one stage….
What about a pipeline?
HDFSHDFS
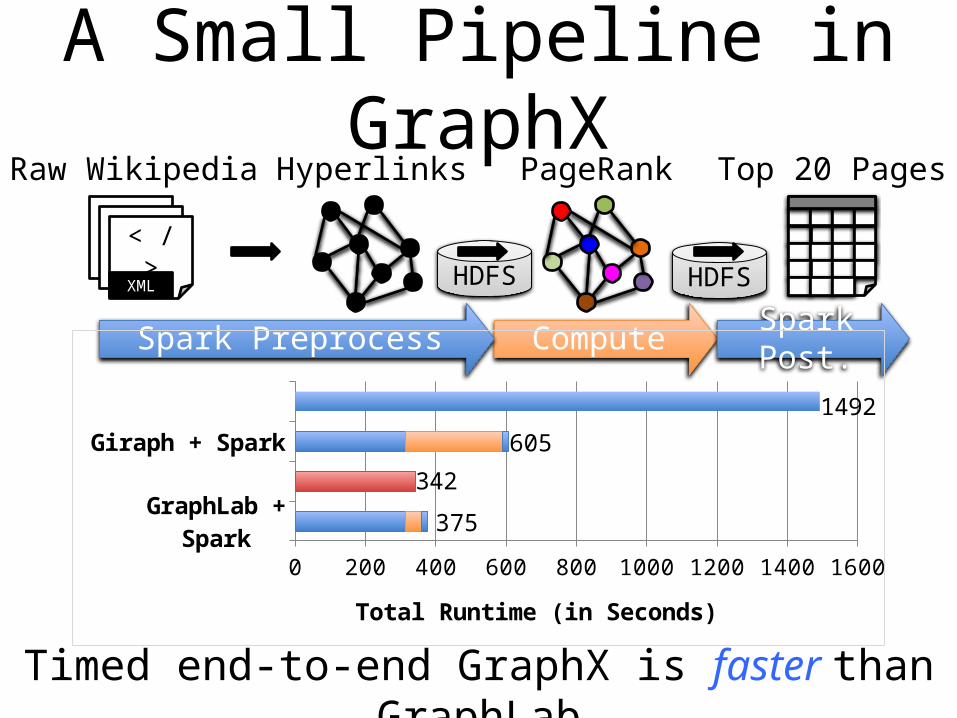
ComputeSpark PreprocessSpark Post.
A Small Pipeline in GraphX
Timed end-to-end GraphX is faster than GraphLab
Raw Wikipedia
< / >< / >< / >XML
Hyperlinks PageRank Top 20 Pages
GraphLab + Spark
Giraph + Spark
0 200 400 600 800 1000 1200 1400 1600
342
1492
Total Runtime (in Seconds)
605
375
Conclusion and Observations
Domain specific views: Tables and Graphs
»tables and graphs are first-class composable objects
»specialized operators which exploit view semantics
Single system that efficiently spans the pipeline
»minimize data movement and duplication»eliminates need to learn and manage
multiple systems
Graphs through the lens of database systems
»Graph-Parallel Pattern Triplet joins in relational alg.
»Graph Systems Distributed join optimizations
56
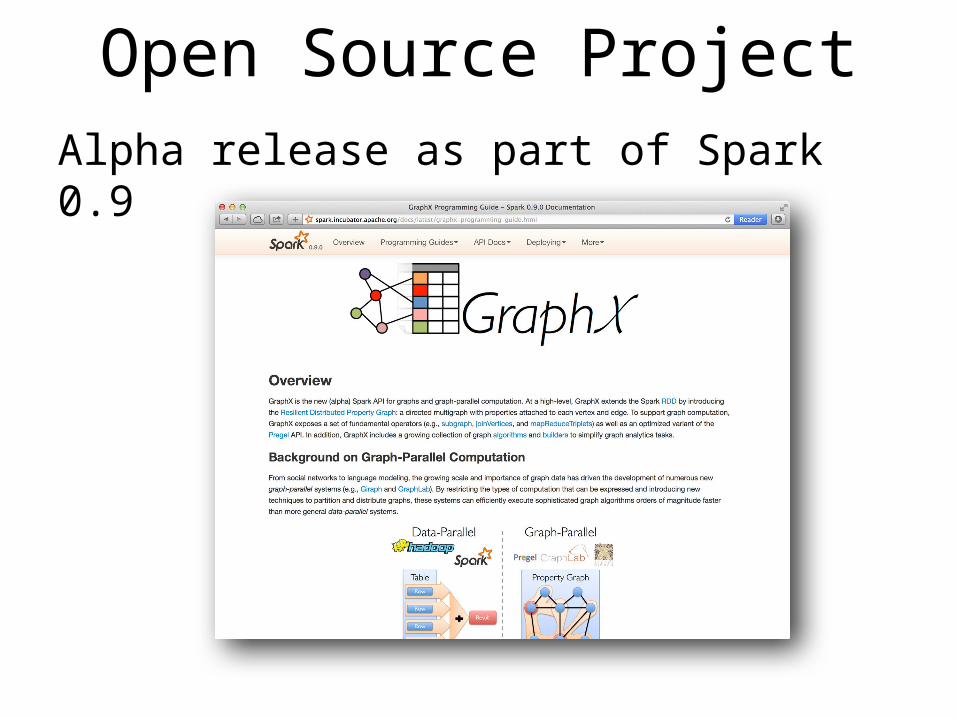
Open Source ProjectAlpha release as part of Spark 0.9
Active Research
Static Data Dynamic Data»Apply GraphX unified approach to time
evolving data»Materialized view maintenance for graphs
Serving Graph Structured Data»Allow external systems to interact with
GraphX»Unify distributed graph databases with
relational database technology
58

Collaborators
YuchengLow
AapoKyrola
DannyBickson
AlexSmola
HaijieGu
GraphLab:
CarlosGuestrin
GuyBlelloch
GraphX:
ReynoldXin
AnkurDave
DanielCrankshaw
MichaelFranklin
IonStoica
Thanks!
http://tinyurl.com/ampgraphx
Top Related