


Languages
Pages
Legal

French Neo-Colonialism? Franco-African Trade
After Independence
Emmanuelle Lavallée∗ Julie Lochard†
Very preliminary and incomplete. Please do not quote.
July 2016
Author Keywords: Trade; Decolonization; French Empire, Sub-Saharan Africa.
JEL classification codes: F10; F54.
∗PSL, Université Paris-Dauphine, LEDa, UMR DIAL. Email: [email protected].†Erudite, University of Paris-Est Créteil Val de Marne. Email: [email protected].
1

1 Introduction
Over the long run, politics had obviously shaped the pattern of international trade (Findlay and
O’Rourke, 2007). Over the recent past, evidence are fragmented and sometimes contradictory,
especially as far as power plays in the international order is concerned.1 For instance, Berger et al.
(2013) show that increased political influence, due to CIA intervention during the Cold War, was
used to create a larger foreign market for American products. Following CIA intervention, imports
from the US increased dramatically while total exports to the US were unaffected. Mityakov,
Tang and Tsui (2013), on the other hand, show that deterioration of relations between the United
States and another country reduced U.S. imports from that country, but that the magnitude of the
effect is small and limited to petroleum and some chemical products. Beyond the United States,
the influence of other powers, like the USSR, Great Britain or France may have determined the
pattern and the evolution of foreign exchanges. France offers an interesting case in this regard. It
maintained strong connections with its former colonies in Sub-Saharan Africa (SSA). Indeed, in this
region, independence did not radically change relations between France and its former colonies.
Contrary to what happened in former colonies located in other parts of the world, France and
its former colonies in SSA kept on having strong economic and political links at least until the
beginning of the 1990s. Do this special Franco-African Relation (hereafter FAR) promote French
exports?
The French influence operated both at the political and economic level. It included not only
secret cooperation agreements, but also personal and friendly ties between French and African top-
level officials or development assistance. Beyond anecdotal evidence, singular FAR are likely to
have influenced trade. They may explain why, more than 50 years after their independence, former
French SSA colonies still trade more with their former colonizer than other African former colonies
(de Sousa and Lochard, 2012). To the best of our knowledge, the impacts of FAR on French-African
trade have never been explored at least in a comprehensive empirical manner. Little explored in
economics, a large literature deals with this issue in political sciences. Yet, Franco-African relations
are an area where objective and scientific knowledge is still relatively scarce. The aim of this paper is
twofold. First, it intends to test whether FAR distorted French exports towards SSA former French
colonies and to isolate the products that were the most affected. Second, it aims at explaining the
drivers of this potential Franco-African trade gap.
To examine the consequences on trade of FAR, we use data for bilateral aggregated and sectoral
exports of France with 188 partner countries over the period 1960-20072. Aggregate trade data are
taken from the International Monetary Fund’s Direction of Trade Statistics (DOTS) and sectoral
1As opposed to intra-state or inter-state wars which impact on trade as been studied by Martinet al., 2008 for instance)
21962 for sectoral data
2
trade data, at the four-digit level, come from commodity trade statistics database of the United
Nations Statistics Division (UN Comtrade). In addition to disentangle the drivers of this FAR effect
on trade, we gathered a bunch of data on development assistance, migration, military interventions,
or on political proximity as well as original data on inter-personal ties between French and African
officials. The later is approximated by bilateral visits of top-level officials between France and
foreign countries collected from the French Ministry of Foreign Affairs.
We find that FAR distorted French exports in favor of its former SSA colonies. Indeed, our
results indicate that France exported significantly more to its former SSA colonies, as compared
to other countries, whether they be in development or other former French colonies. This extra-
trade between France and its former SSA colonies closely reflects the twists and turns of the
FAR. For example, the gap started to narrow when FAR began to fall apart at end of the 1980s.
Furthermore, this FAR effect is robust to the introduction of additional explanatory variables or the
use of other methods of estimation. Analysis at the sectoral level show that FAR impacted a large
variety of products going from manufactured goods to machinery and transport equipments through
food. Using Rauch’s classification (1999), we find that FAR affected indifferently reference-priced,
homogenous and differentiated goods. A finer analysis reveals a larger effect of FAR for French
exports of luxury goods and for goods in which France was least competitive. As regards, the
drivers of this FAR effect on trade we provide evidence that the political factors and, in particular
political proximity measured by similarity in United Nations General Assembly voting patterns,
explain most of the observed extra-trade between France and its former SSA colonies.
The paper is structured as follows. In section 2, we discuss the French influence in SSA.
Then, in section 3, we introduce the empirical model and describe our data. In section 4, we
present empirical evidence on the effect of the FAR on aggregate and sectoral trade. Finally, in
section 5, we investigate several potential economic and political drivers of the French influence.
We summarize our findings and add concluding remarks in section 6.
2 The French influence in SSA
The French influence in African former colonies after independence is the consequence of how
decolonization took place in SSA. Decolonisation in SSA was included in the scope of a of “pré-
carré”, i.e. the reinforcement of frontiers in order to better resist to external aggressions. In other
words, in the Cold War context, France wanted to keep its influence on its former SSA colonies
because they were an essential element of its international influence. Orchestrated by the the
emblematic Jacques Foccart3, decolonization in SSA aimed at setting up a network of African
3Jacques Foccart led the Franco-African policy together with the French Presidents De Gaulle,Pompidou and Chirac. He is also associated with the dark side of the Françafrique. Since 1960,
3

Republics allied with France (Bat, 2012). In 1960, almost all former French colonies become
independent mostly peacefully.4
Negotiations on the terms of independence led to the signature of secret cooperation agreements
of two kinds. The first one dealt with the privileged access of France to its former colonies’ raw
materials. The second one, claimed by African Presidents themselves, concerned the military
protection of new regimes. The contract between France and its former French colonies was the
following: France supported the African Presidents “friends” of France, i.e. Presidents defending
French positions in the international arena or granting a French preference in any sector (Bat,
2012). The Franco-African policy was organised in Paris in the Office of the Executive Power
through the “Secrétariat Général des Affaires Africaines et Malgaches” led by Jacques Foccart. Its
mission was to inform the French President of the political evolutions of the African Republics,
of their reciprocal relations, as well as their relations with France. The “Secrétariat Général des
Affaires Africaines et Malgaches” organized the relations between French and African executive
powers. It not only dealt with diplomatic relations between friendly States, but it was also in
charge of the personal and friendly ties between French and African top-level officials, especially
Presidents.5 Thus, interpersonal ties were the keystone of FARs and of the French African policy.
The strength of personal bonds was at the very foundation of FARs.
FARs had also economic demonstrations. After attaining independence, most of the new
African states decided to keep a common exchange rate mechanism. The Franc Zone, which
dates back to the colonial period, provides an unlimited convertibility guarantee from the French
Treasury and a fixed exchange rate between the CFA franc, the Comorian Franc and the French
Franc (now the euro). Independence went hand to hand with development assistance. One of its
mechanisms, tied aid, was deemed to have long guaranteed a virtual monopoly for French firms
conducting infrastructure projects in Africa (Gounin, 2009; Dozon, 2003). Concomitantly, there
had never been so many Africans in France and French people in Africa as after independence.
France posted a large number of public servants to newly SSA independent states. Where there
were fewer than 7,000 colonial administrators in 1956, there were 8,749 people on Voluntary Service
in the newly independent states in 1963, 9,364 in 1973 and 10,292 in 1980 (Gounin, 2009, p. 23).
This phenomenon was not confined to the public sphere. A kind of “neo-colonial society” set up
in the SSA capitals of the former Empire. For instance, Dozon (2003) reports that almost 50,000
French people were living in Ivory Coast in 1970, five times more than in 1960. At the same time,
he has been in the collective psyche at the origin of political plots and intrigues in SSA formercolonies.
4Guinea attained independence in 1958. In Eastern Africa, Djibouti and Comoros gained inde-pendence respectively in 1977 and 1975.
5This peculiar mission is written in black and white in the statutes of the “Secrétariat Généraldes Affaires Africaines et Malgaches” (Bat, 2012, p. 137).
4

the fifth French Republic implemented an immigration policy in favor of the nationals of former
French African colonies.
This strategy ruled the FARs up to the 1990s. After 1989, it was gradually shelved. First, the
end of the Cold War left the Franco-African policy with no geopolitical and ideological grounds.
The French security logic, its unconditional support to autocratic regimes were no longer justified.
In June 1990, François Mitterand’s speach at the 16th Franco-African summit revealed a break
in the FARs. The French President announced that the French aid (in the broad sense) would
depend of the progress of democracy in African partners. This declaration called into question
one of the fundamental pillars of the FARs. Second, the 1990s marked the end of a generation
and the crumbling of inter-personal relations. In December 1993, the death of Felix Houphouet-
Boigny (President of the Ivory Cost from 1960 to 1993) was the first of a series of funerals of
Françafrique’s protagonists.6 Last but not least, the devaluation of the CFA franc in January 1994
jeopardized FARs. The devaluation of the CFA franc against the opinion of the African Presidents
was perceived as a disengagement of France.
Therefore, historical evidence suggests that the French influence in SSA fall apart at the begin-
ning of the 1990s. We further provide empirical evidence showing that the Franco-African special
relations affect bilateral trade only on the time period preceding 1990. The following section
presents our empirical strategy and data to investigate the French influence on trade.
3 Empirical model and data
To explore the impact of the French post-colonial influence on trade, we use a gravity model. The
gravity model links bilateral trade, Xfct, e.g. exports of country f (France) to country c at time t,
to their economic sizes (Yft and Yct), bilateral trade costs (τfct) and multilateral trade resistances
(Pft and Pct) (see Anderson and van Wincoop, 2003). The gravity equation can be written as:
Xfct =YftYctYwt
(τfctPftPct
)1−σ
, (1)
where Ywt is the nominal world income and σ > 1 the elasticity of substitution between goods.
Rearranging and taking natural logs, we obtain the following equation:
lnXfct = lnYftYwt
+ lnYct − (σ − 1) ln τfct + (σ − 1)(lnPft + lnPct), (2)
Trade costs (τfct) are generally modeled as a function of some observable factors, including
6Jacques Foccart dies in 1997, one year latter than Bokassa (President of RCA from 1966 to1966). This list ended with the death in June 2009 of Omar Bongo (President of Gabon from 1967to 2009).
5

bilateral distance between trade partners, the existence of a common border, a common language
or a common currency, and a regional trade agreement (RTA).
The trade cost function can take the following form:
τfct = distµ1
fc × exp (borderfc)µ2 × exp (comlangfc)
µ3 × exp (RTAfct)µ4 , (3)
Moreover, as explained in section 2, specific FARs after independence can decrease bilateral
trade costs and reinforce trade between France and its former SSA colonies. Therefore, to test
whether former French colonies in SSA exhibit a different post-colonial trade pattern, we construct
a dummy variable (FARct) denoting whether the importing country is a former French colony
located in SSA before 1990, the golden age of the French influence in Africa (see section 2).7
We obtain the following estimated equation:
lnXfct = αt + αc + βFARct + γCct − φ ln τfct + φ(lnPft + lnPct) + εfct, (4)
where αt are year fixed effects capturing the first term in equation (2) and αc are country fixed
effects accounting for time-invariant factors affecting trade, such as bilateral distance, common
language or common border. We also control for a vector of time-varying country variables (Cct),
such as countries’ GDP and population to account for size effects, and the number of years of
independence to control for trade erosion after independence.
Estimating properly equation (4) faces the challenge of accounting for the importer and ex-
porter multilateral resistance terms. In panel empirical analysis, these multilateral resistance in-
dices are generally introduced through country-year fixed effects. However, in our case, country-
year fixed effects would absorb the effect of French influence when the sample is restricted to French
bilateral trade. Therefore, we adopt another solution which consists in using the method proposed
by Baier and Bergstrand (2009) where multilateral resistance (MR) indices are approximated using
a first order log-linear Taylor series expansion. This methodology allows for time variation in the
MR terms. We compute three MR terms: MRDist; MRRTA and MRComlang, and include them
as additional explanatory variables. MRDist is the sum of a time-varying GDP-weighted average
of c’s log bilateral distance to all other countries and a time-varying GDP-weighted average of f’s
log bilateral distance to all other countries minus a third world resistance term. MRRTA and MR-
Comlang are defined analogously for the RTA and common language (Comlang) variables. Note
that these MR variables have been computed on a world sample including all countries as reporting
and partner countries. In keeping with the theory, the coefficient estimates for RTA and MRRTA
7These former colonies include Benin, Burkina Faso, Cameroon, Central African Republic,Chad, Congo, Djibouti, Gabon, Guinea, Ivory Coast, Madagascar, Mali, Mauritania, Niger, Senegaland Togo.
6

are restricted to have identical but oppositely signed coefficient values.8 Numerous recent papers
have also used this method to control for MR terms (e.g. Berger et al., 2013; Lavallée and Lochard,
2015). In robustness checks, we also use country-year fixed effects to account for MR indices when
estimating our model on a world sample.
To explore the impact of FAR on trade, we estimate equation (4) using data for bilateral
trade of France with 188 partner countries over the period 1960-2007 for aggregate trade and over
the period 1962-2007 for sectoral trade. Aggregate trade data are taken from the International
Monetary Fund’s Direction of Trade Statistics (DOTS), and sectoral trade come from the United
Nations Comtrade Database (SITC rev. 1 at the 4 digits level). These databases are the two main
sources that record bilateral trade over a long period of time. All variables and sources are defined
in Table 7 in appendix. The following section presents our preliminary results.
4 The French influence in SSA and trade
This section aims at providing quantitative evidence of a special trade pattern between France and
its former colonies of SSA during the Cold War. First, we investigate the evolution of French-
African trade over time. Second, we estimate the French-African trade gap on aggregate and
sectoral trade.
4.1 The French-African trade over time
To investigate the evolution of French-AFrican trade overtime, we first break down a dummy
variable FARct, using the value 1 for flows between France and SSA former colonies, into indicator
variables for each year between 1960 and 2007. Therefore, we create 49 dummies, FAR1 to FAR49,
which take the value 1 for French exports to former French colonies in SSA for each year (1 to
49) between 1960 and 2007. Then we estimate equation (4) with our SSA dummy variables and
controlling for multilateral resistance terms using the Baier and Bergstrand (2009) method.
Figure 1 displays the estimation results for our variables of interest. It plots coefficient estimates
of FARct dummies as well as their 95% confidence intervals.9 It shows that the end of the eighties
is a turning point for French exports to former SSA colonies. Indeed, the SSA dummies are positive
and significant from 1960 to 1986 becoming non significant after 1987. It means that, in reference
8In concrete terms, we estimate the model with (RTA- MRRTA) as an additional variable. Forthe MRDIST and MRComlang variables, we do not impose a similar restriction because the initialvariables (ln(Dist), Border and Comlang) do not vary across time and are thus captured by countryfixed effects.
9Note that we take FAR2007 as the reference group. Overall estimation results are availableupon request.
7

Figure 1: The SSA former French colony effect over time-.
50
.51
1.5
1960 1970 1980 1990 2000 2010year
95% conf.interval SSA coeff
with 2007, in each year before 1987, France exports more to former SSA colonies than to other
countries. Moreover, the extra-trade between France and its SSA former colonies decreases more
strongly after 1990 when it becomes negative. These results provide a first evidence of a gap
between French exports to former colonies of SSA and French exports to other countries specific
to the 1960-1990 period: the golden age of FARs.
Accordingly, in the following estimations, we will evaluate the French influence using a dummy
variable (FARct) that is equal to 1 for trade between a former French SSA colony and France for
each year between 1960 and 1989 and zero thereafter. None of our results are affected if we define
instead FARct as a dummy variable for trade between a former French SSA colony and France on
the time period 1960-1986.
4.2 The French influence in SSA and aggregate trade
Table 1 reports estimation results of equation (4) according to different estimation methods and
different samples. First, we display the results of the OLS estimation without country fixed effects
8
but controlling for multilateral resistance terms using the Baier and Bergstrand (BB) methodology
(column 1). Then, we use the OLS estimator with country fixed effects and without the BB multi-
lateral terms (column 2). In column 3, we add both country fixed effects and the BB multilateral
terms. Overall, our results are consistent with expectations. Countries with greater GDP tend to
import more from France (while population does not seem to exert a positive influence on trade).
The coefficient on the number of years of independence is negative and significant in columns (2)
and (3), indicating that trade flows decrease after independence. This result is consistent with the
literature (Head et al., 2010 ; Lavallée and Lochard, 2015).
Our estimations also show that France exports disproportionately more to its former SSA
colonies during the period 1960-1989, as compared to other countries. The FARct variable is
positive and significant in all three columns. Moreover, the coefficient estimate is much larger
when we do not control for fixed effects (column 1 vs. columns 2 and 3), which is in line with the
results obtained by Berger et al. (2012). This indicates that most of the variation in countries’
multilateral terms is captured through country fixed effects. Therefore, in all further regressions,
we control for both country fixed effects and the BB multilateral resistance terms. Our preferred
estimate in column (3) indicates that France exports 1.6 times more [= exp(0.47)] to a former SSA
colony than to other countries.
Recent papers advocate for the use of a Poisson quasi-maximum likelihood (PQML) estimator
when estimating a gravity model, because it incorporates the zero trade flows and it is robust to
different patterns of heteroskedasticity (Santos Silva and Tenreyro, 2006). In panel data, the fixed
effects Poisson (FEP) estimator has the same useful properties and controls for heteogeneity across
countries (e.g. Westerlund and Wilhelmsson, 2011). Estimation results obtained with the FEP
estimator (column 4) are close to the OLS estimates (column 3) and confirm our main finding,
i.e. between 1960 and 1989 France exports disproportionately more to its former SSA colonies.
In column (5), we restrict the sample to 38 low income countries.10 We still find a positive and
significant the Franco-African effect, reflecting an extra-trade gap between France and its former
SSA colonies during the period 1960-1989, as compared to trade between France and low income
countries. In column (6), we restrict the sample to 33 former French colonies. The FARct coef-
ficient is somewhat lower but still positive and significant at the 10% level.11 It indicates that
France exports 1.5 times more [= exp(0.38)] in former SSA colonies during the period 1960-1989,
as compared to other former French colonies. Thus, these results suggest that the FARct dummy
variable is not merely a former colonies’ effect. It is neither due to the more recent independence
10We consider the World Bank classification which defines low income economies as those witha GNI per capita of $1,045 or less in 2014.
11The less significant estimate is mostly explained by the increase in standard errors due to thelower number of observations.
9

of SSA countries12 since, in all regressions, we control for the number of years since independence.
We further test the robustness of this SSA trade gap later in this section.
Table 1: The effect of the French influence in SSA on French exports
Partner: All partners Low income Former Col.Method: OLS OLS OLS FEP OLS OLS
(1) (2) (3) (4) (5) (6)FAR1960−89 1.92a 0.53a 0.47a 0.35a 0.44a 0.38c
(0.33) (0.09) (0.10) (0.11) (0.15) (0.21)ln(GDP) 0.61a 0.82a 0.79a 0.82a 0.58a 0.68a
(0.19) (0.09) (0.08) (0.07) (0.13) (0.12)ln(Population) 0.13 -0.15 -0.06 0.24 0.75 -0.41
(0.13) (0.16) (0.15) (0.32) (0.57) (0.49)# of years since indep. 0.01 -0.01b -0.01a -0.02b -0.04a 0.01
(0.01) (0.00) (0.00) (0.01) (0.01) (0.01)Trade cost/MR terms:
ln(Distance) -1.70a - -1.49a -0.63b 1.15 2.57(0.50) (0.33) (0.28) (1.96) (1.81)
RTA 1.19a - 0.09 0.42b 2.09 0.51c
(0.29) (0.10) (0.19) (4.64) (0.26)Common language -0.69 - -1.48a -1.65a 0.00 1.75c
(0.48) (0.53) (0.53) (1.42) (1.02)Adj. R2 0.69 0.94 0.94 - 0.88 0.94# of observations 6618 6618 6618 6764 1435 1057Country fixed effects no yes yes yes yes yesYear fixed effects yes yes yes yes yes yes
Notes: The dependent variable is the log of French exports to country c in year t.Robust standard errors clustered at the country level in parentheses. a, b and c denotesignificance at the 1%, 5% and 10% level respectively.
What are the frontiers of this Franco-African trade gap? In Table 2 we provide additional
results concerning the geographical as well as time limits of the French influence. In column (1) we
modify the definition of the FARct dummy variable by assuming that the special relationships be-
tween France and its SSA former colonies last until the CFA Franc devaluation in 1994. Therefore,
we define the dummy variable FARct to equal 1 for trade between a former French SSA colony
and France for each year between 1960 and 1993 and zero thereafter. Estimation results show
that the FARct effect is slightly smaller than in previous estimation (Table 1, column 3) but still
12Former French colonies in SSA obtained their independence between 1958 and 1977 (1961 inaverage), whereas other former French colonies obtained their independence between 1943 and 1975(1955 in average).
10
positive and highly significant.13 In column (2), we explore the geographic limits of the French
influence by considering the relations between France and not only SSA former French colonies,
but also other francophone African countries. Following Carrère and Masood (2015), we define
francophone countries as those having French as the official language (de jure dimension) and in
which more than 20% of the population speaks French (de facto dimension). Therefore, we add
8 countries in the FARct group (Burundi, Democratic Republic of the Congo, Algeria, Equatorial
Guinea, Morocco, Mauritius, Rwanda, Tunisia). We obtain a positive and significant coefficient
for the transformed FARct variable, showing that special relationships are not restricted to former
SSA colonies. Finally, in column (3) we test whether the FARct effect is limited to French exports.
We consider exports of SSA former French colonies (16 countries) to all countries in the world,
and define a dummy variable equal to one when the importer country is France on the time period
1960-1989 and zero otherwise. Estimation results on this sample including country (and year) fixed
effects reveal that the former French colonies do not export more to France than to other countries
on the time period 1960-1989. Therefore, the Franco-African trade gap seems limited to French
exports and do not hold for SSA former colonies’ exports to France.
Finally, we test the robustness of our results by exploring alternative interpretations for our
findings in Table 3. First, it may be the case that our FARct effect comes from a multilateral
resistance effect. If, for whatever reasons not related to the French influence, multilateral resistance
of SSA former French colonies increase during the 1960-1989 period, they might be more prone to
trade with France. In previous tables we control for multilateral resistance terms using the Baier
and Bergstrand methodology and country fixed effects. However, the BB methodology only gives
an approximation of MR terms and country fixed effects do not capture time variation in MR
terms. Therefore, as a further test of robustness we estimate equation (4) on a worldwide bilateral
trade sample using country-year fixed effects and a number of bilateral controls (column 1).14
Our results show that the FARct coefficient is even larger than in the restricted sample (Table 1,
column 3). It indicates that, from 1960 to 1989, on average, France and its former colonies in SSA
trade 242% [= (exp(1.23)− 1) ∗ 100] more than any other pairs of countries.
Our results might also reflect the imports’ dynamic of former French colonies specific to the
1960-1989 period but not specific to France. To test this explanation we estimate our empirical
13To save on space, we only report estimations results using the OLS estimator but we obtainsimilar results using the FEP estimator.
14In a worldwide bilateral trade sample, we can introduce country-year fixed effects because theFARct variable is not perfectly collinear with country-year fixed effects, but on the downside, thissample comprises very different trade bilateral relations. We add several bilateral controls: theexistence of a former colonial relationship (Former colony), a dummy for countries that had thesame coloniser (Common coloniser) and for countries that are in a current colonial relationship(Still colony).
11

Table 2: Time and geographical limits of the French influence in SSA
Dependent variable: log French bilateral exports log SSA bilateral exports(1) (2) (3)
FAR1960−93 0.40a
(0.09)FAR1960−89 (incl. francophone) 0.39a
(0.09)FAR/France1960−89 0.29
(0.22)ln(GDP) 0.79a 0.79a 0.57a
(0.08) (0.08) (0.09)ln(Population) -0.07 -0.07 -0.33
(0.15) (0.15) (0.21)ln(GDP) exporter 0.56a
(0.10)ln(Population) exporter 0.97b
(0.50)# of years since indep. -0.02a -0.01a -
(0.00) (0.00)Trade cost/MR terms:
ln(Distance) -1.53a -1.49a 0.18(0.33) (0.34) (0.13)
RTA 0.09 0.12 1.44a
(0.10) (0.10) (0.16)Common language -1.62a -1.47a 0.40
(0.53) (0.53) (0.42)
Adj. R2 0.94 0.94 0.48# of observations 6618 6618 37459Country fixed effects yes yes yesYear fixed effects yes yes yes
Notes: In columns (1) and (2), the dependent variable is the log of French exports to country cin year t. In columns (3), the left hand side variable is the log of SSA former colonies’ exports tocountry c in year t. Robust standard errors clustered at the country level in parentheses. a, b and c
denote significance at the 1%, 5% and 10% level respectively.
12

model using the world total imports of SSA former French colonies as the dependent variable
(column 2).15 The 1960-1990 dummy is not statistically different from zero. This suggests that
extra-imports from France is due to trade diversion rather than trade creation (otherwise the
dummy would be positive and significant).
Finally, it is possible that the Franco-African trade gap hides a Francophone effect. Indeed,
in previous estimates, we found that francophone African countries import more from France
than other countries during the time period 1960-1989 (see Table 2, column 2). Therefore, as a
falsification exercise, we define a Francophonect dummy variable for the 16 francophone countries
that are not SSA former French colonies (Burundi, Belgium, Canada, Switzerland, Democratic
Republic of the Congo, Comoros, Algeria, Equatorial Guinea, Haiti, Israel, Lebanon, Luxembourg,
Morocco, Mauritius, Rwanda, Tunisia) over the time period 1960-1989 (column 3). The coefficient
on this variable is not significant, showing that there is no extra-trade between France and these
francophone non SSA former French colonies specific to the period 1960-1989. In the next section,
we investigate the sectoral trade dimension of the French influence in SSA.
4.3 The French influence in SSA and sectoral trade
We now investigate which product groups are the most affected by the French influence in SSA.
Our first strategy consists in running separate regressions for groups of products usually used in the
literature. We disaggregate exports using the Standard International Trade Classification (SITC).
Table 4 reports estimation results for each SITC products group for the period 1962-2009. It
shows that the French post-colonial influence in SSA has a positive impact on French exports of
manufactured goods (SITC 5 to 8) as well on exports of ‘food and live animals’ (SITC 0) and
‘Beverages and tobacco’ (SITC 1). The extra-trade gap goes from 30% for beverages and tobacco
and 36% for machinery and transport equipment to 82% for chemicals. The large variety of product
groups characterized by an extra-trade with France over the period 1960-1989 is surprising. One
could have expected it to be limited to ‘Machinery and transport’, ie. the most politically sensitive
goods according to Fuchs and Klann (2013). Indeed, negotiations over the purchase of such products
are generally carried out during the course of high rank trade talks. The mechanisms at stake may
thus go beyond the state of political relations between countries and may also be operating through
consumer demand since a positive coefficient is found for consumption goods, namely ’Food and live
animals’. We also disaggregate exports following the classification by Rauch (1999) into reference-
priced, homogenous and differentiated goods. Indeed, one can think that the extra-trade increases
with the complexity of goods because FAR can ease the matching of international buyers and sellers
15In this specification, we compute multilateral resistance terms for total trade using the method-ology provided by Berger and al. (2012) in their Appendix.
13
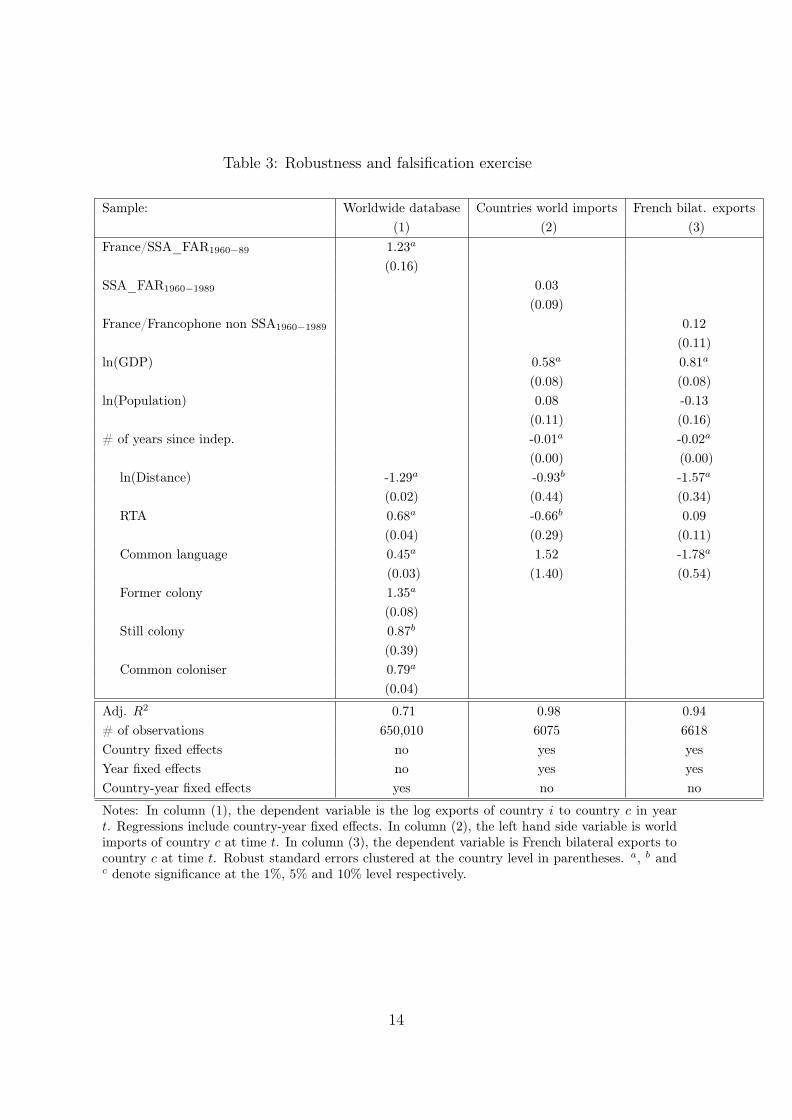
Table 3: Robustness and falsification exercise
Sample: Worldwide database Countries world imports French bilat. exports(1) (2) (3)
France/SSA_FAR1960−89 1.23a
(0.16)SSA_FAR1960−1989 0.03
(0.09)France/Francophone non SSA1960−1989 0.12
(0.11)ln(GDP) 0.58a 0.81a
(0.08) (0.08)ln(Population) 0.08 -0.13
(0.11) (0.16)# of years since indep. -0.01a -0.02a
(0.00) (0.00)ln(Distance) -1.29a -0.93b -1.57a
(0.02) (0.44) (0.34)RTA 0.68a -0.66b 0.09
(0.04) (0.29) (0.11)Common language 0.45a 1.52 -1.78a
(0.03) (1.40) (0.54)Former colony 1.35a
(0.08)Still colony 0.87b
(0.39)Common coloniser 0.79a
(0.04)
Adj. R2 0.71 0.98 0.94# of observations 650,010 6075 6618Country fixed effects no yes yesYear fixed effects no yes yesCountry-year fixed effects yes no no
Notes: In column (1), the dependent variable is the log exports of country i to country c in yeart. Regressions include country-year fixed effects. In column (2), the left hand side variable is worldimports of country c at time t. In column (3), the dependent variable is French bilateral exports tocountry c at time t. Robust standard errors clustered at the country level in parentheses. a, b andc denote significance at the 1%, 5% and 10% level respectively.
14
of differentiated products. Table 4 shows the results of the estimation of separate regressions for
each type of goods. The FAR dummy is positive and highly significant in each regression, meaning
that the extra-trade concern both French exports of differentiated, homogenous or reference priced
goods.
To analyse further the French influence in SSA, we undertake a second strategy that consists
in interacting the FAR variable with dummy variables for broad categories of products. Our
intention is to test whether the effects of the FAR are stronger for such products. We focus on three
categories. The first one is industrial products. Indeed, our previous regressions tend to indicate
that manufactured goods are more strongly affected by the French influence. We compute a dummy
variable equals to one if the product traded is an industrial product according to the International
Standard Industrial Classification of All Economic Activities (ISIC). The second category concerns
arms since the Franco-African relation is often associated with military interventions and France
is historically an important world arms producer and exporter. The binary variable Arms takes
the value one if the product traded belongs to the division 95 of SITC rev 1 classification that
gathers all firearms of war and ammunition from armoured fighting vehicles to artillery weapons,
machine guns and so on. The third category is luxury goods. After independence most of the
former French colonies of SSA had been ruled by autocrats known to confuse their personal wealth
with their country wealth.16 As France is a major player in the luxury good world market, we
expect the FAR to go hand in hand with greater French exports of high-end varieties. We construct
an indicator variable for high end product following the strategy developed by Fontagné and Hatte
(2014). In a first step, we identify product groups exported by the firms belonging to the French
association of luxury goods (Comité Colbert). Then, after having excluded outliers,17 we define
high-end product trade flows as observations in the upper decile of the distribution of unit values
for each product and year.
Our estimation results show no specific effect of the French influence in SSA on French exports
of industrial products and arms, but they reveal a larger effect for French exports of luxury goods.
For these products, the SSA trade gap amounts to 63%.
As a third strategy, we test a thesis developed by Marseille (1984) according to which France
used its colonies as an outlet for its declining industries. We approximate French competitiveness
across industries and years using the Balassa measure of comparative advantage (RCA). This index
16The involvement of some of them or of their relatives in money laundering scandals, as well asin the in cases of ill-gotten gains and stolen assets actually filed in France illustrate the corruptionof SSA elites.
17The upper and lower extreme unit values were flagged computing the difference between theunit value of each flow and the mean of the unit value of each product group exported calculatedby decade. We retain only the observations between the 5th and the 95th percentiles
15

can be written as:
RCAcit =xcit∑c xcit
/
∑i xcit∑
i
∑c xcit
, (5)
where xcit is the exports of country c in a 4-digit SITC industry i in year t. A RCA index above
one denotes that the country has a comparative advantage in producing in industry i. On the
contrary, if the ratio is less than unity, the country is said to have a comparative disadvantage in
industry i, since its share of world exports in industry i is lower than the average. We use the RCA
index in its continuous form as well as a dummy variable indicating whether or not country c has
a comparative advantage in industry i in year t. We introduce the RCA index in Equation (4) and
interact it with the FAR dummy. This specification allows the effect of the FAR to differ across
industries depending on whether France has a comparative advantage in industry i. Bottom lines
of Table 4 report our estimation results. The coefficients of the RCA variables are positive and
statistically significant, meaning that France exports more in industries where it has a comparative
advantage. The FAR coefficient is positive and statistically significant, but the FAR∗RCA is
negative and significant indicating that the French influence enhances French exports in industries
in which France has a comparative disadvantage rather than a comparative advantage. In other
words, the average effect of FAR on French exports in every industry is positive, but it is larger in
industries in which France was least competitive. Overall, these results provide evidence that over
1962-1990, former French SSA colonies were an outlet of ailing French industries.
5 Exploring the channels of the Franco-African trade
gap
As discussed is section 2, several mechanisms could explain the Franco-African trade gap. Some are
political and are linked with interpersonal ties or international politics. Others are economic-related
and deal, for instance, with development assistance, or business networks.
5.1 Political drivers
We investigate the political dimensions of the FAR, that is to say the close interpersonal ties
maintained between French and African governments after independence, as well as the political
proximity between France and its former colonies of SSA during the Cold War. As explained in
section 2, the latter took the form of a kind of contract: French support and military protection
against defense of French positions in the international arena. Several international databases allow
to measure both elements. To quantify French support we use the data on military interventions
collected by Kisangani and Pickering (2007). We compute a dummy variable equals to one if France
16
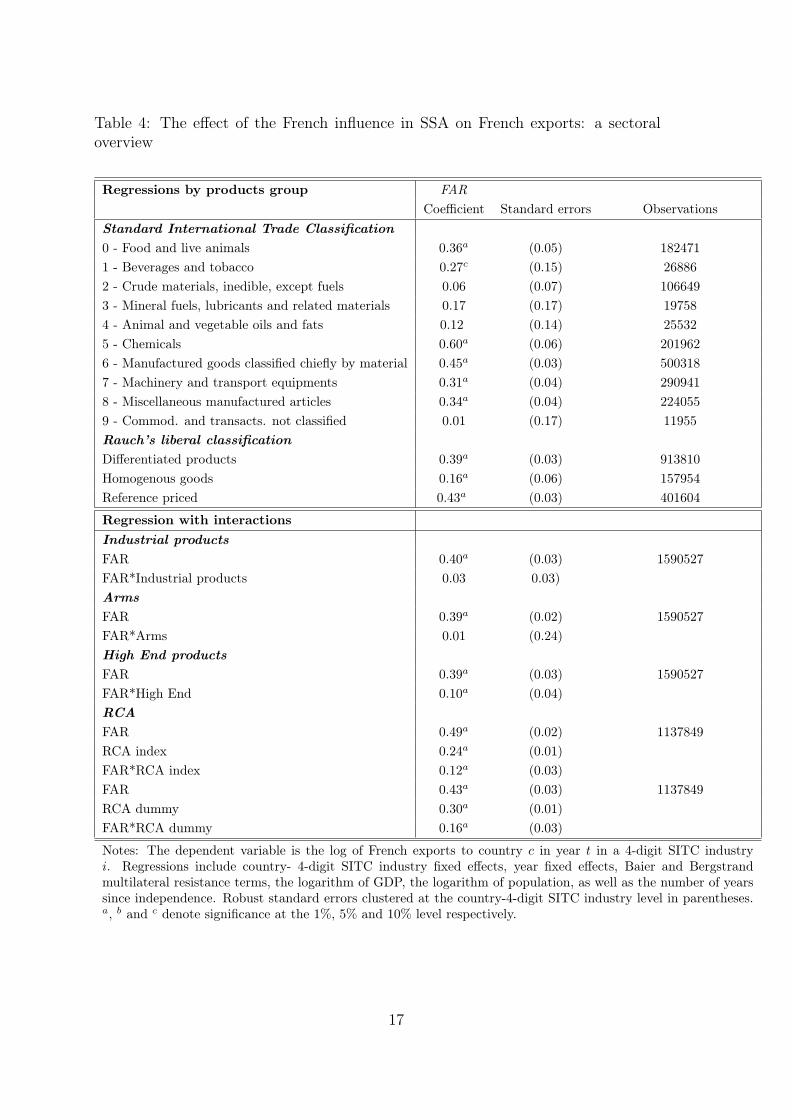
Table 4: The effect of the French influence in SSA on French exports: a sectoraloverview
Regressions by products group FARCoefficient Standard errors Observations
Standard International Trade Classification0 - Food and live animals 0.36a (0.05) 1824711 - Beverages and tobacco 0.27c (0.15) 268862 - Crude materials, inedible, except fuels 0.06 (0.07) 1066493 - Mineral fuels, lubricants and related materials 0.17 (0.17) 197584 - Animal and vegetable oils and fats 0.12 (0.14) 255325 - Chemicals 0.60a (0.06) 2019626 - Manufactured goods classified chiefly by material 0.45a (0.03) 5003187 - Machinery and transport equipments 0.31a (0.04) 2909418 - Miscellaneous manufactured articles 0.34a (0.04) 2240559 - Commod. and transacts. not classified 0.01 (0.17) 11955Rauch’s liberal classificationDifferentiated products 0.39a (0.03) 913810Homogenous goods 0.16a (0.06) 157954Reference priced 0.43a (0.03) 401604
Regression with interactionsIndustrial productsFAR 0.40a (0.03) 1590527FAR*Industrial products 0.03 0.03)ArmsFAR 0.39a (0.02) 1590527FAR*Arms 0.01 (0.24)High End productsFAR 0.39a (0.03) 1590527FAR*High End 0.10a (0.04)RCAFAR 0.49a (0.02) 1137849RCA index 0.24a (0.01)FAR*RCA index 0.12a (0.03)FAR 0.43a (0.03) 1137849RCA dummy 0.30a (0.01)FAR*RCA dummy 0.16a (0.03)
Notes: The dependent variable is the log of French exports to country c in year t in a 4-digit SITC industryi. Regressions include country- 4-digit SITC industry fixed effects, year fixed effects, Baier and Bergstrandmultilateral resistance terms, the logarithm of GDP, the logarithm of population, as well as the number of yearssince independence. Robust standard errors clustered at the country-4-digit SITC industry level in parentheses.a, b and c denote significance at the 1%, 5% and 10% level respectively.
17

intervenes in country c at time t. Votes at United Nations General Assembly give a good proxy of
States’ political proximity (see Mityakov, Tang and Tsui, 2013). We use a dyadic voting similarity
index ranging from 0 to 1 (1 denoting most similar interests) taken from Voeten, Strezhnev and
Bailey (2009). It is equal to the total number of votes where both states agree divided by the total
number of joint votes. Interpersonal ties, on the other hand, are by far the most difficult to grasp
in an objective way. This paper uses data on diplomatic visits to capture this proximity between
the French and the SSA top level officials. We gather original data on bilateral visits between
France and foreign countries over the 1977-2007 period from the French Ministry of Foreign Affairs.
Our data cover bilateral visits at the level of Head of State (government), Minister, Secretary of
State, but also advisers and unofficial visits. These information are taken from the database
“Evènements de politique internationale” of the French Ministry of Foreign Affairs that records
since 1977 quasi exhaustively all significant events in France’s international relations.These data
offer several advantages. Above all, they provide an objective and time-varying measure of the
strength of the relations between France and the African States and administrations. Thanks to
these data, we know how many time a year a French President meets a Malian or a Malagasy one,
or how many time a French minister meets his African counterparts. We acknowledge that these
data only allow us to observe the tip of the iceberg. They do not encompass all the elements of the
French inter-actions with its former colonies of SSA, notably the ones of the French Intelligence
Services. However, Françafrique is not only a question of “barbouzes”.18 We believe our data tell us
enough on the proximity of the top level officials.19 Furthermore, these data allow for international
comparisons. We are thus able to compare the number of visits between French and SSA top level
officials and the number of equivalent visits between French and other countries officials. Lastly,
our data cover a time span long enough (1977-2007) to take into account the general evolution of
foreign relations and the stop and goes in the French African relations. In all, we recorded 13,770
bilateral visits among which almost 60% were exterior to France (i.e. were external visits) and one
quarter involved the Head of State (government) that is to say Presidents, Prime Ministers, Kings
or Queens and so on. Our data provide much more information than other papers focusing on the
impact of state visits. For instance, Nitsch (2007) uses a sample of 558 official visits by French
Presidents on the time period 1948-2003 (along with visits by Heads of State of Germany and the
United States). We use the number of bilateral visits between France and country c at time t− 1
as a proxy of interpersonal ties.
18Pejorative, the term “barbouzes” marks out intelligence services agents or officers as well asadvisers and special correspondents appointed by Paris to support a President “friend of France”(Bat, 2015).
19It is worth noting that these data also record private visits. For instance, we know if on theoccasion of a personal trip to France, Omar Bongo (President of Gabon from 1967 to 2009) meetsJacques Chirac (French Prime Minister from to 1986 to 1988; and French President from 1995 to2007).
18
To test for these political channels, we introduce these additional explanatory variables to
our model and interact them with our FAR dummy. Table 5 presents our estimation results. We
estimate our model on various samples: the whole sample (column 1), a sample restricted to luxury
goods (column 2) and samples for each SITC products groups affected significatively (at the 5%
level) by the French influence (columns 3 to 7). Panel A reports results for voting similarity, Panel
B for military interventions and Panel C for bilateral visits. In almost all cases, the coefficient
of political variables is positive and significant. In other words, France exports more to countries
where it intervenes militarily, to countries that share similar positions in the international arena and
to countries with which it has maintained closed relations. The sign and the statistical significance
of interaction terms depend on the political variable at stake. It is positive and significant at
the 5% level when using the voting similarity index (except for food, columns 3), denoting that
the effect of the FAR increases with proximity in the international politics. As regards, military
interventions and bilateral visits, the coefficient of the interaction variables is, in almost all cases,
negative and significant. Such a result means that the SSA trade gap decreases with the number
of bilateral visits or during French military interventions. It is worth noting that when using the
voting similarity index, the coefficient of the FAR variable turns non significant. This coefficient
provides the estimated impact of the FAR for an hypothetical country that never voted as France
at the United Nations General Assembly. A coefficient not statistically different from zero suggests
that international politics explain nearly all the effect of the FAR on French exports. This results
holds at the aggregate as well as at the disaggregated level, with the exception of ‘Machinery and
transport equipments’. For this specific product group the coefficient of the FAR variable is now
negative and significant at the 5% level indicating that once we control for international politics,
France exports less machinery and transport equipments to its former SSA colonies during the
1962-1990 period than to any comparable countries. Such a result shows that much of the SSA
trade gap is explained by the political proximity of France and its former colony in the international
arena.
5.2 Economic and other potential drivers
We now turn to the potential alternative explanations for the SSA trade gap. As explained in
section 2, the FAR had also economic demonstrations such as development assistance, migration
and currency arrangements. All of these channels could potentially explain the extra French exports
to SSA former colonies before 1990. Indeed, foreign aid can be exports-enhancing for the donor
country (France in our case). In an intertemporal model of trade, Djajić, Lahiri and Raimondos-
Moller (2004) find that in the presence of habit-formation effects, aid may shift preference of the
recipient in the favour of the donor’s exports goods in future periods. Using a multi-donor gravity
19

Table 5: Exploring the political channels of the Franco-African trade gap
Sample: World H-E SITC 0 SITC 5 SITC 6 SITC 7 SITC 8Food Chem. Manuf. Mach. Msc. manuf.
(1) (2) (3) (4) (5) (6) (7)Panel A: voting similaritySSA_FormerCol -0.03 -0.47 0.25 -0.07 -0.21b 0.08 -0.08
(0.05) (0.46) (0.16) (0.14) (0.08) (0.11) (0.11)Voting similarity index 0.33a 1.68a 1.06a -0.17 0.27b 0.33b 0.65a
(0.05) (0.25) (0.17) (0.16) (0.09) (0.11) (0.12)SSA_FormerCol*Voting similarity index 0.71a 1.55b 0.17 1.18a 1.10a 0.35a 0.69a
(0.08) (0.8) (0.25) (0.22) (0.13) (0.18) (0.18)# of observations 1456438 42078 166025 185894 458219 267493 205049
Panel B: military interventionsSSA_FormerCol 0.40a 0.41a 0.36a 0.62a 0.45a 0.32a 0.33a
(0.02) (0.07) (0.05) (0.05) (0.03) (0.04) (0.04)Military intervention 0.08a (0.02 0.11b 0.16a 0.04c 0.10a 0.03
(0.01) (0.08) (0.04 ) 0.04 (0.03) (0.03) (0.03)SSA_FormerCol* Military int. -0.05b 0.18 -0.01 -0.24a -0.03 -0.17b 0.18b
(0.03) (0.17) (0.08) (0.07) (0.05) (0.06) (0.07)# of observations 1590527 45207 182471 201962 500318 290941 224055
Panel C: bilateral visitsSSA_FormerCol 0.43a 0.43a 0.38a 0.74a 0.46a 0.36a 0.39a
(0.02) (0.09) (0.06) (0.06) (0.03) (0.04) (0.04)Log of # of bilateral visits 0.04a 0.01 0.06a 0.02b 0.04a 0.04a 0.04a
(0.00) (0.01) (0.01) (0.01) (0.00) (0.00) (0.00)SSA_FormerCol*Log of # of bil. visits -0.04a 0.00 0.03 -0.08a -0.07a -0.05a -0.04a
(0.00) (0.05) (0.02) (0.03) (0.01) (0.01) (0.02)# of observations 1213749 41512 145275 151369 374171 224155 171483
Notes: The dependent variable is the log of French exports to country c in year t in a 4-digit SITC industryi. Regressions include country- 4-digit SITC industry fixed effects, year fixed effects, Baier and Bergstrandmultilateral resistance terms, the logarithm of GDP, the logarithm of population, as well as the number of yearssince independence. Robust standard errors clustered at the country-4-digit SITC industry level in parentheses.a, b and c denote significance at the 1%, 5% and 10% level respectively.
20

model of trade Martínez-Zarzoso et al. (2014) show that every aid dollar spent leads to an increase
in donor’s exports ranging from $0.50 in the short run to $1.8 in the long run. The large number
of public servants posted to newly SSA independent states had probably favoured French exports
through the effect of social and business networks,20 but also through the preferences of French
expatriates for the varieties produced in France, thereby directly enhancing the volume of bilateral
trade. Lastly monetary arrangements, such as fixed exchange rate regime, may ease trade.
To test for these alternative channels, we introduce additional explanatory variables to our
model and interact them with our FAR dummy. We test for foreign aid using the total net Overseas
Development Assistance (hereafter ODA) disbursements in current US$21 from 1962 to 2007 taken
from the OECD Development Database on Aid from the DAC Members. We use the total number
of French people living in country c at time t to test for the migration channel. Lastly, to control
for the effect of monetary arrangements, we compute a dummy variable denoting whether trade
partners were members of the same monetary union or whether they had a fixed exchange rate
regime between them at time t.
Table 6 depicts our estimation results for the whole sample (column 1), a sample restricted
to luxury goods (column 2) and samples for each SITC product groups affected significatively (at
the 5% level) by the French influence (columns 3 to 7). Panel A reports results for ODA. In
line with our expectations, our results indicate that aid has a positive effect on French exports
at the aggregated as well as at the sectoral level (except for ‘Food and live animals’ products).
They also show that development assistance reduces the Franco African trade gap on aggregated
exports (column 1) and French exports of luxury goods (column 2) and of manufactured products
(columns 6 and 8). The marginal effect of the French influence for a SSA former French colony
with a value of Log of ODA equal to the sample average is still positive and significant.
In Panel B, we test for the migration explanation. Our estimation show that migration en-
hances French exports at the aggregated as well as at the sectoral level. The coefficient of the
interaction term is positive and significant at the 1% for regression computed on the global sam-
ple (column 1) and a sample restricted to chemicals products (column 4). Such results indicate
the SSA trade gap increases with the number of French people living in former SSA colonies
during the 1960-1990 period. It is worth noting that for several products, namely ‘Chemicals’
(column 4), ‘Manufactured goods classified chiefly by material’ (column 5) and ‘Machinery and
transport equipment’ (column 6) the introduction of the Migration variable and of the interaction
term FAR∗Migration changes drastically our findings. The FAR coefficient is no longer statisti-
cally significant. This suggests that, for such products, the number of French expatriates explain
20See Rauch (2001) and Rauch and Trindade (2002), among others, for a discussion a discussionof the trade-enhancing effect of networks.
21The total net ODA disbursements are the sum of grants, capital subscriptions, total net loansand other long term capital.
21
nearly all the extra-trade between France and SSA former French colonies. Unfortunately, we are
not able to disentangle the business from consumer preferences effect.
Panel C reports our estimation results for the currency arrangements explanation. Our esti-
mation results are quite heterogenous. They show that currency arrangements have no effect on
global French exports (column 1), on French exports of chemicals (column 4). However, they have
a positive and statistically significant effect on French exports of ‘Food and live animals’ (column 3)
and ‘Miscellaneous manufactured articles’ (column 7), and a negative effect on exports of luxury
goods (column 2), ‘Manufactured goods classified chiefly by material’ (column 5) and ‘Machinery
and transport equipments’ (column 6). When statistically different from zero, the coefficient of the
interaction term FAR∗Currency_ar is positive and significant indicating that currency arrange-
ments increase the Franco African trade gap. Nevertheless, our findings suggest that currency
arrangements alone do not explain this exports gap, except for luxury goods (column 2). Indeed,
for this category of products, the addition of the Currency_ar variable and of the interaction
term FAR∗Currency_ar leads the FAR variable to turn non significant. This results suggests
that currency arrangements between France and its former colonies of SSA explain most of the
trade gap observed for High End products. The over-evaluation of the CFA Franc until 1994 may
have favored the purchasing power of the African elite.
In unreported regressions, we also test for a price channel. Indeed, it is often argued that
African countries and especially former French colonies of SSA used to pay more for their imports
(see Yeats, 1990). In such conditions, the Franco-African trade gap may just hide a price effect.
We use unit value as a proxy of price, and compute a ratio between the price paid by country c
for good i (4-digit SITC industry) in year t and the world (or developing countries) average price
observed for good i (4-digit SITC industry) in year t. Our results indicate that the Franco African
trade gap is not driven by difference in prices.
6 Conclusion
This paper investigates the consequences of the FAR on the pattern of French exports. Until the
beginning of the 1990s, France and its former SSA colonies had close and enduring political and
economical relations. Studying French exports after 1960, this paper aims at assessing whether
France exported disproportionately to its former SSA colonies as suggested by the FAR nexus. It
also seeks to explain the sources of this peculiar trade pattern. To the best of our knowledge, it is
the first paper to address systematically the effects of the French influence on trade and to shed
light on its drivers.
Our study yields a number of sobering results. Our estimations reveal peculiar trade patterns
between France and its SSA former colonies as compared to other comparable countries. During the
22
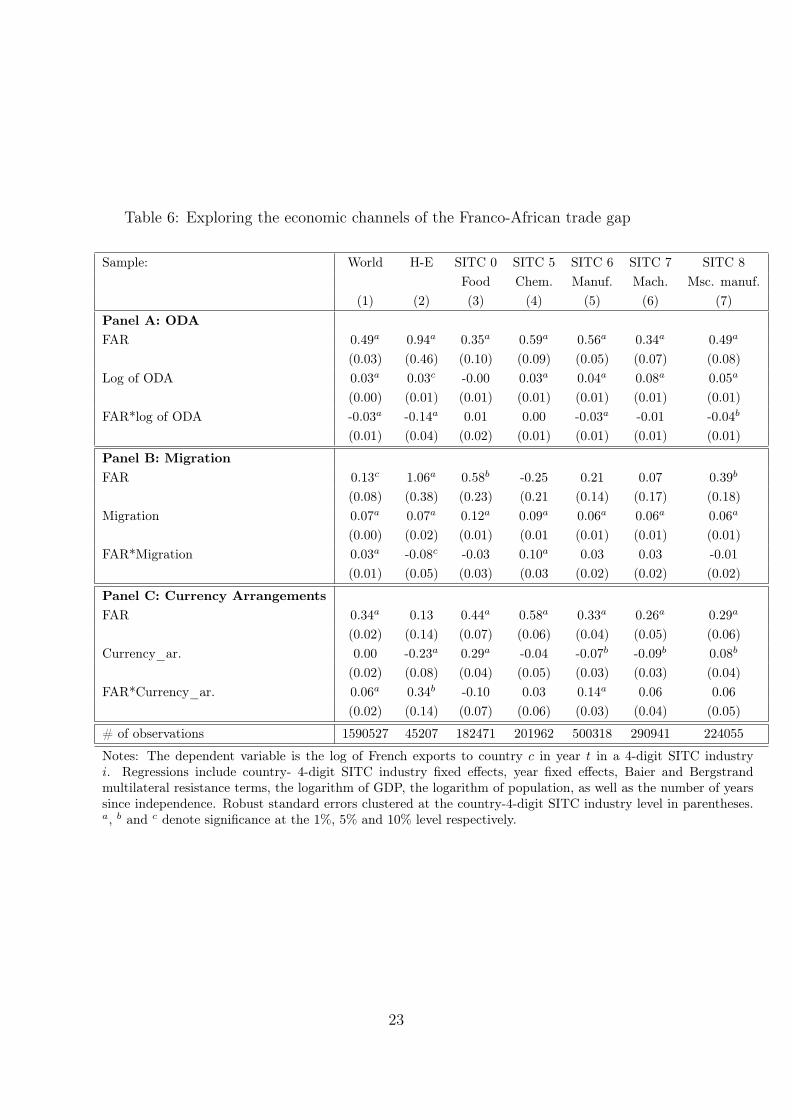
Table 6: Exploring the economic channels of the Franco-African trade gap
Sample: World H-E SITC 0 SITC 5 SITC 6 SITC 7 SITC 8Food Chem. Manuf. Mach. Msc. manuf.
(1) (2) (3) (4) (5) (6) (7)Panel A: ODAFAR 0.49a 0.94a 0.35a 0.59a 0.56a 0.34a 0.49a
(0.03) (0.46) (0.10) (0.09) (0.05) (0.07) (0.08)Log of ODA 0.03a 0.03c -0.00 0.03a 0.04a 0.08a 0.05a
(0.00) (0.01) (0.01) (0.01) (0.01) (0.01) (0.01)FAR*log of ODA -0.03a -0.14a 0.01 0.00 -0.03a -0.01 -0.04b
(0.01) (0.04) (0.02) (0.01) (0.01) (0.01) (0.01)
Panel B: MigrationFAR 0.13c 1.06a 0.58b -0.25 0.21 0.07 0.39b
(0.08) (0.38) (0.23) (0.21 (0.14) (0.17) (0.18)Migration 0.07a 0.07a 0.12a 0.09a 0.06a 0.06a 0.06a
(0.00) (0.02) (0.01) (0.01 (0.01) (0.01) (0.01)FAR*Migration 0.03a -0.08c -0.03 0.10a 0.03 0.03 -0.01
(0.01) (0.05) (0.03) (0.03 (0.02) (0.02) (0.02)
Panel C: Currency ArrangementsFAR 0.34a 0.13 0.44a 0.58a 0.33a 0.26a 0.29a
(0.02) (0.14) (0.07) (0.06) (0.04) (0.05) (0.06)Currency_ar. 0.00 -0.23a 0.29a -0.04 -0.07b -0.09b 0.08b
(0.02) (0.08) (0.04) (0.05) (0.03) (0.03) (0.04)FAR*Currency_ar. 0.06a 0.34b -0.10 0.03 0.14a 0.06 0.06
(0.02) (0.14) (0.07) (0.06) (0.03) (0.04) (0.05)
# of observations 1590527 45207 182471 201962 500318 290941 224055
Notes: The dependent variable is the log of French exports to country c in year t in a 4-digit SITC industryi. Regressions include country- 4-digit SITC industry fixed effects, year fixed effects, Baier and Bergstrandmultilateral resistance terms, the logarithm of GDP, the logarithm of population, as well as the number of yearssince independence. Robust standard errors clustered at the country-4-digit SITC industry level in parentheses.a, b and c denote significance at the 1%, 5% and 10% level respectively.
23
period 1960-1989, the golden age of FAR, France exported significantly more to these countries than
to other countries. It suggests that France used these special FARs to serve its own interests and
kept its former colonies as a private ground. Suggestion indirectly confirmed by the fact that the
FAR effect was stronger in industries in which France suffered from a comparative disadvantage.
Furthermore, we show that political drivers and, in particular political proximity, are the main
channels explaining the extra-trade between France and SSA former colonies during the time
period 1960-1989. Indeed, whereas migration explains the FAR trade gap for some specific products
(chemical, manufactured goods, machinery and transport equipments), State’s political proximity
is the only channel accounting for the whole trade gap.
This paper contributes to several bodies of literature. It complements the literature on the
the general question of whether power is an important determinant of international trade in the
recent past. It extents it to another power than United States,France, and to another context
: post-colonial relations. It contributes also to the debate on Sub-Saharan Africa’s isolation in
international trade, and add another explanation, foreign influence.
24

Appendix
25
References
Anderson, J. and van Wincoop, E. (2003). “Gravity with Gravitas: A Solution to the Border
Puzzle”. American Economic Review, 93(1): 170-192.
Baier, S. and J. Bergstrand (2009). “Bonus Vetus OLS: A Simple Method for Approximating
International Trade-Cost Effects using the Gravity Equation”. Journal of International Eco-
nomics 77, pp. 77-85.
Bat, J-P. (2012). Le syndrome Foccart. La politique française en Afrique, de 1959 Ã nos jours.
Folio histoire, Editions Gallimard, Paris, 835 pp.
Bat, J-P. (2015). La fabrique des “Barbouzes”. Histoire des reseaux Foccart en Afrique. Nouveau
monde éditions, Paris, 509 pp.
Berger, D., Easterly, W., Nunn, N. and Satyanath, S. (2013). “Commercial Imperialism? Political
Influence and Trade During the Cold War”. American Economic Review, 103, 863-896.
de Sousa, J. and Lochard, J. (2005). “Do Currency Barriers Solve the Border Effect Puzzle?
Evidence from the CFA Franc Zone”. Review of World Economics, 141(3), pp. 422-441 .
de Sousa, J. and Lochard, J. (2012). “Trade and Colonial Status”. Journal of African Economies,
21 (3), pp. 409-439.
de Sousa, J. (2012). “The Currency Union Effect on Trade is Decreasing over time”. Economics
Letters 117, 917-920.
Djajić, S., Lahiri, S. and Raimondos-Moller, P. (2004). “Logic of Aid in an Intertemporal Setting”.
Review of International Economics, 12(1), pp. 151-161.
Dozon, J-P. (2003). Fréres et sujets. La France et l’Afrique en perspective. Editions Flammarion,
Paris, 350 pp.
Fontagné, L. and Hatte, S. (2013) “European High-End Products in International Competition”.
G-MonD Working Paper nÂ◦37, Paris School of Economics.
Fuchs, A. and Klann, N-H. (2013). “Paying a Visit: The Dalai Lama Effect on International
Trade”. Journal of International Economics 91(1), pp. 164-177.
Gounin, Y. (2009). La France en Afrique. De Boeck, Bruxelles, collection le point sur... Politique,
192 pp.
Head, K., Mayer, T. and Ries, J. (2010). “The Erosion of Colonial Trade Linkages after Indepen-
dence”. Journal of International Economics 81(1), pp. 1-14.
26

Kisangani, E.F. and Pickering, J.(2007) “Diverting with Benevolent Military Force: Reducing
Risks and Rising above Strategic Behavior”. International Studies Quarterly, 51(2), pp.
277-299.
Lavallée, E., Lochard, J. (2015). “The Comparative Effects of Independence on Trade”. Journal
of Comparative Economics, 43, pp. 613-632..
Marseille, J. (1984). Empire colonial et capitalisme français. Histoire d’un divorce. Paris, Albin
Michel, collection “L’aventure humaine”, 464 pp.
Martin, P., Mayer, T. and Thoenig, M. (2008). “Make Trade not War?”. Review of Economic
Studies, 75, pp. 865-900.
Martínez-Zarzoso, I., Nowak-Lehmann, F., Parra, M. D. and Klasen, S. (2014). “Does Aid Pro-
mote Donor Exports? Commercial Interest versus Instrumental Philanthropy”. Kyklos,
67(4), pp. 559-587.
Mityakov, S., Tang, H. and Tsui, K. K. (2013). “International Politics and Import Diversification”.
Journal of Law and Economics, 56(4), pp. 1091-1121.
Nitsch, V. (2007). “State Visits and International Trade”. The World Economy, 30(12), pp.1797-
1816.
Ozden, C., Parsons, C., Schiff, M., Walmsley, T. L. (2011). “Where on Earth is Everybody?
The Evolution of Global Bilateral Migration, 1960-2000”. World Bank Economic Review 25,
12-56.
Rauch, J. E. (1999). “Networks Versus Markets in International Trade.” Journal of International
Economics, 48 (1), pp. 7-35.
Rauch, J. E. (2001). “Business and Social Networks in International Trade”. Journal of Economic
Literature 39, pp. 1177-1203.
item Rauch, J. E. and Trindade, V. (2002). “Ethnic Chinese Networks In International
Trade”. The Review of Economics and Statistics, 84(1), pp. 116-130.
Rose, A. K. (2007). “The Foreign Service and Foreign Trade: Embassies as Export Promotion”.
The World Economy, 30(1), pp. 22-38.
Ruffin, J.C. (2009). “Préface” in Gounin, Y. (2009). La France en Afrique. De Boeck, Bruxelles,
collection le point sur... Politique, 192 pp.
Shambaugh, J. C. (2004). “The Effect of Fixed Exchange Rates on Monetary Policy”. Quarterly
Journal of Economics, 119, pp. 301-352.
27
Voeten, E., Strezhnev, A. and Bailey, M., (2009). “United Nations General Assembly Voting
Data”, http://hdl.handle.net/1902.1/12379, Harvard Dataverse, V15 [UNF:6:4UYsfBIXyq4wMr/7+hhByw==]
Yeats, A. J.(1990). “Do African countries pay more for imports? Yes”. The World Bank economic
review, 4(1), pp. 1-20.
28

Table 7: Data description and sources
Xfct At the aggregated level trade data (exports of France to all countries, i.e. imports ofall countries from France) come from the IMF (DOTS database). We use mirror datato improve the coverage of these data. When import data are missing or recorded aszero, we replace these data with the reverse flow (exports), where available. As inHead et al. (2010), we add 10% to the export flow to adjust for the fact that exportsare reported FOB and imports are recorded CIF. Sectoral trade data at the four-digitlevel come from commodity trade statistics database of the United Nations StatisticsDivision (UN Comtrade).
GDPct; Popct Current GDP and population come from the World Bank (World Development Indi-cators, WDI).
Distancefc;Commonlanguagefc
Bilateral distance and common language dummies come from the cepii database. Seewww.cepii.fr/francgraph/bdd/distances.htm
Former colonyfc Dummy variable equals to 1 if country c was a colony of country f in 1945 taken fromthe cepii database. See www.cepii.fr/francgraph/bdd/distances.htm
Commoncoloniserfc
Dummy variable equals to 1 if country f and c were part of the same colonial Empiretaken from the cepii database. See www.cepii.fr/francgraph/bdd/distances.htm
Still colonyfct Dummy variable equals to 1 if country c is a colony of country f at time t taken fromthe cepii database. See www.cepii.fr/francgraph/bdd/distances.htm
RTAfct The Regional Trade Agreement dummy is computed using information from the WTO(see de Sousa, 2012).
Francafrct Dummy variable equals to 1 if country c is a former French colony in Sub-SaharanAfrica during the time period 1960-1989 and 0 otherwise.
CurrencyUnionfct
Dummy variable equals to 1 if countries f (France) and c have a common currencyat time t. We computed this variable on the basis of the classification proposed byde Sousa (2012).
#Years of Indepct Number of years since independence for country c at time t. This number is equal to0 before independence.
Visitct Bilateral visits at the level of Head of State (government), Minister, Secretary ofState, but also advisers and unofficial visits between France and foreign countriesover the 1977-2000 period. Data come from the French Ministry of Foreign Affairs(Evenements de politique internationale).
Migrationfct Bilateral migrant stocks come from the World Bank Global Bilateral Migrationdatabase (see Ozden et al., 2011). These data are available for each decade overthe period 1960-2000. For the years in between each decade, we replicate the valueof the previous decade.
Currency_arfct Dummy variable equals to 1 if countries f (France) and c have currency arrangement(a fixed exchange rate regime, a peg) at time t. We computed this variable on thebasis of the classification used in Shambaugh (2004) for fixed exchange rate regimes.
ODAfct Net flows of Official development assistance (ODA)received by country c from coun-try f at time t. Data come from OECD (2016), Net ODA (indicator). doi:10.1787/33346549-en (Accessed on 20 July 2016).
Militaryinterventionfct
Dummy variable equals to 1 if country f intervenes militarily in country c at time t.Data are taken from Kisangani and Pickering (2007).
Voting similarityindexfct
Dyadic voting similarity index ranging from 0 to 1 (1 denoting most similar interests)taken from Voeten, Strezhnev and Bailey (2009). It is equal to the total number ofvotes where both states agree divided by the total number of joint votes.
29
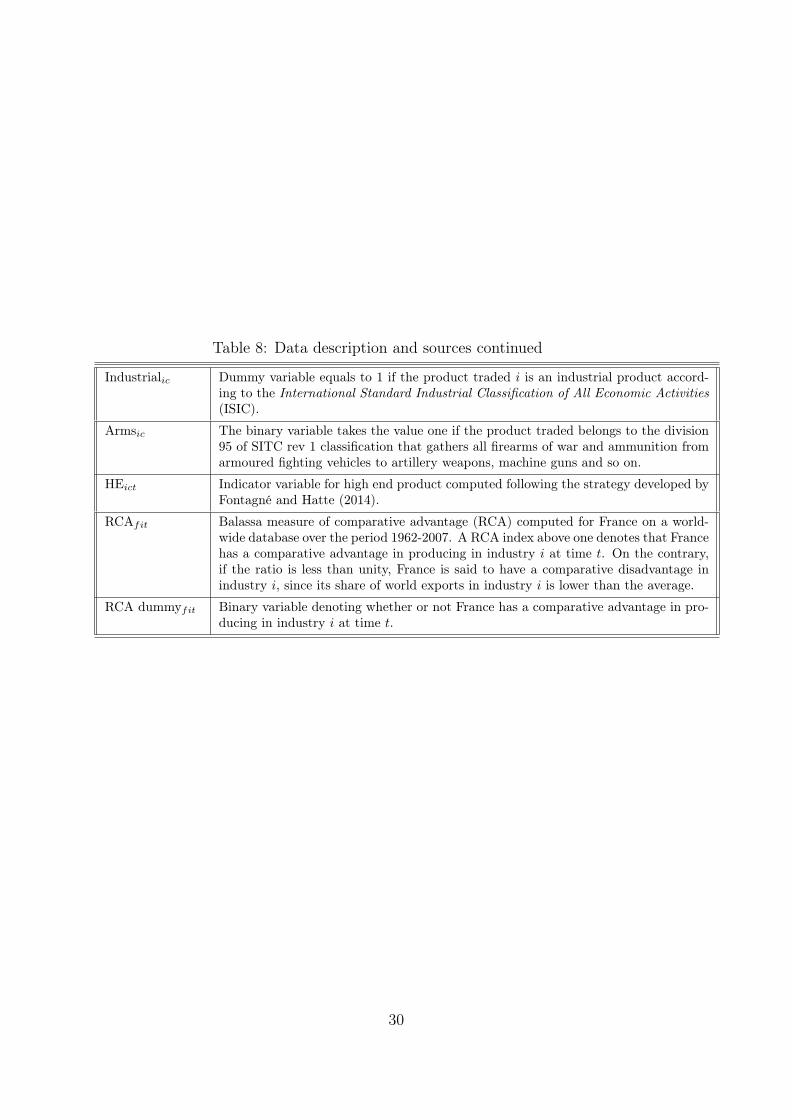
Table 8: Data description and sources continued
Industrialic Dummy variable equals to 1 if the product traded i is an industrial product accord-ing to the International Standard Industrial Classification of All Economic Activities(ISIC).
Armsic The binary variable takes the value one if the product traded belongs to the division95 of SITC rev 1 classification that gathers all firearms of war and ammunition fromarmoured fighting vehicles to artillery weapons, machine guns and so on.
HEict Indicator variable for high end product computed following the strategy developed byFontagné and Hatte (2014).
RCAfit Balassa measure of comparative advantage (RCA) computed for France on a world-wide database over the period 1962-2007. A RCA index above one denotes that Francehas a comparative advantage in producing in industry i at time t. On the contrary,if the ratio is less than unity, France is said to have a comparative disadvantage inindustry i, since its share of world exports in industry i is lower than the average.
RCA dummyfit Binary variable denoting whether or not France has a comparative advantage in pro-ducing in industry i at time t.
30
Top Related