


Languages
Pages
Legal


1

Forward looking statements
2
This presentation contains forward-looking statements. Forward-looking statements often include words such as “anticipate", "expect", "intend", "plan", "believe“ , “continue” or similar words in connection with discussions of future operating or financial performance.
The forward-looking statements are based on management's and directors’ current expectations and assumptions regarding Air New Zealand’s businesses and performance, the economy and other future conditions, circumstances and results. As with any projection or forecast, forward-looking statements are inherently susceptible to uncertainty and changes in circumstances. Air New Zealand’s actual results may vary materially from those expressed or implied in its forward-looking statements.

Business Review & Strategic Update
Christopher LuxonCEO

54
141198 197
457
40
114160
277
2012 2013 2014 2015 2016
Interim Highlights
• Operating revenue $2.7 billion, (up 12%)
• Earnings before taxation $457 million, (up 132%)
• Net profit after taxation $338 million, (up 154%)
• Operating cash flow $541 million, (up 43%)
4
Earnings before Taxation($ million)
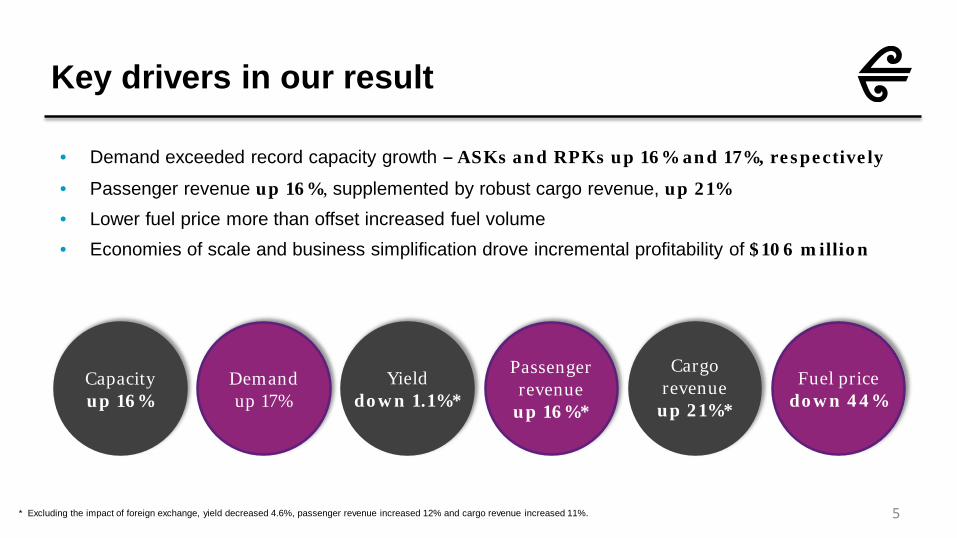
Key drivers in our result
• Demand exceeded record capacity growth – ASKs and RPKs up 16% and 17%, respectively
• Passenger revenue up 16%, supplemented by robust cargo revenue, up 21%
• Lower fuel price more than offset increased fuel volume• Economies of scale and business simplification drove incremental profitability of $106 million
5
Capacity up 16%
Demand up 17%
Yield down 1.1%*
* Excluding the impact of foreign exchange, yield decreased 4.6%, passenger revenue increased 12% and cargo revenue increased 11%.
Passenger revenue
up 16%*
Fuel pricedown 44%
Cargo revenue
up 21%*
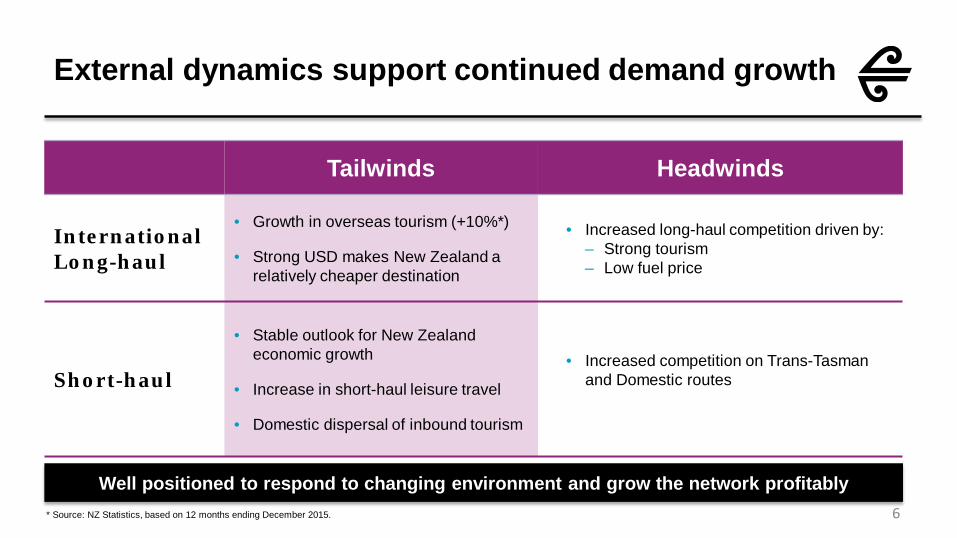
External dynamics support continued demand growth
6
Tailwinds Headwinds
International Long-haul
• Growth in overseas tourism (+10%*)
• Strong USD makes New Zealand a relatively cheaper destination
• Increased long-haul competition driven by:– Strong tourism– Low fuel price
Short-haul
• Stable outlook for New Zealandeconomic growth
• Increase in short-haul leisure travel
• Domestic dispersal of inbound tourism
• Increased competition on Trans-Tasman and Domestic routes
* Source: NZ Statistics, based on 12 months ending December 2015.
Well positioned to respond to changing environment and grow the network profitably

Significant progress on strategic priorities
7
OUR STRATEGIC PRIORITIES
MARKETS
Rea
lign
ou
r b
usi
nes
s fo
r gr
owth
EFFICIENCY
CUSTOMER
PEOPLE
TECHNOLOGY
Grow and develop markets
Grow contribution from alliance partners
2014 2015
Grow, simplify and modernise our fleet
Simplify our business to drive down cost
Grow a consistent and personalised customer experience
Grow high performance culture and capability
Unleash digital transformation
2016
1H16 highlights Houston, Buenos Aires routes
commenced
Initiation of revenue share alliance with Air China
Three Boeing 787-9 aircraft delivered
Ordered 15 ATR72-600 aircraft for regional services
More than 2 million Airpoints members Auckland and Sydney lounges completed
Completed negotiation of 17 collective agreements
New Chief Digital Officer onboard
Identifying Initiating Executing
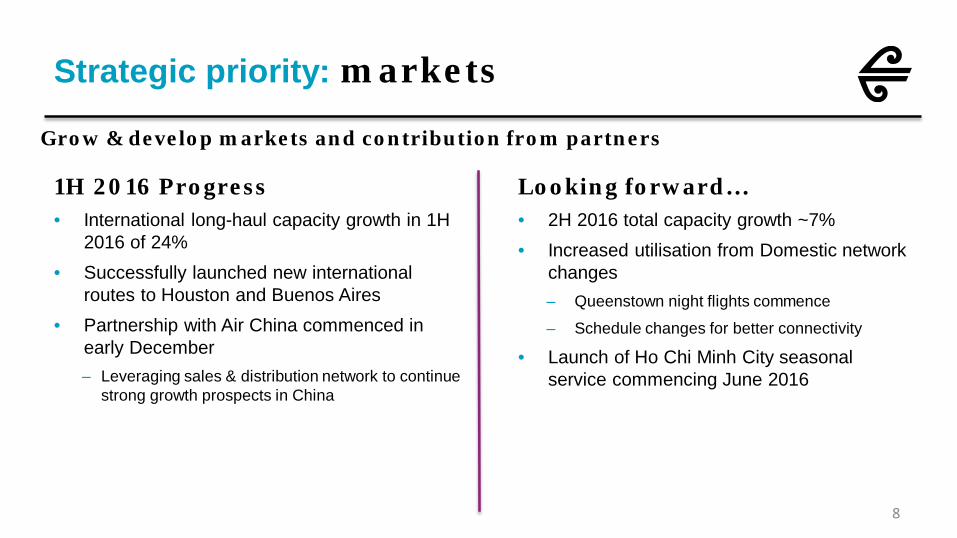
Strategic priority: markets
8
1H 2016 Progress• International long-haul capacity growth in 1H
2016 of 24% • Successfully launched new international
routes to Houston and Buenos Aires • Partnership with Air China commenced in
early December– Leveraging sales & distribution network to continue
strong growth prospects in China
Looking forward…• 2H 2016 total capacity growth ~7%• Increased utilisation from Domestic network
changes– Queenstown night flights commence
– Schedule changes for better connectivity
• Launch of Ho Chi Minh City seasonal service commencing June 2016
Grow & develop markets and contribution from partners
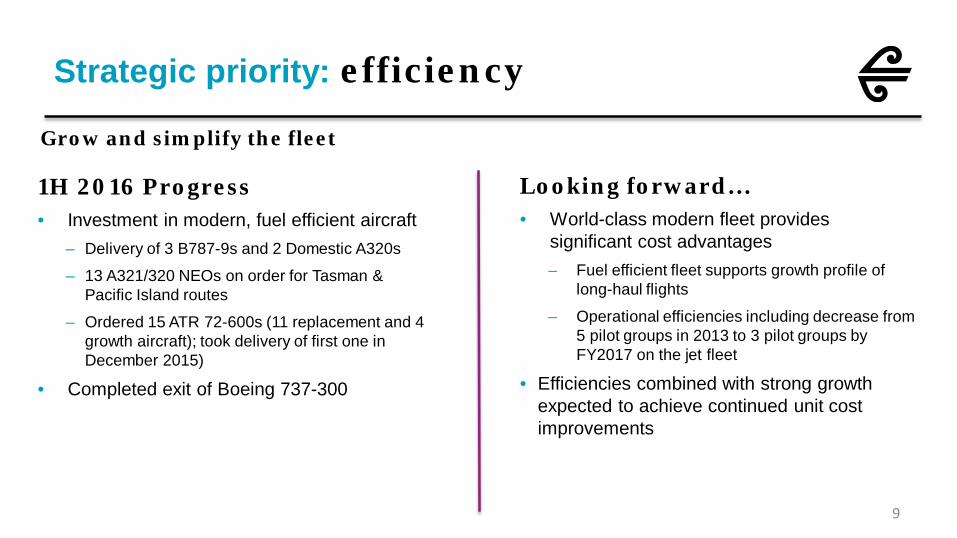
Strategic priority: efficiency
9
Grow and simplify the fleet
Looking forward…• World-class modern fleet provides
significant cost advantages – Fuel efficient fleet supports growth profile of
long-haul flights
– Operational efficiencies including decrease from 5 pilot groups in 2013 to 3 pilot groups by FY2017 on the jet fleet
• Efficiencies combined with strong growth expected to achieve continued unit cost improvements
1H 2016 Progress• Investment in modern, fuel efficient aircraft
– Delivery of 3 B787-9s and 2 Domestic A320s
– 13 A321/320 NEOs on order for Tasman & Pacific Island routes
– Ordered 15 ATR 72-600s (11 replacement and 4 growth aircraft); took delivery of first one in December 2015)
• Completed exit of Boeing 737-300
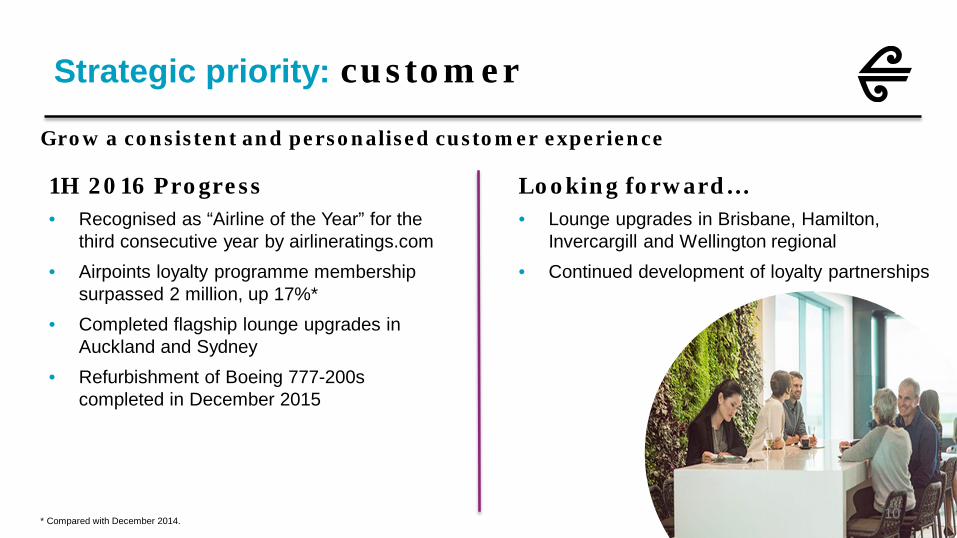
Strategic priority: customer
1H 2016 Progress• Recognised as “Airline of the Year” for the
third consecutive year by airlineratings.com• Airpoints loyalty programme membership
surpassed 2 million, up 17%*• Completed flagship lounge upgrades in
Auckland and Sydney• Refurbishment of Boeing 777-200s
completed in December 2015
Grow a consistent and personalised customer experience
Looking forward…• Lounge upgrades in Brisbane, Hamilton,
Invercargill and Wellington regional• Continued development of loyalty partnerships
* Compared with December 2014. 10

Strategic priority: people
11
Grow high performance culture and capability
1H 2016 Progress
• Continued to attract top-tier talent• Staff turnover remained at low levels (< 5%)• High Performance Engagement between
management, employees and their unions continued to drive results– Successfully negotiated 17 collective agreements
Looking forward…
• Jodie King appointed new Chief People Officer• Continue to build upon relationships with
employee representatives
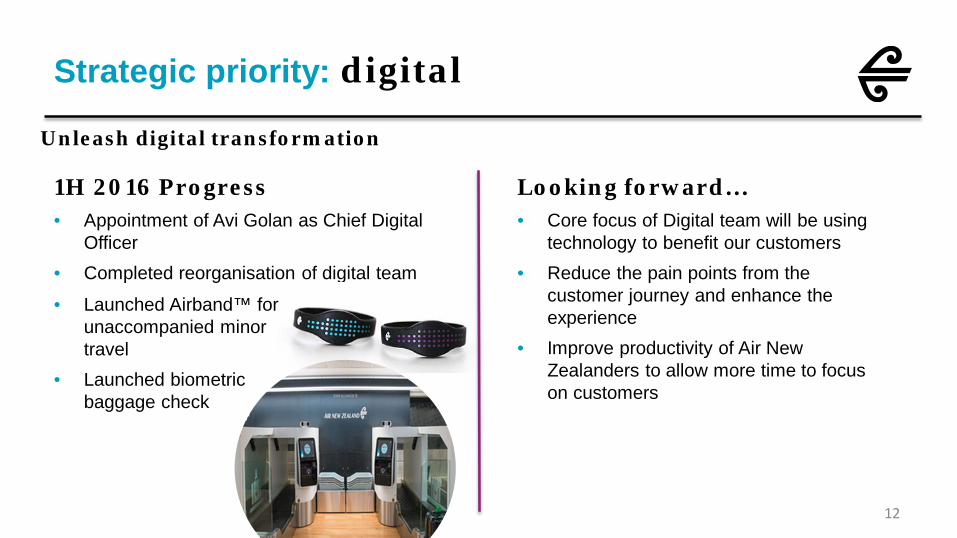
Strategic priority: digital
12
Unleash digital transformation
1H 2016 Progress• Appointment of Avi Golan as Chief Digital
Officer• Completed reorganisation of digital team
Looking forward…• Core focus of Digital team will be using
technology to benefit our customers• Reduce the pain points from the
customer journey and enhance the experience
• Improve productivity of Air New Zealanders to allow more time to focus on customers
• Launched Airband™ for unaccompanied minor travel
• Launched biometric baggage check

Financial Review
Rob McDonaldCFO
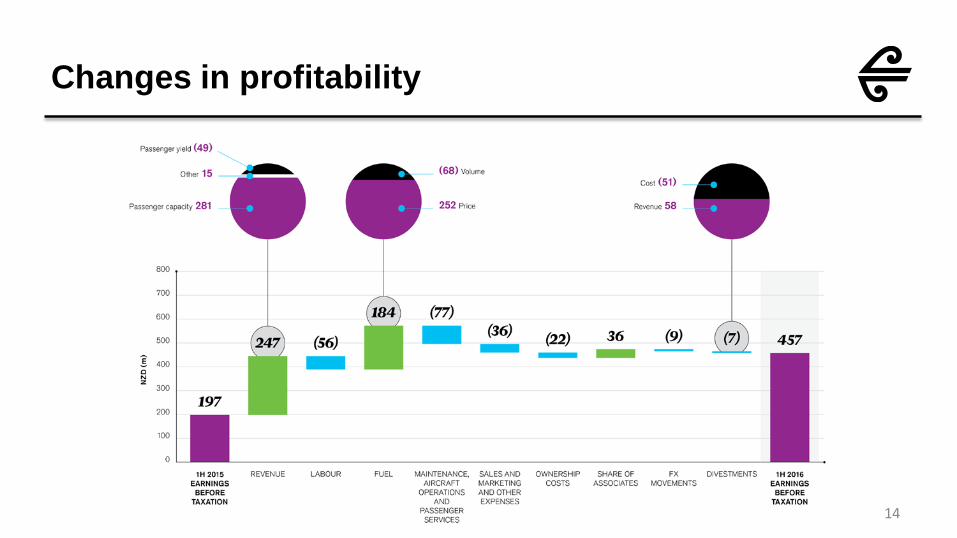
Changes in profitability
14
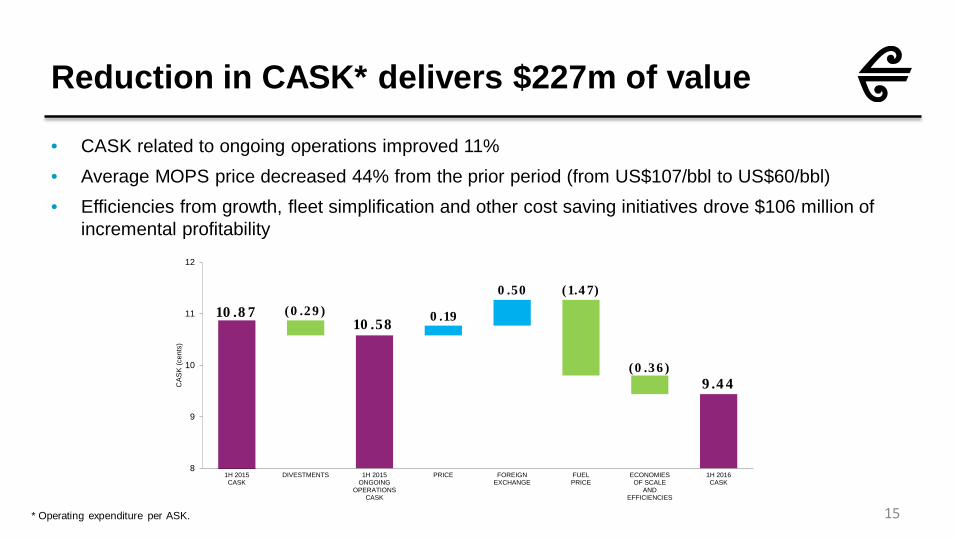
Reduction in CASK* delivers $227m of value
15
• CASK related to ongoing operations improved 11%• Average MOPS price decreased 44% from the prior period (from US$107/bbl to US$60/bbl) • Efficiencies from growth, fleet simplification and other cost saving initiatives drove $106 million of
incremental profitability
* Operating expenditure per ASK.
10.58
9.44
10.87 (0.29) 0.19
0.50 (1.47)
(0.36)
8
9
10
11
12
1H 2015CASK
DIVESTMENTS 1H 2015ONGOING
OPERATIONSCASK
PRICE FOREIGNEXCHANGE
FUELPRICE
ECONOMIESOF SCALE
ANDEFFICIENCIES
1H 2016CASK
CAS
K (c
ents
)
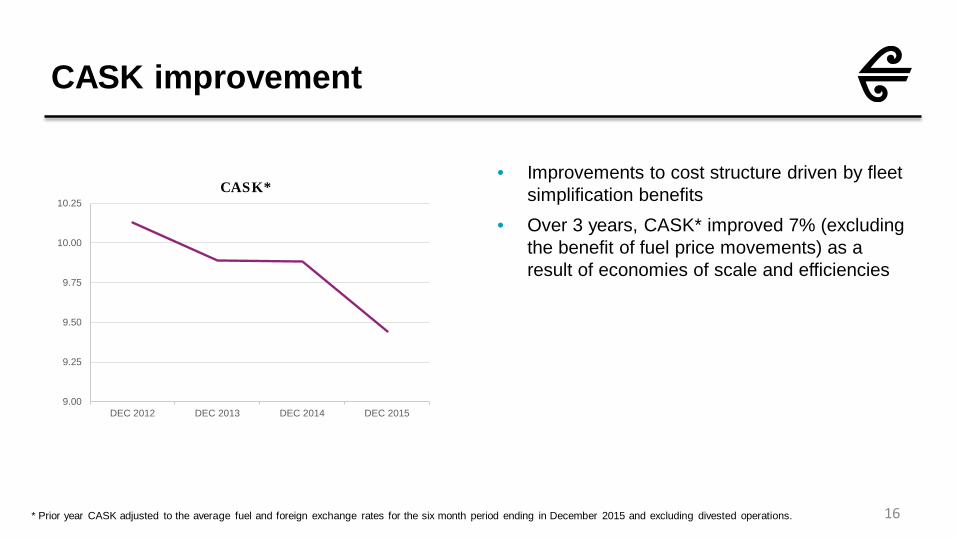
CASK improvement
16
• Improvements to cost structure driven by fleet simplification benefits
• Over 3 years, CASK* improved 7% (excluding the benefit of fuel price movements) as a result of economies of scale and efficiencies
* Prior year CASK adjusted to the average fuel and foreign exchange rates for the six month period ending in December 2015 and excluding divested operations.
CASK*
9.00
9.25
9.50
9.75
10.00
10.25
DEC 2012 DEC 2013 DEC 2014 DEC 2015

Domestic
17
• Capacity growth of 11%• Strong performance with demand closely tracking capacity
• Comprehensive domestic & regional network with over 400 flights daily serving 22 destinations across New Zealand
• On time performance (OTP) was world class at 91.1% for domestic jet and 86.2% for regional turboprop aircraft for the 6 months to December 2015
* Calculation based on numbers before rounding.** Excluding the impact of foreign exchange, Domestic yield decreased by 4.5%.
Dec 2015 Dec 2014 Movement*
Passengers carried (‘000s) 4,932 4,562 8.1%
Available seat kilometres (ASKs, millions) 3,093 2,778 11.3%
Revenue passenger kilometres (RPKs, millions) 2,465 2,241 10.0%
Load factor 79.7% 80.7% (1.0 pts)
Yield (cents per RPK) 27.5 28.7 (3.9%)**

Tasman & Pacific Islands
18
• Capacity growth of 7%• Increased frequency of wide-body aircraft
• Introduction of Premium Economy on select routes commenced in October with solid demand
• International short-haul on time performance (OTP) 87.1% for the 6 months to December 2015
* Calculation based on numbers before rounding.** Excluding the impact of foreign exchange, Tasman & Pacific Islands yield increased by 1.6%.
Dec 2015 Dec 2014 Movement*
Passengers carried (‘000s) 1,859 1,718 8.2%
Available seat kilometres (ASKs, millions) 6,024 5,624 7.1%
Revenue passenger kilometres (RPKs, millions) 5,046 4,681 7.8%
Load factor 83.8% 83.2% 0.6 pts
Yield (cents per RPK) 12.2 11.9 2.7%**

International
19
• Capacity growth of 24%• Commenced new routes to Buenos Aires and Houston in December 2015
• Announced new Ho Chi Minh City seasonal service beginning June 2016
• International long-haul on time performance (OTP) 78.8% for the 6 months to December 2015
* Calculation based on numbers before rounding.** Excluding the impact of foreign exchange, International yield decreased by 5.2%.
Dec 2015 Dec 2014 Movement*
Passengers carried (‘000s) 966 764 26.4%
Available seat kilometres (ASKs, millions) 10,868 8,758 24.1%
Revenue passenger kilometres (RPKs, millions) 9,353 7,477 25.1%
Load factor 86.1% 85.4% 0.7 pts
Yield (cents per RPK) 10.8 10.6 2.0%**

Cargo
20
• Robust revenue growth driven by strong volumes and improved yields
• Capacity increases and new routes allowed for increased volume• Growth particularly strong on Pacific long-haul and into Singapore Volume
up 9%
Yieldup 1.6%
Foreign Exchangeup 10%
Revenueup 21%

2012 2013 2014 2015 2016
Interim Final Special
5.58.0
20.0
16.0
Strong operating cash flow and balance sheet provide flexibility
21
• Net cash on hand of $1.4 billion, up 6% from 30 June 2015
• Operating cash flow $541 million, up 43% over prior period
• Gearing moved to 53.8%, up slightly from 52.4% at June 2015 due to additional debt and dividends offset by earnings
• Fully imputed interim dividend of 10.0 cents per share, an increase of 54% on the prior year
• Stable outlook Baa2 rating from Moody’s
10.0
Operating cash flow ($m)
146
343300
378
541
326407 430
722
2012 2013 2014 2015 2016
1H2H 1H 2H
1H2H 1H
2H1H
Dividends (declared)(cents per share)
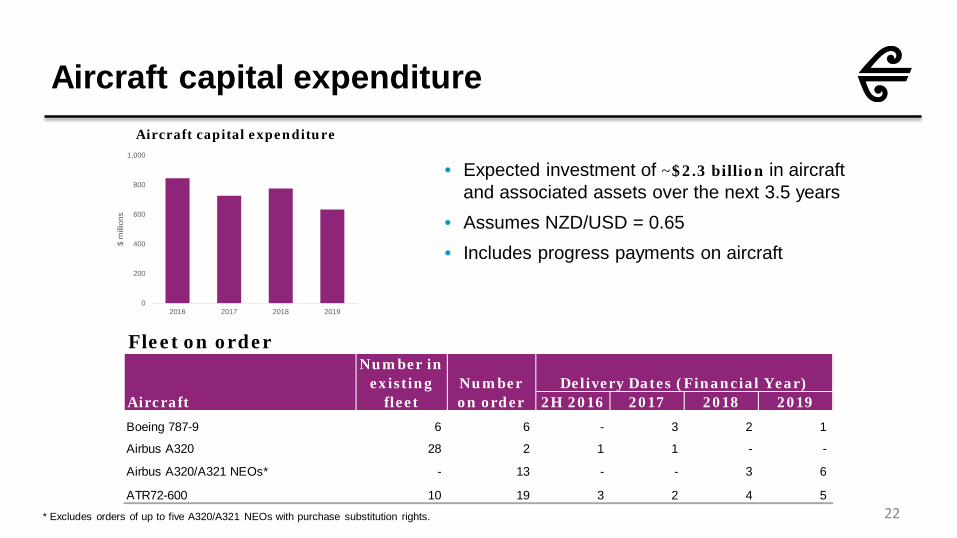
Aircraft capital expenditure
22
• Expected investment of ~$2.3 billion in aircraft and associated assets over the next 3.5 years
• Assumes NZD/USD = 0.65• Includes progress payments on aircraft
* Excludes orders of up to five A320/A321 NEOs with purchase substitution rights.
Fleet on order
2H 2016 2017 2018 2019Boeing 787-9 6 6 - 3 2 1
Airbus A320 28 2 1 1 - -
Airbus A320/A321 NEOs* - 13 - - 3 6
ATR72-600 10 19 3 2 4 5
Number on order
Number in existing
fleetAircraftDelivery Dates (Financial Year)
Aircraft capital expenditure
0
200
400
600
800
1,000
2016 2017 2018 2019
$ m
illion
s
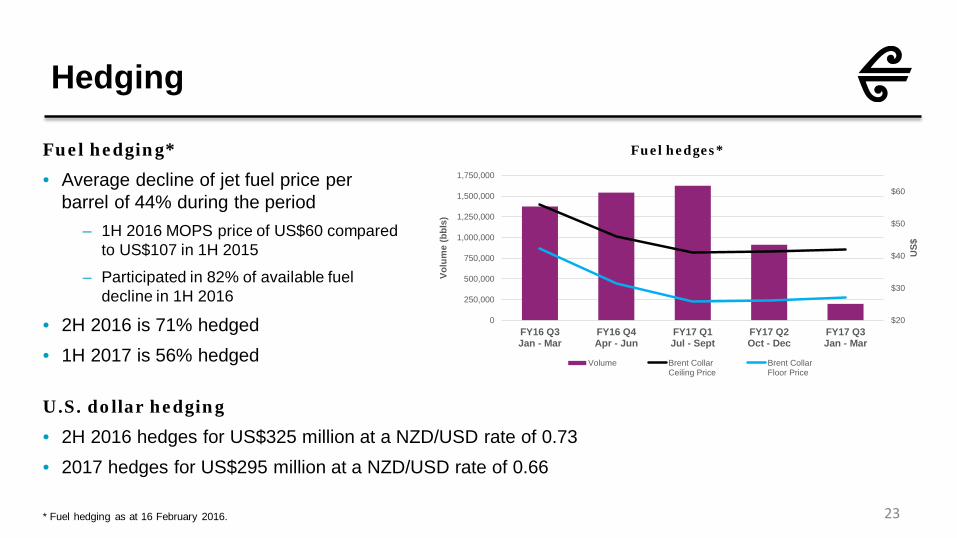
Hedging
23* Fuel hedging as at 16 February 2016.
Fuel hedging*
• Average decline of jet fuel price per barrel of 44% during the period
– 1H 2016 MOPS price of US$60 compared to US$107 in 1H 2015
– Participated in 82% of available fuel decline in 1H 2016
• 2H 2016 is 71% hedged• 1H 2017 is 56% hedged
U.S. dollar hedging
• 2H 2016 hedges for US$325 million at a NZD/USD rate of 0.73• 2017 hedges for US$295 million at a NZD/USD rate of 0.66
Fuel hedges*
$20
$30
$40
$50
$60
0
250,000
500,000
750,000
1,000,000
1,250,000
1,500,000
1,750,000
FY16 Q3Jan - Mar
FY16 Q4Apr - Jun
FY17 Q1Jul - Sept
FY17 Q2Oct - Dec
FY17 Q3Jan - Mar
US$
Volu
me
(bbl
s)
Volume Brent CollarCeiling Price
Brent CollarFloor Price

Outlook
Christopher LuxonCEO
Outlook
25
• External factors that can influence outlook for second half of the year include fuel prices, foreign currency rates and competition
• Based upon current market conditions and assuming current fuel prices and foreign exchange rates, we are targeting earnings before taxation for the full year 2016 to exceed $800 million
• This outlook excludes equity earnings from our Virgin Australia shareholding
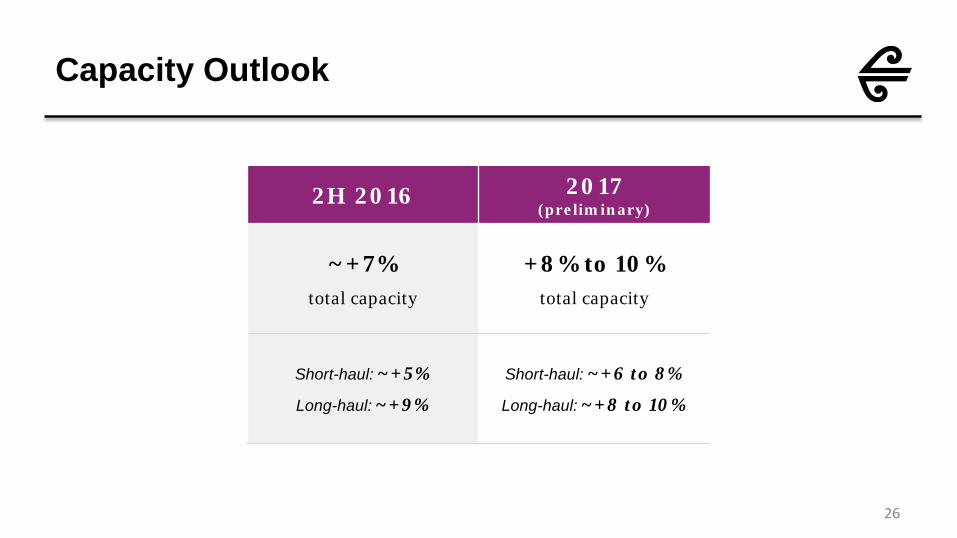
Capacity Outlook
26
2H 2016 2017 (preliminary)
~+7%total capacity
+8% to 10%total capacity
Short-haul: ~+5%
Long-haul: ~+9%
Short-haul: ~+6 to 8%
Long-haul: ~+8 to 10%


Supplementary slides

Financial overview
29* Comparative is for 30 June 2015.** Dividends are fully imputed.
Dec 2015 Dec 2014 Movement Movement$M $M $M %
Operating revenue 2,698 2,403 295 12%
Earnings before taxation 457 197 260 132%
Net profit after taxation 338 133 205 154%
Operating cash flow 541 378 163 43%
Net cash position* 1,400 1,321 79 6%
Gearing* 53.8% 52.4% n/a (1.4 pts)
Interim ordinary dividend** 10.0 cps 6.5 cps 3.5 cps 54%

Group performance metrics
30* Calculation based on numbers before rounding.** Excluding the impact of foreign exchange, yield decreased by 4.6%.
Dec 2015 Dec 2014 Movement*
Passengers carried (‘000s) 7,757 7,044 10.1%
Available seat kilometres (ASKs, millions) 19,985 17,160 16.5%
Revenue passenger kilometres (RPKs, millions) 16,864 14,399 17.1%
Load factor 84.4% 83.9% 0.5 pts
Yield (cents per RPK) 13.7 13.8 (1.1%)**

Projected aircraft in service
31
• 5 ATR 72-600 aircraft expected to be delivered in the next 6 to 9 months• Beech 1900Ds exiting by September 2016; Boeing 767-300ERs exiting by calendar 2017
2016 2017 2018 2019Boeing 777-300ER 7 7 7 7Boeing 777-200ER 8 8 8 8Boeing 787-9 6 9 11 12Boeing 767-300ER 4 2 - -Airbus A320 29 30 25 18Airbus A320/A321 NEO - - 6 13ATR72-600 13 15 19 24ATR72-500 11 11 8 3Bombardier Q300 23 23 23 23Beech 1900D 3 - - -
Total Fleet 104 105 107 108
Aircraft fleet age in years(seat weighted)
9.2 9.1
7.87.5 7.5
6.76.2
2013 2014 2015 2016 2017 2018 2019
age
in y
ears
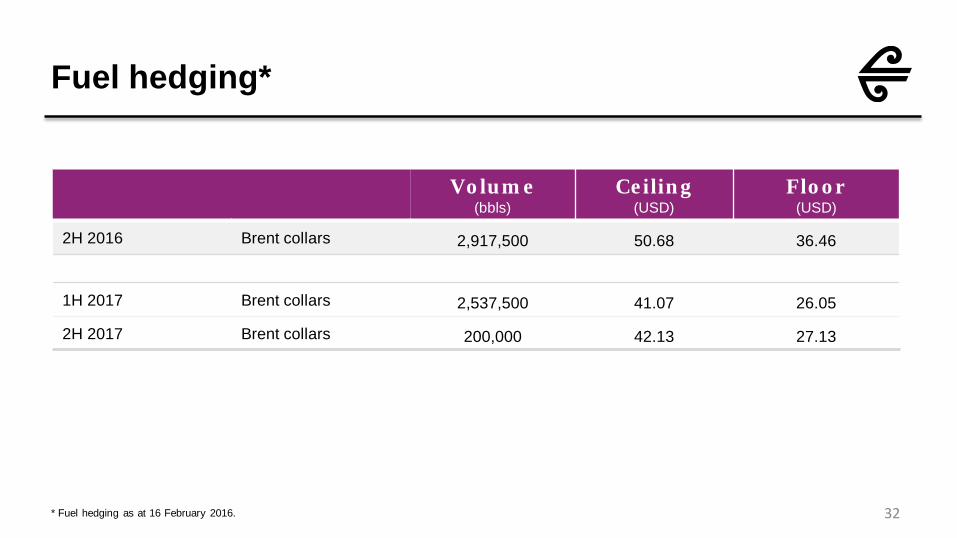
Fuel hedging*
32* Fuel hedging as at 16 February 2016.
Volume(bbls)
Ceiling(USD)
Floor(USD)
2H 2016 Brent collars 2,917,500 50.68 36.46
1H 2017 Brent collars 2,537,500 41.07 26.05
2H 2017 Brent collars 200,000 42.13 27.13

33
Top Related