


Languages
Pages
Legal

Immigrant Health & Cancer Disparities Service Memorial Sloan Kettering
Food to Overcome Outcomes Disparities (FOOD)
Provider Training Course
- 2 -
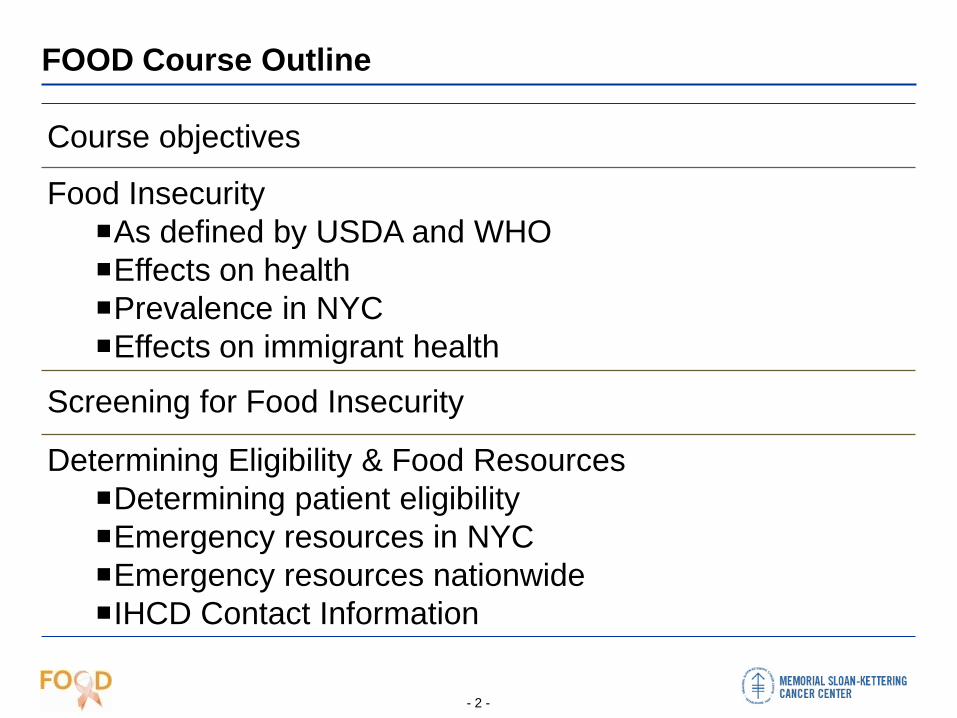
FOOD Course Outline
Course objectives
Food Insecurity As defined by USDA and WHO Effects on health Prevalence in NYC Effects on immigrant health
Screening for Food Insecurity
Determining Eligibility & Food Resources Determining patient eligibility Emergency resources in NYC Emergency resources nationwide IHCD Contact Information
- 3 -
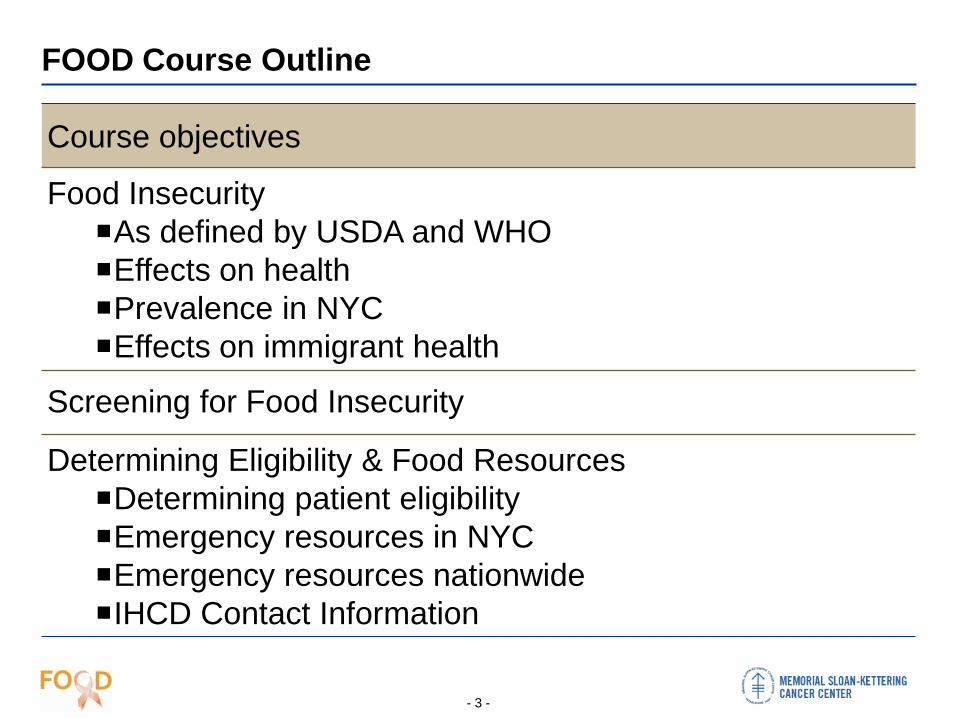
FOOD Course Outline
Course objectives
Food Insecurity As defined by USDA and WHO Effects on health Prevalence in NYC Effects on immigrant health
Screening for Food Insecurity
Determining Eligibility & Food Resources Determining patient eligibility Emergency resources in NYC Emergency resources nationwide IHCD Contact Information

- 4 -
Course Objectives
Food Insecurity
Screening
Emergency Resources
Objective To gain knowledge on food insecurity and its risks, its
effects on health, and its impact on patients, including immigrant minorities
To understand best practices to assess patients for food insecurity and conduct a brief targeted nutrition screening
To determine eligibility for food resources and to identify the available emergency food resources in New York City and nation-wide.
After the course, participants should have an understanding of the following:

- 5 -
FOOD Course Outline
Course objectives
Food Insecurity As defined by USDA and WHO Effects on health Prevalence in NYC Effects on immigrant health
Screening for Food Insecurity
Determining Eligibility & Food Resources Determining patient eligibility Emergency resources in NYC Emergency resources nationwide IHCD Contact Information

- 6 -
What is “Food Security”?
Definitions as designated by the WHO and USDA
World Health Organization (2010)1:
“Access by all people at all times
to enough safe, nutritious food to maintain a healthy and active life”
USDA (2009)2: “Enough food for an
active, healthy life, including at a minimum: • Assured ability to
acquire acceptable foods in socially acceptable ways
• The ready availability of nutritionally adequate and safe foods”
1World Health Organization. (2010). Food Security. Retrieved from: http://www.who.int/trade/glossary/story028/en/ 2Nord, M. & Coleman-Jensen, A. (2009). Food Security in the United States: Measuring Household Food Security. Accessed from: http://www.ers.usda.gov/Briefing/FoodSecurity/measurement.htm
Food Insecurity

- 7 -
Food insecurity is linked to negative outcomes in mental and physical health
Poor food choices
Cyclical fluctuations in
nutritional intake
Food restrictions
Financial Strain
Fear of law enforcement /
deportation
Guilt and Embarrassment
Food Insecurity Poor Outcomes Physical Health
- Obesity - Diabetes
Mental Health - Psychological distress - Depression - Learning disorders
Cancer treatment adherence
Cancer recovery times & survivorship
Food insecurity is a growing problem in the United States. It affected 14.9% of US households in 2011, the highest rate in recent history.1 It is linked to negative mental and physical health outcomes, especially among cancer patients:
Click here for supplementary sources
Food Insecurity
- 8 -
Food Insecurity and Negative Outcomes – Supplementary Sources
1. http://www.ers.usda.gov/topics/food-nutrition-assistance/food-security-in-the-us/key-statistics-graphics.aspx 2. Nord, M. & Coleman-Jensen, A. (2009). Food Security in the United States: Measuring Household Food Security. 3. Matheson, D.M., Robinson, T.N., Varady, A., Killen, J.D. (2006). Do Mexican-American mothers’ food-related parenting
practices influence their children’s weight and dietary intake? 4. Hadley, C., Galea, S., Nandi, V., Nandi, A., Lopez, G., Strongarone, S., Ompad, D. (2008). Hunger and health among
undocumented Mexican migrants in a US urban area 5. Kaiser, L., Baumrind, N., Dumbauld, S. (2007). Who is food-insecure in California? Findings from the California
Women’s Health Survey, 2004. 6. Quandt, S.A., et al. 2006). Experiences of Latino immigrant families in North Carolina help explain elevated levels of
food insecurity and hunger 7. Weigel, M.M., Armijos, R.X., Hall, Y.P., Ramirez, Y., Orozco, R. (2007). The household food insecurity and health
outcomes of U.S.-Mexico border migrant and seasonal farmworkers. 8. Laraia, B.A., Siega-Riz, A.M., Evenson, K.R. (2004). Self-reported overweight and obesity are not associated with
concern about enough food among adults in New York and Louisiana. 9. Olson, C.M., Strawderman, M.S. (2008). The relationship between food insecurity and obesity in rural childbearing
women. 10. Adams, E.J., Grummer-Strawn, L., Chavez, G. (2003). Food insecurity is associated with increased risk of obesity in
California women. 11. Kaplan, M.S., Huguet, N., Newson, J.T., McFarland, B.H. (2004). The association between length of residence and
obesity among Hispanic immigrants 12. Seligman, H.K., Bindman, A.B., Vittinghoff, E., Kanaya, A.M., Kushel, M.B. (2007). Food insecurity is associated with
diabetes mellitus 13. Seligman, H.K., Larai, B.A., Kushel, M.B. (2010). Food insecurity is associated with chronic disease among low-income
NHANES participants.
Food Insecurity
- 9 -
Food Insecurity in the United States
Food Security Status of US Households (2011)15
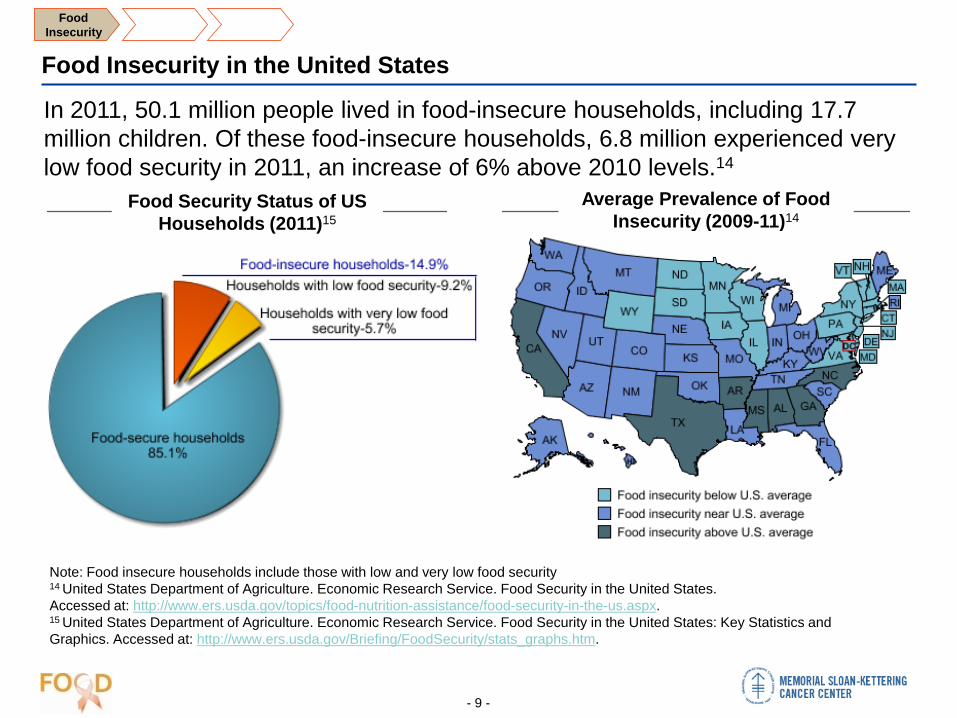
In 2011, 50.1 million people lived in food-insecure households, including 17.7 million children. Of these food-insecure households, 6.8 million experienced very low food security in 2011, an increase of 6% above 2010 levels.14
Note: Food insecure households include those with low and very low food security 14 United States Department of Agriculture. Economic Research Service. Food Security in the United States. Accessed at: http://www.ers.usda.gov/topics/food-nutrition-assistance/food-security-in-the-us.aspx. 15 United States Department of Agriculture. Economic Research Service. Food Security in the United States: Key Statistics and Graphics. Accessed at: http://www.ers.usda.gov/Briefing/FoodSecurity/stats_graphs.htm.
Average Prevalence of Food Insecurity (2009-11)14
Food Insecurity
- 10 -
Food Insecurity in the United States
Characteristics of Food-Insecure Households (2011)16
16 United States Department of Agriculture. Economic Research Service. Food Security in the United States: Key Statistics and Graphics. Accessed at: http://www.ers.usda.gov/Briefing/FoodSecurity/stats_graphs.htm.
Food Insecurity
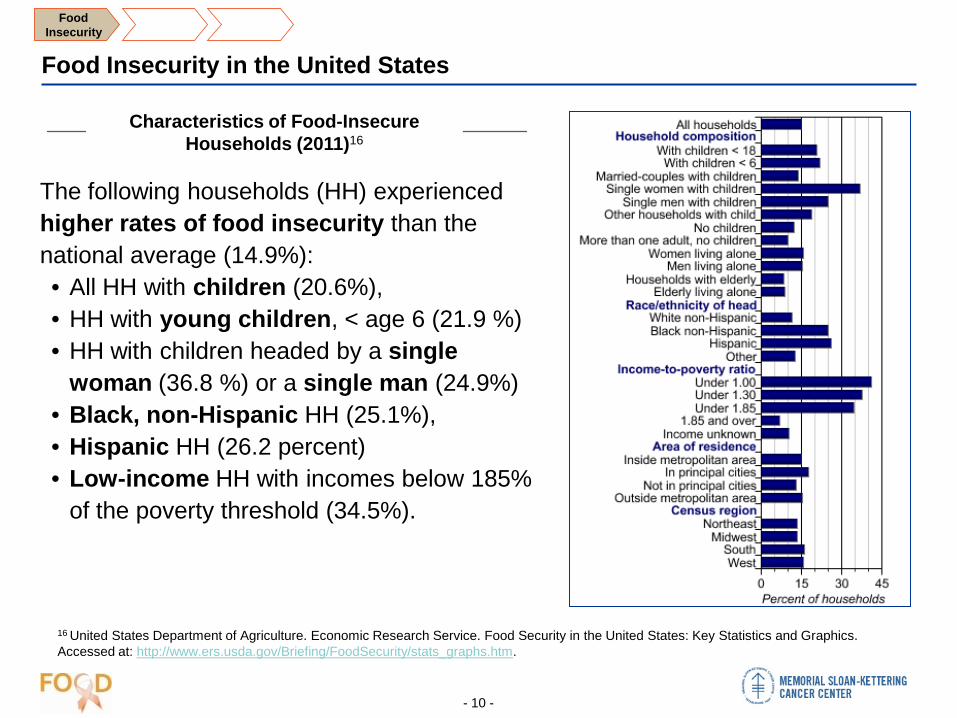
The following households (HH) experienced higher rates of food insecurity than the national average (14.9%): • All HH with children (20.6%), • HH with young children, < age 6 (21.9 %) • HH with children headed by a single
woman (36.8 %) or a single man (24.9%) • Black, non-Hispanic HH (25.1%), • Hispanic HH (26.2 percent) • Low-income HH with incomes below 185%
of the poverty threshold (34.5%).

Food Insecurity in Selected States and in NYC
- 11 -
CA
TX
Click on a state for more detailed information
FL
IL NYC
Food Insecurity

- 12 -
Food Insecurity in California
California Food Security Facts
9th highest rate of food insecurity in the country (2008-2010).17
In June 2007, approximately 3.8 million (or roughly 40%) of low‐income adults (<200% of federal poverty line) could not afford to put adequate food on the table consistently.18
Only 50% of eligible SNAP (food stamp) participants enroll in the program.18
- This low SNAP participation rate places California among the lowest in the nation
- From 2001 to 2009, food insecurity among non-participating eligible households increased, while food insecurity stayed steady for SNAP and WIC participants
Very low food security (5.1%)
Food secure (80.8%)
Food Insecurity
Low food security (14.1%)
- 13 -
Food Insecurity in Texas
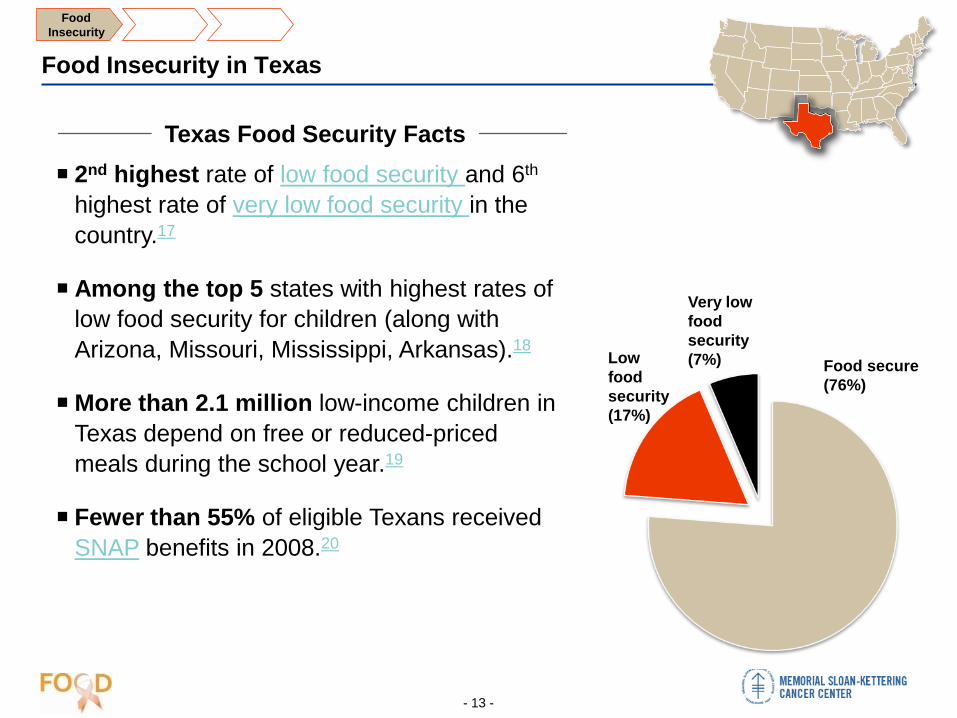
Texas Food Security Facts 2nd highest rate of low food security and 6th
highest rate of very low food security in the country.17
Among the top 5 states with highest rates of low food security for children (along with Arizona, Missouri, Mississippi, Arkansas).18
More than 2.1 million low-income children in Texas depend on free or reduced-priced meals during the school year.19
Fewer than 55% of eligible Texans received SNAP benefits in 2008.20
Food secure (76%)
Food Insecurity
Very low food security (7%) Low
food security (17%)

- 14 -
Food Insecurity in Illinois
Illinois Food Security Facts More than 16% of the population lives with low
or very low food security.17
Over 1.7 million individuals and 850,000 households participated in SNAP (food stamp program) in July 2011. This is an 8.6% increase in the number of households participating from the previous year.28
Nearly 42% of those served by Illinois food pantries are children.21
Feeding Illinois, a major statewide food bank, has seen a 50% increase in requests for emergency food assistance over the past two years.21
Food Secure (83.4%)
Food Insecurity
Low food security (12.2%)
Very low food security (4.4%)
- 15 -
Food Insecurity in Florida
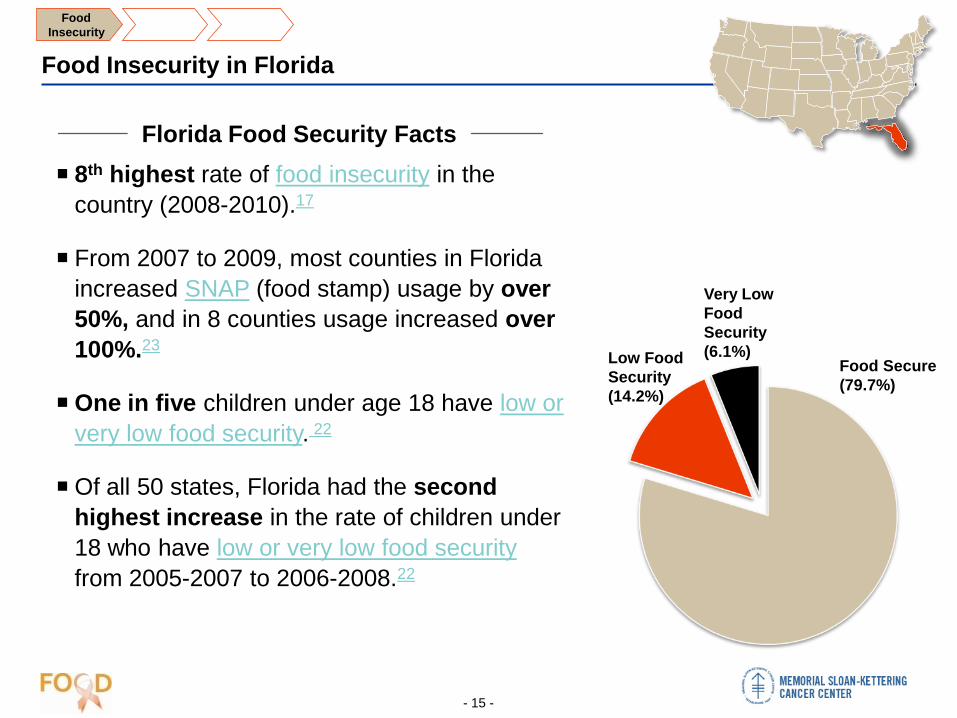
Florida Food Security Facts 8th highest rate of food insecurity in the
country (2008-2010).17
From 2007 to 2009, most counties in Florida increased SNAP (food stamp) usage by over 50%, and in 8 counties usage increased over 100%.23
One in five children under age 18 have low or very low food security. 22
Of all 50 states, Florida had the second highest increase in the rate of children under 18 who have low or very low food security from 2005-2007 to 2006-2008.22
Low Food Security (14.2%)
Food Secure (79.7%)
Food Insecurity
Very Low Food Security (6.1%)

- 16 -
Food Insecurity in New York City
Food Insecurity by Borough
1.4 million NYC residents (17%) live in households facing food insecurity.24
400,000 children in NYC (20%) live in households facing food insecurity.24
Food insecurity prevalence ranges from 11% of Staten Island individuals to 20% in the Bronx.25
In a study of predominantly immigrant and minority cancer patients in the Immigrant Health & Cancer Disparities Service’s Portal Project:27
– 55% found to be food insecure – More than 3x higher than the national
average (14.5%) – Nearly 5x higher than the state average
(12.4%)
Food Insecurity
Image source, see 24

Rising SNAP recipients in NYC
- 17 -
Total SNAP Recipients in NYC, 2006- 201026
Food Insecurity
- 18 -
Food Insecurity and Public Assistance – Supplementary Sources
17 Prevalence of Household-Level Food Insecurity and Very Low Food Security by State 2007-2009 (Average). Food Research and Action Center. Accessed 6/16. Available at: http://frac.org/wp-content/uploads/2010/11/food_insecurity_by_state_2007-2009.pdf.
18 Harrison GG et al. Nearly Four Million Californians Are Food Insecure. Los Angeles: UCLA Center for Health Policy Research, June 2012. Accessed at: http://cfpa.net/CalFresh/Media/CHIS-HealthPolicyBrief-2012.pdf.
19 Kluever, L. Report: Hunger Costs Texas $9 Billion a Year; This Hunger Awareness Day, Too Many Texas Kids at Risk of Hunger. Center for Public Policy Priorities. 6/5/2007. Accessed 6/16. Accessed at: http://www.cppp.org/research.php?aid=685.
20 The Facts. Texas Hunger Initiative. School of Social Work, Baylor University. Accessed 6/16. Accessed at: http://www.baylor.edu/texashunger/index.php?id=81340.
21 Hunger in Illinois. Feeding Illinois, updated 2010. Accessed 6/21. Available at: http://www.feedingillinois.org/hunger/ 22. A 2010 Feeding America report on the state of child food insecurity in our nation, based on analysis of USDA food
security data by John Cook, Ph.D. Accessed 6/21. Available at: http://feedingamerica.org/our-network/the-studies/~/media/Files/research/state-child-hunger-2010.ashx?.pdf.
23. Food Stamp Usage Across the Country. NYT Interactive Map. Updated Nov. 2009. Accessed 6/21. Available at: http://www.nytimes.com/interactive/2009/11/28/us/20091128-foodstamps.html.
24. New York City Coalition Against Hunger. Hunger in New York City. Accessed 5/31/2011. Available at: http://www.nyccah.org/learn-about-hunger/hunger-in-nyc.
25. City Harvest. Hunger in NYC. Food Insecurity. Accessed 5/31/2011. Available at: http://www.cityharvest.org/hunger-in-nyc/food-insecurity.
26. New York City Coalition Against Hunger. Hungry New Yorkers barely hang on. 2010 Annual Hunger Report. 2010. Available at: http://issuu.com/nyccah/docs/2010hungersurveyreport?mode=embed&layout=http://skin.issuu.com/v/color/layout.xml&backgroundColor=FFFFFF&showFlipBtn=true.
27. Gany F, Lee T, Ramirez J, Massie, D, Moran A, Crist M, McNish T, Leng J. Are our severely ill patients hungry? ASCO Annual Meeting, June 2011.
28 USDA. FNS Program Data. Accessed 6/21. Available at: http://www.fns.usda.gov/fns/data.htm
Food Insecurity
- 19 -
Effects on Immigrant Health
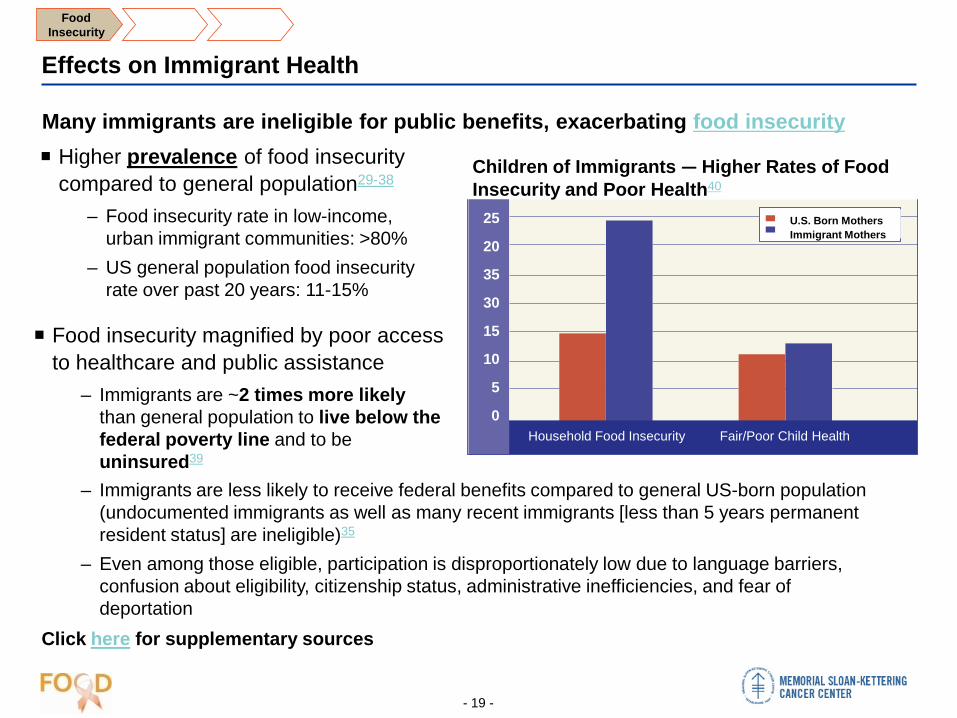
Higher prevalence of food insecurity compared to general population29-38
– Food insecurity rate in low-income, urban immigrant communities: >80%
– US general population food insecurity rate over past 20 years: 11-15%
Food insecurity magnified by poor access to healthcare and public assistance
– Immigrants are ~2 times more likely than general population to live below the federal poverty line and to be uninsured39
Food Insecurity
Click here for supplementary sources
Many immigrants are ineligible for public benefits, exacerbating food insecurity
U.S. Born Mothers Immigrant Mothers
Children of Immigrants — Higher Rates of Food Insecurity and Poor Health40
25
20
35
30
15
10
5
0 Household Food Insecurity Fair/Poor Child Health
– Immigrants are less likely to receive federal benefits compared to general US-born population (undocumented immigrants as well as many recent immigrants [less than 5 years permanent resident status] are ineligible)35
– Even among those eligible, participation is disproportionately low due to language barriers, confusion about eligibility, citizenship status, administrative inefficiencies, and fear of deportation
- 20 -
Effects on Immigrant Health – Supplementary Sources
29. Hadley, C., S. Galea, et al. (2008). "Hunger and health among undocumented Mexican migrants in a US urban area." Public Health Nutr 11(2): 151-158.
30. Chilton, M., M. M. Black, et al. (2009). "Food insecurity and risk of poor health among US-born children of immigrants." Am J Public Health 99(3): 556-562.
31. Rosas, L. G., K. Harley, et al. (2009). "Dietary associations of household food insecurity among children of Mexican descent: results of a binational study." J Am Diet Assoc 109(12): 2001-2009.
32. Neault, N. B., D. A. Frank, et al. (2007). "Breastfeeding and health outcomes among citizen infants of immigrant mothers." J Am Diet Assoc 107(12): 2077-2086.
33. Kersey, M., J. Geppert, et al. (2007). "Hunger in young children of Mexican immigrant families." Public Health Nutr 10(4): 390-395.
34. Quandt, S. A., J. I. Shoaf, et al. (2006). "Experiences of Latino immigrant families in North Carolina help explain elevated levels of food insecurity and hunger." J Nutr 136(10): 2638-2644.
35. Kasper, J., A. F. Meyers, et al. (2000). "Hungry at Home: A Study of Food Insecurity Among Legal Immigrants in the United States." from http://physciansforhumanrights.org/library/documents/reports/hunger-at-home-a-study-of.pdf.
36. Borre, K., L. Ertle, et al. (2010). "Working to eat: Vulnerability, food insecurity, and obesity among migrant and seasonal farmworker families." Am J Ind Med 53(4): 443-462.
37. Weigel, M. M., R. X. Armijos, et al. (2007). "The household food insecurity and health outcomes of U.S.-Mexico border migrant and seasonal farmworkers." J Immigr Minor Health 9(3): 157-169.
38. Quandt, S. A., T. A. Arcury, et al. (2004). "Household food security among migrant and seasonal latino farmworkers in North Carolina." Public Health Rep 119(6): 568-576.
39. Dey, A. N. and J. W. Lucas (2006). "Physical and mental health characteristics of U.S.- and foreign-born adults: United States, 1998-2003." Adv Data(369): 1-19.
40. “Children of Immigrants: Healthy Beginnings Derailed by Food Insecurity.” Children’s HealthWatch Center. Boston Medical Center. 2010. Accessed 9/26/11. Available at: http://www.childrenshealthwatch.org/upload/resource/childrenimmigrants_brief_oct10.pdf.
.
Food Insecurity

- 21 -
FOOD Course Outline
Course objectives
Food Insecurity As defined by USDA and WHO Effects on health Prevalence in NYC Effects on immigrant health
Screening for Food Insecurity
Determining Eligibility & Food Resources Determining patient eligibility Emergency resources in NYC Emergency resources nationwide IHCD Contact Information

- 22 -
Screening for Food Insecurity
USDA US Household Food Security Module: – Most widely-used, validated measure – 18-item federal screener – Developed under U. S. Departments of Agriculture (USDA) and
Health and Human Services (DHHS) to create a sound national measure of food insecurity and hunger
– Available in English and Spanish Radimer/Cornell Hunger Scale
– 12-item generalized food insecurity and hunger scale, upon which the USDA Food Security Module is based
Assessment Tools
Screening
Become familiar with the research-validated assessment tools below. These tools may not be useful for all providers while examining patients. Use them to guide conversations with patients about food needs.

- 23 -
Practical tips for assessing patients41 (1 of 4)
DO ask patients concrete questions about their food and nutritional intake – Do you [ever] worry whether your food will run out before you get money to buy
more? – Do you [ever] feel that you cannot afford to eat the way you think you should? – Do you eat less than you think you should because you do not have enough money
for food?
With limited time for each patient, develop a plan to engage patients:
Screening
DO talk to your patients about the importance of nutrition and diet as pertaining specifically to the disease for which the patient is being treated
– Provide practical examples of the relationship between food and health outcomes – An example: “As a cancer patient, especially while you are actively receiving
treatment, it is important that you continue eating to maintain your weight.” DO ask food-security questions positively, by making statements and simplifying
responses – State facts and experiences:
– “Others say they are sometimes worried that food will run out….” – Simplify responses:
– “Was this never, sometimes, or often true for you?”

- 24 -
As part of a social history, DO ask about: – Patients’ diets, timing of meals, methods of cooking and shopping, unintended
weight loss, etc. – Patients’ answers can prompt providers to introduce questions about potential
disturbances in livelihood, income, family, and other problems that may affect patients' ability to obtain enough food
Screening
Practical tips for assessing patients41 (2 of 4)
With limited time for each patient, develop a plan to engage patients:
Additional food-related questions can be added into the social history – Who else lives in your household? How are they related to you? How old are they? – What does “enough food” mean to you and your family? – What does a “balanced meal” mean to your family? How often are you able to afford
to buy balanced meals? – At what times of the week/month/year are you most likely to run low on food? – How do you get through the day/week/month when food supplies and money run
low?

- 25 -
Screening
Practical tips for assessing patients41 (3 of 4)
Food insecurity is often “invisible”
DO NOT assume that because a patient answers ‘no’ to any one (or few) question(s), they are food secure
– If your patients have any risk factors for food insecurity, or you suspect that they might be at risk, ask at least four questions about their food intake and access
– Many patients tend to say they get enough food to eat when asked general screening questions; they are more likely to demonstrate food insecurity when asked more specific questions
DO Identify at-risk patients – Unemployed and under-employed – The elderly – Single-parent households – Substance abusers
DO NOT assume that you can identify food insecure patients by how they look – Food insecurity takes many forms. For some populations, such as food insecure
women, there may be a link between food insecurity and overweight/obesity.10
- 26 -
Practical tips for assessing patients41 (4 of 4)
DO be aware that food insecurity raises sensitive topics – Patients may not respond well to direct questions about hunger and financial
resources – Patients are likely to be embarrassed and/or ashamed; noting that food insecurity
issues are common may raise the patient’s comfort level – Remind patients that your concern is to improve patients’ health, not to judge
their financial situation – Patients may worry that their responses will attract attention of government
agencies that may threaten benefits, immigration status, custody or insurance status
Screening
Create a safe space where patients are comfortable to discuss food needs
DO provide patients with the option of receiving information about food resources without explicitly stating that they are food insecure or hungry
– Remind patients that everyone deserves adequate food and nutrition – Ensure that patients know how to access needed resources
For more information about talking to your patients, see this article: 41. Messer E, Ross EM. Talking to patients about food insecurity. Nutr Clin Care. 2002 Jul-
Aug;5(4):168-81. Available at: http://www.ncbi.nlm.nih.gov/pubmed/12380244.

- 27 -
FOOD Course Outline
Course objectives
Food Insecurity As defined by USDA and WHO Effects on health Prevalence in NYC Effects on immigrant health
Screening for Food Insecurity
Determining Eligibility & Food Resources Determining patient eligibility Emergency resources in NYC Emergency resources nationwide IHCD Contact Information

- 28 -
SNAP uses income to determine food stamp eligibility, but many in need still do not qualify
Income eligibility for SNAP42
42. USDA. SNAP. Applicants and Recipients. Accessed at : http://www.fns.usda.gov/snap/applicant_recipients/eligibility.htm
Given the especially low income thresholds and strict citizenship status requirements, many individuals in need of food assistance fall outside of the eligibility requirements
Resources
It is important to remember that many factors are taken into account when applying for SNAP benefits that may be relevant to patients. These include disabilities, children’s ages, medical bills, liquid assets, etc. As a result, it is helpful to encourage patients to assess eligibility online, over the phone, or with a local community-based organization.
Household Size
Gross Monthly Income (Pre-
Tax)
Maximum Allotment Level
1 $1,211 $200
2 $1,640 $367
3 $2,069 $526
4 $2,498 $668
5 $2,927 $793
6 $3,356 $952
7 $3,785 $1,052
8 $4,214 $1,202
Each added member +$429 +$150
Valid from October 2012 through September 2013
Many individuals in need of food assistance do not qualify because of strict income and immigration rules. Many other factors determine eligibility for SNAP benefits, such as disabilities, children’s ages, medical bills and liquid assets.
As a result, DO encourage patients to assess eligibility online, over the phone, or with a local community-based organization BEFORE they begin an application.
- 29 -
You should use any of the tools listed – or contact one of the centers below – to more accurately assess a patients’ need and eligibility for a variety of food assistance benefits.
Resources
Assessment and application tools
Assessment and application tools
Online using this food stamp eligibility assessment tool from the USDA: – USDA Eligibility Assessment
Online using this comprehensive benefits assessment tool (includes all NYC government benefits):
– Access NYC
Over the phone by calling the Food Bank for NYC’s food stamp information line Monday through Friday, 9AM to 3PM
– (212) 894-8060
At a facilitated enrollment center at one of the NYC community-based organizations here:
– Food Bank NYC Facilitated Enrollment Sites
Use these tools, or share them with your patients, in order to assess eligibility for SNAP benefits as well as other governmental and social programs. Access NYC will list all potential benefits families may be
entitled to, including childcare credit, health insurance programs, tax credits, and more.
- 30 -
Food Program Resources – New York City and Nationwide
Eligibility assessment and application assistance
The Food Bank for New York City conducts pre-screenings with low-income New Yorkers to assess their eligibility and move them toward participation in the food stamp program
One-on-one meetings provide New Yorkers with access to trained professionals who provide detailed information and answer questions regarding food stamps
The information call center (212.894.8060) is available five days per week, providing regular access to food stamp specialists who can conduct pre-screenings and answer questions
Electronic application assistance is provided through 21 sites in all five boroughs and actively works to recruit additional sites from our citywide network of member programs and other community-based organizations.
Resources
- 31 -
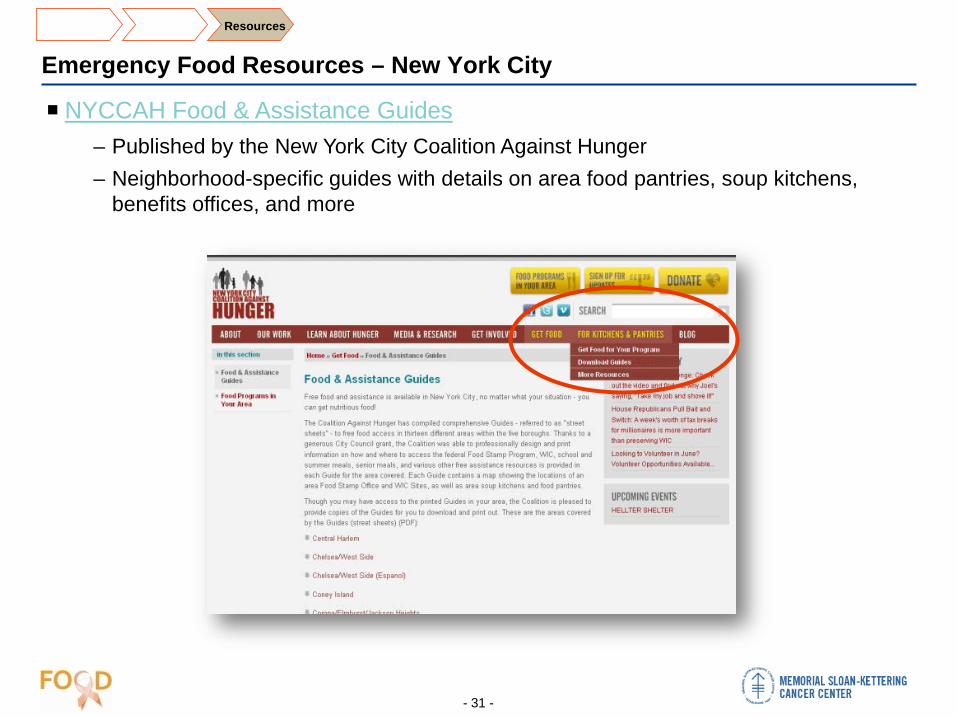
Emergency Food Resources – New York City
NYCCAH Food & Assistance Guides – Published by the New York City Coalition Against Hunger – Neighborhood-specific guides with details on area food pantries, soup kitchens,
benefits offices, and more
Resources

- 32 -
Other Food Resources – New York City and Nationwide
New York City
Angel Food Ministries – Provides food at costs much lower than list or supermarket
price. Clients order food ahead of time and pick it up at a local sites (usually churches and community-based organizations)
God’s Love We Deliver – A provider of nutritious, individually-tailored meals to people
who are too sick to shop or cook for themselves in the tri-state area
– Application needs to be completed by client and signed by a physician – it can be downloaded here
Citymeals on Wheels – Funds 30 community-based agencies that bring weekend,
holiday and emergency meals to homebound elderly (60 years old and older) New Yorkers who can no longer shop or cook for themselves
– Referrals are made through case management agencies that can be located by patient zip code here
Resources

- 33 -
Other Food Resources – Nationwide
Feeding America Search Tool – National food pantry/emergency food program search tool, filterable by state or zip code
Resources
- 34 -
For more information or to contact the Immigrant Health and Cancer Disparities Service
Immigrant Health and Cancer Disparities Service (IHCD) Memorial Sloan Kettering Cancer Center 300 East 66 Street, 15th floor New York, NY 10065 Website: http://www.mskcc.org/mskcc/html/103456.cfm Phone: 646-888-4600 Contact: Julia Ramirez ([email protected])
Resources
- 35 -
Glossary
Food insecure: At times during the year, these households were uncertain of having, or unable to acquire, enough food to meet the needs of all their members because they had insufficient money or other resources for food. Food-insecure households include those with low food security and very low food security.
– 14.7% (17.4 million) of U.S. households were food insecure at some time during 2009 – Essentially unchanged from 14.6% in 2008.
Low food security: These food-insecure households obtained enough food to avoid substantially disrupting their eating patterns or reducing food intake by using a variety of coping strategies, such as eating less varied diets, participating in Federal food assistance programs, or getting emergency food from community food pantries.
– 9.0% (10.6 million) of U.S. households had low food security in 2009 – Essentially unchanged from 8.9% in 2008
Very low food security: In these food-insecure households, normal eating patterns of one or more household members were disrupted and food intake was reduced at times during the year because they had insufficient money or other resources for food. In reports prior to 2006, these households were described as “food insecure with hunger.”
– 5.7 % (6.8 million) of U.S. households had very low food security at some time during 2009 – Unchanged from 5.7% in 2008
SNAP: Supplemental Nutrition Assistance Program (SNAP), the Federal name for Food Stamp program. – Administered by the U.S. Department of Agriculture (USDA), the New York State Food Stamp (FS) Program issues monthly
electronic benefits that can be used like cash at authorized retail food stores – SNAP is the nation’s largest source of nutrition assistance, currently providing $64.7 billion in benefits per month to 40.3
million Americans – Eligibility and benefit levels are based on household size, income, assets and other factors
Top Related