


Languages
Pages
Legal

Follow us at: /hcltechnologies /hcltech /hcltechtube
2
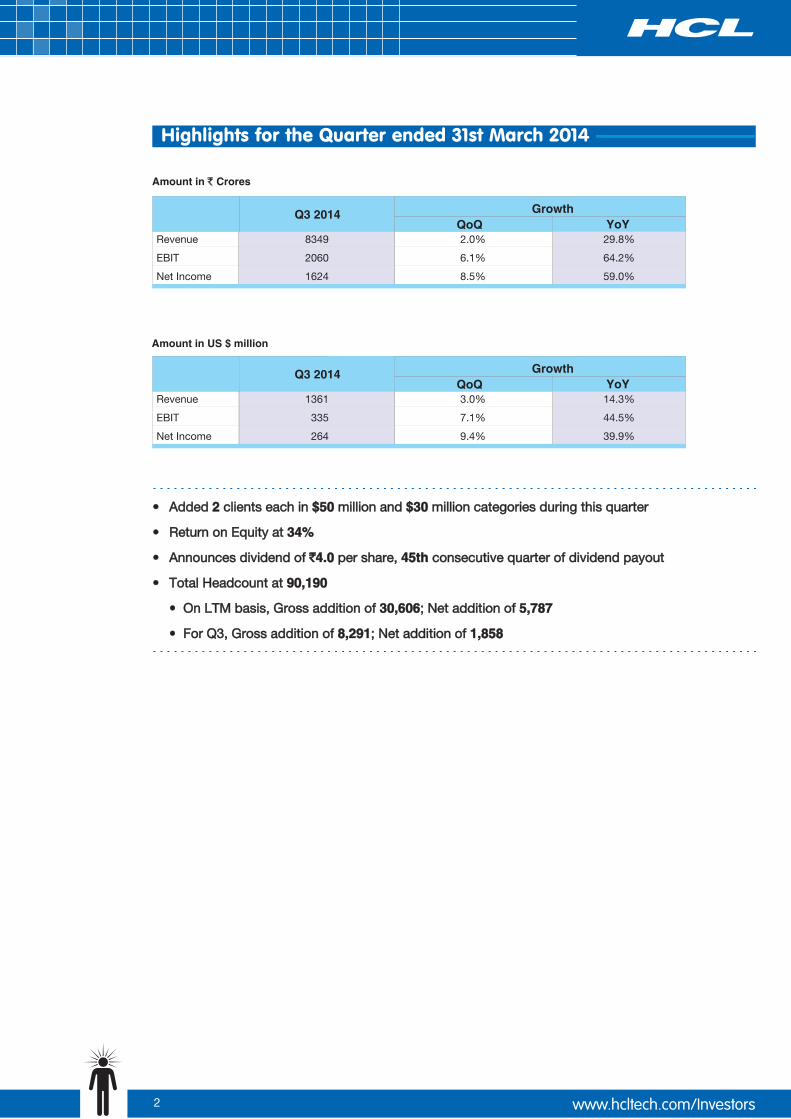
Amount in US $ million
Q3 2014QoQ YoY
Growth
Revenue 8349 2.0% 29.8%
EBIT 2060 6.1% 64.2%
Net Income 1624 8.5% 59.0%
Q3 2014QoQ YoY
Growth
Revenue 1361 3.0% 14.3%
EBIT 335 7.1% 44.5%
Net Income 264 9.4% 39.9%
`
• Added 2 clients each in $50 million and $30 million categories during this quarter
• Return on Equity at 34%
• Announces dividend of `4.0 per share, 45th consecutive quarter of dividend payout
• Total Headcount at 90,190
• On LTM basis, Gross addition of 30,606; Net addition of 5,787
• For Q3, Gross addition of 8,291; Net addition of 1,858
Highlights for the Quarter ended 31st March 2014
`
• Return on Equity at 34%
• Announces dividend of `4.0 per share, 45th consecutive quarter of dividend payout
• Total Headcount at 90,190; Gross addition of 8,291; Net addition of 1,858
• Return on Equity at 34%
• Announces dividend of `4.0 per share, 45th consecutive quarter of dividend payout
• Total Headcount at 90,190; Gross addition of 8,291; Net addition of 1,858
3
HCL continues to push the pedal on its new generation propositions including Digital System Integration while maintaining its profitable growth trajectory.
“Our leadership has been driven by our commitment towards sustainability, diversity and trust through transparency. With an emergence of an increasingly positive macro environment these values will continue to be HCL’s key differentiators and provide an impetus to our future growth”, said Shiv Nadar, Chairman & Chief Strategy Officer, HCL Technologies.
“We continue on our growth momentum with a strong revenue growth of 3% QoQ along with 10th straight quarter of margin expansion. Our EBIT has registered an impressive expansion of 7.1% sequentially and 44.5% YoY resulting in a healthy EBIT margin of 24.6%. The Application Services business registered a robust performance led by Digital Systems Integration proposition on the discretionary side and ALT ASM™ on the non-discretionary side this quarter. Infrastructure Services have continued to punch their weight in the market”, said Anant Gupta, President & CEO, HCL Technologies.
“We continue on our journey of making significant investments in talent acquisition by on-boarding several senior leaders representing a mix of industry and skill profiles to exponentially multiply our capability in the emerging Digital Systems Integration space.”, he added.
“Our success with the industrialized delivery model, increasing number of contracts moving into steady state, savings on G&A front, helped in improved net income margin of 19.4% this quarter, up from 15.9% in the corresponding quarter of last year. This has provided us more room for making relevant investments in a rapidly changing market landscape. Our focus on generating higher free cash flow continued during the quarter with free cash flow as %age of EBITDA reaching 73%, up from 61% in the corresponding period last year. The return on capital employed (LTM basis) was at 38%, higher than 32% achieved in the corresponding quarter last year”, said Anil Chanana, CFO, HCL Technologies.
4
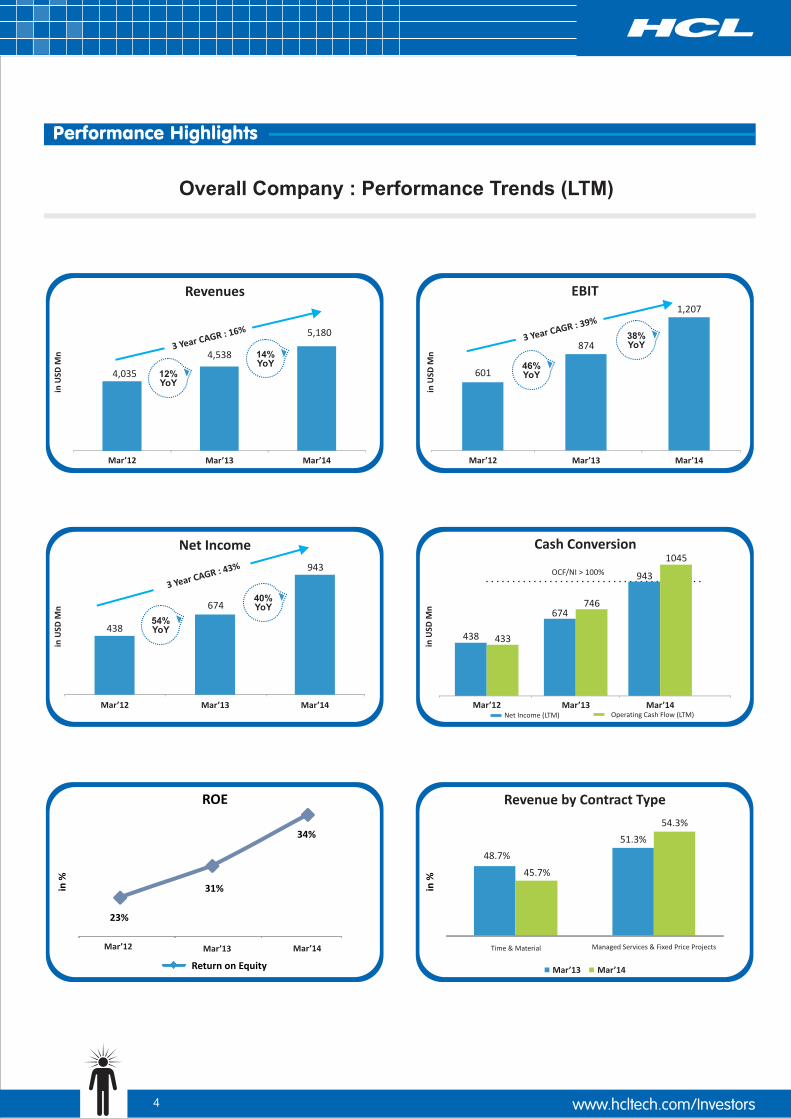
Overall Company : Performance Trends (LTM)
Cash Conversion
438 433
674746
1045
Net Income (LTM) Operating Cash Flow (LTM)
943OCF/NI > 100%
in
Mn
USD
ROE
Return on Equity
in %
4,035
4,538
5,180
in
Mn
USD
Revenues
3 Year CAGR : 16%
EBIT
in
Mn
USD 601
874
1,207
3 Year CAGR : 39%
438
674
943
Net Income
3 Year CAGR : 43%
in
Mn
USD
23%
31%
34%
30-Jun-10Managed Services & Fixed Price ProjectsTime & Material
Revenue by Contract Type
48.7%
51.3%
45.7%
54.3%
in %
Mar’12 Mar’13 Mar’14
Mar’13 Mar’14
Mar’14Mar’12 Mar’13
Mar’12 Mar’13 Mar’14 Mar’12 Mar’13 Mar’14
Mar’12 Mar’13 Mar’14
12%YoY
4,035
4,538
5,180
in
Mn
USD
Revenues
3 Year CAGR : 16%
Mar’12 Mar’13 Mar’14
12%YoY
14%YoY
Cash Conversion
438 433
674746
1045
Net Income (LTM) Operating Cash Flow (LTM)
943OCF/NI > 100%
in
Mn
USD
ROE
Return on Equity
in %
4,035
4,538
5,180
in
Mn
USD
Revenues
3 Year CAGR : 16%
EBIT
in
Mn
USD 601
874
1,207
3 Year CAGR : 39%
438
674
943
Net Income
44%
44%
3 Year CAGR : 43%
in
Mn
USD
23%
31%
34%
30-Jun-10Managed Services & Fixed Price ProjectsTime & Material
Revenue by Contract Type
48.7%
51.3%
45.3%
54.7%
in %
Mar’12
12%YoY
14%YoY 46%
YoY
38%YoY
54%YoY
40%YoY
Mar’13 Mar’14
Mar’13 Mar’14
Mar’14Mar’12 Mar’13
Mar’12 Mar’13 Mar’14 Mar’12 Mar’13 Mar’14
Mar’12 Mar’13 Mar’14
54%YoY
40%YoY
46%YoY
38%YoY
12%YoY
14%YoY

5
Revenue Growth (in US$)
In Reported Currency (QoQ and Quarterly YoY)
Particulars Segments
QoQ YoY
31-Mar-14
Consolidated For the Company 3.0% 14.3%
Geography Americas 0.4% 11.0%
Europe 4.8% 26.0%
ROW 11.1% 4.0%
Service
Custom Application Services 2.2% 6.7% Enterprise Application Services 4.0% 3.9%
Infrastructure Services 5.1% 31.5%
Business Services -0.7% 18.8%
Engineering and R&D Services 0.1% 7.8%
Application Services 2.9% 5.6%
Verticals
Manufacturing 2.0% 18.2%
Public Services 13.9% 49.8%
Retail & CPG 2.8% 9.7%
Financial Services 6.8% 22.7%
6
HCL has signed 12 Transformational engagements this quarter and over $1bn in Total Contract Value. Digital Systems Integration, ALT ASM™ and Infrastructure Management Services continue to drive the deal win momentum. Financial and Manufacturing led the wins in Verticals and US and Europe in Geographies.
HCL continues its journey on diversity, sustainability and ‘Employees First, Customers Second’ philosophy translating to best-in-class customer satisfaction.
• Anant Gupta, President & CEO, HCL Technologies has received the ‘2014 Women’s Empowerment Principles (WEPs) Leadership Award – 7 Principles’ for developing and implementing a comprehensive internal and external strategy based on the WEPs’ seven principles for advancing and empowering women in the workplace, marketplace and community.
• Roshni Nadar Malhotra, Non-Executive Director on the Board of HCL Technologies, has been selected as a ‘Young Global Leader’ by the World Economic Forum (WEF). ‘The Forum of Young Global Leaders’ is a unique, multi stakeholder community of exceptional young leaders participate actively in driving the global agenda at WEF.
• HCL has been honored with the ‘Global Sustainability Leadership Awards 2014’ under the category ‘Best Community Action’ at the World CSR Congress. The award recognizes Best Practices & Outstanding Individuals engaged in Corporate & Social Responsibility.
• HCL has partnered with United Way of the Greater Triangle, a US based non-profit organization, to develop a social service program called GirlSTRIDE (Girls Striving to Reach Ideals in Education). This project will focus on increasing graduation rates for young women in New York, New Jersey and Connecticut states.
• HCL has been named the ‘Customer Experience Leader’ by Consumer Goods Technology (CGT) magazine in its ‘2014 Readers’ Choice Survey Report’. HCL received the highest customer satisfaction rating for its services in the CPG space under the Outsourcing category.
®• HCL has received the ‘SAP North America Regional Partner Excellence Award 2014 for Managed Cloud as a Service/OEM’. These Awards are presented by SAP to their top-performing partners in North America.
• For the eighth consecutive year, HCL has been recognized as one of ‘Britain’s Top Employers’ for its employee friendly HR policies and practices.
• HCL has won six prestigious awards at the Global Talent Acquisition & Recruiting & Staffing Best in Class (RASBIC) Awards for ‘Best Overall Recruiting and Staffing Organization of the year’, ‘Innovation in Recruitment’, ‘Most Innovative Recruiting & Staffing program’, ‘Best use of technology for recruiting’, ‘Best social networking recruitment effort’ and ‘Best B School recruiting program’.
• The video expression of HCL’s philosophy ‘Relationships Beyond the Contract’ (RBtC) has garnered more than 2 million plus views on Youtube. ‘Relationship Beyond the Contract’ philosophy is an evolution of HCL’s ‘Employees First’ strategy and underlines the fact that true business value lies in the enduring relationships that can be built between customers and providers. http://hclte.ch/rbtcspirit
7
This quarter HCL delivered a broad-based bookings performance. The company brought home many significant Gen 2.0 engagements representing ALT ASM™, Digital Systems Integration, Infrastructure Management Services, eFaaS and Engineering Services propositions.
• A UK Government Agency has selected HCL to build an advanced lending and payments application for its rapidly growing customer base. HCL will replace the client’s existing legacy applications with the new generation banking platform and enterprise security access management solution.
• One of Norway’s leading financial services institution has selected HCL for IT infrastructure Services and Application Operations for its non-mainframe platforms and end user services. HCL will deliver these services through its global delivery network.
• HCL has won an end to end Application Managed Services engagement from a US based Fortune 500 global supplier of drivetrain, mobility, braking and aftermarket solutions for commercial vehicle and industrial markets. Aside from Operational Transformation, HCL will also be helping the customer in its Business Transformation and Technology Transformation initiatives. HCL will leverage its Global Delivery network across North America, Europe, Latin America and India to deliver these services.
• HCL has been selected as a technology partner by a leading US based financial services and payments company for support and operations of its global digital platform. This engagement will see HCL support and provide integrated technology solutions that will allow the client to introduce new products in existing regions and facilitate entry into new market spaces.
• HCL has won an engagement from a Swiss pharmaceutical company to deliver Infrastructure Services for their entire Data Centre landscape globally.
• HCL has signed an engagement to deliver a B2B digital platform which integrates products and services across business functions for a Europe headquartered global hygiene and forest company.
• HCL has won a deal for Cloud based SaaS and IaaS solution design and implementation for a major Middle-Eastern Telecommunication Company.
• A leading Japanese High Technology firm has chosen HCL to develop its next generation of Supercomputers. HCL would be supporting the architecture, design and development of the future Supercomputers as the company’s sole partner.
• HCL has started prototype development for the mid-segment DSLR cameras for one of Japan’s leading precision instrument manufacturer.
• A G2000 Bank has awarded HCL with an end-to-end Captive IT Security Operation Centre (SOC) Build and Run contract.
• HCL has won an engagement to refresh and roll-out countrywide Enterprise Network for a leading Indian Government undertaking.
• HCL has won an engagement by a Government of India undertaking for the upgradation and expansion of its private cloud ICT Infrastructure.
• An Indian Government Regulator has selected HCL for implementation of an Enterprise-wide Unified Communication and Collaboration Solution.
8
Digital Systems Integration
With some remarkable accolades in the past like a ‘Leader’ citation in The Forrester Research’s The Forrester Wave™: Enterprise Mobility Services, Q1 2013 , by Liz Herbert, February 15, 2013 and IDC’s rating of HCL as ‘Major Player’ in its IDC Market Scape : WorldwideSalesforce.com Implementation Eco system 2013 Vendor Analysis, October 2013, IDC #243620 and a feature in its report on “IT Service Providers’ Cloud Strategies” in Europe June 2013, IDC# QL03V, HCL’s Digital Systems Integration capabilities continue to gather positive reviews and ratings from the analyst community this quarter too.
• HCL has been positioned as a Leader in in the IDC MarketScape: Worldwide Mobile Application Development, Testing, Management, and Infrastructure Services 2014 Vendor Assessment, March 2014. According to the report “HCL earned high marks against IDC's customer satisfaction rating category and level of marketing investment for its mADTMI services. In client interviews, HCL clients shared glowing remarks on HCL's technical strength and industry knowledge, experience with mobility, and its deep rooted relationships with mobile device manufacturers”
• IDC has positioned HCL in the ‘Major Players’ category within Worldwide Life Science R&D Strategic Consulting Services 2014 MarketScape report. “HCL is particularly strong in delivering analytics solution services to its clients”, said the Report. “With its strong, industry-centric focus, HCL is aggressively growing its industry offerings with a goal of becoming a full-service resource to top life science companies over the next several years”, it added.
• TBR has published an exclusive white paper titled ‘HCLT’s App Test Factory Service Line Unit reduces testing costs and time to market for mobile applications’. The white paper notes, “HCLT’s App Test Factory solution addresses multiple client pain points associated with mobile application testing by eliminating the need to continually invest in new tools and test cases for each new device or platform and by enabling organizations to manage testing resources agilely across locations through a single portal.”
ALT ASM™
HCL’s ALT ASM™ offering has gathered a lot of encouraging comments from the analyst community over the last one year which have been reinforced with some new reports released this quarter, like:
• HCL has been positioned as a ‘Leader’ in The Forrester Wave™: North American Applications Outsourcing Services, Q1 2014 authored by William Martorelli, Forrester Research Inc.
• HCL has been rated as a ‘Leader’ in The Forrester Wave™: EMEA Application Outsourcing Services,Q1 2014 authored by William Martorelli, Forrester Research Inc.
• IDC has positioned HCL in the ‘Leaders’ category within Worldwide Life Science R&D ITO 2013 IDC MarketScape report. “HCL is particularly strong in delivering application development and management, testing, and laboratory systems integration services to its clients”, the report said.
ITO
HCL has garnered many accolades this fiscal on its ITO positioning including being listed by ISG amongst the ‘Top ITO Service Providers based on 1H13 ACV awarded’. The company was also positioned as a ‘Challenger’ in Gartner’s “Magic Quadrant for SAP Implementation Service Providers Worldwide”, 8 August 2013 by Susan Tan and a ‘Leader’ in Gartner’s “Magic Quadrant for Communications Outsourcing and Professional Services”, 21 October 2013 by Eric Goodness,
1Christine Tenneson . Along with being cited as a ‘Leader’ and ‘Star Performer’ in an Everest Group report titled ‘IT Outsourcing in Life Sciences Industry - Service Provider Landscape’. This quarter the company continued its thought leadership in the space through citations like:
• HCL has been named a Leader in The Forrester Wave™: Software Product Development Services, Q1 2014 by Charles Green, Forrester Research, Inc., March 31, 2014. HCL received the highest score in strategy and market presence tied among all the 11 service providers evaluated for this report.
• HCL has been cited as a ‘Leader’ in both ITO and BPO in ISG’s report ‘The Global ISG Outsourcing Index Market Data and Insights Fourth Quarter and Full Year 2013’.
• HCL has been listed amongst the Top 20 ITO and BPO Service Providers in EMEA in ISG’s Report ‘The ISG EMEA Outsourcing Index Market Data and Insights Fourth Quarter and Full Year 2013’.
9
http://research.nelson-hall.com/search/?avpageviews=article&searchid=17785&fv=1&id=78583?utm_source=HCL&utm_medium=whitepaper&utm_campaign=HC
1Gartner does not endorse any vendor, product or service depicted in its research publications, and does not advise technology users to select only those vendors with the highest ratings. Gartner research publications consist of the opinions of Gartner's research organization and should not be construed as statements of fact. Gartner disclaims all warranties, expressed or implied, with respect to this research, including any warranties of merchantability or fitness for a particular purpose.
10
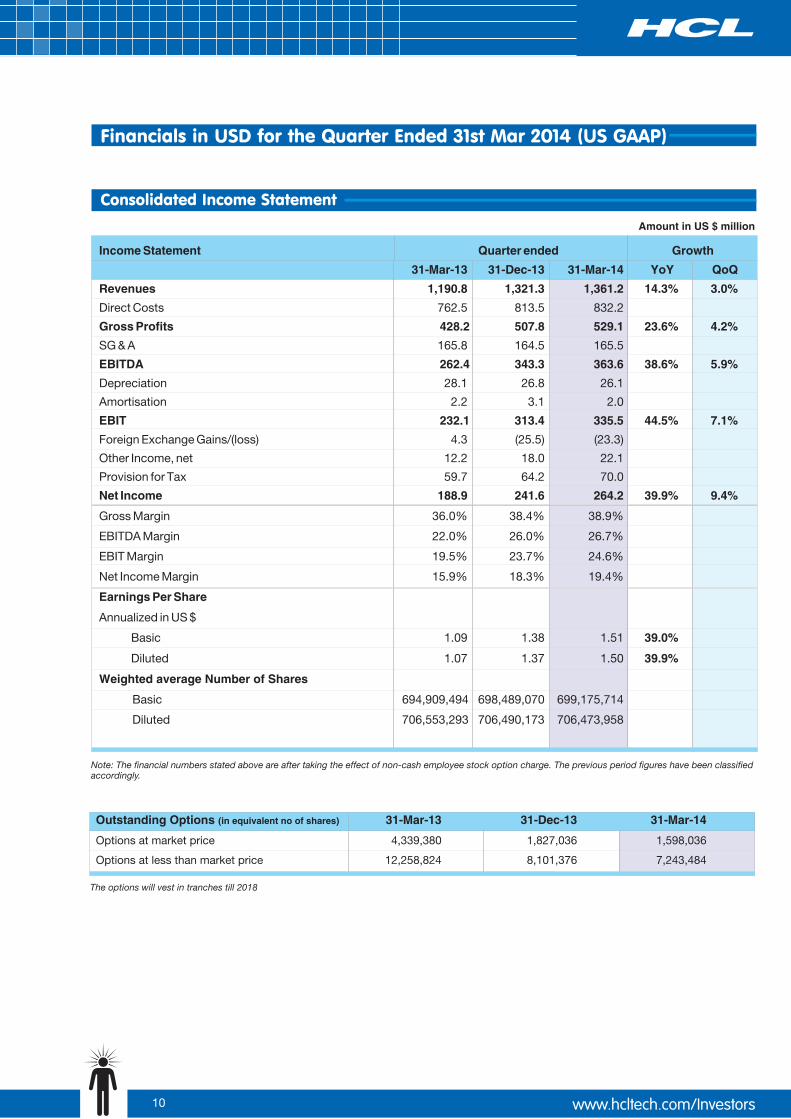
Amount in US $ million
Note: The financial numbers stated above are after taking the effect of non-cash employee stock option charge. The previous period figures have been classified accordingly.
Outstanding Options (in equivalent no of shares) 31-Mar-13 31-Dec-13 31-Mar-14
Options at market price 4,339,380 1,827,036 1,598,036
Options at less than market price 12,258,824 8,101,376 7,243,484
The options will vest in tranches till 2018
Income Statement Quarter ended Growth
31-Mar-13 31-Dec-13 31-Mar-14 YoY QoQ
Revenues 1,190.8 1,321.3 1,361.2 14.3% 3.0%
Direct Costs 762.5 813.5 832.2
Gross Profits 428.2 507.8 529.1 23.6% 4.2%
SG & A 165.8 164.5 165.5
EBITDA 262.4 343.3 363.6 38.6% 5.9%
Depreciation 28.1 26.8 26.1
Amortisation 2.2 3.1 2.0
EBIT 232.1 313.4 335.5 44.5% 7.1%
Foreign Exchange Gains/(loss) 4.3 (25.5) (23.3)
Other Income, net 12.2 18.0 22.1
Provision for Tax 59.7 64.2 70.0
Net Income 188.9 241.6 264.2 39.9% 9.4%
Gross Margin 36.0% 38.4% 38.9%
EBITDA Margin 22.0% 26.0% 26.7%
EBIT Margin 19.5% 23.7% 24.6%
Net Income Margin 15.9% 18.3% 19.4%
Earnings Per Share
Annualized in US $
Basic 1.09 1.38 1.51 39.0%
Diluted 1.07 1.37 1.50 39.9%
Weighted average Number of Shares
Basic 694,909,494 698,489,070 699,175,714
Diluted 706,553,293 706,490,173 706,473,958

11
Amount in US$ million
Particulars As on
Assets
Cash and Cash Equivalents
Accounts Receivables, net
Unbilled Receivables
Deposits
Investment Securities,
Investment Securities, available for sale
Other Current Assets
Total Current Assets
Property and Equipments, net
Intangible Assets, net
Investment Securities, held to maturity
Investments in Equity Investee
Other Assets
Total Assets
Liabilities & Stockholders Equity
Current Liabilities
Borrowings
Other Liabilities
Total Liabilities
Total Stockholders Equity
Total Liabilities and Stockholders Equity 4,315.7 4,743.2
31-Dec-13 31-Mar-14
135.1 174.5
793.4 882.2
333.2 357.7
Fixed 887.8 1,107.8
held to maturity 32.2 34.8
105.1 80.8
314.7 352.7
2,601.6 2,990.6
463.0 507.2
847.7 850.8
8.1 -
2.0 2.2
393.3 392.4
4,315.7 4,743.2
1,178.5 1,272.1
118.1 149.1
278.1 263.5
1,574.7 1,684.7
2,741.0 3,058.5

12
Amount in US $ million
Particulars
CASH FLOWS FROM OPERATING ACTIVITIES
Net Income
Adjustments to Reconcile Net Income to Net Cash provided by Operating Activities
Depreciation and Amortization
Others
Changes in Assets and Liabilities, net
Accounts Receivable
Other Assets
Current Liabilities
Net Cash provided by Operating Activities
CASH FLOWS FROM INVESTING ACTIVITIES
Purchase of Property and Equipment (net)
(Purchase) / Sale of Investments
Net Cash used in Investing Activities
CASH FLOWS FROM FINANCING ACTIVITIES
Proceeds from Issuance of Employees Stock Options
Dividend
Loans
Others
Net Cash provided by (used in) Financing Activities
CASH AND CASH EQUIVALENTS
Beginning of the Period
End of the Period
For Quarter For Nine Months Ended March'14 Ended March'14
264.2 731.6
28.1 89.6
(10.4) (17.1)
(109.9) (205.9)
(16.7) (18.5)
78.7 129.1
234.1 708.7
(43.3) (88.4)
Proceeds from sale of property and equipment (including advance) 26.5 38.2
35.6 5.9
Fixed Deposits (increase) / decrease (187.3) (487.8)
(168.5) (532.2)
0.7 3.9
(64.2) (157.6)
27.7 32.0
0.2 (2.0)
(35.6) (123.7)
Effect of Exchange Rate on Cash and Cash Equivalents 9.4 (1.6)
Net Increase/ (Decrease) in Cash and Cash Equivalents 39.4 51.3
135.1 123.3
174.5 174.5

13
Geographic Mix
Americas
Europe
ROW
31-Mar-13 31-Dec-13 31-Mar-14 LTM Mix
57.1% 56.9% 55.4% 56.6%
28.9% 31.3% 31.8% 31.0%
14.0% 11.8% 12.8% 12.4%
Revenue by Contract Type
Managed Services & Fixed Price Projects 53.9% 54.3% 55.7%
Time & Material 46.1% 45.7% 44.3%
31-Mar-13 31-Dec-13 31-Mar-14
Service Mix
Engineering and R&D Services
31-Mar-13 31-Dec-13 31-Mar-14 LTM Mix
Application Services 48.7% 45.1% 45.0% 45.7%
Custom Application Services 29.7% 28.0% 27.7% 28.3% Enterprise Application Services 19.0% 17.1% 17.2% 17.3%
Infrastructure Services 29.9% 33.7% 34.4% 33.2%
Business Services 4.3% 4.6% 4.5% 4.4%
17.1% 16.6% 16.1% 16.7%
Revenue by Vertical
32.2% 33.7% 33.3% 33.3%
31-Mar-13 31-Dec-13 31-Mar-14 LTM Mix
Financial Services 25.0% 25.9% 26.9% 26.0%
Manufacturing
Lifesciences & Healthcare 11.3% 10.8% 10.4% 11.0%
Public Services 7.7% 9.2% 10.1% 8.8%
Retail & CPG 8.9% 8.6% 8.5% 8.5%
Telecommunications, Media, Publishing & Entertainment 10.0% 8.9% 8.4% 9.1%
Others 4.8% 3.1% 2.3% 3.3%
Note: Telecom vertical revenue consisted of revenue from Telecom Equipment manufacturers and from telecom service providers. Effective 1st July, 2013, Revenue from Telecom Manufacturing part has been classified under 'Manufacturing' vertical while revenue from Telecom Service Providers has been clubbed with ‘Media, Publishing & Entertainment'.
14
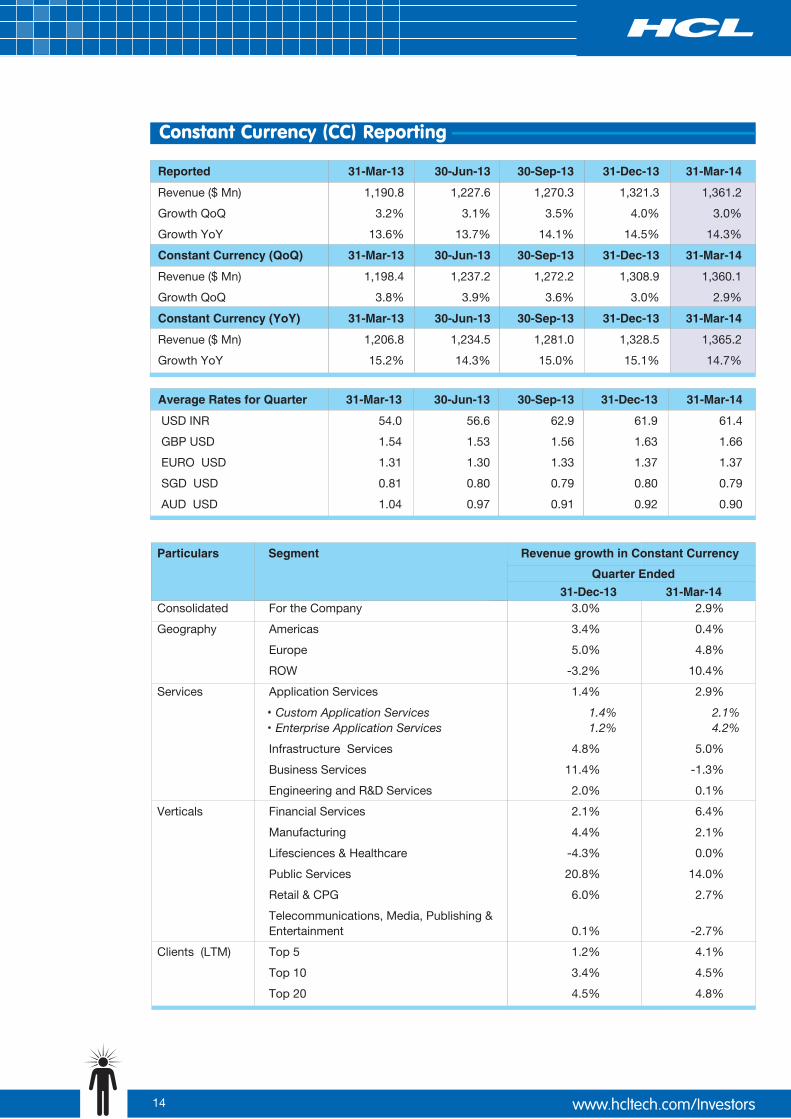
Reported 31-Mar-13 30-Jun-13 30-Sep-13 31-Dec-13 31-Mar-14
Revenue ($ Mn) 1,190.8 1,227.6 1,270.3 1,321.3 1,361.2
Growth QoQ 3.2% 3.1% 3.5% 4.0% 3.0%
Growth YoY 13.6% 13.7% 14.1% 14.5% 14.3%
Constant Currency (QoQ)
Revenue ($ Mn) 1,198.4 1,237.2 1,272.2 1,308.9 1,360.1
Growth QoQ 3.8% 3.9% 3.6% 3.0% 2.9%
Constant Currency (YoY)
Revenue ($ Mn) 1,206.8 1,234.5 1,281.0 1,328.5 1,365.2
Growth YoY 15.2% 14.3% 15.0% 15.1% 14.7%
31-Mar-13 30-Jun-13 30-Sep-13 31-Dec-13 31-Mar-14
31-Mar-13 30-Jun-13 30-Sep-13 31-Dec-13 31-Mar-14
Average Rates for Quarter 31-Mar-13 30-Jun-13 30-Sep-13 31-Dec-13 31-Mar-14
USD INR 54.0 56.6 62.9 61.9 61.4
GBP USD 1.54 1.53 1.56 1.63 1.66
EURO USD 1.31 1.30 1.33 1.37 1.37
SGD USD 0.81 0.80 0.79 0.80 0.79
AUD USD 1.04 0.97 0.91 0.92 0.90
Particulars Segment Revenue growth in Constant Currency
Consolidated For the Company 3.0% 2.9%
Geography Americas 3.4% 0.4%
Europe 5.0% 4.8%
ROW -3.2% 10.4%
Services Application Services 1.4% 2.9%
Custom Application Services 1.4% 2.1% Enterprise Application Services 1.2% 4.2%
Infrastructure Services 4.8% 5.0%
Business Services 11.4% -1.3%
Engineering and R&D Services 2.0% 0.1%
Verticals Financial Services 2.1% 6.4%
Manufacturing 4.4% 2.1%
Lifesciences & Healthcare -4.3% 0.0%
Public Services 20.8% 14.0%
Retail & CPG 6.0% 2.7%
Telecommunications, Media, Publishing & Entertainment 0.1% -2.7%
Clients (LTM) Top 5 1.2% 4.1%
Top 10 3.4% 4.5%
Top 20 4.5% 4.8%
31-Dec-13 31-Mar-14
Quarter Ended

15
Client Contribution to Revenue (LTM) QoQ growth
Top 5 Clients 15.4% 14.8% 15.0% 4.4%
Top 10 Clients 24.0% 23.8% 24.1% 4.6%
Top 20 Clients 32.8% 33.6% 34.2% 5.2%
31-Mar-13 31-Dec-13 31-Mar-14
YoYChange
“LTM” - Last Twelve Months
Client Business
New Clients 6.7% 3.4% 3.9%
Existing Clients 93.3% 96.6% 96.1%
Days Sales Outstanding - excluding unbilled receivables 53 54 58
31-Mar-13 31-Dec-13 31-Mar-14
31-Mar-13Number of Million Dollar Clients (LTM)
100 Million dollar + 5 6 1
50 Million dollar + 10 14 4
40 Million dollar + 15 18 3
30 Million dollar + 29 32 3
20 Million dollar + 51 64 13
10 Million dollar + 98 109 11
5 Million dollar + 187 183 (4)
1 Million dollar + 422 432 10
31-Mar-14
16
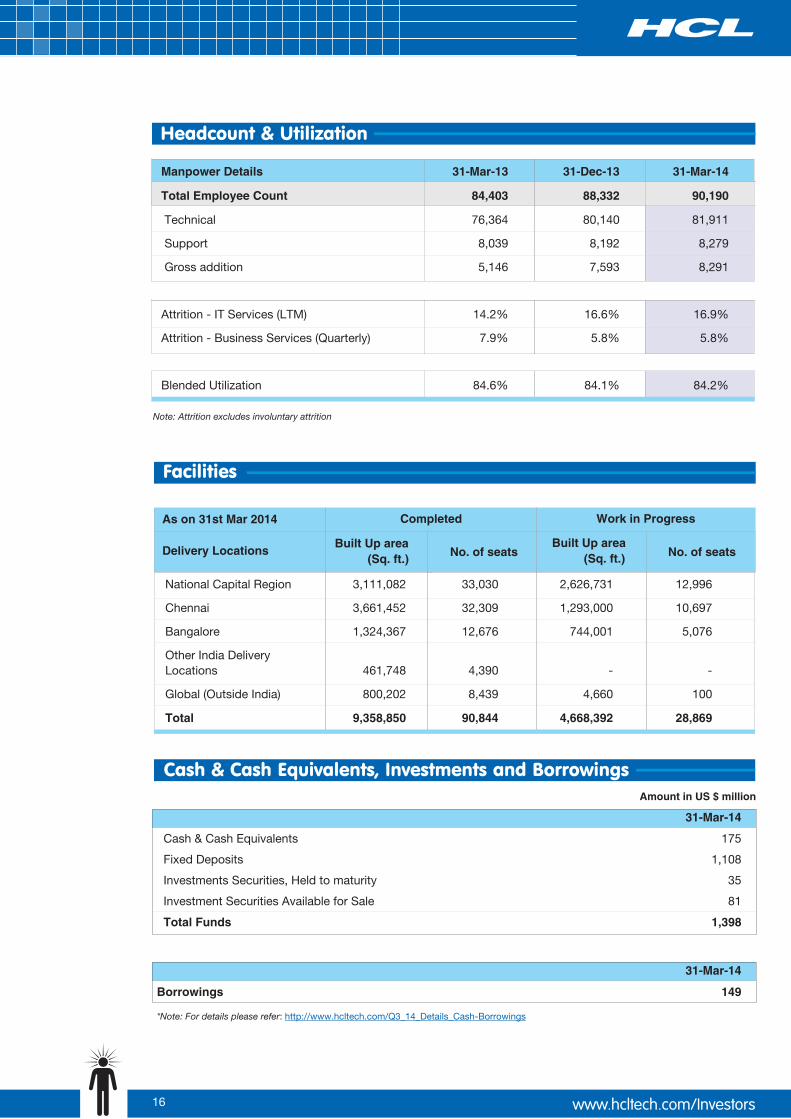
Note: Attrition excludes involuntary attrition
Manpower Details
Total Employee Count 84,403 88,332 90,190
Technical 76,364 80,140 81,911
Support 8,039 8,192 8,279
Gross addition 5,146 7,593 8,291
Attrition - IT Services (LTM) 14.2% 16.6% 16.9%
Attrition - Business Services (Quarterly) 7.9% 5.8% 5.8%
Blended Utilization 84.6% 84.1% 84.2%
31-Mar-13 31-Dec-13 31-Mar-14
*Note: For details please refer: http://www.hcltech.com/Q3_14_Details_Cash-Borrowings
Amount in US $ million
31-Mar-14
Cash & Cash Equivalents 175
Fixed Deposits 1,108
Investments Securities, Held to maturity 35
Investment Securities Available for Sale 81
Total Funds 1,398
Borrowings 149
31-Mar-14
As on 31st Mar 2014 Completed Work in Progress
Built Up area (Sq. ft.) No. of seats
Built Up area (Sq. ft.) No. of seatsDelivery Locations
National Capital Region 3,111,082 33,030 2,626,731 12,996
Chennai 3,661,452 32,309 1,293,000 10,697
Bangalore 1,324,367 12,676 744,001 5,076
Other India Delivery Locations 461,748 4,390 - -
Global (Outside India) 800,202 8,439 4,660 100
Total 9,358,850 90,844 4,668,392 28,869
17
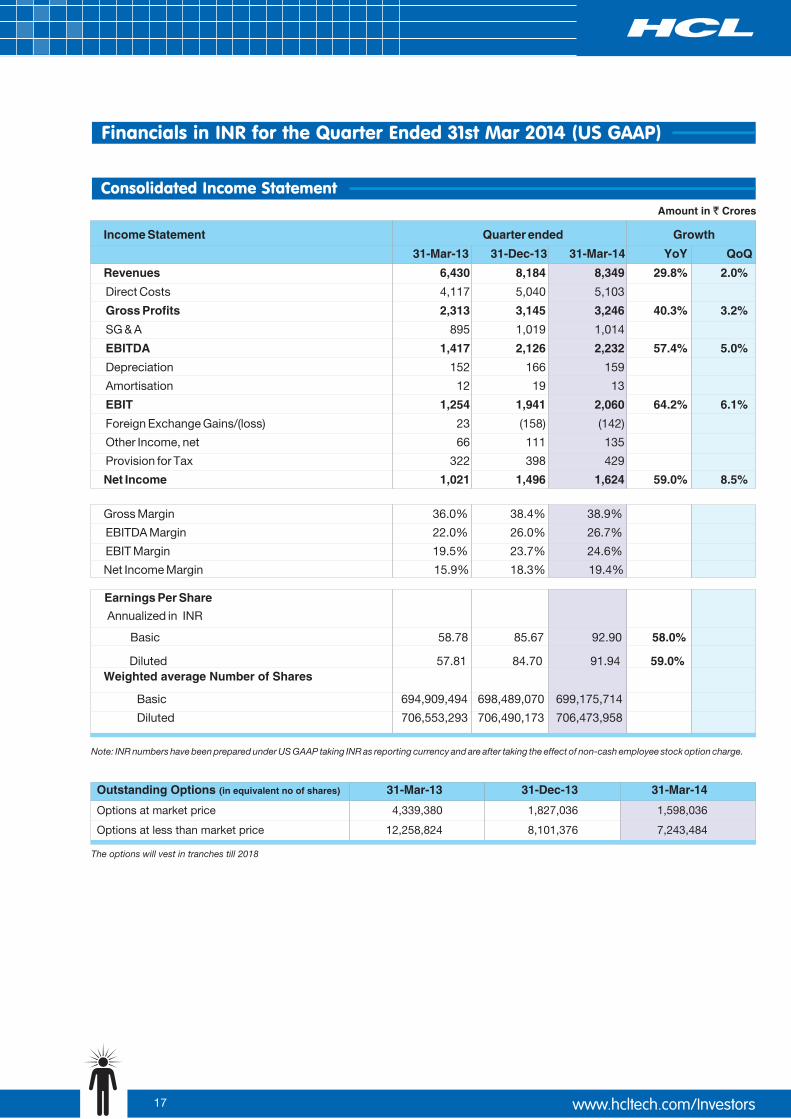
The options will vest in tranches till 2018
Income Statement Quarter ended Growth
31-Mar-13 31-Dec-13 31-Mar-14 YoY QoQ
Revenues 6,430 8,184 8,349 29.8% 2.0%
Direct Costs 4,117 5,040 5,103
Gross Profits 2,313 3,145 3,246 40.3% 3.2%
SG & A 895 1,019 1,014
EBITDA 1,417 2,126 2,232 57.4% 5.0%
Depreciation 152 166 159
Amortisation 12 19 13
EBIT 1,254 1,941 2,060 64.2% 6.1%
Foreign Exchange Gains/(loss) 23 (158) (142)
Other Income, net 66 111 135
Provision for Tax 322 398 429
Net Income 1,021 1,496 1,624 59.0% 8.5%
Gross Margin 36.0% 38.4% 38.9%
EBITDA Margin 22.0% 26.0% 26.7%
EBIT Margin 19.5% 23.7% 24.6%
Net Income Margin 15.9% 18.3% 19.4%
Earnings Per Share
Annualized in INR
Basic 58.78 85.67 92.90 58.0%
Diluted 57.81 84.70 91.94 59.0%Weighted average Number of Shares
Basic 694,909,494 698,489,070 699,175,714
Diluted 706,553,293 706,490,173 706,473,958
Note: INR numbers have been prepared under US GAAP taking INR as reporting currency and are after taking the effect of non-cash employee stock option charge.
Outstanding Options (in equivalent no of shares)
Options at market price 4,339,380 1,827,036 1,598,036
Options at less than market price 12,258,824 8,101,376 7,243,484
31-Mar-13 31-Dec-13 31-Mar-14
18
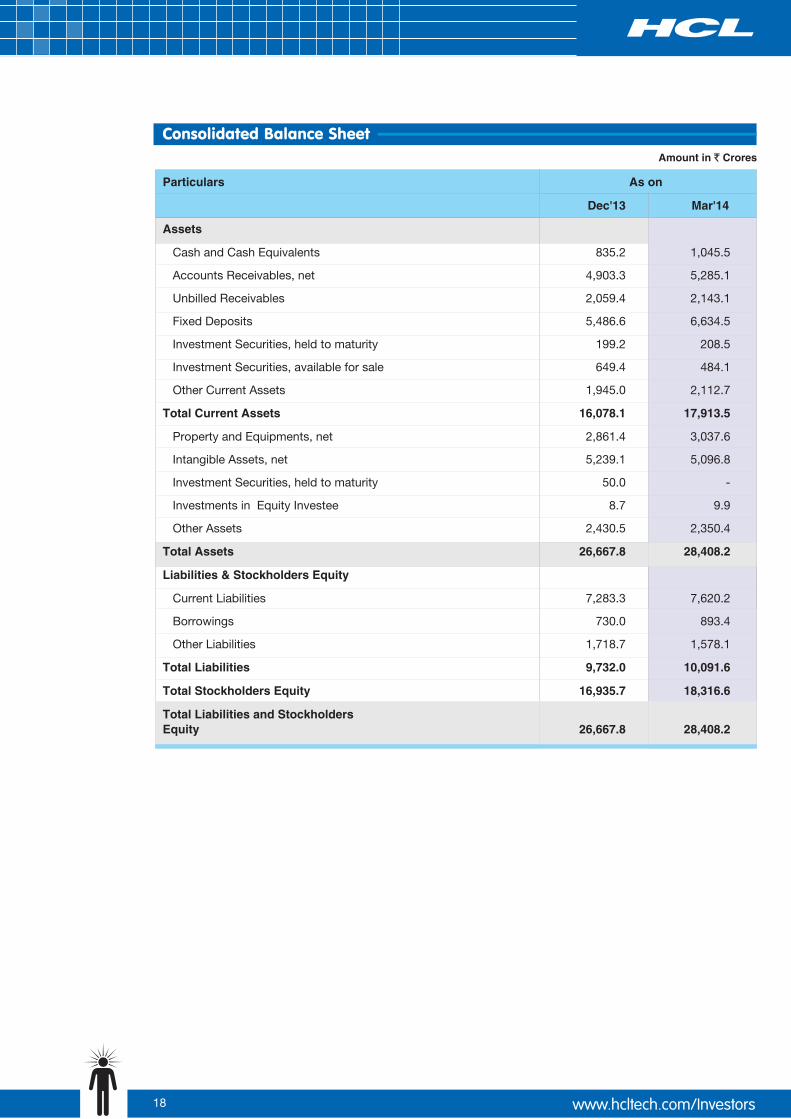
Particulars As on
Assets
Total Current Assets
50.0 -
8.7 9.9
Other Assets
Total Assets
Liabilities & Stockholders Equity
Borrowings
Other Liabilities
Total Liabilities
Total Stockholders Equity
Total Liabilities and StockholdersEquity
Dec'13 Mar'14
Cash and Cash Equivalents 835.2 1,045.5
Accounts Receivables, net 4,903.3 5,285.1
Unbilled Receivables 2,059.4 2,143.1
Fixed Deposits 5,486.6 6,634.5
Investment Securities, held to maturity 199.2 208.5
Investment Securities, available for sale 649.4 484.1
Other Current Assets 1,945.0 2,112.7
16,078.1 17,913.5
Property and Equipments, net 2,861.4 3,037.6
Intangible Assets, net 5,239.1 5,096.8
Investment Securities, held to maturity
Investments in Equity Investee
2,430.5 2,350.4
26,667.8 28,408.2
Current Liabilities 7,283.3 7,620.2
730.0 893.4
1,718.7 1,578.1
9,732.0 10,091.6
16,935.7 18,316.6
26,667.8 28,408.2

19
Certain statements in this release are forward-looking statements, which involve a number of risks, uncertainties, assumptions and other factors that could cause actual results to differ materially from those in such forward-looking statements. All statements, other than statements of historical fact are statements that could be deemed forward looking statements, including but not limited to the statements containing the words 'planned', 'expects', 'believes', 'strategy', 'opportunity', 'anticipates', 'hopes' or other similar words. The risks and uncertainties relating to these statements include, but are not limited to, risks and uncertainties regarding impact of pending regulatory proceedings, fluctuations in earnings, our ability to manage growth, intense competition in IT services, Business Process Outsourcing and consulting services including those factors which may affect our cost advantage, wage increases in India, customer acceptances of our services, products and fee structures, our ability to attract and retain highly skilled professionals, our ability to integrate acquired assets in a cost effective and timely manner, time and cost overruns on fixed-price, fixed-time frame contracts, client concentration, restrictions on immigration, our ability to manage our international operations, reduced demand for technology in our key focus areas, disruptions in telecommunication networks, our ability to successfully complete and integrate potential acquisitions, the success of our brand development efforts, liability for damages on our service contracts, the success of the companies / entities in which we have made strategic investments, withdrawal of governmental fiscal incentives, political instability, legal restrictions on raising capital or acquiring companies outside India, and unauthorized use of our intellectual property, other risks, uncertainties and general economic conditions affecting our industry. There can be no assurance that the forward looking statements made herein will prove to be accurate, and issuance of such forward looking statements should not be regarded as a representation by the Company, or any other person, that the objective and plans of the Company will be achieved. All forward looking statements made herein are based on information presently available to the management of the Company and the Company does not undertake to update any forward-looking statement that may be made from time to time by or on behalf of the Company.
HCL Technologies is a leading global IT services company working with clients in the areas that impact and redefine the core of their businesses. Since its emergence on global landscape after its IPO in 1999, HCL has focused on 'transformational outsourcing', underlined by innovation and value creation, offering an integrated portfolio of services including software-led IT solutions, remote infrastructure management, engineering and R&D services and Business services. HCL leverages its extensive global offshore infrastructure and network of offices in 31 countriesto provide holistic, multi-service delivery in key industry verticals including Financial Services, Manufacturing, Consumer Services, Public Services and Healthcare & Life sciences. HCL takes pride in its philosophy of 'EmployeesFirst, Customers Second' which empowers its 90,190 transformers to create real value for the customers. HCL Technologies, along with its subsidiaries, had consolidated revenues of US$ 5.2 billion, as on 31st March 2014 (on LTM basis). For more information, please visit www.hcltech.com

INVESTOR RELATIONS
Sanjay Mendiratta
+91- 9312065108
Aniruddh Gaur
+91- 9560158666
MEDIA RELATIONS
Ajay Davessar
+91 - 9650122336
Zulfia Nafees
+91 – 9810495138
Siddharth K
+91 - 9810267907
HCL Technologies Ltd.,A 10-11, Sector-III, Noida - 201301
www.hcltech.com
Top Related