


Languages
Pages
Legal


How? Strategies to Green the Supply
Chain

A VERY (very) LARGE PENSION FUND SAYS
RETROFIT INDUSTRIAL ENERGY EFFICIENCY IS
THE BEST ASSET CLASS ON THE PLANET
WHY?
AN INVESTIGATION WITH THE ENVIRONMENTAL
DEFENSE FUND AND WAL-MART GLOBAL
SOURCING IN CHINA VISITING OVER 600
FACTORIES IN WAL-MART’S SUPPLY CHAIN
FOUND…

30-50% reductions in energy intensity in plastics fabrication
possible
Some factories doing more than
60%--on total energy
With throughput and quality improvements

Opportunities everywhere
• Wood fabrication
• Metal fabrication
• Painting and coating
• Complex systems manufacturing
• Compressed air
• Process heating--process cooling

ALL HAVE POTENTIAL FOR 30-40% REDUCTIONS
IN TOTAL ENERGY INTENSITY
Less than 2 years simple paybacks
JUST ON ENERGY
SAVINGS
4 big conclusions

Target-rich but data poor
Data
Target
The people with the answers have poor business models

Someone has to LOOK WRONG
NO ONE WANTS TO TAKE THE HIT
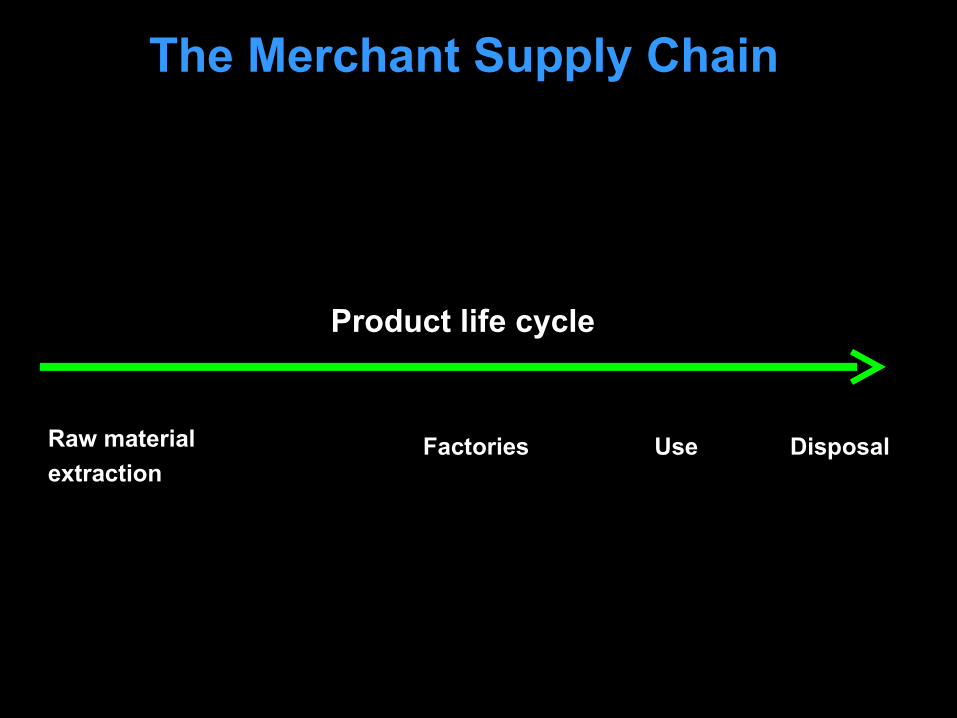
Raw material
extractionFactories Use Disposal
The Merchant Supply Chain
Product life cycle
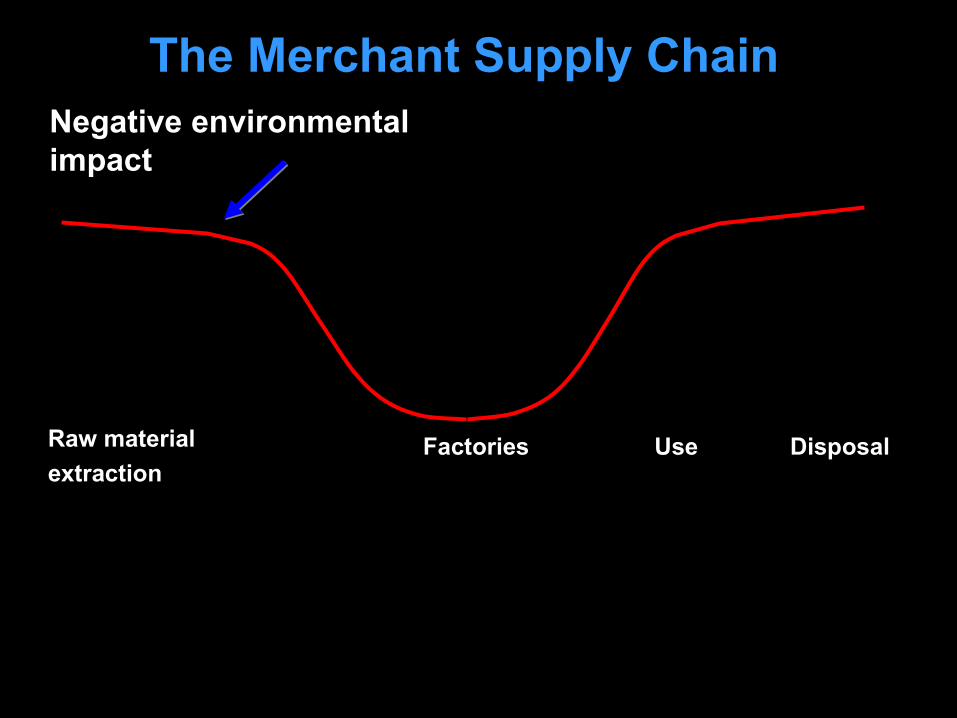
Raw material
extractionFactories Use Disposal
Negative environmental impact
The Merchant Supply Chain

Raw material
extractionFactories Use Disposal
Negative environmental impact
Merchants’ ability toreduce impact
The Merchant Supply Chain
Where we need to go
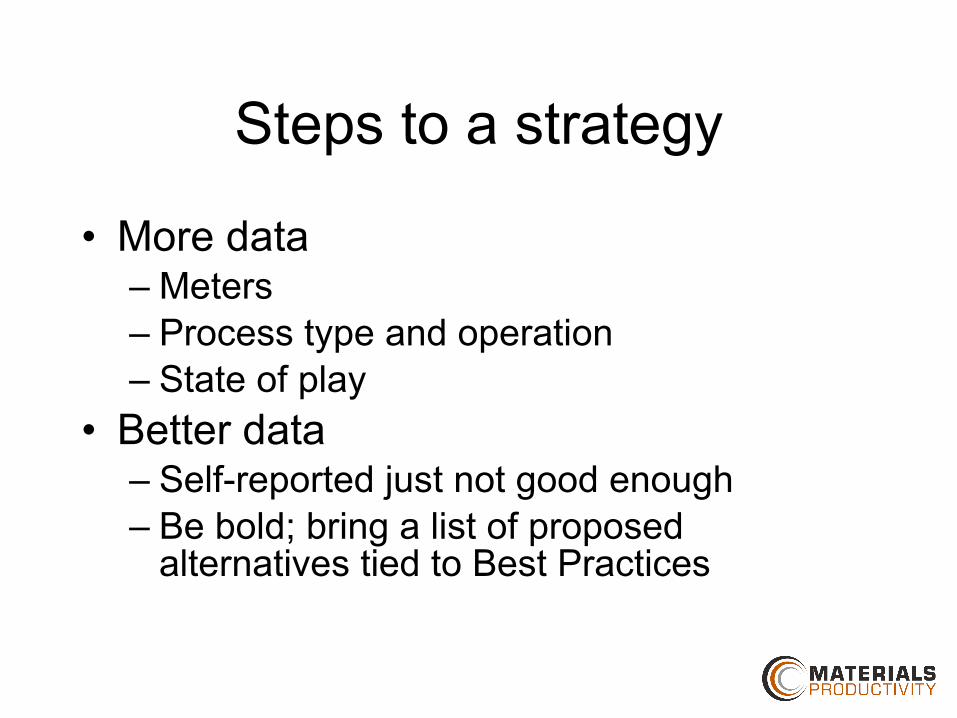
Steps to a strategy
• More data– Meters– Process type and operation– State of play
• Better data– Self-reported just not good enough– Be bold; bring a list of proposed
alternatives tied to Best Practices
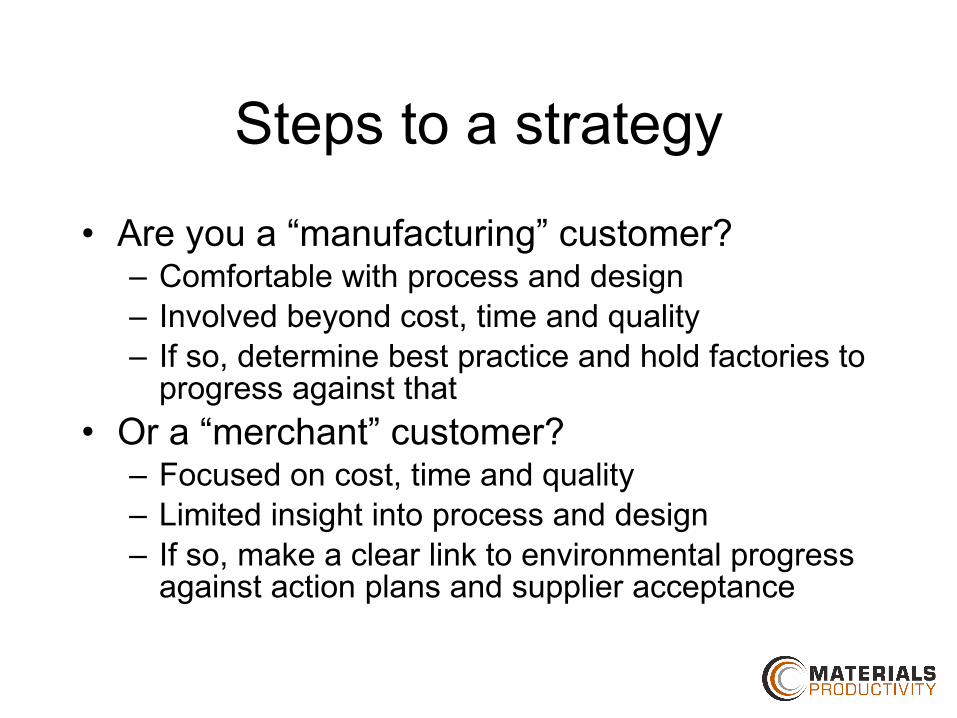
Steps to a strategy
• Are you a “manufacturing” customer?– Comfortable with process and design– Involved beyond cost, time and quality– If so, determine best practice and hold factories to
progress against that
• Or a “merchant” customer?– Focused on cost, time and quality– Limited insight into process and design– If so, make a clear link to environmental progress
against action plans and supplier acceptance

Steps to a strategy
• EE is not a core competency for factories– Usually less than 10% of controllable Cost of
Goods Sold– Avoid it because they’ve been burned or it seems
esoteric– Energy costs buried in overheadSO
• Who are your implementation partners?– EE technology providers: make it easy for them– Energy providers: help them aggregate– Consultants: use for process expertise and
oversight

Steps to a strategy
• Account for the uniqueness of each factory– Goals– Implementation arc– Presence of technical management
• Make it easy for factories to “do the right thing”– Connect rather than direct– Connect environmental progress with
manufacturing excellence– Collaborate
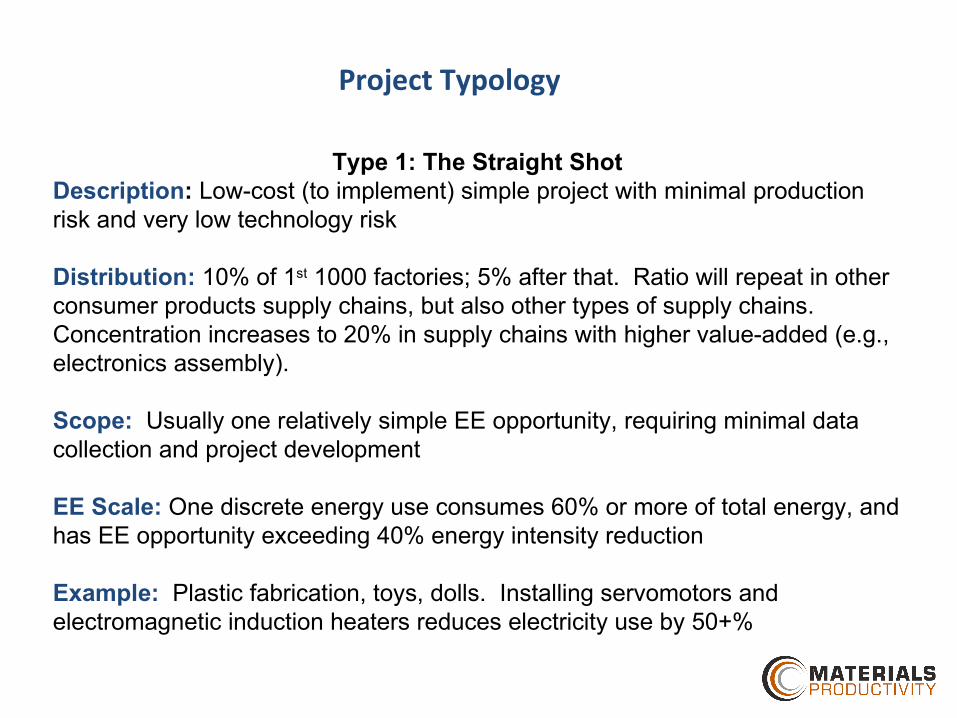
Project Typology
Type 1: The Straight ShotDescription: Low-cost (to implement) simple project with minimal production risk and very low technology risk
Distribution: 10% of 1st 1000 factories; 5% after that. Ratio will repeat in other consumer products supply chains, but also other types of supply chains. Concentration increases to 20% in supply chains with higher value-added (e.g., electronics assembly).
Scope: Usually one relatively simple EE opportunity, requiring minimal data collection and project development
EE Scale: One discrete energy use consumes 60% or more of total energy, and has EE opportunity exceeding 40% energy intensity reduction
Example: Plastic fabrication, toys, dolls. Installing servomotors and electromagnetic induction heaters reduces electricity use by 50+%

Project TypologyType 2: Rolling Thunder
Description: A progression of 3-7 low-cost (to implement) simple sub-projects with minimal production risk and very low technology risk. Best approach is to nest sub-projects, implementing several sub-projects simultaneously.
Distribution: 60% of 1st 1000 factories; 75% after that. Ratio will repeat in other consumer products supply chains, but also other types of supply chains. Concentration decreases to 50% in supply chains with higher value-added (e.g., name brands).
Scope: A mix of base load and process load EE opportunities, requiring minimal data collection and project development
EE Scale: Each discrete type of energy use consumes 10-20% of total energy; one use may exceed 30%. EE opportunity range from 15-70% energy intensity reduction (each use and EE opportunity set)
Example: Plastic fabrication + metal fabrication + motor production + coating + assembly, small appliances.
●Install servomotors and electromagnetic induction heaters in plastic injection molders reduces electricity use●Install servomotors on large machine tools with variable loads●Optimize demand and generation of compressed air●Optimize chilling/cooling, especially cooling towers●Revamp HVAC, especially ventilation●Insulate ovens and rehab burners and controls
Total reduction in energy intensity = 40+%

Project Typology
Type 3: BigfootDescription: One big complex project with 2-3 critical and related sub-projects; some production risk and low technology risk
Distribution: 5% of 1st 1000 factories; 0% after that. Ratio will repeat in other consumer products supply chains, but also other types of supply chains. Concentration increases to 25% in supply chains with higher value-added (e.g., electronics production; major appliances).
Scope: A mix of base load and process load EE opportunities, requiring extensive data collection and project development
EE Scale: Total energy use of main project and all sub-projects exceeds 75% or more of total energy, and has EE opportunity exceeding 40%
Example: Production of television sets. Revamping HVAC, process controls and base load to balance and optimize thermal loads across entire building envelope reduces electricity use by 40%

Project Typology
Type 4: Slow and SteadyDescription: A progression of 3-7 moderate-cost (to implement) sub-projects with minimal production risk and very low technology risk. Each project implementation complete before the next is opened. Requires a “portfolio” approach.
Distribution: 25% of 1st 1000 factories. Unknown ratio will repeat in other consumer products supply chains, as well as other types of supply chains.
Scope: A mix of base load and process load EE opportunities, requiring minimal data collection and project development
EE Scale: Each discrete type of energy use consumes 10-20% of total energy; one use may exceed 30%. EE opportunity range from 15-70% energy intensity reduction (each use and EE opportunity set)
Example: Plastic fabrication + metal fabrication + motor production + coating + assembly, lighting. ●Install servomotors and electromagnetic induction heaters in plastic injection molders reduces electricity use●Install servomotors on large machine tools with variable loads●Optimize demand and generation of compressed air●Optimize chilling/cooling, especially cooling towers●Revamp HVAC, especially ventilation●Insulate ovens and rehab burners and controls
Total reduction in energy intensity = 50%
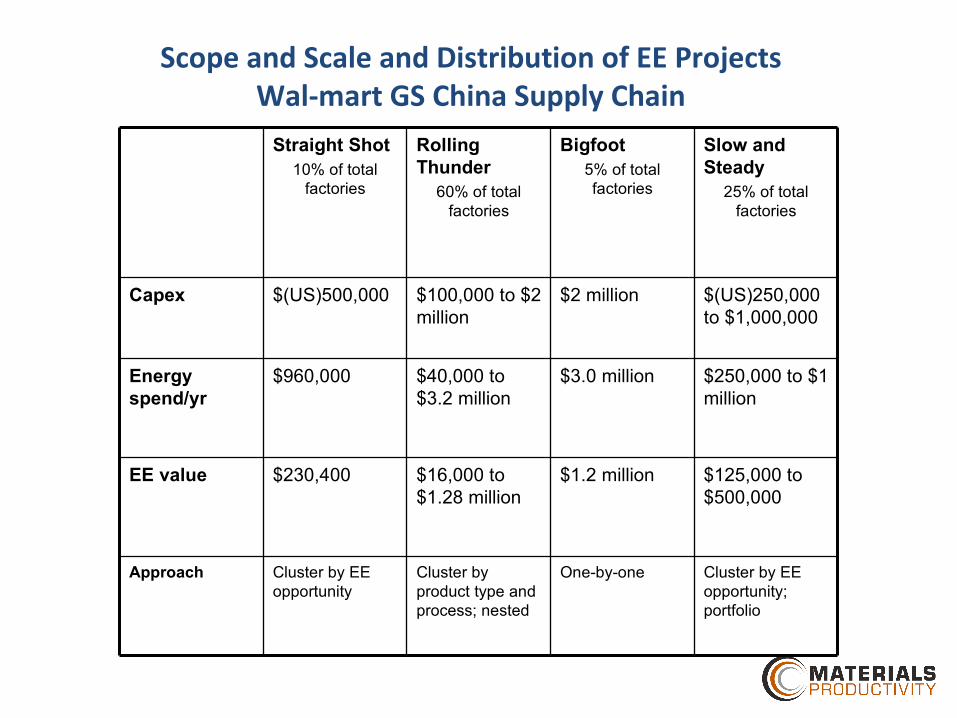
Straight Shot10% of total
factories
Rolling Thunder
60% of total factories
Bigfoot5% of total factories
Slow and Steady
25% of total factories
Capex $(US)500,000 $100,000 to $2 million
$2 million $(US)250,000 to $1,000,000
Energy spend/yr
$960,000 $40,000 to $3.2 million
$3.0 million $250,000 to $1 million
EE value $230,400 $16,000 to $1.28 million
$1.2 million $125,000 to $500,000
Approach Cluster by EE opportunity
Cluster by product type and process; nested
One-by-one Cluster by EE opportunity; portfolio
Scope and Scale and Distribution of EE ProjectsWal-mart GS China Supply Chain
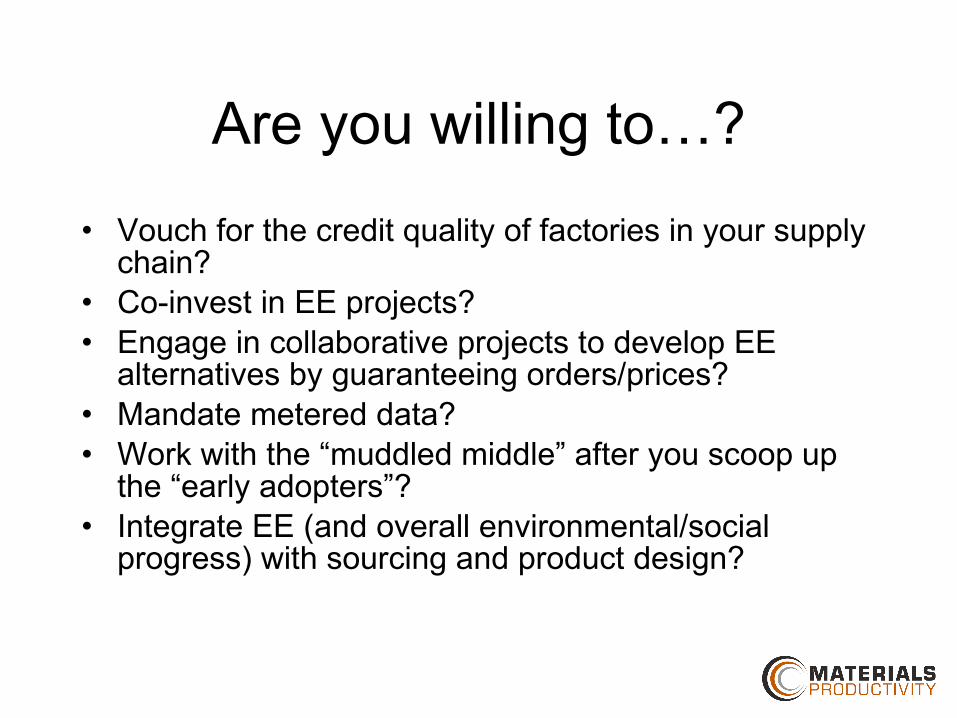
Are you willing to…?
• Vouch for the credit quality of factories in your supply chain?
• Co-invest in EE projects?• Engage in collaborative projects to develop EE
alternatives by guaranteeing orders/prices?• Mandate metered data?• Work with the “muddled middle” after you scoop up
the “early adopters”?• Integrate EE (and overall environmental/social
progress) with sourcing and product design?

Things you need to know
• Audits do not really work very well• Many factories do not “own” their processes• You, as a “Big Customer”, may be the only
independent and neutral source of info for factories• After the first 20% of gains in reducing energy
intensity, EE pays off very slowly…unless the factory is horribly inefficient
• Finance (at the moment) seems to be a “Key to the [Implementation] Kingdom”
• Go to the Gemba; boots on the ground are critical
Top Related