


Languages
Pages
Legal

JNEC CIVIL/FM-I/AUG 2010 Page 1
MAHATMA GANDHI MISSION’S
JAWAHARLAL NEHRU ENGINEERING COLLEGE,
AURANGABAD. (M.S.)
DEPARTMENT OF CIVIL ENGINEERING
FLUID MECHANICS LABORATORY
MANUAL
Prepared By Approved By
Mr. L. K. Kokate Prof. B. M. Patil
Lab Incharge H.O.D. CIVIL
JNEC CIVIL/FM-I/AUG 2010 Page 2
’FLUID MECHANICS -I’ EXPERIMENTS
SUBJECT: - Fluid Mechanics-I
CLASS: - Second Year Civil Engineering
LIST OF EXPERIMENTS
Sr. No. Name of Experiment Page No.
From To
I Study of pressure measuring devices.
II Determination of meta centric height.
III Calibration of Bernoulli’s equation.
IV Calibration of Venturimeter.
V Determination of Hydraulic coefficient for orifices.
VI Determination of coefficient of discharge for mouthpiece.
VII Calibration of Rectangular notch.
VIII Calibration of Triangular Notch.
IX Study of electrical analogy method for plotting of flow nets.
Time Allotted for each Practical Session = 02 Hrs.
JNEC CIVIL/FM-I/AUG 2010
EXPERIMENT NO: II - To Determine the Metacentric Height of a Cargo / War Ship
AIM: - To Determine the Metacentric Height of a Cargo / War Ship
INTRODUCTION:-
Metacenter is defined as, the point about which the body starts oscillating when it is tilted (inclined) by a
small angle.
Metacenter may also be defined as, the point at which the line of action of force of buoyancy will meet the
normal axis of the body when the body is given a small angular displacement.
Metacentric Height is defined as, the distance between the Metacenter of a floating body & center of gravity.
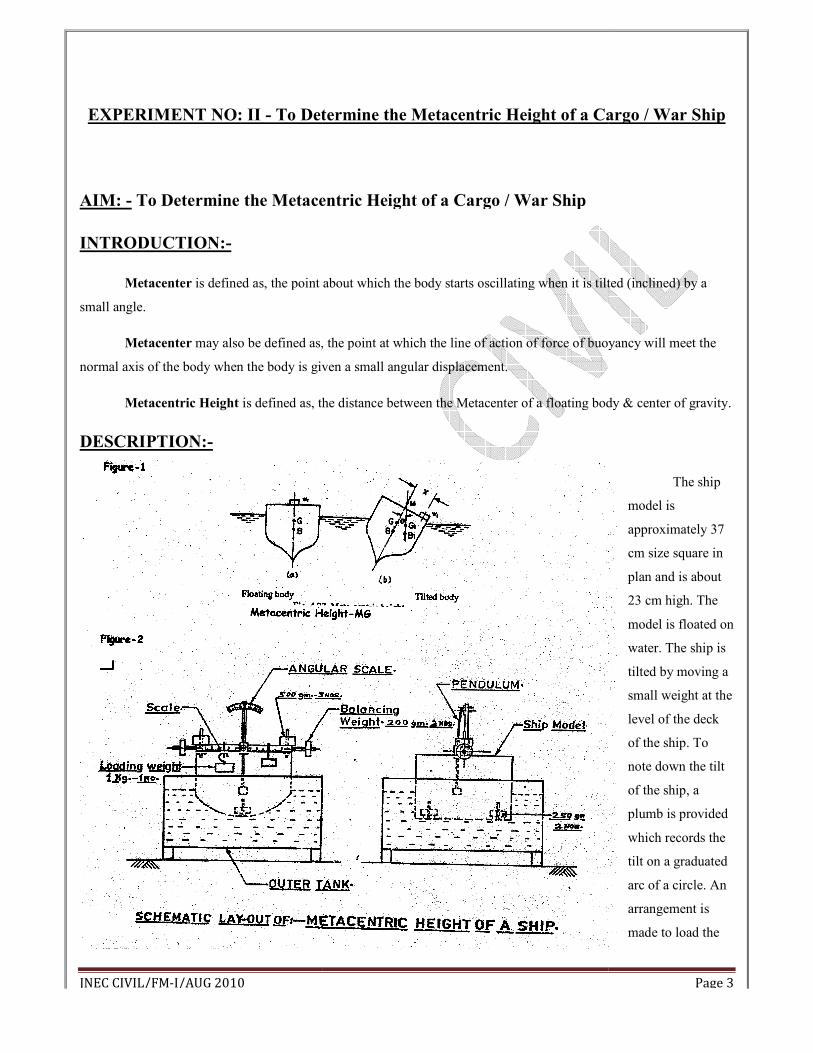
DESCRIPTION:-
To Determine the Metacentric Height of a Cargo / War Ship
To Determine the Metacentric Height of a Cargo / War Ship
is defined as, the point about which the body starts oscillating when it is tilted (inclined) by a
may also be defined as, the point at which the line of action of force of buoyancy will meet the
ody is given a small angular displacement.
is defined as, the distance between the Metacenter of a floating body & center of gravity.
Page 3
To Determine the Metacentric Height of a Cargo / War Ship
is defined as, the point about which the body starts oscillating when it is tilted (inclined) by a
may also be defined as, the point at which the line of action of force of buoyancy will meet the
is defined as, the distance between the Metacenter of a floating body & center of gravity.
The ship
model is
approximately 37
cm size square in
plan and is about
23 cm high. The
model is floated on
water. The ship is
tilted by moving a
small weight at the
level of the deck
of the ship. To
note down the tilt
of the ship, a
plumb is provided
which records the
tilt on a graduated
arc of a circle. An
arrangement is
made to load the
JNEC CIVIL/FM-I/AUG 2010 Page 4
ship as a War ship or Cargo ship.
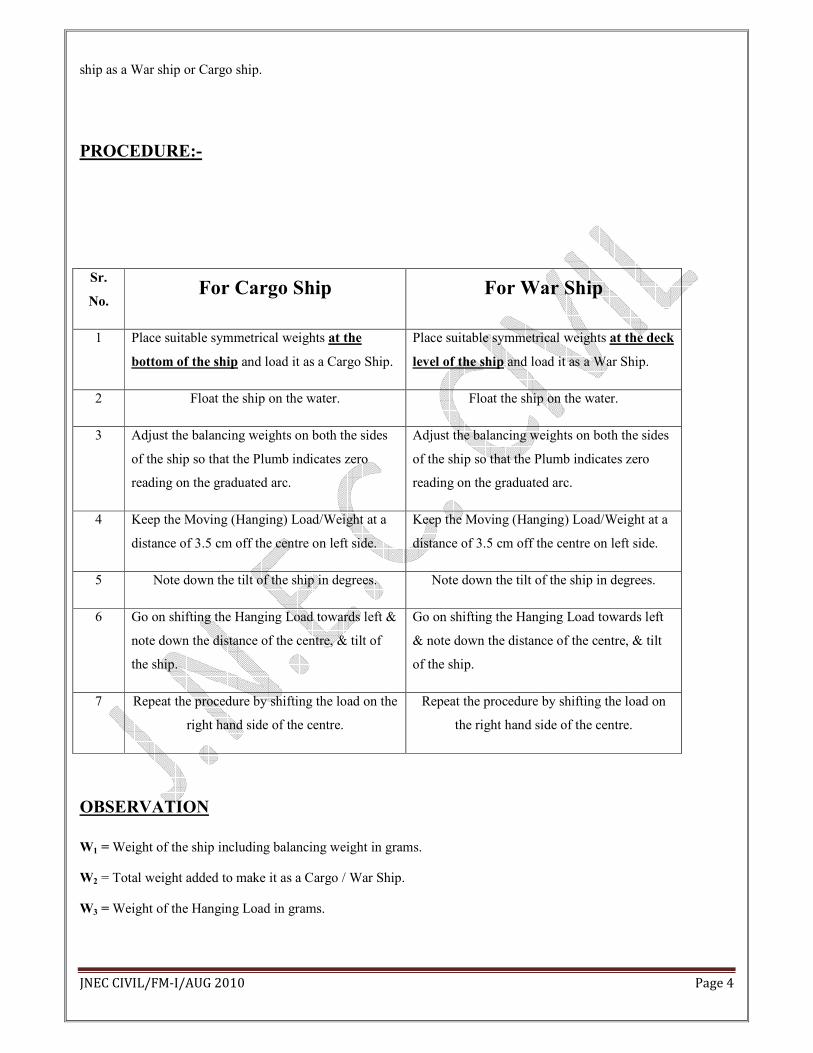
PROCEDURE:-
Sr.
No. For Cargo Ship For War Ship
1 Place suitable symmetrical weights at the
bottom of the ship and load it as a Cargo Ship.
Place suitable symmetrical weights at the deck
level of the ship and load it as a War Ship.
2 Float the ship on the water. Float the ship on the water.
3 Adjust the balancing weights on both the sides
of the ship so that the Plumb indicates zero
reading on the graduated arc.
Adjust the balancing weights on both the sides
of the ship so that the Plumb indicates zero
reading on the graduated arc.
4 Keep the Moving (Hanging) Load/Weight at a
distance of 3.5 cm off the centre on left side.
Keep the Moving (Hanging) Load/Weight at a
distance of 3.5 cm off the centre on left side.
5 Note down the tilt of the ship in degrees. Note down the tilt of the ship in degrees.
6 Go on shifting the Hanging Load towards left &
note down the distance of the centre, & tilt of
the ship.
Go on shifting the Hanging Load towards left
& note down the distance of the centre, & tilt
of the ship.
7 Repeat the procedure by shifting the load on the
right hand side of the centre.
Repeat the procedure by shifting the load on
the right hand side of the centre.
OBSERVATION
W1 = Weight of the ship including balancing weight in grams.
W2 = Total weight added to make it as a Cargo / War Ship.
W3 = Weight of the Hanging Load in grams.
JNEC CIVIL/FM-I/AUG 2010 Page 5
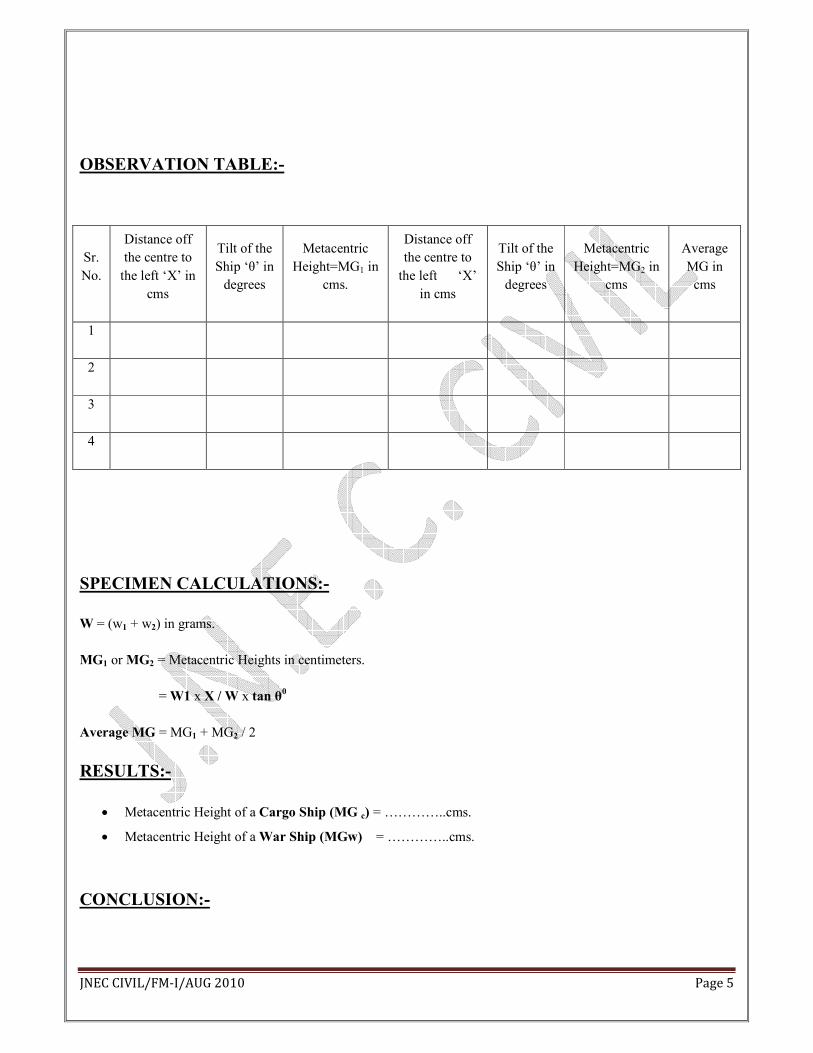
OBSERVATION TABLE:-
SPECIMEN CALCULATIONS:-
W = (w1 + w2) in grams.
MG1 or MG2 = Metacentric Heights in centimeters.
= W1 x X / W x tan θ0
Average MG = MG1 + MG2 / 2
RESULTS:-
• Metacentric Height of a Cargo Ship (MG c) = …………..cms.
• Metacentric Height of a War Ship (MGw) = …………..cms.
CONCLUSION:-
Sr.
No.
Distance off
the centre to
the left ‘X’ in
cms
Tilt of the
Ship ‘θ’ in
degrees
Metacentric
Height=MG1 in
cms.
Distance off
the centre to
the left ‘X’
in cms
Tilt of the
Ship ‘θ’ in
degrees
Metacentric
Height=MG2 in
cms
Average
MG in
cms
1
2
3
4
JNEC CIVIL/FM-I/AUG 2010 Page 6
As the angle of tilt (θ0) increases, Metacentric Height (MG or GM) also
……………increases / decreases.
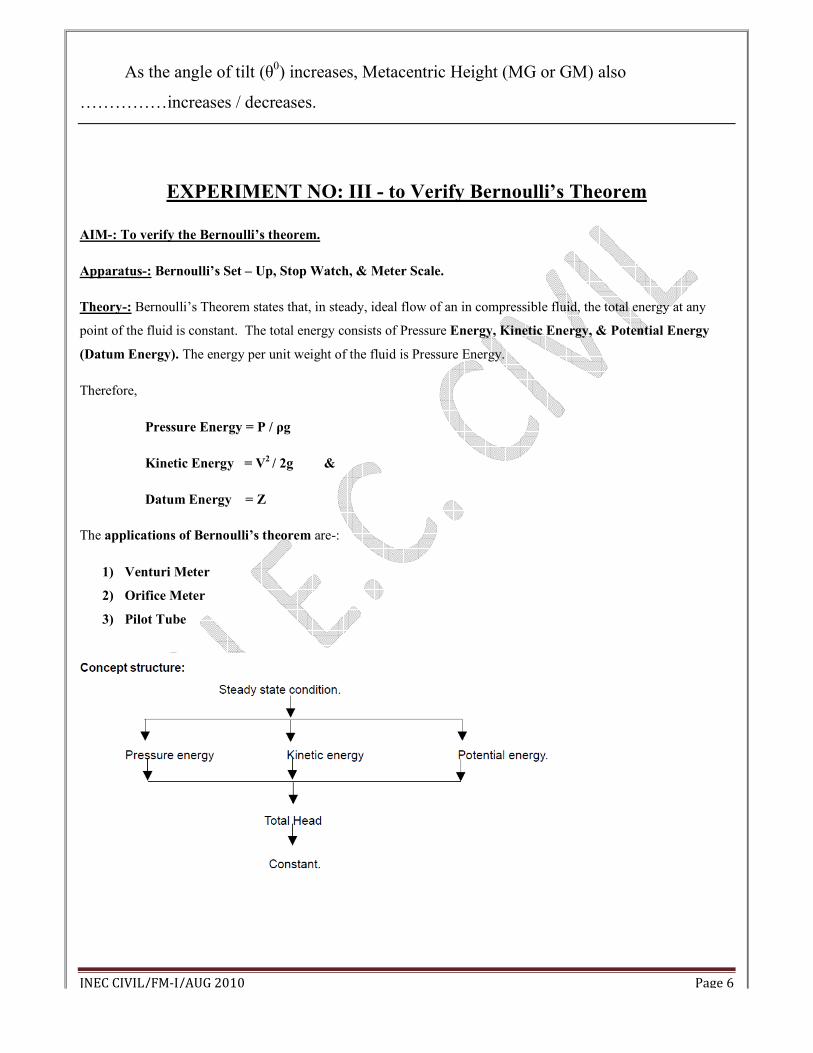
EXPERIMENT NO: III - to Verify Bernoulli’s Theorem
AIM-: To verify the Bernoulli’s theorem.
Apparatus-: Bernoulli’s Set – Up, Stop Watch, & Meter Scale.
Theory-: Bernoulli’s Theorem states that, in steady, ideal flow of an in compressible fluid, the total energy at any
point of the fluid is constant. The total energy consists of Pressure Energy, Kinetic Energy, & Potential Energy
(Datum Energy). The energy per unit weight of the fluid is Pressure Energy.
Therefore,
Pressure Energy = P / ρg
Kinetic Energy = V2 / 2g &
Datum Energy = Z
The applications of Bernoulli’s theorem are-:
1) Venturi Meter
2) Orifice Meter
3) Pilot Tube
JNEC CIVIL/FM-I/AUG 2010
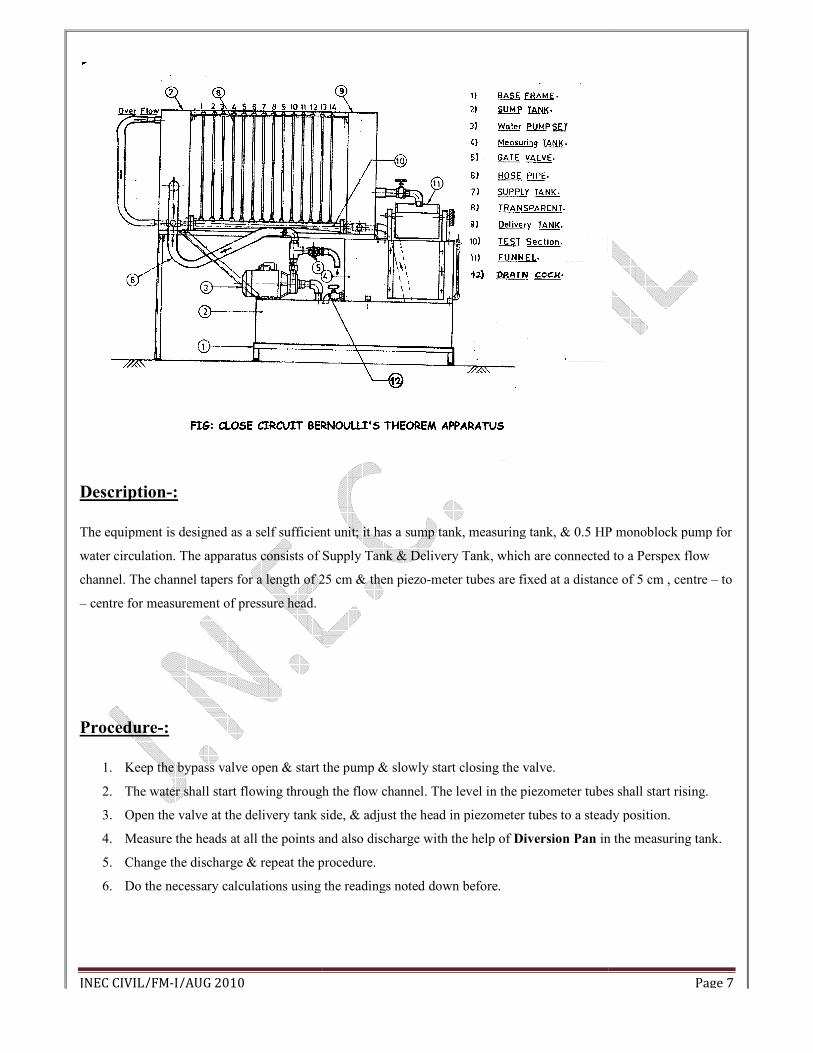
Description-:
The equipment is designed as a self sufficient unit; it has a sump tank, measuring tank, & 0.5 HP monoblock pump for
water circulation. The apparatus consists of Supply Tank & Delivery Tank, which are
channel. The channel tapers for a length of 25 cm & then piezo
– centre for measurement of pressure head.
Procedure-:
1. Keep the bypass valve open & start the pump & slo
2. The water shall start flowing through the flow channel. The level in the piezometer tubes shall start rising.
3. Open the valve at the delivery tank side, & adjust the head in piezometer tubes to a steady position.
4. Measure the heads at all the points and also discharge with the help of
5. Change the discharge & repeat the procedure.
6. Do the necessary calculations using the readings noted down before.
The equipment is designed as a self sufficient unit; it has a sump tank, measuring tank, & 0.5 HP monoblock pump for
water circulation. The apparatus consists of Supply Tank & Delivery Tank, which are connected to a Perspex flow
channel. The channel tapers for a length of 25 cm & then piezo-meter tubes are fixed at a distance of 5 cm , centre
Keep the bypass valve open & start the pump & slowly start closing the valve.
The water shall start flowing through the flow channel. The level in the piezometer tubes shall start rising.
Open the valve at the delivery tank side, & adjust the head in piezometer tubes to a steady position.
ads at all the points and also discharge with the help of Diversion Pan in the measuring tank.
Change the discharge & repeat the procedure.
Do the necessary calculations using the readings noted down before.
Page 7
The equipment is designed as a self sufficient unit; it has a sump tank, measuring tank, & 0.5 HP monoblock pump for
connected to a Perspex flow
meter tubes are fixed at a distance of 5 cm , centre – to
The water shall start flowing through the flow channel. The level in the piezometer tubes shall start rising.
Open the valve at the delivery tank side, & adjust the head in piezometer tubes to a steady position.
in the measuring tank.
JNEC CIVIL/FM-I/AUG 2010 Page 8
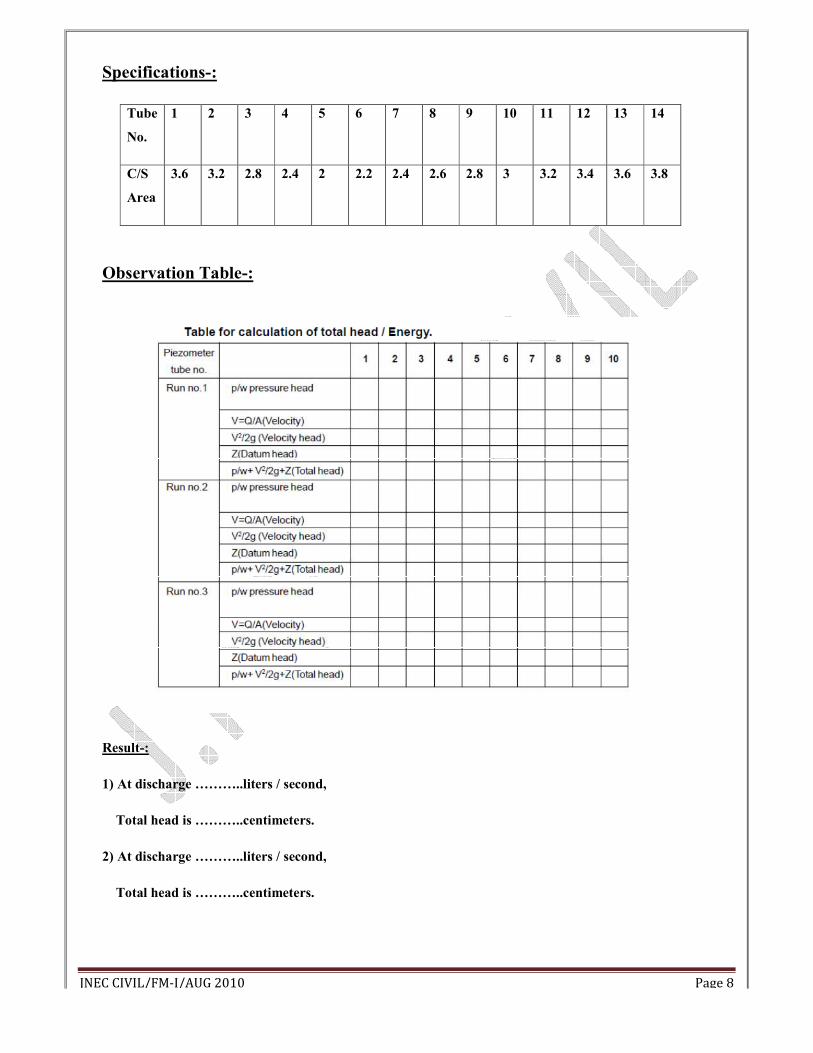
Specifications-:
Tube
No.
1 2 3 4 5 6 7 8 9 10 11 12 13 14
C/S
Area
3.6 3.2 2.8 2.4 2 2.2 2.4 2.6 2.8 3 3.2 3.4 3.6 3.8
Observation Table-:
Result-:
1) At discharge ………..liters / second,
Total head is ………..centimeters.
2) At discharge ………..liters / second,
Total head is ………..centimeters.
JNEC CIVIL/FM-I/AUG 2010 Page 9
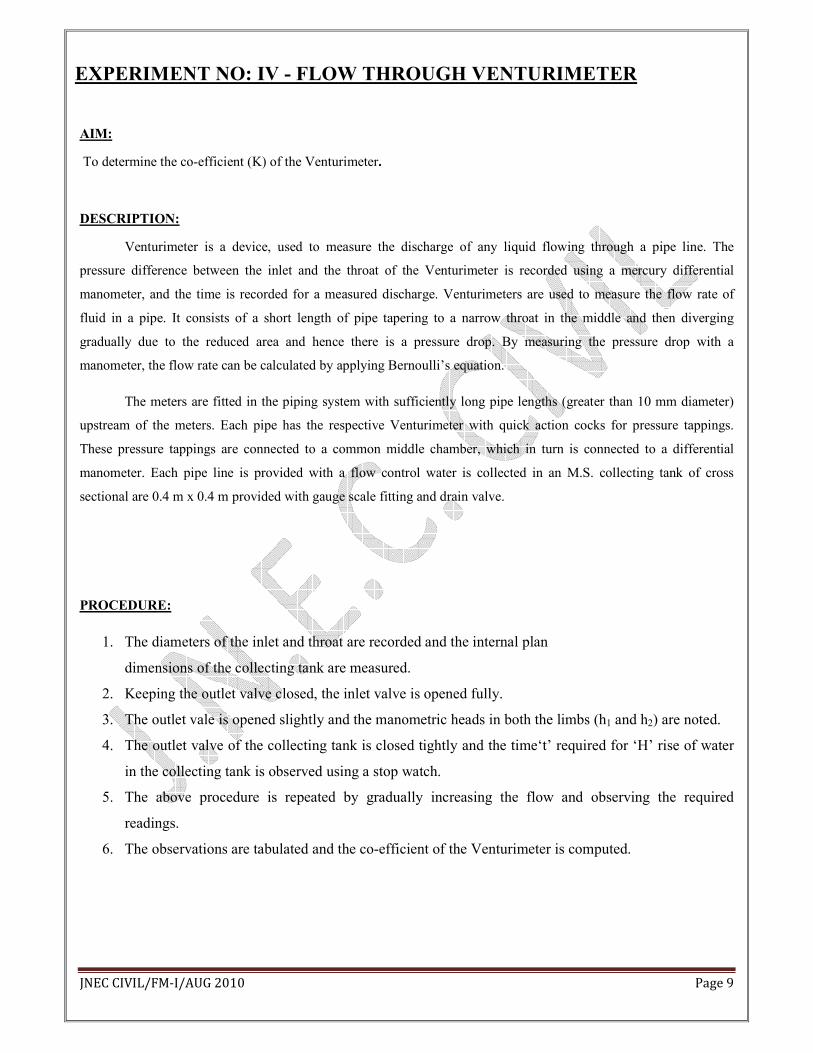
EXPERIMENT NO: IV - FLOW THROUGH VENTURIMETER
AIM:
To determine the co-efficient (K) of the Venturimeter.
DESCRIPTION:
Venturimeter is a device, used to measure the discharge of any liquid flowing through a pipe line. The
pressure difference between the inlet and the throat of the Venturimeter is recorded using a mercury differential
manometer, and the time is recorded for a measured discharge. Venturimeters are used to measure the flow rate of
fluid in a pipe. It consists of a short length of pipe tapering to a narrow throat in the middle and then diverging
gradually due to the reduced area and hence there is a pressure drop. By measuring the pressure drop with a
manometer, the flow rate can be calculated by applying Bernoulli’s equation.
The meters are fitted in the piping system with sufficiently long pipe lengths (greater than 10 mm diameter)
upstream of the meters. Each pipe has the respective Venturimeter with quick action cocks for pressure tappings.
These pressure tappings are connected to a common middle chamber, which in turn is connected to a differential
manometer. Each pipe line is provided with a flow control water is collected in an M.S. collecting tank of cross
sectional are 0.4 m x 0.4 m provided with gauge scale fitting and drain valve.
PROCEDURE:
1. The diameters of the inlet and throat are recorded and the internal plan
dimensions of the collecting tank are measured.
2. Keeping the outlet valve closed, the inlet valve is opened fully.
3. The outlet vale is opened slightly and the manometric heads in both the limbs (h1 and h2) are noted.
4. The outlet valve of the collecting tank is closed tightly and the time‘t’ required for ‘H’ rise of water
in the collecting tank is observed using a stop watch.
5. The above procedure is repeated by gradually increasing the flow and observing the required
readings.
6. The observations are tabulated and the co-efficient of the Venturimeter is computed.
JNEC CIVIL/FM-I/AUG 2010 Page 10
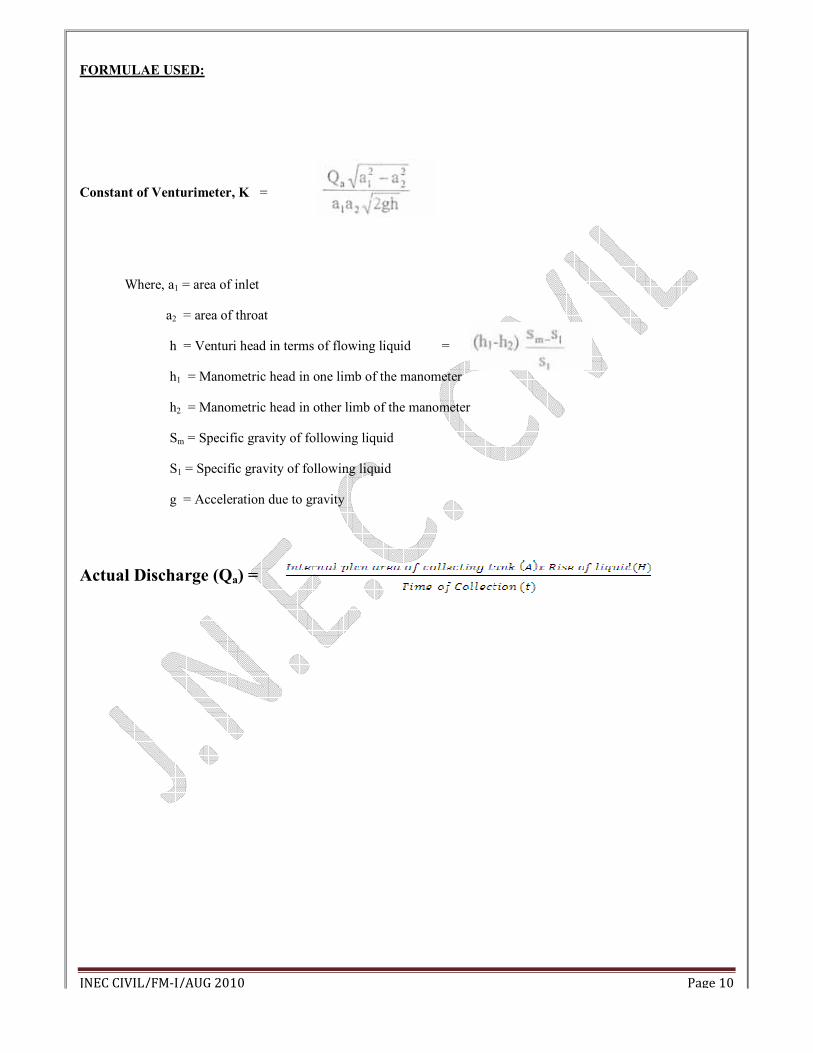
FORMULAE USED:
Constant of Venturimeter, K =
Where, a1 = area of inlet
a2 = area of throat
h = Venturi head in terms of flowing liquid =
h1 = Manometric head in one limb of the manometer
h2 = Manometric head in other limb of the manometer
Sm = Specific gravity of following liquid
S1 = Specific gravity of following liquid
g = Acceleration due to gravity
Actual Discharge (Qa) =
JNEC CIVIL/FM-I/AUG 2010
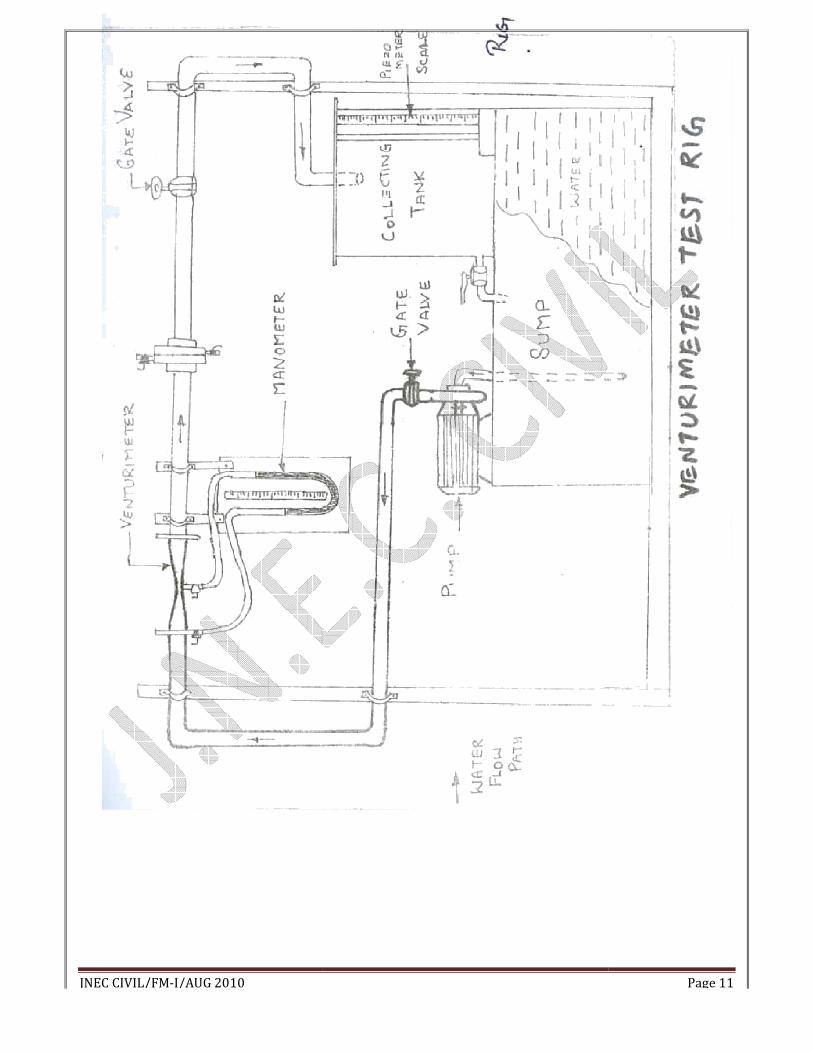
Page 11
JNEC CIVIL/FM-I/AUG 2010 Page 12
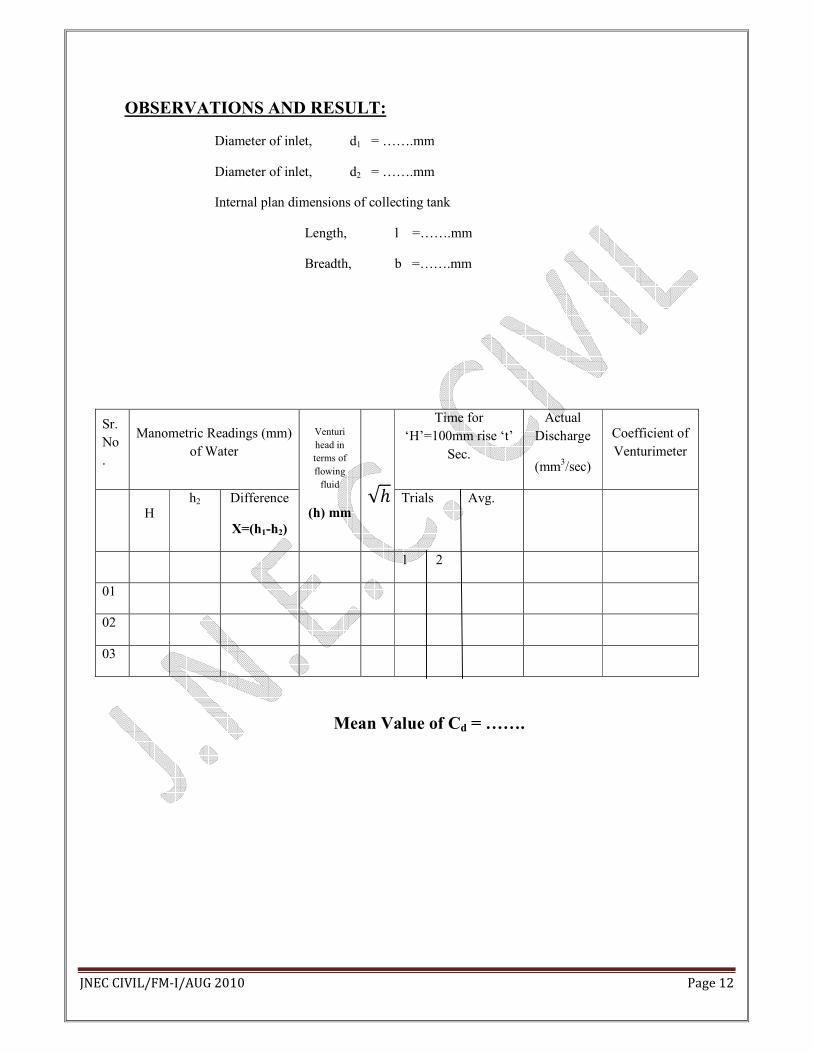
OBSERVATIONS AND RESULT:
Diameter of inlet, d1 = …….mm
Diameter of inlet, d2 = …….mm
Internal plan dimensions of collecting tank
Length, l =…….mm
Breadth, b =…….mm
Sr.
No
.
Manometric Readings (mm)
of Water
Venturi
head in
terms of
flowing
fluid
(h) mm
�ℎ
Time for
‘H’=100mm rise ‘t’
Sec.
Actual
Discharge
(mm3/sec)
Coefficient of
Venturimeter
H h2 Difference
X=(h1-h2)
Trials Avg.
1 2
01
02
03
Mean Value of Cd = …….
JNEC CIVIL/FM-I/AUG 2010 Page 13
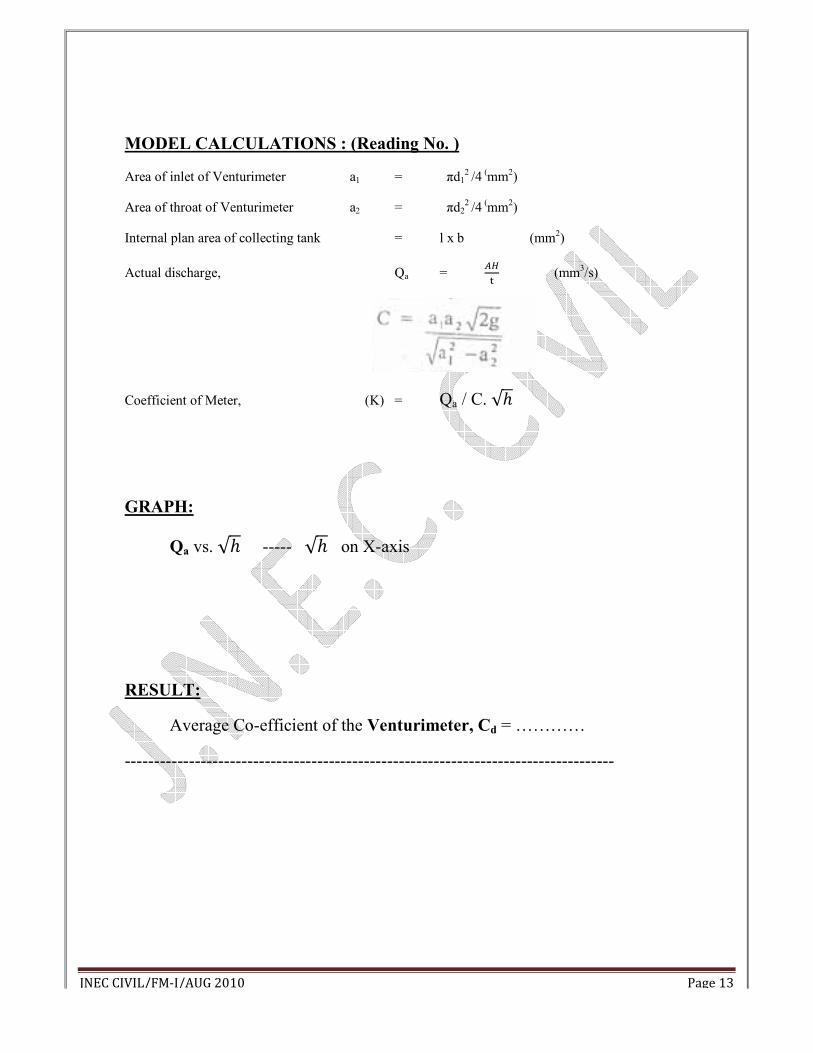
MODEL CALCULATIONS : (Reading No. )
Area of inlet of Venturimeter a1 = πd1
2 /4 (mm2)
Area of throat of Venturimeter a2 = πd2
2 /4
(mm
2)
Internal plan area of collecting tank = l x b (mm2)
Actual discharge, Qa = ��
� (mm
3/s)
Coefficient of Meter, (K) = Qa / C. �ℎ
GRAPH:
Qa vs. �ℎ ----- �ℎ on X-axis
RESULT:
Average Co-efficient of the Venturimeter, Cd = …………
------------------------------------------------------------------------------------
JNEC CIVIL/FM-I/AUG 2010 Page 14
EXPERIMENT NO: VII CALIBRATION OF RECTANGULAR
NOTCHES
Objectives
To Determine the coefficient of discharge of the given Rectangular notch for different rates of flow.
Equipment required
The given notch fitted on an open channel of the experiment setup, hook
gauge to measure the water level over the notch and measuring tank with stop
watch to measure the actual flow rate.
Principle
In open channel flows, weirs are commonly used to either regulate or to measure the volumetric flow rate.
They are of particular use in large scale situations such as irrigation schemes, canals and rivers. For small
scale applications, weirs are often referred to as notches and are sharp edged and manufactured from
thin plate material. The basic principle is that discharge is directly related to the water depth above the
crotch (bottom) of the notch. This distance is called head over the notch. Due to the minimal installation
costs flow rate measurement with a notch is very less expensive. The rectangular notch is the most
commonly used thin plate weir. The flow pattern over a notch or weir is complex and there is no analytical
Solution to the relationship between discharge and head so that a semi-empirical Approach has to be used.
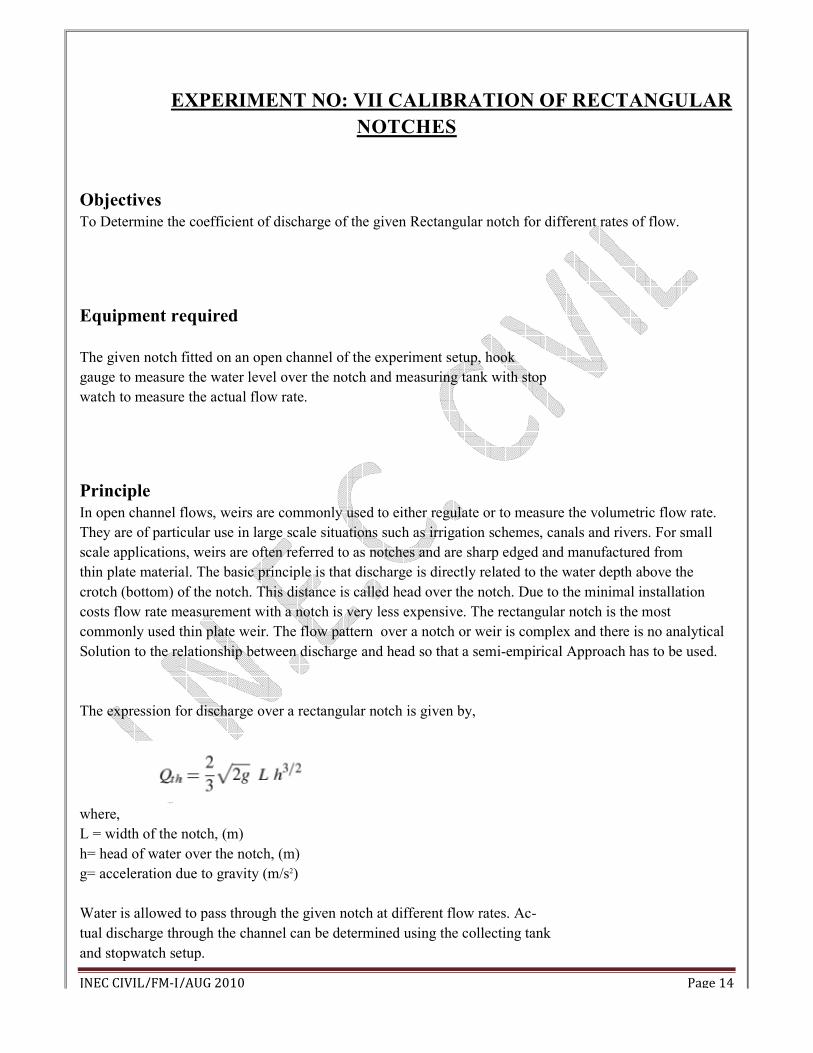
The expression for discharge over a rectangular notch is given by,
where,
L = width of the notch, (m)
h= head of water over the notch, (m)
g= acceleration due to gravity (m/s2)
Water is allowed to pass through the given notch at different flow rates. Ac-
tual discharge through the channel can be determined using the collecting tank
and stopwatch setup.
JNEC CIVIL/FM-I/AUG 2010 Page 15
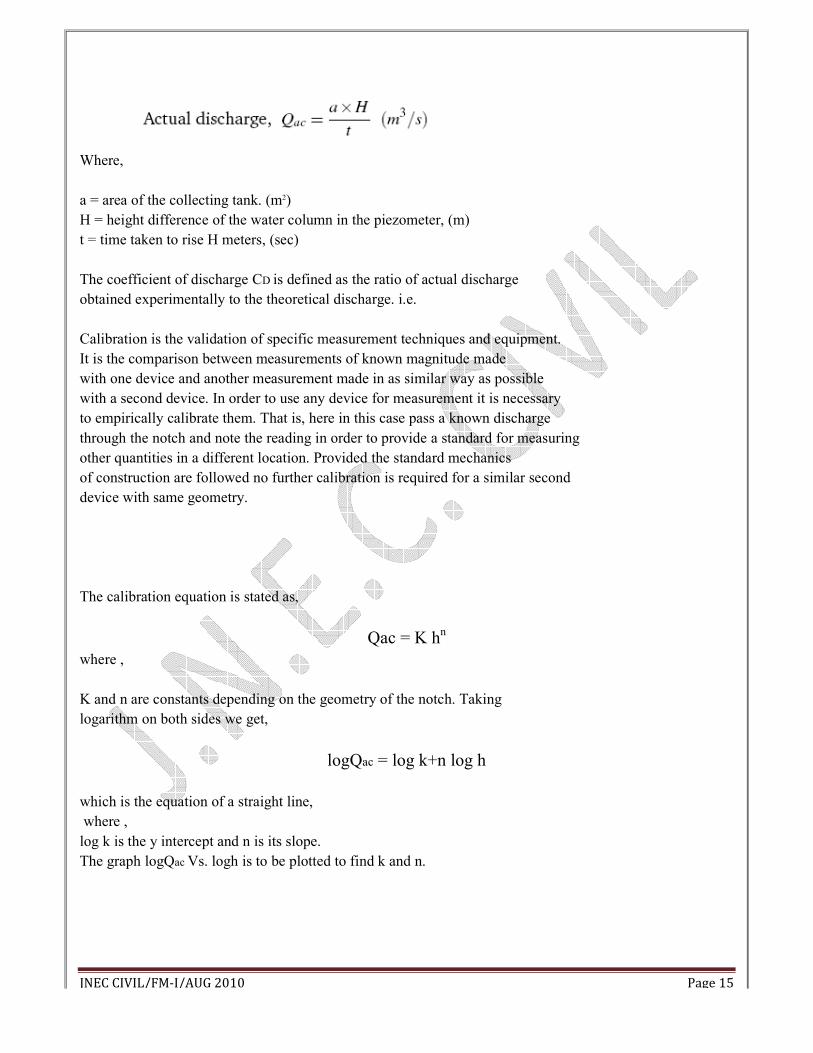
Where,
a = area of the collecting tank. (m2)
H = height difference of the water column in the piezometer, (m)
t = time taken to rise H meters, (sec)
The coefficient of discharge CD is defined as the ratio of actual discharge
obtained experimentally to the theoretical discharge. i.e.
Calibration is the validation of specific measurement techniques and equipment.
It is the comparison between measurements of known magnitude made
with one device and another measurement made in as similar way as possible
with a second device. In order to use any device for measurement it is necessary
to empirically calibrate them. That is, here in this case pass a known discharge
through the notch and note the reading in order to provide a standard for measuring
other quantities in a different location. Provided the standard mechanics
of construction are followed no further calibration is required for a similar second
device with same geometry.
The calibration equation is stated as,
Qac = K hn
where ,
K and n are constants depending on the geometry of the notch. Taking
logarithm on both sides we get,
logQac = log k+n log h
which is the equation of a straight line,
where ,
log k is the y intercept and n is its slope.
The graph logQac Vs. logh is to be plotted to find k and n.
JNEC CIVIL/FM-I/AUG 2010 Page 16
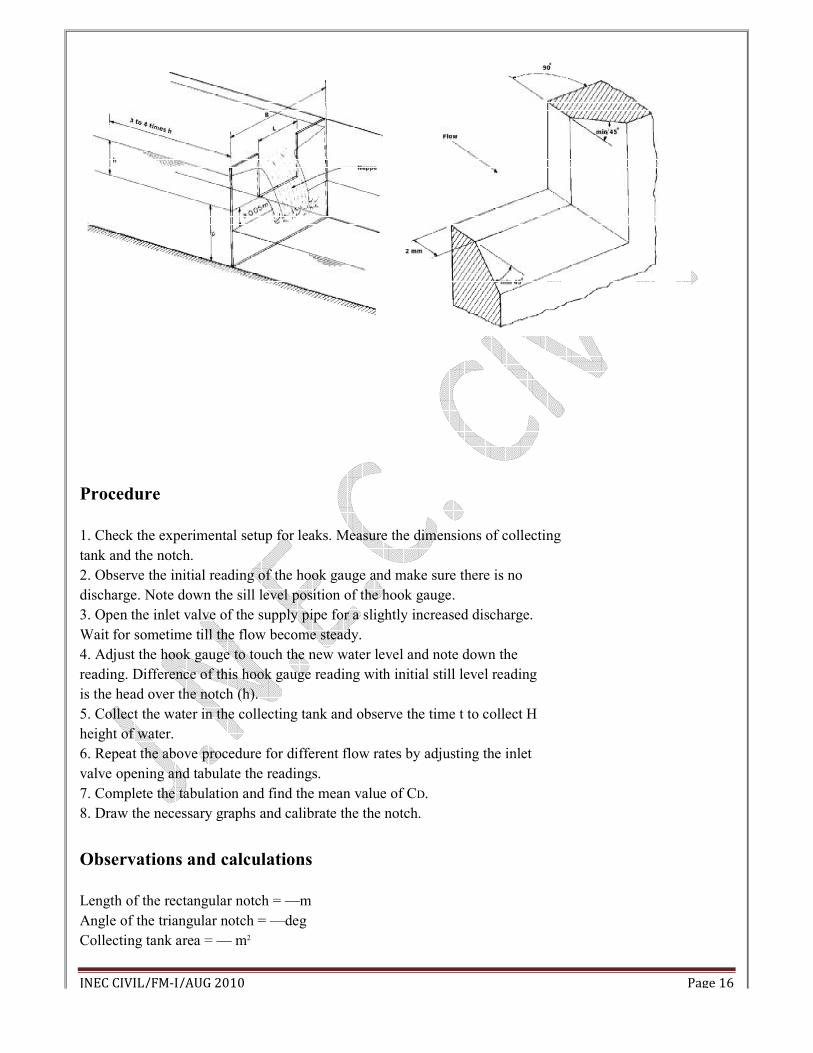
Procedure
1. Check the experimental setup for leaks. Measure the dimensions of collecting
tank and the notch.
2. Observe the initial reading of the hook gauge and make sure there is no
discharge. Note down the sill level position of the hook gauge.
3. Open the inlet valve of the supply pipe for a slightly increased discharge.
Wait for sometime till the flow become steady.
4. Adjust the hook gauge to touch the new water level and note down the
reading. Difference of this hook gauge reading with initial still level reading
is the head over the notch (h).
5. Collect the water in the collecting tank and observe the time t to collect H
height of water.
6. Repeat the above procedure for different flow rates by adjusting the inlet
valve opening and tabulate the readings.
7. Complete the tabulation and find the mean value of CD.
8. Draw the necessary graphs and calibrate the the notch.
Observations and calculations
Length of the rectangular notch = —m
Angle of the triangular notch = —deg
Collecting tank area = — m2
JNEC CIVIL/FM-I/AUG 2010 Page 17
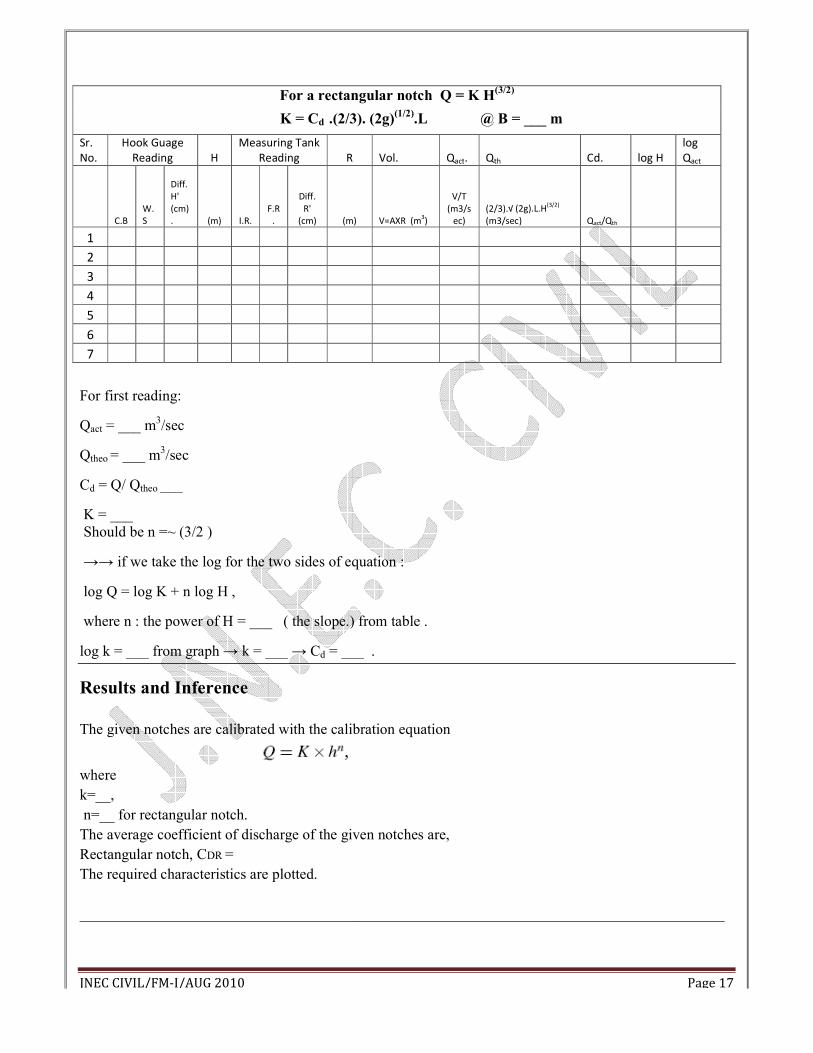
For a rectangular notch Q = K H(3/2)
K = Cd .(2/3). (2g)(1/2)
.L @ B = ___ m
Sr.
No.
Hook Guage
Reading H
Measuring Tank
Reading R Vol. Qact. Qth Cd. log H
log
Qact
C.B
W.
S
Diff.
H'
(cm)
. (m) I.R.
F.R
.
Diff.
R'
(cm) (m) V=AXR (m3)
V/T
(m3/s
ec)
(2/3).√ (2g).L.H(3/2)
(m3/sec) Qact/Qth
1
2
3
4
5
6
7
For first reading:
Qact = ___ m3/sec
Qtheo = ___ m3/sec
Cd = Q/ Qtheo ___
K = ___
Should be n =~ (3/2 )
→→ if we take the log for the two sides of equation :
log Q = log K + n log H ,
where n : the power of H = ___ ( the slope.) from table .
log k = ___ from graph → k = ___ → Cd = ___ .
Results and Inference
The given notches are calibrated with the calibration equation
where
k=__,
n=__ for rectangular notch.
The average coefficient of discharge of the given notches are,
Rectangular notch, CDR =
The required characteristics are plotted.
______________________________________________________________________________________
JNEC CIVIL/FM-I/AUG 2010 Page 18
EXPERIMENT NO: VIII CALIBRATION OF TRIANGULAR
NOTCHES
Objectives
To Determine the coefficient of discharge of the given Triangular notch for different rates of flow.
Equipment required
The given notch fitted on an open channel of the experiment setup, hook
gauge to measure the water level over the notch and measuring tank with stop
watch to measure the actual flow rate.
Principle
In open channel flows, weirs are commonly used to either regulate or to measure
the volumetric flow rate. They are of particular use in large scale situations
such as irrigation schemes, canals and rivers. For small scale applications, weirs
are often referred to as notches and are sharp edged and manufactured from
thin plate material. The basic principle is that discharge is directly related to the
water depth above the crotch (bottom) of the notch. This distance is called head
over the notch. Due to the minimal installation costs flow rate measurement
with a notch is very less expensive.
The V notch or triangular notch design causes small changes in discharge to have a
large change in depth allowing more accurate head measurement than with a
rectangular notch. The flow pattern over a notch or weir is complex and there is no analytical
solution to the relationship between discharge and head so that a semi-empirical
approach has to be used.
The expression for discharge over a triangular notch is given by,
where,
L = width of the notch, (m)
θ= angle of the notch, (deg)
h= head of water over the notch, (m)
g= acceleration due to gravity (m/s2)
JNEC CIVIL/FM-I/AUG 2010 Page 19
Water is allowed to pass through the given notch at different flow rates.
Actual discharge through the channel can be determined using the collecting tank
and stopwatch setup.
Where,
a = area of the collecting tank. (m2)
H = height difference of the water column in the piezometer, (m)
t = time taken to rise H meters, (sec)
The coefficient of discharge CD is defined as the ratio of actual discharge
obtained experimentally to the theoretical discharge. i.e.
Calibration is the validation of specific measurement techniques and equipment.
It is the comparison between measurements of known magnitude made
with one device and another measurement made in as similar way as possible
with a second device. In order to use any device for measurement it is necessary
to empirically calibrate them. That is, here in this case pass a known discharge
through the notch and note the reading in order to provide a standard for measuring
other quantities in a different location. Provided the standard mechanics
of construction are followed no further calibration is required for a similar second
device with same geometry.
The calibration equation is stated as,
Qac = K hn
where ,
K and n are constants depending on the geometry of the notch. Taking
logarithm on both sides we get,
logQac = log k+n log h
which is the equation of a straight line,
where ,
log k is the y intercept and n is its slope.
The graph logQac Vs. logh is to be plotted to find k and n.
JNEC CIVIL/FM-I/AUG 2010 Page 20
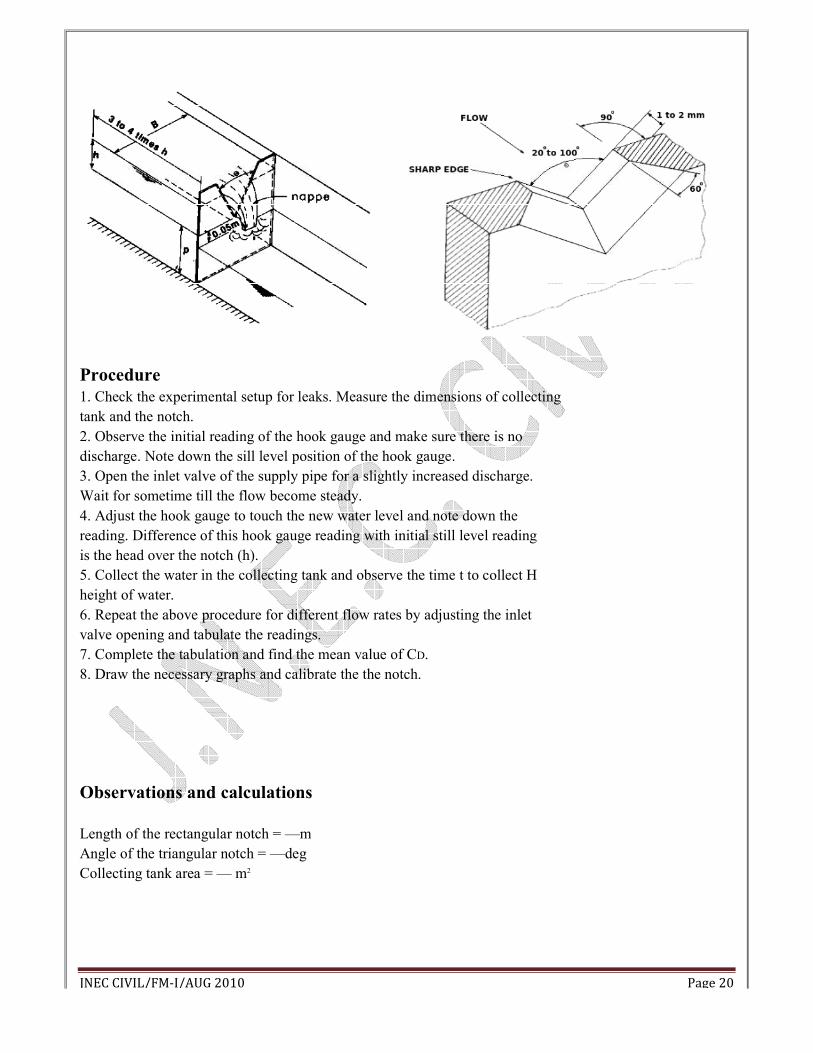
Procedure
1. Check the experimental setup for leaks. Measure the dimensions of collecting
tank and the notch.
2. Observe the initial reading of the hook gauge and make sure there is no
discharge. Note down the sill level position of the hook gauge.
3. Open the inlet valve of the supply pipe for a slightly increased discharge.
Wait for sometime till the flow become steady.
4. Adjust the hook gauge to touch the new water level and note down the
reading. Difference of this hook gauge reading with initial still level reading
is the head over the notch (h).
5. Collect the water in the collecting tank and observe the time t to collect H
height of water.
6. Repeat the above procedure for different flow rates by adjusting the inlet
valve opening and tabulate the readings.
7. Complete the tabulation and find the mean value of CD.
8. Draw the necessary graphs and calibrate the the notch.
Observations and calculations
Length of the rectangular notch = —m
Angle of the triangular notch = —deg
Collecting tank area = — m2
JNEC CIVIL/FM-I/AUG 2010 Page 21
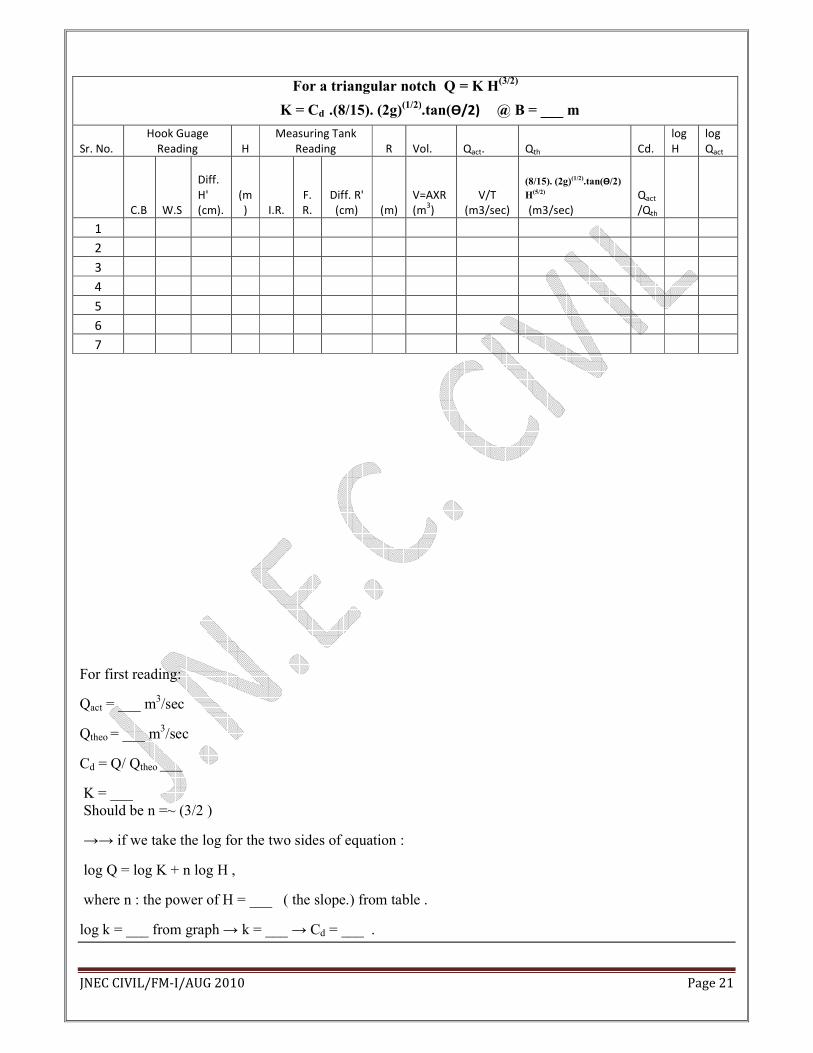
For a triangular notch Q = K H(3/2)
K = Cd .(8/15). (2g)(1/2)
.tan(Ѳ/2) @ B = ___ m
Sr. No.
Hook Guage
Reading H
Measuring Tank
Reading R Vol. Qact. Qth Cd.
log
H
log
Qact
C.B W.S
Diff.
H'
(cm).
(m
) I.R.
F.
R.
Diff. R'
(cm) (m)
V=AXR
(m3)
V/T
(m3/sec)
(8/15). (2g)(1/2).tan(Ѳ/2)
H(5/2)
(m3/sec)
Qact
/Qth
1
2
3
4
5
6
7
For first reading:
Qact = ___ m3/sec
Qtheo = ___ m3/sec
Cd = Q/ Qtheo ___
K = ___
Should be n =~ (3/2 )
→→ if we take the log for the two sides of equation :
log Q = log K + n log H ,
where n : the power of H = ___ ( the slope.) from table .
log k = ___ from graph → k = ___ → Cd = ___ .
JNEC CIVIL/FM-I/AUG 2010 Page 22
Results and Inference
The given notches are calibrated with the calibration equation
where
k=__,
n=__ for triangular notch.
The average coefficient of discharge of the given notches are,
Triangular notch, CdR =
The required characteristics are plotted.
_____________________________________________________________________________________
Top Related