


Languages
Pages
Legal


1401 21ST AVE N | FARGO, ND 58102 PAGE 2 OF 5
simple yet widely accepted modeling approach that uses a constant flow to represent a flooding event, and it is
currently the most common tool used for FIS efforts. Modeling for the FM Diversion project uses the same
HEC-RAS program, but with an unsteady state approach that analyzes a river system with the entire flood
hydrograph. Unsteady state models are capable of producing more realistic flooding results when compared to
a steady state model, especially in areas where floodplain storage and hydrograph timing is critical, like it is in
the Red River Valley. The city engineering staff recognizes that the unsteady state HEC-RAS model from the
FM Diversion modeling is the best model available, therefore it has been chosen to be used for this study to
analyze the impacts of future flood mitigation projects.
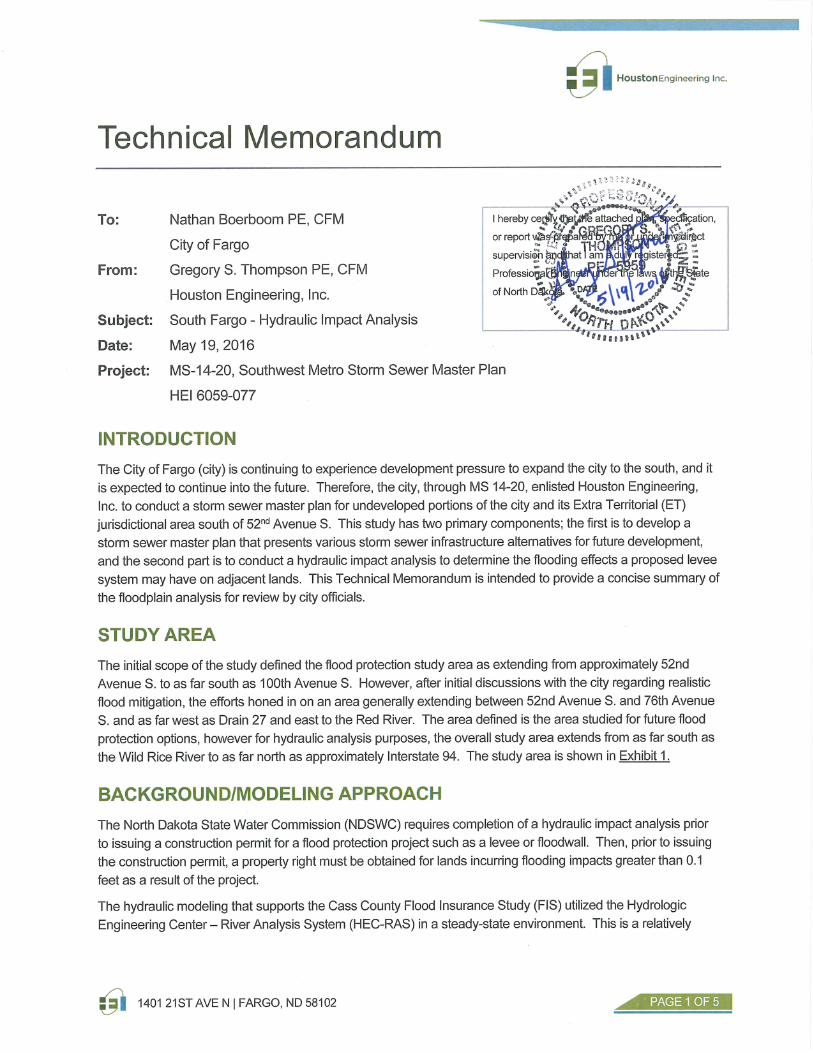
FLOOD CHARACTERISTICS
Flooding throughout the study area can be quite complex when breakout flows and reverse flows are observed.
Exhibit 2 and the following text further describe the flood patterns throughout the study area. Flood waters
upstream of the study area originate in the Wild Rice River and Red River basins which converge upstream of
the Fargo/Moorhead area. Floodwaters continue north through Fargo and Moorhead as displayed with white
arrows on Exhibit 2.
During large flood events, the Wild Rice River will break out into Drain 27 and/or Drain 53. This water then
continues north and east until it enters Rose Coulee which outlets into the Red River between 40th Avenue S.
and 52nd Avenue S. The breakout waters are shown with red arrows in Exhibit 2.
Near the crest of a flood, Red River floodwaters will back up into Rose Coulee, Drain 27 and Drain 53 until
flooding levels equalize between the Red River and the currently undeveloped land upstream along Drain 27
and Drain 53. This “reverse” flow effect was observed by sand bagging volunteers along Drain 27 just before
the crest of the 2009 flood. The orange arrows on Exhibit 2 show the reverse flow.
Without temporary and permanent flood protection measures (levees and floodwalls) along Drain 27 and Rose
Coulee, flooding would break out of the north side of Drain 27 and Rose Coulee and flow through the developed
portions of the city as displayed with blue arrows in Exhibit 2.
FLOODPLAIN IMPACTS
EXISTING CONDITIONS FLOODING
An “existing conditions” floodplain assumes no permanent or temporary flood protection measures are in place.
The communities have been fortunate to not have had to experience an “existing conditions” floodplain as
described in the FEMA Flood Insurance Rate Map (FIRM), or as described in the FM Diversion modeling. This
is attributed to the rigorous flood fighting efforts put forth by the local communities during the recent floods. As
displayed in Exhibit 3, the existing conditions floodplain would extend throughout the light blue and dark blue
flooded areas.
FUTURE CONDITIONS FLOODING
For this analysis, it was assumed that future conditions would include flood protection down to approximately
76th Avenue S. Then, upon levee certification, it is expected that the remaining floodplain would more closely
resemble the dark blue flooding shown on Exhibit 3. However, eliminating the light blue floodplain would cause
adverse flooding impacts on adjacent areas (dark blue).

1401 21ST AVE N | FARGO, ND 58102 PAGE 3 OF 5
Floodplain impacts are primarily caused by one or both of the following:
1) Reducing the conveyance in a river corridor (levees/floodwalls)
2) Removing natural storage from a floodplain (fill or levees on previously flooded land)
Within the study area, conveyance issues are typically identified along the Red River and Wild Rice River,
whereas storage loss is more readily measured in the backwater flooding areas of Drain 27, Drain 53, and Rose
Coulee.
HYDRAULIC MODELING
HEC-RAS – 1D MODEL
The unsteady state HEC-RAS model (Phase 8) from the FM Diversion project was used as a backbone for this
analysis. The model uses cross sections to represent the rivers themselves and storage areas to represent
sections of farmland and/or developed areas through town. The model has gone through several internal and
external reviews through the FM Diversion project and it has been considered to be the best available large
scale model of the Red River. Historic flood events from 1997, 2006, 2009, and 2011 have been used for
calibration, and synthetic events such as 10-, 25-, 50-, 100-, and 500-year events have been created for FM
Diversion design purposes. The synthetic events utilize the latest hydrology developed for the FM Diversion
project. Since the primary objective of the “In-Town” flood mitigation work through Fargo has been to provide
certifiable flood protection, the levees and floodwalls have been designed to protect against the regulatory
FEMA floodplain which produces 29,300 cfs (39.3 feet) at the Fargo Gage. Therefore, for this analysis, the 50-
year hydrology from the FM Diversion model was adjusted to closely match the FEMA 100-year flood elevation
and discharge at the Fargo Gage.
The existing conditions unsteady model reflects the flooding that would exist through town if no flood protection
measures were implemented. With this model, approximately 4,500 cfs would be expected to flow through the
developed portion of town and approximately 24,800 cfs would flow in the channel portion of the Red River.
When the flood protection measures are implemented, the north side of Drain 27 and Rose Coulee essentially
become a wall that prevents floodwaters from flowing north. The floodwaters become restricted to the Red
River channel which causes a stage increase, adversely affecting flooding in other areas (Exhibit 3, dark blue).
Exhibit 4 further describes the flow distribution between the overland conveyance and the channel conveyance.
The impacts are partially attributed to the encroachment along the Red River, but are also a result of removing
the floodplain storage in the Drain 27, Drain 53, and Rose Coulee areas. Exhibit 5 displays five study areas
referred to as “zones” with the associated floodplain volume removed by implementing the flood protection
projects.
The proposed solution agreed upon during the planning process was to provide comparable floodplain storage
in a condensed location such that the city could further expand south of 52nd Avenue S. in the remaining
available land. The results of the preliminary analysis were presented to the City Commission on September
21, 2015.

1401 21ST AVE N | FARGO, ND 58102 PAGE 4 OF 5
The required mitigation from the preliminary 1D analysis was fairly conceptual, and consisted of the following:
30,000,000 CY of Pond Excavation
15 Miles of Levee
2,000 Acres of Land to be used for Flood Storage
Construction = $150M
Land = $30M
Total Cost = $180M
Exhibit 6 displays the potential storage requirements from the initial 1D modeling assuming mitigation ponds
would be excavated 10 feet deep. The pond shape and locations were subjectively chosen as a concept. They
could be placed almost anywhere along Drain 27 and Drain 53. However, the storage volume becomes less
efficient as the distance increases from the existing conditions floodplain area (Rose Coulee area).
HEC-RAS – 2D MODEL
The unsteady state HEC-RAS model as described above uses 1 Dimensional calculations. However, as this
study developed, a beta version of HEC-RAS 2D became available, and as of spring 2016, the first official
release of HEC-RAS 2D was made available. The 2D model has the capability of accounting for more detail
within the city such as building structures, building pads, and roughness of the ground (grass vs. pavement).
This provides a more accurate representation of how flood waters would move through the city, potentially
slowing down the “through town” hydrograph. If the hydrograph is slowed, it pushes more water to the channel
for existing conditions, reducing the level of necessary mitigation. This would result in an overall savings in the
cost of mitigation.
Since HEC-RAS 2D modeling is relatively new, several sensitivity analyses were conducted to validate
assumptions and parameters used in the modeling. The final 2D modeling results showed that the 4,500 cfs
flow through town identified in the 1D model was reduced to approximately 1,850 cfs. This reduced the required
flood mitigation to the following:
20,000,000 CY of Pond Excavation
10 Miles of Levee
1,100 Acres of Land to be used for Flood Storage
Construction = $100M
Land = $16M
Total Cost = $116M
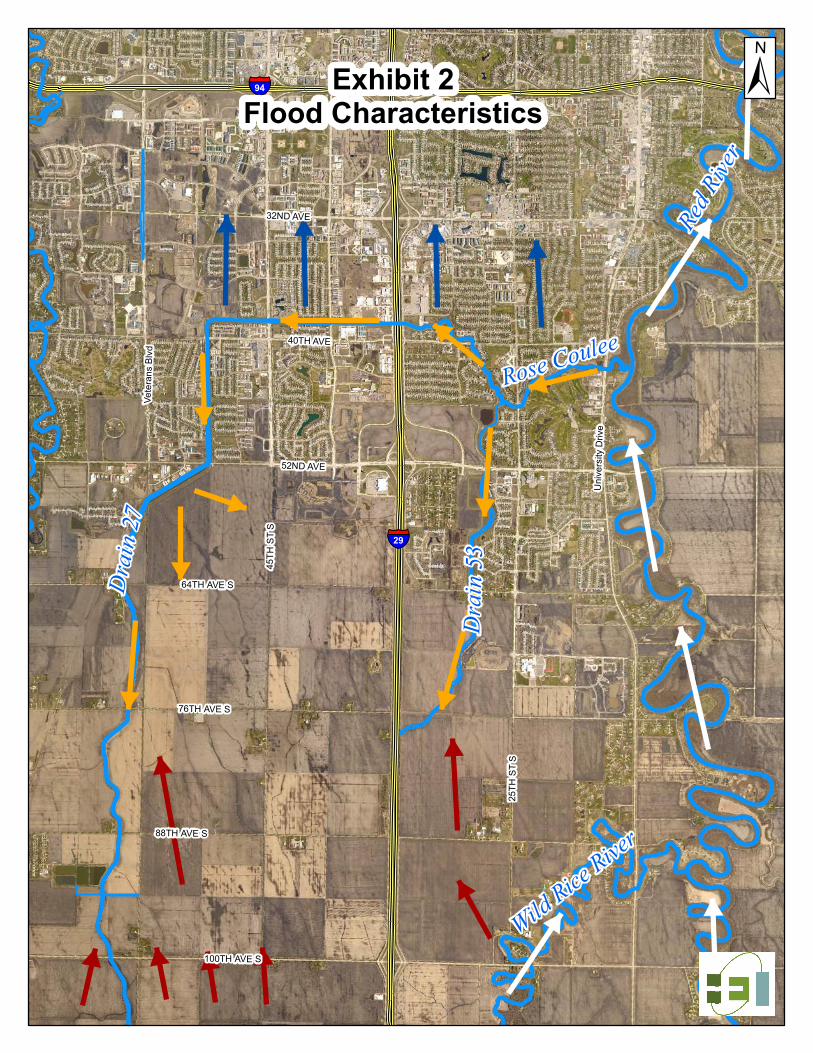
Exhibit 7 displays the area of the model that was evaluated with the 2D approach. 2D modeling utilizes a “grid”
or a “mesh” that provides the additional detail. For this analysis, a mesh spacing of 50 feet was used to better
define the buildings and obstructions through town. Each face of the mesh acts like a channel cross section in a
1D model. Exhibit 8 displays how the 2D mesh reflects the topography along a row of houses. The 2D mesh
also utilized the city GIS impervious layer to account for the roughness of grass compared to impervious
pavement surfaces.

1401 21ST AVE N | FARGO, ND 58102 PAGE 5 OF 5
CONCLUSION
The city recognizes that the flooding south of the city limits is real, regardless of if it was defined by FEMA or
with the more detailed unsteady state modeling. The initial scope of the study was intended to provide a
conceptual line of flood protection for areas south of 52nd Avenue, while still mitigating the adverse floodplain
impacts. However, the study expanded beyond mitigating only for future levees. It also addressed the
necessary mitigation for the levees that are currently being constructed along Drain 27, Drain 53, and Rose
Coulee assuming that they would need a NDSWC construction permit and would become certified.
The initial analysis was conducted with the readily available FM Diversion unsteady HEC-RAS model. The
model was originally developed for the larger scale diversion analysis, but was then revised with more detail
(2D) specific to the south Fargo area. The initial analysis of this study suggested that significant flood mitigation
would be required to offset the flooding impacts. After expanding the analysis with the 2D modeling, the
mitigation still remains quite extensive.
ADDITIONAL CONSIDERATIONS
Flood Insurance Studies are hydrologic and hydraulic analyses conducted to provide a better understanding of
the potential flood risk for a given area. The flood elevations are created using a hydraulic model and the flows
are generated using historic gage records. The effective (regulatory) floodplain through the Fargo/Moorhead
area (39.3 feet) was developed using hydrology from the 1970s. When the latest FIS was developed for Fargo
(Effective, 2014), the process began before many of the larger floods were experienced (2006, 2009, 2010,
2011, etc.), so even the newer hydrology didn’t prove to be much different than what was developed in the
1970s. However, the FM Diversion project hydrology was developed using many of the more recent large
floods. This produced a 100-year discharge of 34,700 cfs, which equates to approximately 41 feet at the Fargo
Gage as opposed to the previously defined 39.3 feet. If the Red River is encroached with levees on either side
with the higher flows, the flood elevation is anticipated to exceed 42 feet. This shows that the real 1% chance
flood risk is much higher than the in-town flood protection projects are being designed for. Due to bank stability
concerns along the rivers and natural ground elevations, it is not likely that many of the existing levees would be
capable of being raised to be certified to the revised floodplain.

Drain
27
Dra
in 5
3
Red R
iver
Wild
Ric
e Riv
er
Rose Coulee
Uni v
ers
i ty D
rive
Ve
t era
ns B
lvd
32ND AVE
40TH AVE
52ND AVE
45T
H S
T S
88TH AVE S
64TH AVE S
25T
H S
T S
76TH AVE S
100TH AVE S
§̈¦94
§̈¦29
±Exhibit 1Study Area
Drain
27
Dra
in 5
3
Red R
iver
Wild
Ric
e Riv
er
Rose Coulee
Uni v
ers
i ty D
rive
Ve
t era
ns B
lvd
32ND AVE
40TH AVE
52ND AVE
100TH AVE S
45T
H S
T S
88TH AVE S
64TH AVE S
25T
H S
T S
76TH AVE S
§̈¦94
§̈¦29
±Exhibit 2
Flood Characteristics

Drain
27
Dra
in 5
3
Red R
iver
Wild
Ric
e Riv
er
Rose Coulee
Uni v
ers
i ty D
rive
Ve
t era
ns B
lvd
32ND AVE
40TH AVE
52ND AVE
100TH AVE S
45T
H S
T S
88TH AVE S
64TH AVE S
25T
H S
T S
76TH AVE S
§̈¦94
§̈¦29
±Exhibit 3Existing Conditions and With-Project Floodplains

880
885
890
895
900
905
910
915
0 5,000 10,000 15,000 20,000
Drain
27
Red R
iver
Rose Coulee§̈¦29
±Exhibit 4Conveyance Loss
880
885
890
895
900
905
910
915
0 5,000 10,000 15,000 20,000
Existing Conditions Floodplain
With Project Floodplain
45th
St
I-2
9
25th
St
Un
ive
rsit
y D
r
45th
St
I-2
9
25th
St
Un
ive
rsit
y D
r
4,500 cfs Overland 24,800 cfs Channel
4,500 cfs Into Storage 24,800 cfs Channel
Red
Riv
er
Red
Riv
er

Drain
27
Dra
in 5
3
Red R
iver
Rose Coulee
§̈¦94
§̈¦29
Zone # 1
Zone# 2
Zone # 5 Zone # 4
Zone # 3
±Exhibit 5Floodplain Volume by Zone
Zone 1 = 3,100 ac-ftZone 2 = 100 ac-ftZone 3 = 1,000 ac-ftZone 4 = 800 ac-ft
Zone 5 = 1,400 ac-ft
Total = 6,400 ac-ft

Drain
27
Dra
in 5
3
Red R
iver
Rose Coulee
§̈¦94
§̈¦29
±Exhibit 6Project with 1D Analysis
30,000,000 CY Excavation15 Miles of Levee2,000 Acres of Land
Construction = $150MLand = $30MTotal = $180M
Drain
27
Dra
in 5
3
Red R
iver
Wild
Ric
e Riv
er
Rose Coulee
§̈¦94
§̈¦29
±Exhibit 7HEC-RAS Geometry and 2D Mesh

±Exhibit 8
HEC-RAS 2D Mesh

Drain
27
Dra
in 5
3
Red R
iver
Rose Coulee
§̈¦94
§̈¦29
±Exhibit 9Project with 2D Analysis
20,000,000 CY Excavation10 Miles of Levee1,100 Acres of Land
Construction = $100MLand = $16MTotal = $116M
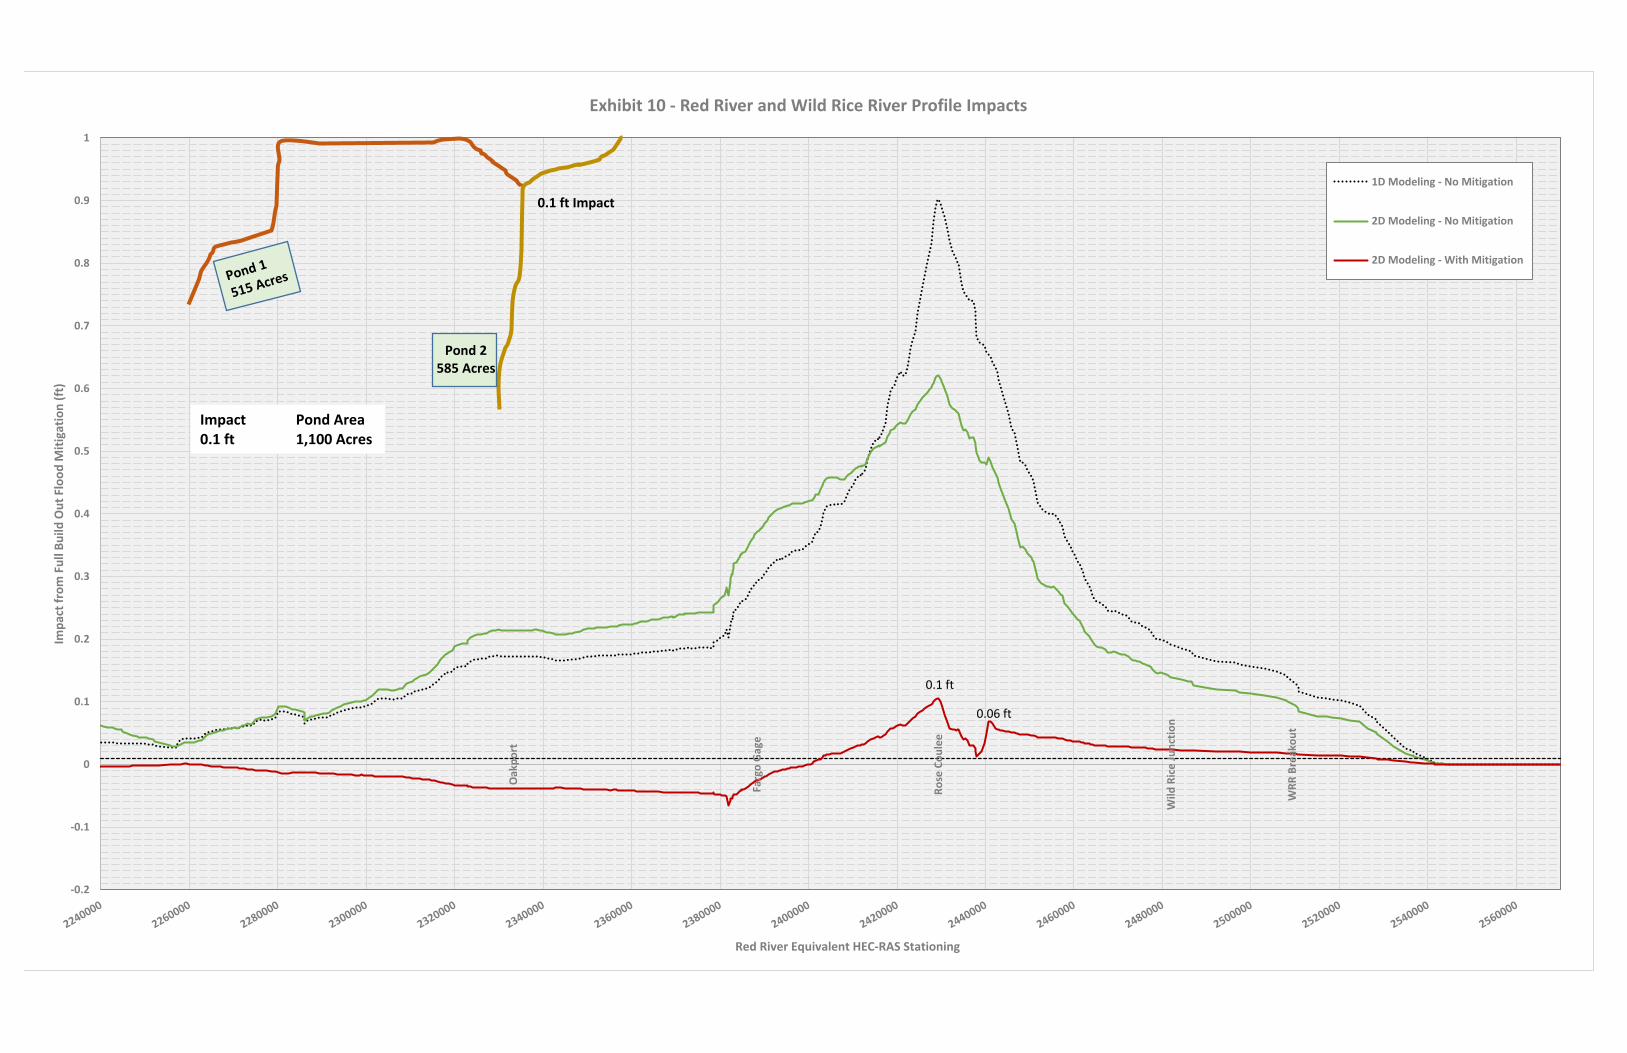
Farg
o G
age
Ro
se C
ou
lee
Wild
Ric
e J
un
ctio
n
WR
R B
reak
ou
t
Oak
po
rt
-0.2
-0.1
0
0.1
0.2
0.3
0.4
0.5
0.6
0.7
0.8
0.9
1
Imp
act
fro
m F
ull
Bu
ild O
ut
Flo
od
Mit
igat
ion
(ft
)
Red River Equivalent HEC-RAS Stationing
Exhibit 10 - Red River and Wild Rice River Profile Impacts
1D Modeling - No Mitigation
2D Modeling - No Mitigation
2D Modeling - With Mitigation
0.1 ft
0.06 ft
Pond 2585 Acres
0.1 ft Impact
Impact Pond Area0.1 ft 1,100 Acres
Top Related