


Languages
Pages
Legal


First Abu Dhabi Bank vs Peer Banks
17 October 2017

2
Disclaimer
The information contained herein has been prepared by First Abu Dhabi Bank P.J.S.C (“FAB”). FAB relies on information
obtained from sources believed to be reliable but does not guarantee its accuracy or completeness.
This presentation has been prepared for information purposes only and is not and does not form part of any offer for sale
or solicitation of any offer to subscribe for or purchase or sell any securities nor shall it or any part of it form the basis of or
be relied on in connection with any contract or commitment whatsoever.
Some of the information in this presentation may contain projections or other forward-looking statements regarding future
events or the future financial performance of FAB. These forward-looking statements include all matters that are not
historical facts. The inclusion of such forward-looking information shall not be regarded as a representation by FAB or any
other person that the objectives or plans of FAB will be achieved. FAB undertakes no obligation to publicly update or
publicly revise any forward-looking statement, whether as a result of new information, future events or otherwise.

3
Foreword
Welcome to our “First Abu Dhabi Bank vs Peer Banks” report. In this document we compare FAB with some of the best known banks
in the world – from the West (US, Canada, UK, Europe, Scandinavia, etc) to the Middle East region (GCC) and Asia (China, Hong
Kong, Japan, Korea, India, Australia, etc) using only factual information and data. The approach we have followed for this analysis is
as follows:
➢ We compare the peer banks across various parameters such as credit ratings, CDS spreads, RoE, Capital Adequacy, etc.
➢ We have used “composite ratings” for this analysis – i.e. the average of the ratings assigned by three leading rating agencies
Moody’s, S&P and Fitch – in order to provide a holistic view of the credit strength of each bank.
➢ We have deliberately made the report text-light and chart-based in an attempt to make it easier to digest. Hopefully you will find it
both interesting and useful.
➢ Please note that the financial ratios shown for FAB (First Abu Dhabi Bank) are the pro-forma numbers of the new
merged entity as the merger between First Gulf Bank and National Bank of Abu Dhabi is now complete and the merged
entity - First Abu Dhabi Bank - is effective as from 1st April 2017
FAB
GCC
Western Region
Eastern
Region

4
Rating comparison – FAB vs Western banks
Moody's S&P FitchComposite
Rating
Composite
Score
5-yr CDS
level**Rating Outlook Score* Rating Outlook Score* Rating Outlook Score*
First Abu Dhabi Bank (FAB) * Aa3 Stable 4 AA- Stable 4 AA- Stable 4 AA- 4 95
U.K. Banks
HSBC A 2 Negative 6 A Negative 6 AA- Stable 4 A+ 5 23
Standard Chartered (StanChart) A2 Stable 6 BBB+ Stable 8 A+ Negative 5 A 6 45
Lloyds Banking Group (Lloyds) A3 Stable 7 BBB+ Negative 8 A+ Stable 5 A- 7 38
Barclays Baa2 Negative 9 BBB Negative 9 A Stable 6 BBB+ 8 49
Royal Bank of Scotland (RBS) Baa3 Stable 10 BBB- Stable 10 BBB+ Stable 8 BBB 9 55
European Banks
Svenska Handelsbanken Aa2 Stable 3 AA- Stable 4 AA Stable 3 AA 3 23
Banque Cantonale Vaudoise Aa2 Stable 3 AA Stable 3 NA NA NA AA 3 NA
Swedbank Aa3 Stable 4 AA- Negative 4 AA- Stable 4 AA- 4 27
Skandinaviska Enskilda Banken (SEB) Aa3 Stable 4 A+ Stable 5 AA- Stable 4 AA- 4 32
Rabobank Aa2 Negative 3 A+ Positive 5 AA- Stable 4 AA- 4 27
UBS AG A1 Stable 5 A+ Stable 5 AA- Stable 4 A+ 5 22
Credit Agricole A1 Stable 5 A Stable 6 A+ Stable 5 A+ 5 33
BNP Paribas Aa3 Stable 4 A Stable 6 A+ Stable 5 A+ 5 35
Societe Generale (SocGen) A2 Stable 6 A Stable 6 A Stable 6 A 6 36
ING Groep NV Baa1 Stable 8 A- Stable 7 A+ Stable 5 A- 7 48
Credit Suisse Baa2 Stable 9 BBB+ Stable 8 A- Stable 7 BBB+ 8 67
Deutsche Bank Baa2 Stable 9 A- Negative 7 BBB+ Stable 8 BBB+ 8 91
North American Banks
Royal Bank of Canada (RBC) A1 Negative 5 AA- Negative 4 AA Negative 3 AA- 4 NA
Toronto-Dominion Bank (TDBank) Aa2 Negative 3 AA- Stable 4 AA- Stable 4 AA- 4 55
Bank of Nova Scotia A1 Negative 5 A+ Stable 5 AA- Stable 4 A+ 5 NA
Bank of Montreal (BMO) A1 Negative 5 A+ Stable 5 AA- Stable 4 A+ 5 NA
JP Morgan Chase A3 Stable 7 A- Stable 7 A+ Stable 5 A 6 46
Morgan Stanley A3 Stable 7 BBB+ Stable 8 A Stable 6 A- 7 58
Citigroup Inc Baa1 Stable 8 BBB+ Stable 8 A Stable 6 A- 7 49
Goldman Sachs A3 Stable 7 BBB+ Stable 8 A Stable 6 A- 7 62
Bank of America Baa1 Watch Pos 8 BBB+ Stable 8 A Stable 6 A- 7 47
Notes: * The credit ratings of FAB are for of the new merged entity, as assigned by the rating agencies, following the completion of the merger between First Gulf Bank and National
Bank of Abu Dhabi and the merged entity - First Abu Dhabi Bank - is effective as from 1st April 2017; Scoring is derived based on the rating assigned by the rating agencies. AAA or
equivalent being the best with rank “1”, followed by AA+ or equivalent as “2”, AA or equivalent as “3” and so on; ** CDS levels are for 13-Oct-17 & in basis points; Source: Bloomberg

5
Rating comparison – FAB vs GCC banks
Moody's S&P FitchComposite
Rating
Composite
Score
5-yr CDS
level**Rating Outlook Score* Rating Outlook Score* Rating Outlook Score*
First Abu Dhabi Bank (FAB) * Aa3 Stable 4 AA- Stable 4 AA- Stable 4 AA- 4 95
UAE Banks
Union National Bank (UNB) A1 Stable 5 NA NA NA A+ Stable 5 A+ 5 NA
Abu Dhabi Commercial Bank (ADCB) A1 Stable 5 A Stable 6 A+ Stable 5 A+ 5 76
Emirates NBD (ENBD) A3 Stable 7 NA NA NA A+ Stable 5 A 6 119
Mashreqbank Baa1 Stable 8 BBB+ Stable 8 A Stable 6 A- 7 130
Qatar Banks
Qatar National Bank (QNB) Aa3 Negative 4 A Negative 6 A+ Negative 5 A+ 5 145
Doha Bank A2 Negative 6 A- Negative 7 A Negative 6 A 6 NA
Commercial Bank of Qatar (CBQ) A2 Negative 6 BBB+ Negative 8 A Negative 6 A- 7 201
Saudi Banks
Samba Financial Group A1 Stable 5 BBB+ Stable 8 A- Stable 7 A- 7 127
National Commercial Bank (NCB) A1 Stable 5 BBB+ Stable 8 A- Stable 7 A- 7 129
Banque Saudi Fransi A1 Stable 5 BBB+ Stable 8 A- Stable 7 A- 7 NA
Bahrain Banks
Arab Banking Corporation (ABC) NA NA NA BBB- Negative 10 BBB- Stable 10 BBB- 10 98
National Bank of Bahrain (NBB) B2 Negative 15 NA NA NA BB+ Negative 11 BB- 13 NA
Kuwait Banks
National Bank of Kuwait (NBK) Aa3 Stable 4 A+ Stable 5 AA- Stable 4 AA- 4 NA
Commercial Bank of Kuwait (CBK) A3 Stable 7 NA NA NA A+ Stable 5 A 6 NA
Oman Banks
Bank Muscat SAOG Baa2 Negative 9 BB+ Negative 11 BBB Negative 9 BBB- 10 NA
National Bank of Oman Baa3 Negative 10 NA NA NA BBB- Stable 10 BBB- 10 NA
Notes: * The credit ratings of FAB are for of the new merged entity, as assigned by the rating agencies, following the completion of the merger between First Gulf Bank and National
Bank of Abu Dhabi and the merged entity - First Abu Dhabi Bank - is effective as from 1st April 2017; Scoring is derived based on the rating assigned by the rating agencies. AAA or
equivalent being the best with rank “1”, followed by AA+ or equivalent as “2”, AA or equivalent as “3” and so on; ** CDS levels are for 13-Oct-17 & in basis points Source: Bloomberg

6
Rating comparison – FAB vs Eastern banks
Notes: * The credit ratings of FAB are for of the new merged entity, as assigned by the rating agencies, following the completion of the merger between First Gulf Bank and National
Bank of Abu Dhabi and the merged entity - First Abu Dhabi Bank - is effective as from 1st April 2017; Scoring is derived based on the rating assigned by the rating agencies. AAA or
equivalent being the best with rank “1”, followed by AA+ or equivalent as “2”, AA or equivalent as “3” and so on; ** CDS levels are for 13-Oct-17 & in basis points; For OCBC, UOB &
DBS the CDS are at subordinate level as Senior CDS quotes are not available; Source: Bloomberg
Moody's S&P FitchComposite
Rating
Composite
Score
5-yr CDS
level**Rating Outlook Score* Rating Outlook Score* Rating Outlook Score*
First Abu Dhabi Bank (FAB) * Aa3 Stable 4 AA- Stable 4 AA- Stable 4 AA- 4 95
Japanese Banks
Sumitomo Mitsui Financial Group A1 Stable 5 A- Positive 7 A Stable 6 A 6 47
Mitsubishi UFJ Financial Group Inc (MUFG) A1 Stable 5 A Negative 6 A Stable 6 A 6 46
Mizuho Financial Group Inc A1 Stable 5 A- Stable 7 A- Stable 7 A 6 48
Nomura Holdings Baa1 Stable 8 A- Negative 7 A- Stable 7 A- 7 44
Australian Banks
Commonwealth Bank of Australia Aa3 Stable 4 AA- Negative 4 AA- Stable 4 AA- 4 55
National Australia Bank (NAB) Aa3 Stable 4 AA- Negative 4 AA- Stable 4 AA- 4 53
Australia & New Zealand Bank (ANZ) Aa3 Stable 4 AA- Negative 4 AA- Stable 4 AA- 4 53
Westpac Banking Corp Aa3 Stable 4 AA- Negative 4 AA- Stable 4 AA- 4 53
Macquarie Group A3 Stable 7 BBB Stable 9 A- Stable 7 BBB+ 8 85
Other Asian Banks (ex Japan & Australia)
Oversea-Chinese Banking Corp (OCBC) Aa1 Stable 2 AA- Stable 4 AA- Stable 4 AA 3 72
United Overseas Bank (UOB) Aa1 Stable 2 AA- Stable 4 AA- Stable 4 AA 3 72
DBS Group Aa2 Stable 3 NA NA NA AA- Stable 4 AA- 4 69
Export-Import Bank of China (EXIM China) A1 Stable 5 A+ Stable 5 A+ Stable 5 A+ 5 63
Ind. & Commercial Bank of China (ICBC) A1 Stable 5 A Stable 6 A Stable 6 A 6 73
Bank of China A1 Stable 5 A Stable 6 A Stable 6 A 6 69
Export-Import Bank of Korea (EXIM Korea) Aa2 Stable 3 AA Stable 3 AA- Stable 4 AA 3 72
Industrial Bank of Korea Aa2 Stable 3 AA- Stable 4 AA- Stable 4 AA- 4 75
ICICI Bank Baa3 Stable 10 BBB- Stable 10 BBB- Stable 10 BBB- 10 102
State Bank of India Baa3 Positive 10 BBB- Stable 10 BBB- Stable 10 BBB- 10 97
Bank of India Baa3 Negative 10 BB+ Stable 11 BBB- Stable 10 BBB- 10 130

7
FAB
StanChartLloyds
Barclays
HSBC
RBS
UBS
Credit Suisse
Deutsche Bank
ING
BNPCredit Agricole
SocGen
Goldman SachsMorgan Stanley
Citigroup
BofAJP Morgan
TDBank
Rabobank
SEB
SwedbankHandelsbanken
Nomura*
Sumitomo* Mizuho*
MUFG*ANZ***
Commonwealth Bank**
NAB***
Macquarie*
Westpac***
OCBC UOBDBS
ICBC
Bank of ChinaEXIM China
Ind. Bank of KoreaEXIM Korea
ICICI*
State Bank of India*
Bank of India*
ENBD
ADCB
Mashreq
QNB
CBQ
Samba
NCB
ABC
10
25
40
55
70
85
100
115
130
145
160
175
190
205
AA+ AA AA- A+ A A- BBB+ BBB BBB-
Western banks
GCC Banks
Eastern banks
Composite credit rating vs 5-year CDS spread
Notes: * The credit ratings of FAB are for of the new merged entity, as assigned by the rating agencies, following the completion of the merger between First Gulf Bank and National Bank of
Abu Dhabi and the merged entity - First Abu Dhabi Bank - is effective as from 1st April 2017; X-axis represents the composite rating. The ratings have been arranged from higher to lower
starting from ‘AA+’, followed by ‘AA’ and so on; CDS levels are for 01-Aug-17; For OCBC, UOB & DBS the CDS are at subordinate level as Senior CDS quotes are not available; Source:
Bloomberg

8
Common equity tier 1 ratio – CET1
Notes: Please note that the financial ratios shown for FAB (First Abu Dhabi Bank) are the pro-forma numbers of the new merged entity as the merger between First Gulf Bank and
National Bank of Abu Dhabi is now complete and the merged entity - First Abu Dhabi Bank - is effective as from 1st April 2017; FAB’s ratios are as per Central Bank of UAE’s Basel II
guidelines; Many GCC banks yet to start reporting the CET1 ratios; ^Banks in the Asian group have different financial year ending; FY ending other than 31-Dec-16 are highlighted with
special characters: * for 31-Mar-16; ** for 30-Jun-16; & *** for 30-Sep-16; We have taken the latest available annual ratios for comparison; Source: Bloomberg
Western Banks (FY 2016)
First Abu Dhabi Bank (FAB) * 13.3%
U.K. Banks
Lloyds Banking Group (Lloyds) 13.6%
HSBC 13.6%
Standard Chartered (StanChart) 13.6%
Royal Bank of Scotland (RBS) 13.4%
Barclays 12.4%
European Banks
Svenska Handelsbanken 25.1%
Swedbank 25.0%
Skandinaviska Enskilda Banken (SEB) 18.8%
UBS AG 16.8%
Banque Cantonale Vaudoise 16.8%
ING Groep NV 14.2%
Rabobank 14.0%
Credit Suisse 13.6%
Deutsche Bank 13.4%
Credit Agricole 12.1%
BNP Paribas 11.6%
Societe Generale 11.5%
North American Banks
Morgan Stanley 16.9%
Citigroup Inc 14.9%
Goldman Sachs 13.1%
JP Morgan Chase 12.5%
Bank of America 12.1%
Bank of Nova Scotia 11.0%
Royal Bank of Canada (RBC) 10.8%
Toronto-Dominion Bank (TDBank) 10.4%
Bank of Montreal (BMO) 10.1%
Eastern Banks (2016^)
First Abu Dhabi Bank (FAB) * 13.3%
Japanese Banks
Nomura Holdings* 18.2%
Sumitomo Mitsui Financial Group* 12.2%
Mitsubishi UFJ Financial Group Inc (MUFG)* 11.8%
Mizuho Financial Group Inc* 11.3%
Australian Banks
Macquarie Group* 11.1%
Commonwealth Bank of Australia** 10.1%
National Australia Bank (NAB)*** 9.8%
Australia & New Zealand Bank (ANZ)*** 9.6%
Westpac Banking Corp*** 9.5%
Other Asian Banks (ex Japan & Aus)
Oversea-Chinese Banking Corp (OCBC) 14.7%
DBS Group 14.1%
United Overseas Bank (UOB) NA
Industrial & Commercial Bank of China (ICBC) NA
Bank of China 11.4%
Export-Import Bank of China (EXIM China) NA
Industrial Bank of Korea 9.4%
Export-Import Bank of Korea (EXIM Korea) NA
ICICI Bank* NA
State Bank of India* 9.9%
Bank of India* 7.7%

9
FABStanChart Lloyds
Barclays
HSBCRBS
UBS
Credit Suisse
Deutsche Bank
ING
BNP
Credit Agricole
SocGen
Goldman Sachs
Morgan Stanley
Citigroup
BofA
JP Morgan
RBCScotia
BMOTDBank
Rabobank
SEB
SwedbankHandelsbanken
Banque Cantonale
Nomura*
Sumitomo*
Mizuho*
MUFG*
ANZ***
Commonwealth Bank** NAB***
Macquarie*
Westpac***
OCBCDBS
Bank of China
Ind. Bank of Korea
State Bank of India*
Bank of India*
QNB
6%
8%
10%
12%
14%
16%
18%
20%
22%
24%
26%
AA+ AA AA- A+ A A- BBB+ BBB BBB-
Western banks
GCC Banks
Eastern banks
Common equity tier 1 ratio (CET1) vs Composite rating
Notes: Please note that the financial ratios shown for FAB (First Abu Dhabi Bank) are the pro-forma numbers of the new merged entity as the merger between First Gulf Bank and National
Bank of Abu Dhabi is now complete and the merged entity - First Abu Dhabi Bank - is effective as from 1st April 2017; FAB’s ratios are as per Central Bank of UAE’s Basel II guidelines;
Many GCC banks yet to start reporting the CET1 ratios; ^Banks in the Asian group have different financial year ending; FY ending other than 31-Dec-16 are highlighted with special
characters: * for 31-Mar-16; ** for 30-Jun-16; & *** for 30-Sep-16; We have taken the latest available annual ratios for comparison; Source: Bloomberg

10
Tier 1 capital adequacy ratio
Notes: Please note that the financial ratios shown for FAB (First Abu Dhabi Bank) are the pro-forma numbers of the new merged entity as the merger between First Gulf Bank and National
Bank of Abu Dhabi is now complete and the merged entity - First Abu Dhabi Bank - is effective as from 1st April 2017; FAB’s ratios are as per Central Bank of UAE’s Basel II guidelines;
^Banks in the Asian group have different financial year ending; FY ending other than 31-Dec-16 are highlighted with special characters: * for 31-Mar-16; ** for 30-Jun-16; & *** for 30-Sep-
16; We have taken the latest available annual ratios for comparison; Source: Bloomberg
Western Banks (FY 2016)
First Abu Dhabi Bank (FAB) * 15.5%
U.K. Banks
Royal Bank of Scotland (RBS) 17.7%
Lloyds Banking Group (Lloyds) 17.0%
HSBC 16.1%
Standard Chartered (StanChart) 15.7%
Barclays 15.6%
European Banks
Swedbank 28.7%
Svenska Handelsbanken 27.9%
Skandinaviska Enskilda Banken (SEB) 21.2%
UBS AG 19.7%
Credit Suisse 18.0%
Rabobank 17.6%
Banque Cantonale Vaudoise 16.8%
ING Groep NV 16.3%
Deutsche Bank 15.6%
Credit Agricole 15.1%
Societe Generale 14.5%
BNP Paribas 12.9%
North American Banks
Morgan Stanley 19.0%
Citigroup Inc 15.8%
Goldman Sachs 15.0%
JP Morgan Chase 14.2%
Bank of America 13.6%
Bank of Nova Scotia 12.4%
Royal Bank of Canada (RBC) 12.3%
Toronto-Dominion Bank (TDBank) 12.2%
Bank of Montreal (BMO) 11.6%
Eastern Banks (2016^)
First Abu Dhabi Bank (FAB) * 15.5%
Japanese Banks
Nomura Holdings* 19.2%
Sumitomo Mitsui Financial Group* 14.1%
Mitsubishi UFJ Financial Group Inc (MUFG)* 13.4%
Mizuho Financial Group Inc* 13.3%
Australian Banks
Macquarie Group* 13.3%
National Australia Bank (NAB)*** 12.2%
Commonwealth Bank of Australia** 12.1%
Australia & New Zealand Bank (ANZ)*** 11.8%
Westpac Banking Corp*** 11.2%
Other Asian Banks (ex Japan & Aus)
Oversea-Chinese Banking Corp (OCBC) 15.1%
DBS Group 14.7%
United Overseas Bank (UOB) 13.1%
Industrial & Commercial Bank of China
(ICBC)13.4%
Bank of China 12.3%
Export-Import Bank of China (EXIM China) NA
Industrial Bank of Korea 10.6%
Export-Import Bank of Korea (EXIM Korea) NA
ICICI Bank* 14.4%
State Bank of India* 10.4%
Bank of India* 9.4%
GCC Banks (FY 2016)
First Abu Dhabi Bank (FAB) * 15.5%
UAE Banks
Emirates NBD (ENBD) 18.7%
Union National Bank (UNB) 17.8%
Mashreqbank 16.0%
Abu Dhabi Commercial Bank (ADCB) 15.7%
Qatar Banks
Qatar National Bank (QNB) 15.9%
Doha Bank 15.4%
Commercial Bank of Qatar (CBQ) 9.6%
Saudi Banks
Samba Financial Group 21.8%
National Commercial Bank (NCB) 16.9%
Banque Saudi Fransi 15.8%
Bahrain Banks
National Bank of Bahrain (NBB) 35.4%
Arab Banking Corporation (ABC) 17.5%
Kuwait Banks
National Bank of Kuwait (NBK) 15.7%
Commercial Bank of Kuwait (CBK) NA
Oman Banks
Bank Muscat SAOG 13.5%
National Bank of Oman 12.3%

11
FAB
StanChart
Lloyds
Barclays
HSBC
RBS
UBS
Credit Suisse
Deutsche Bank
ING
BNP
Credit Agricole SocGen Goldman Sachs
Morgan Stanley
Citigroup
BofA
JP Morgan
RBCScotia
BMOTDBank
Rabobank
SEB
Swedbank
Handelsbanken
Banque Cantonale
Nomura*
Sumitomo*
Mizuho*MUFG*
ANZ***
Commonwealth Bank**NAB***
Macquarie*
Westpac***
OCBC
UOB
DBS
ICBC
Bank of China
Ind. Bank of Korea
ICICI*
State Bank of India*
Bank of India*
ENBD
ADCB
UNB
MashreqQNB
Doha Bank
CBQ
Samba
NCB
Saudi Fransi
ABC
NBK
Natl Bank of Oman
Bank Muscat
8%
10%
12%
14%
16%
18%
20%
22%
24%
26%
28%
30%
AA+ AA AA- A+ A A- BBB+ BBB BBB-
Western banks
GCC Banks
Eastern banks
Tier 1 capital adequacy ratio vs Composite rating
Notes: * Please note that the financial ratios shown for FAB (First Abu Dhabi Bank) are the pro-forma numbers of the new merged entity as the merger between First Gulf Bank and
National Bank of Abu Dhabi is now complete and the merged entity - First Abu Dhabi Bank - is effective as from 1st April 2017; FAB’s ratios are as per Central Bank of UAE’s Basel II
guidelines; Banks in the above peer group have different financial year ending; FY ending other than 31-Dec-16 are highlighted with special characters: * for 31-Mar-16; ** for 30-Jun-16; &
*** for 30-Sep-16; We have taken the latest available annual ratios for comparison; Source: Bloomberg

12
Total capital adequacy ratio
Western Banks (FY 2016)
First Abu Dhabi Bank (FAB) * 16.6%
U.K. Banks
Royal Bank of Scotland (RBS) 22.9%
Lloyds Banking Group (Lloyds) 21.4%
Standard Chartered (StanChart) 21.3%
HSBC 20.1%
Barclays 19.6%
European Banks
Swedbank 31.8%
Svenska Handelsbanken 31.4%
Rabobank 25.0%
Skandinaviska Enskilda Banken (SEB) 24.8%
UBS AG 24.7%
Credit Suisse 20.5%
Credit Agricole 20.1%
ING Groep NV 19.3%
Societe Generale 17.9%
Deutsche Bank 17.4%
Banque Cantonale Vaudoise 16.9%
BNP Paribas 14.5%
North American Banks
Morgan Stanley 22.0%
Citigroup Inc 19.1%
Goldman Sachs 17.8%
JP Morgan Chase 16.4%
Bank of America 16.3%
Toronto-Dominion Bank (TDBank) 15.2%
Bank of Nova Scotia 14.6%
Royal Bank of Canada (RBC) 14.4%
Bank of Montreal (BMO) 13.6%
Eastern Banks (2016^)
First Abu Dhabi Bank (FAB) * 16.6%
Japanese Banks
Nomura Holdings* 20.0%
Sumitomo Mitsui Financial Group* 16.9%
Mizuho Financial Group Inc* 16.3%
Mitsubishi UFJ Financial Group Inc (MUFG)* 15.9%
Australian Banks
Australia & New Zealand Bank (ANZ)*** 14.3%
Commonwealth Bank of Australia** 14.2%
National Australia Bank (NAB)*** 14.1%
Macquarie Group* 13.3%
Westpac Banking Corp*** 13.1%
Other Asian Banks (ex Japan & Aus)
Oversea-Chinese Banking Corp (OCBC) 17.1%
United Overseas Bank (UOB) 16.2%
DBS Group 16.2%
Industrial & Commercial Bank of China
(ICBC)14.6%
Bank of China 14.3%
Export-Import Bank of China (EXIM China) NA
Industrial Bank of Korea 13.1%
Export-Import Bank of Korea (EXIM Korea) NA
ICICI Bank* 17.3%
State Bank of India* 13.0%
Bank of India* 12.6%
GCC Banks (FY 2016)
First Abu Dhabi Bank (FAB) * 16.6%
UAE Banks
Emirates NBD (ENBD) 21.2%
Abu Dhabi Commercial Bank (ADCB) 18.9%
Union National Bank (UNB) 18.9%
Mashreqbank 16.9%
Qatar Banks
Qatar National Bank (QNB) 16.0%
Doha Bank 15.6%
Commercial Bank of Qatar (CBQ) 15.2%
Saudi Banks
Samba Financial Group (Samba) 21.8%
National Commercial Bank (NCB) 19.2%
Banque Saudi Fransi 17.8%
Bahrain Banks
National Bank of Bahrain (NBB) 30.6%
Arab Banking Corporation (ABC) 19.1%
Kuwait Banks
National Bank of Kuwait (NBK) 17.7%
Commercial Bank of Kuwait (CBK) NA
Oman Banks
National Bank of Oman (NBOB) 17.4%
Bank Muscat SAOG (BKMB) 16.1%
Notes: Please note that the financial ratios shown for FAB (First Abu Dhabi Bank) are the pro-forma numbers of the new merged entity as the merger between First Gulf Bank and National
Bank of Abu Dhabi is now complete and the merged entity - First Abu Dhabi Bank - is effective as from 1st April 2017; FAB’s ratios are as per Central Bank of UAE’s Basel II guidelines;
^Banks in the Asian group have different financial year ending; FY ending other than 31-Dec-16 are highlighted with special characters: * for 31-Mar-16; ** for 30-Jun-16; & *** for 30-Sep-
16; We have taken the latest available annual ratios for comparison; Source: Bloomberg

13
FAB
StanChart Lloyds
Barclays
HSBC
RBS
UBS
Credit Suisse
Deutsche Bank
ING
BNP
Credit Agricole
SocGen Goldman Sachs
Morgan Stanley
Citigroup
BofAJP Morgan
RBC Scotia
BMO
TDBank
Rabobank
SEB
SwedbankHandelsbanken
Banque Cantonale
Nomura*
Sumitomo*
Mizuho*MUFG*
ANZ***
Commonwealth Bank** NAB***
Macquarie*Westpac***
OCBC
UOB DBS
ICBCBank of China
Ind. Bank of Korea
EXIM Korea
ICICI*
State Bank of India*
Bank of India*
ENBD
ADCBUNB
Mashreq
QNBDoha Bank
CBQ
Samba
NCB
Saudi Fransi
ABC
NBK Natl Bank of Oman
Bank Muscat
10%
12%
14%
16%
18%
20%
22%
24%
26%
28%
30%
32%
AA+ AA AA- A+ A A- BBB+ BBB BBB-
Western banks
GCC Banks
Eastern banks
Total capital adequacy ratio vs Composite rating
Notes: * Please note that the financial ratios shown for FAB (First Abu Dhabi Bank) are the pro-forma numbers of the new merged entity as the merger between First Gulf Bank and
National Bank of Abu Dhabi is now complete and the merged entity - First Abu Dhabi Bank - is effective as from 1st April 2017; FAB’s ratios are as per Central Bank of UAE’s Basel II
guidelines; Banks in the above peer group have different financial year ending; FY ending other than 31-Dec-16 are highlighted with special characters: * for 31-Mar-16; ** for 30-Jun-16; &
*** for 30-Sep-16; We have taken the latest available annual ratios for comparison; Source: Bloomberg

14
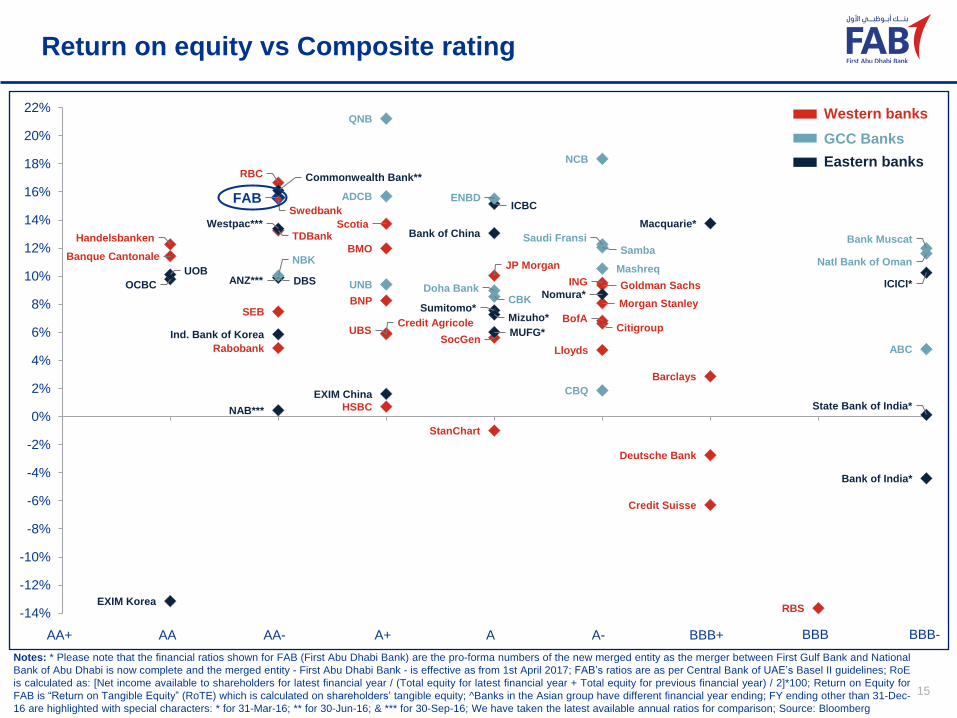
Return on equity
Western Banks (FY 2016)
First Abu Dhabi Bank (FAB) * 15.6%
U.K. Banks
Lloyds Banking Group (Lloyds) 4.7%
Barclays 2.9%
HSBC 0.7%
Standard Chartered (StanChart) -1.0%
Royal Bank of Scotland (RBS) -13.6%
European Banks
Swedbank 15.5%
Svenska Handelsbanken 12.3%
Banque Cantonale Vaudoise 11.4%
ING Groep NV 9.5%
BNP Paribas 8.3%
Skandinaviska Enskilda Banken (SEB) 7.5%
Credit Agricole 5.9%
UBS AG 5.9%
Societe Generale 5.6%
Rabobank 4.9%
Deutsche Bank -2.7%
Credit Suisse -6.3%
North American Banks
Royal Bank of Canada (RBC) 16.7%
Bank of Nova Scotia 13.7%
Toronto-Dominion Bank (TDBank) 13.3%
Bank of Montreal (BMO) 12.0%
JP Morgan Chase 10.0%
Goldman Sachs 9.4%
Morgan Stanley 8.1%
Bank of America 6.8%
Citigroup Inc 6.6%
Eastern Banks (2016^)
First Abu Dhabi Bank (FAB) * 15.6%
Japanese Banks
Nomura Holdings* 8.7%
Sumitomo Mitsui Financial Group* 7.6%
Mizuho Financial Group Inc* 7.3%
Mitsubishi UFJ Financial Group Inc (MUFG)* 6.0%
Australian Banks
Commonwealth Bank of Australia** 16.1%
Macquarie Group* 13.8%
Westpac Banking Corp*** 13.4%
Australia & New Zealand Bank (ANZ)*** 9.9%
National Australia Bank (NAB)*** 0.5%
Other Asian Banks (ex Japan & Aus)
United Overseas Bank (UOB) 10.1%
DBS Group 9.9%
Oversea-Chinese Banking Corp (OCBC) 9.8%
Industrial & Commercial Bank of China
(ICBC)15.2%
Bank of China 13.1%
Export-Import Bank of China (EXIM China) 1.6%
Industrial Bank of Korea 5.9%
Export-Import Bank of Korea (EXIM Korea) -13.1%
ICICI Bank* 10.3%
State Bank of India* 0.1%
Bank of India* -4.4%
GCC Banks (FY 2016)
First Abu Dhabi Bank (FAB) * 15.6%
UAE Banks
Abu Dhabi Commercial Bank (ADCB) 15.7%
Emirates NBD (ENBD) 15.5%
Mashreqbank 10.5%
Union National Bank (UNB) 9.4%
Qatar Banks
Qatar National Bank (QNB) 21.2%
Doha Bank 9.0%
Commercial Bank of Qatar (CBQ) 1.9%
Saudi Banks
National Commercial Bank (NCB) 18.4%
Banque Saudi Fransi 12.3%
Samba Financial Group 12.1%
Bahrain Banks
National Bank of Bahrain (NBB) 14.9%
Arab Banking Corporation (ABC) 4.8%
Kuwait Banks
National Bank of Kuwait (NBK) 10.0%
Commercial Bank of Kuwait (CBK) 8.6%
Oman Banks
Bank Muscat SAOG 12.0%
National Bank of Oman 11.6%
Notes: * Please note that the financial ratios shown for FAB (First Abu Dhabi Bank) are the pro-forma numbers of the new merged entity as the merger between First Gulf Bank and National
Bank of Abu Dhabi is now complete and the merged entity - First Abu Dhabi Bank - is effective as from 1st April 2017; FAB’s ratios are as per Central Bank of UAE’s Basel II guidelines; RoE
is calculated as: [Net income available to shareholders for latest financial year / (Total equity for latest financial year + Total equity for previous financial year) / 2]*100; Return on Equity for
FAB is “Return on Tangible Equity” (RoTE) which is calculated on shareholders’ tangible equity; ^Banks in the Asian group have different financial year ending; FY ending other than 31-Dec-
16 are highlighted with special characters: * for 31-Mar-16; ** for 30-Jun-16; & *** for 30-Sep-16; We have taken the latest available annual ratios for comparison; Source: Bloomberg
15
FAB
StanChart
Lloyds
Barclays
HSBC
RBS
UBS
Credit Suisse
Deutsche Bank
ING
BNP
Credit Agricole
SocGen
Goldman Sachs
Morgan Stanley
CitigroupBofA
JP Morgan
RBC
Scotia
BMO
TDBank
Rabobank
SEB
Swedbank
Handelsbanken
Banque Cantonale
Nomura*
Sumitomo*Mizuho*
MUFG*
ANZ***
Commonwealth Bank**
NAB***
Macquarie*Westpac***
OCBC
UOBDBS
ICBC
Bank of China
EXIM China
Ind. Bank of Korea
EXIM Korea
ICICI*
State Bank of India*
Bank of India*
ENBDADCB
UNB
Mashreq
QNB
Doha Bank
CBQ
Samba
NCB
Saudi Fransi
ABC
CBK
NBK Natl Bank of Oman
Bank Muscat
-14%
-12%
-10%
-8%
-6%
-4%
-2%
0%
2%
4%
6%
8%
10%
12%
14%
16%
18%
20%
22%
AA+ AA AA- A+ A A- BBB+ BBB BBB-
Western banks
GCC Banks
Eastern banks
Return on equity vs Composite rating
Notes: * Please note that the financial ratios shown for FAB (First Abu Dhabi Bank) are the pro-forma numbers of the new merged entity as the merger between First Gulf Bank and National
Bank of Abu Dhabi is now complete and the merged entity - First Abu Dhabi Bank - is effective as from 1st April 2017; FAB’s ratios are as per Central Bank of UAE’s Basel II guidelines; RoE
is calculated as: [Net income available to shareholders for latest financial year / (Total equity for latest financial year + Total equity for previous financial year) / 2]*100; Return on Equity for
FAB is “Return on Tangible Equity” (RoTE) which is calculated on shareholders’ tangible equity; ^Banks in the Asian group have different financial year ending; FY ending other than 31-Dec-
16 are highlighted with special characters: * for 31-Mar-16; ** for 30-Jun-16; & *** for 30-Sep-16; We have taken the latest available annual ratios for comparison; Source: Bloomberg

16
Return on assets
Western Banks (FY 2016)
First Abu Dhabi Bank (FAB) * 1.8%
U.K. Banks
Lloyds Banking Group (Lloyds) 0.3%
Barclays 0.2%
HSBC 0.1%
Standard Chartered (StanChart) -0.04%
Royal Bank of Scotland (RBS) -0.7%
European Banks
Swedbank 0.9%
Banque Cantonale Vaudoise 0.7%
Svenska Handelsbanken 0.6%
ING Groep NV 0.5%
Skandinaviska Enskilda Banken (SEB) 0.4%
BNP Paribas 0.4%
UBS AG 0.3%
Rabobank 0.3%
Societe Generale 0.3%
Credit Agricole 0.2%
Deutsche Bank -0.1%
Credit Suisse -0.3%
North American Banks
JP Morgan Chase 1.0%
Royal Bank of Canada (RBC) 0.9%
Goldman Sachs 0.9%
Citigroup Inc 0.8%
Bank of America 0.8%
Bank of Nova Scotia 0.8%
Toronto-Dominion Bank (TDBank) 0.8%
Morgan Stanley 0.7%
Bank of Montreal (BMO) 0.7%
Eastern Banks (2016^)
First Abu Dhabi Bank (FAB) * 1.8%
Japanese Banks
Nomura Holdings* 0.6%
Sumitomo Mitsui Financial Group* 0.4%
Mitsubishi UFJ Financial Group Inc (MUFG)* 0.3%
Mizuho Financial Group Inc* 0.3%
Australian Banks
Macquarie Group* 1.2%
Commonwealth Bank of Australia** 1.0%
Westpac Banking Corp*** 0.9%
Australia & New Zealand Bank (ANZ)*** 0.6%
National Australia Bank (NAB)*** 0.04%
Other Asian Banks (ex Japan & Aus)
United Overseas Bank (UOB) 0.9%
DBS Group 0.9%
Oversea-Chinese Banking Corp (OCBC) 0.9%
Industrial & Commercial Bank of China
(ICBC)1.2%
Bank of China 0.9%
Export-Import Bank of China (EXIM China) 0.2%
Industrial Bank of Korea 0.5%
Export-Import Bank of Korea (EXIM Korea) -1.7%
ICICI Bank* 1.1%
State Bank of India* 0.01%
Bank of India* -0.2%
GCC Banks (FY 2016)
First Abu Dhabi Bank (FAB) * 1.8%
UAE Banks
Abu Dhabi Commercial Bank (ADCB) 1.7%
Emirates NBD (ENBD) 1.7%
Mashreqbank 1.6%
Union National Bank (UNB) 1.5%
Qatar Banks
Qatar National Bank (QNB) 2.0%
Doha Bank 1.2%
Commercial Bank of Qatar (CBQ) 0.4%
Saudi Banks
Samba Financial Group 2.1%
National Commercial Bank (NCB) 2.1%
Banque Saudi Fransi 1.8%
Bahrain Banks
National Bank of Bahrain (NBB) 1.9%
Arab Banking Corporation (ABC) 0.6%
Kuwait Banks
National Bank of Kuwait (NBK) 1.2%
Commercial Bank of Kuwait (CBK) 1.2%
Oman Banks
National Bank of Oman 1.6%
Bank Muscat SAOG 1.5%
Notes: * Please note that the financial ratios shown for FAB (First Abu Dhabi Bank) are the pro-forma numbers of the new merged entity as the merger between First Gulf Bank and National
Bank of Abu Dhabi is now complete and the merged entity - First Abu Dhabi Bank - is effective as from 1st April 2017; FAB’s ratios are as per Central Bank of UAE’s Basel II guidelines;
Return on assets is calculated as: [Net income available to shareholders for latest financial year / (Total assets for latest financial year + Total assets for previous financial year) / 2]*100;
^Banks in the Asian group have different financial year ending; FY ending other than 31-Dec-16 are highlighted with special characters: * for 31-Mar-16; ** for 30-Jun-16; & *** for 30-Sep-16;
We have taken the latest available annual ratios for comparison; Source: Bloomberg

17
FAB
StanChart
LloydsBarclays
HSBC
RBS
UBS
Credit Suisse
Deutsche Bank
INGBNP
Credit AgricoleSocGen
Goldman Sachs
Morgan Stanley
CitigroupBofA
JP Morgan
RBCScotia
BMOTDBank
RabobankSEB
Swedbank
Handelsbanken
Banque Cantonale
Nomura*Sumitomo*
Mizuho*MUFG*
ANZ***
Commonwealth Bank**
NAB***
Macquarie*
Westpac***
OCBC
UOB
DBS
ICBC
Bank of China
EXIM China
Ind. Bank of Korea
EXIM Korea
ICICI*
State Bank of India*
Bank of India*
ENBDADCB
UNBMashreq
QNB
Doha Bank
CBQ
Samba
NCB
Saudi Fransi
ABC
CBKNBK
Natl Bank of Oman
Bank Muscat
-1.8%
-1.6%
-1.4%
-1.2%
-1.0%
-0.8%
-0.6%
-0.4%
-0.2%
0.0%
0.2%
0.4%
0.6%
0.8%
1.0%
1.2%
1.4%
1.6%
1.8%
2.0%
2.2%
2.4%
AA+ AA AA- A+ A A- BBB+ BBB BBB-
Western banks
GCC Banks
Eastern banks
Return on assets vs Composite rating
Notes: * Please note that the financial ratios shown for FAB (First Abu Dhabi Bank) are the pro-forma numbers of the new merged entity as the merger between First Gulf Bank and National
Bank of Abu Dhabi is now complete and the merged entity - First Abu Dhabi Bank - is effective as from 1st April 2017; FAB’s ratios are as per Central Bank of UAE’s Basel II guidelines;
Return on assets is calculated as: [Net income available to shareholders for latest financial year / (Total assets for latest financial year + Total assets for previous financial year) / 2]*100;
^Banks in the Asian group have different financial year ending; FY ending other than 31-Dec-16 are highlighted with special characters: * for 31-Mar-16; ** for 30-Jun-16; & *** for 30-Sep-16;
We have taken the latest available annual ratios for comparison; Source: Bloomberg

18
FAB has a strong international footprint
Country International footprint outside local operation
First Abu Dhabi Bank * UAE 19 countries
Union National Bank UAE 4 countries (Qatar, Kuwait, Egypt & China)
Abu Dhabi Commercial Bank UAE 4 countries (India, Jersey, UK & Singapore)
Emirates NBD UAE9 countries (Saudi Arabia, Qatar, UK, Singapore, China,
Jersey, India, Iran & Egypt)
Mashreqbank UAE11 countries (Bahrain, Egypt, Kuwait, Qatar, Hong Kong,
India, UK, US, Bangladesh, Nepal & Pakistan)
Banque Saudi FransiSaudi
ArabiaLocal presence only
Samba Financial GroupSaudi
Arabia4 countries (UK, UAE, Qatar, & Pakistan)
National Commercial BankSaudi
Arabia
5 countries (Bahrain, Beirut, Singapore, South Korea &
China)
Qatar National Bank Qatar
25 countries (Kuwait, Oman, UAE, Iran, Iraq, Jordan,
Lebanon, Syria, Yemen, Egypt, Libya, Mauritania, South
Sudan, Sudan, Togo, Tunisia, China, Indonesia, India,
Singapore, Vietnam, France, Switzerland, UK & Turkey)
Commercial Bank of Qatar Qatar 3 countries (Oma, UAE & Turkey)
Doha Bank Qatar
15 countries (Kuwait, UAE, India, Japan, China,
Singapore, South Korea, Australia, Turkey, UK, Germany,
Hong Kong, Canada, South Africa & Bangladesh)
National Bank of Kuwait Kuwait
14 countries (Bahrain, Egypt, Iraq, Jordan, Lebanon,
Saudi Arabia, UAE, France, Switzerland, Turkey, UK,
USA, China & Singapore)
Commercial Bank of Kuwait Kuwait Local presence only
Arab banking Corporation Bahrain
17 countries (Manama, Algeria, Brazil, Egypt, France,
Germany, Iran, Italy, Jordan, Libya, Russia, Singapore,
Sweden, Tunisia, Turkey, UK & US)
National Bank of Bahrain Bahrain 2 countries (UAE & Saudi Arabia)
Bank Muscat SOAG Oman 4 countries (Saudi Arabia, Kuwait, UAE & Singapore)
National Bank of Oman Oman 2 countries (UAE & Egypt)
FAB has one of the largest international
networks amongst the Middle East banks
and is also governed by some of the key
regulators around the world – including
PRA/FCA (U.K.), OCC (U.S.), APCR (France),
FINMA (Switzerland), HKMA (Hong Kong),
MAS (Singapore), & Bank Negara (Malaysia)
– in addition to the U.A.E. Central Bank.
UAE
Washington, D.C.
Sao Paulo
London
Paris Geneva
Libya Egypt
Sudan
Lebanon
Jordan
Oman
KuwaitBahrain
India
Malaysia
Singapore
Hong Kong
China
South KoreaQatar
Note: * FAB’s international footprint shows the combined international presence of National Bank of Abu Dhabi
& First Gulf Bank; International branches include representative offices; Source: Bank websites; Zawya

19
FAB – The safest name you can bank upon
Safest Banks in the Middle East: 2017
1. First Abu Dhabi Bank (UAE)
2. National Bank of Kuwait (Kuwait)
3. Qatar National Bank (Qatar)
4. Abu Dhabi Commercial Bank (UAE)
5. Union National Bank (UAE)
6. Al Hilal Bank (UAE)
7. Kuwait Finance House (Kuwait)
8. Qatar Islamic Bank (Qatar)
9. Abu Dhabi Islamic Banks (UAE)
10. Al Ahli Bank of Kuwait (Kuwait)
Based on its 2017 survey Global Finance Magazine has announced the following rankings for First Abu Dhabi Bank:
➢ Safest bank in the Middle East
➢ 4th safest bank in Emerging Markets
➢ 17th in the ranking of World's 50 safest commercial banks
➢ 31st in the World's 50 safest banks
Safest Banks in the EM: 2017
1. Korea Development Bank (South Korea)
2. Export-Import Bank of Korea (South Korea)
3. Industrial Bank of Korea (South Korea)
4. First Abu Dhabi Bank (UAE)
5. National Bank of Kuwait (Kuwait)
6. China Development Bank (China)
7. Agricultural Development Bank of China (China)
8. Export-Import Bank of China (China)
9. Qatar National Bank (Qatar)
10. Banco del Estado de Chile (Chile)
Source: Global Finance Magazine

20
Appendix
➢ As mentioned at the start of this report, we have used “composite ratings” for this analysis – i.e. the average
of the ratings assigned by three leading rating agencies Moody’s, S&P and Fitch – in order to provide a more
representative view of the credit strength of each bank.
➢ The composite rating is calculated as follows:
▪ A score is assigned to the rating from each rating agency: AAA or equivalent being the best with a score
of “1”, followed by AA+ or equivalent as “2”, AA or equivalent as “3”, AA- or equivalent as “4” and so on;
▪ For example FAB is rated Aa3/AA-/AA- by Moody’s/S&P/Fitch. So the scores are 4/4/4;
▪ Hence the average of the scores is “4” which indicates a composite rating of “AA-” for FAB;
▪ In case the average score is not an absolute number – e.g. 4.33 (average of 4, 5, & 4 ) – the final score
is derived by rounding off the average score to the nearest whole number. In this case “4”.

Thank You
Contact:
Chavan Bhogaita / Rakesh Sahu
Market Insights & Strategy
Global Markets
First Abu Dhabi Bank
Tel: +971 2 6110 127
Market Insights & Strategy, FAB Global Markets
Please click here to view our recent publications
on MENA and Global Markets
Top Related