


Languages
Pages
Legal


8/3/2019 Final 2nd Sam Project Report
http://slidepdf.com/reader/full/final-2nd-sam-project-report 1/82
THE PROJECT REPORTON
PERCEPTION OF PEOPLE ABOUT MUTUAL
FUND
(Submitted in the partial fulfillment for thedegree of
Master of Business Administration)
PUNJAB TECHNICAL UNIVERSITY, JALANDHER
Session 2010-2012
Submitted To:Submitted By:
Mr. DEEPAK SOOD GurkiratSingh Tiwana
ROLL.NO.105042249860

8/3/2019 Final 2nd Sam Project Report
http://slidepdf.com/reader/full/final-2nd-sam-project-report 2/82
RIMT COLLEGE, MANDI GOBINDGARH
2

8/3/2019 Final 2nd Sam Project Report
http://slidepdf.com/reader/full/final-2nd-sam-project-report 3/82
ACKNOWLEDGEMENT
I am really happy and exited in representing this summer trainingproject report before you.
I must express my gratitude towards KARVY SECURITIES LTD for
giving mean opportunity to work with on this report.
And of course I am very much thankful to our honorable Prof. Sunil
(PROJECT GUIDE) for giving me opportunity and his guidance helpsme throughout preparing this report. He has also me valuablesuggestions and excellence guidance about this training, which
proved very helpful to me to utilize my theoretical knowledge inpractical field.
At last I am also thankful to my friends, to all known and unknownindividuals who have given me their constructive advice, educative
suggestions, encouragement, co-operation and motivation to
prepare this report.
3

8/3/2019 Final 2nd Sam Project Report
http://slidepdf.com/reader/full/final-2nd-sam-project-report 4/82
INTRODUCTION COMPANY DETAILS
Background
Karvy Consultant limited was established in 1982 at Hyderabad. Itwas established by group of Hyderabad- based practicing
chartered accountants. At initial stage it was very small in size. Itwas started with capital of 1, 50,000.
In starting it was only offering auditing and taxation services.
Later it acts into the registrar and share transfer activities andsubsequently into financial services and other services like
financial product distribution, investment advisory services,corporate finance, insurance etc.
All along, Karvy’s strong work ethics and professional background
leveraged with information technology enabled it to deliverquality to the individual. A decade of commitment, professional
integrity and vision helped Karvy achieving a leadership positionin its field when it handled largest number of corporate and retailthat proved to be a sound business synergy.
Today, Karvy has access to millions of Indian shareholders,
besides companies, banks, financial institutions and regulatoryagencies. Over the past one and half decades, Karvy has evolvedas a veritable link between industry, finance and people.
In January 1998, Karvy became first depository participant in
Andhra Pradesh. An ISO 9002 company, Karvy’s commitment toquality and retail reach has made it an integrated FinancialServices company.
Today, Company has230 branch offices in 164 cities all over the
India The Company adds 5 new offices every year to thecompanies ever growing nation network in every nook and cornerof the country. The company services over 16 million individualinvestors, 180corporate and handles corporate disbursement that
exceeds Rs.2500 Cores.
4
8/3/2019 Final 2nd Sam Project Report
http://slidepdf.com/reader/full/final-2nd-sam-project-report 5/82
WHERE KARVY STAND IN THE MARKET?
Karvy is a legendary name in financial services, Karvy’s credit is
defined by its mission to succeed, passion for professionalism,
excellent work ethics and customer centric values. Today Karvy is well known as a premier financial services
enterprise, offering a broad spectrum of customized services toits clients, both corporate and retail. Services that Karvy
constantly upgrade and improve are because of company’s skillin leveraging technology. Being one of the most tecno-savyorganizations around helps company to deliver even more cost
effective financial solution in the shortest possible time.
What bears sample testimony to Karvy’s success is the faith
response in company by valued investor and customers, allacross the country. Indeed with Karvy wide network touchingevery corner of the country. Even the most remote investor can
easily access Karvy’s services and benefit from company’s expertadvice.
5

8/3/2019 Final 2nd Sam Project Report
http://slidepdf.com/reader/full/final-2nd-sam-project-report 6/82
MISSION STATEMENT OF “KARVY
An organization exists to accomplish something or achieve
something. The mission statement indicates what an organization
wants to achieve. The mission statement may be changedperiodically to take advantage of new opportunities or respond tonew market conditions.
Karvy’s mission statement is “To bring Industry, Finance and
people together”.
Karvy is work as intermediary between industry and people.Karvy work as investment advisor and helps people to invest their
money same way Karvy helps industry in achieving finance frompeople by issuing shares, debentures, bonds, mutual funds, fixed
deposits etc.
Company’s mission statement is clear and thoughtful which guidegeographically dispersed employees to work independently yet
collectively towards achieving the organization goals.
VISION OF KARVY
Company’s vision is crystal clear and mind frame very directed.“To be pioneering financial services company. Andcontinue to grow at healthy pace, year after year, decadeafter decade. “Company’s foray into IT-enabled services and
internet business has provided an opportunity to explore newfrontiers and business solutions. To build a corporate that sets
benchmarks for others to follow.
6
8/3/2019 Final 2nd Sam Project Report
http://slidepdf.com/reader/full/final-2nd-sam-project-report 7/82
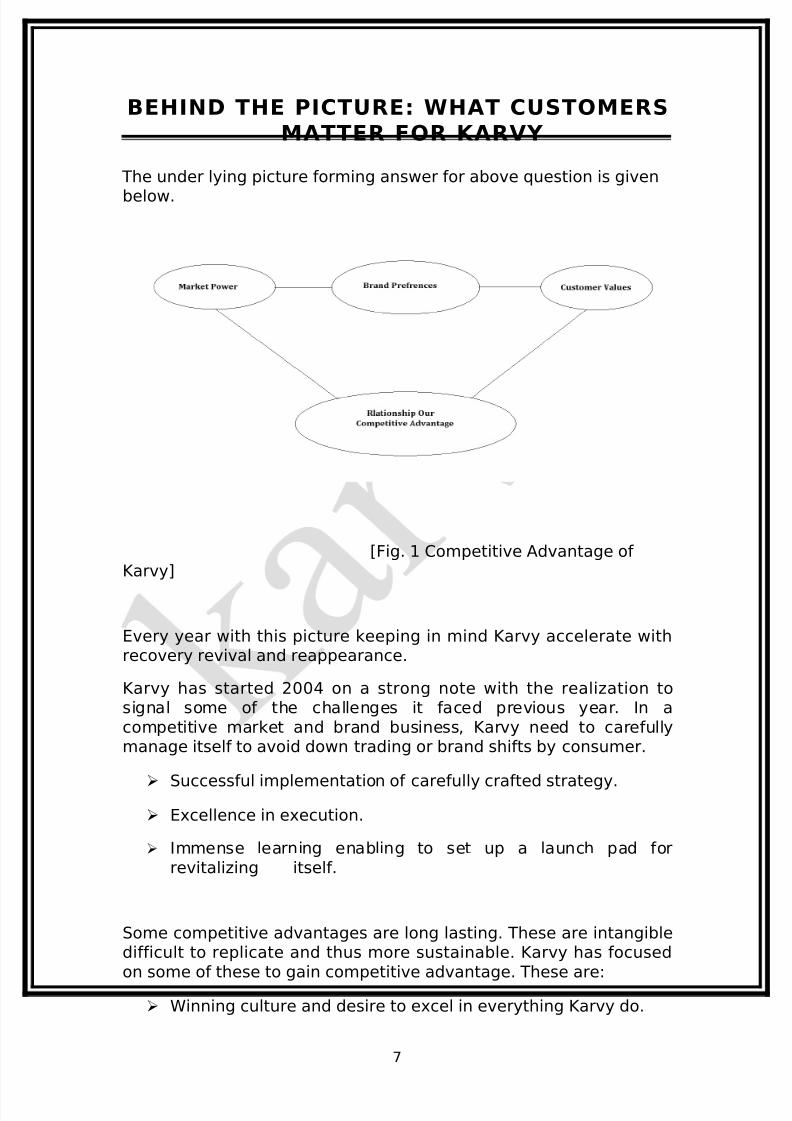
BEHIND THE PICTURE: WHAT CUSTOMERSMATTER FOR KARVY
The under lying picture forming answer for above question is given
below.
[Fig. 1 Competitive Advantage of
Karvy]
Every year with this picture keeping in mind Karvy accelerate withrecovery revival and reappearance.
Karvy has started 2004 on a strong note with the realization tosignal some of the challenges it faced previous year. In a
competitive market and brand business, Karvy need to carefullymanage itself to avoid down trading or brand shifts by consumer.
Successful implementation of carefully crafted strategy.
Excellence in execution.
Immense learning enabling to set up a launch pad for
revitalizing itself.
Some competitive advantages are long lasting. These are intangibledifficult to replicate and thus more sustainable. Karvy has focused
on some of these to gain competitive advantage. These are:
Winning culture and desire to excel in everything Karvy do.
7

8/3/2019 Final 2nd Sam Project Report
http://slidepdf.com/reader/full/final-2nd-sam-project-report 8/82
Strong meaningful relationship with customers along withstrategic partners in which Karvy operate and above all, its
own staff.
Karvy value and carefully nature relationships with customers. Karvy
truly believe that more than technological powers and businessprocess innovations, it focuses on relationship which has been thecorner stone of satisfying and successful in India over many years.
This has been possible with deep insight of consumer behavior aswell as market demand drivers, understanding of the arena whereto operate and quality execution-all thanks to a greater team that
makes this happen.
Karvy’s customers consider themself part of Karvy family and share
their experiences and dreams with other customers and thus Karvy
become successful not only in relating customers but also gains newcustomers from satisfied prevailing customers.
Karvy want to create a strong emotional bond with new customerspromoted by prevailing customers.
8

8/3/2019 Final 2nd Sam Project Report
http://slidepdf.com/reader/full/final-2nd-sam-project-report 9/82
KARVY VALUES
Integrity
Responsibility
Reliability
Unity
Understanding
Excellence
Confidential
Karvy has adequate internal control system and procedurecommensurate with the size nature of its business. These system
and procedures provide reasonable assurance of maintenance of proper accounting records, reliability of financial information,
protection of resources and safe guarding of assets againstunauthorized use.
9

8/3/2019 Final 2nd Sam Project Report
http://slidepdf.com/reader/full/final-2nd-sam-project-report 10/82
KARVY SERVICES- AN OVERVIEW
1. Stock broking
2. DE mat services
3. Investment product distribution
4. Investment advisory services
5. Corporate finance and merchant banking
6. Insurance
7. Mutual funds services
8. IT enabled services
9. Registrar and transfer agents
10. Loans
1. Stock broking:
Karvy is working as capital market intermediaries. Stock brokers are
regulated by SEBI [Stock brokers and sub brokers] regulations,
1992. The stock broker is a member of stock exchange. Stockbrokers are the intermediaries who are allowed to trade in securitieson the exchange of which they are members. They buy and sell ontheir own behalf of their clients.
Stock brokers expand their business by engaging sub broker. Subbrokers mean ” any person not being a member of stock exchangewho acts on behalf of stock brokers as an agent or otherwise for
assisting the investor in buying”.
2. Demat services
Karvy is depositary participant with the national securities
depository limited (NSDL) for trading and settlement of dematerialized shares.
Depository participants (DPs) are described as an agent of depository. They are intermediaries between the depository andthe investor. The relationship between the DPs and the depository is
governed by an agreement made between the two underdepositories act.
A DP can offer depository related services only after obtaining acertificate of registration from SEBI.
10
8/3/2019 Final 2nd Sam Project Report
http://slidepdf.com/reader/full/final-2nd-sam-project-report 11/82
Since karvy is also in broking business, investors who use karvy’sdepository services get a dual benefit. They can use karvy’s
brokerage services to execute transactions and karvy’s depositoryservices to settle them.
3.INVESTMENT PRODUCT DISTRIBUTION
Company is also concern with the distribution of investment
products like
a) Fixed deposits
b) Bonds
c) IPO
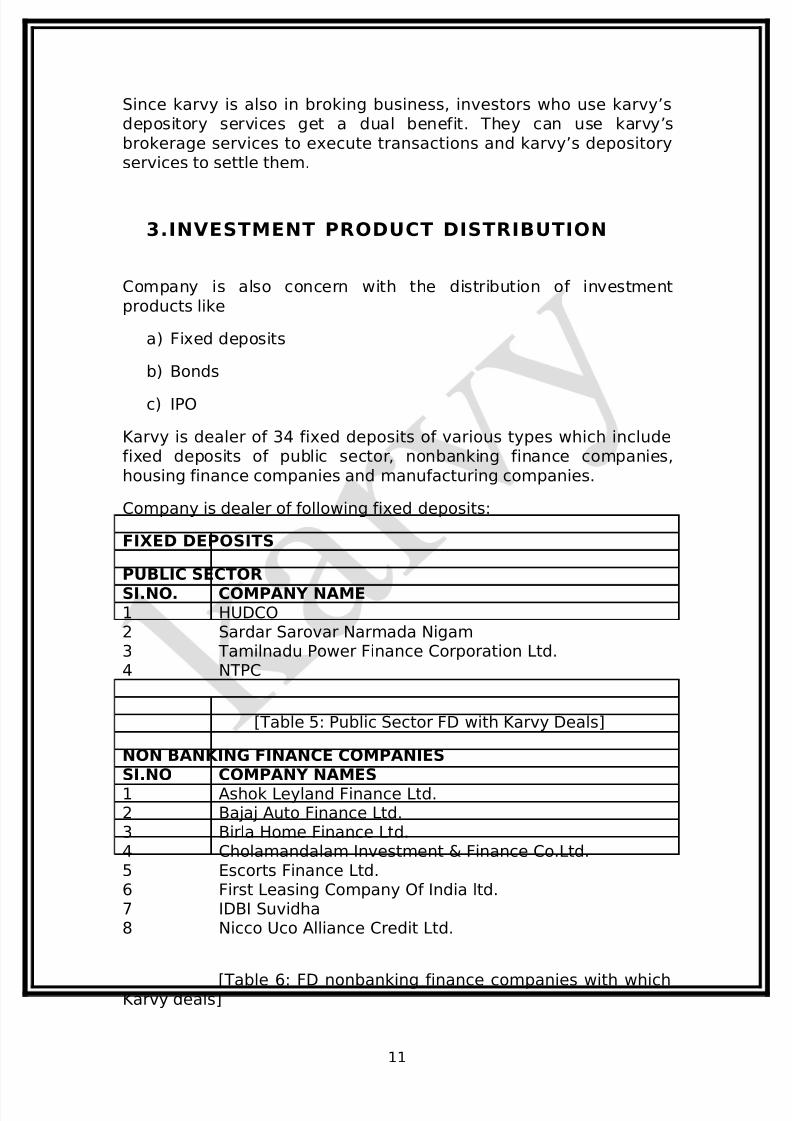
Karvy is dealer of 34 fixed deposits of various types which includefixed deposits of public sector, nonbanking finance companies,
housing finance companies and manufacturing companies.
Company is dealer of following fixed deposits:
FIXED DEPOSITS
PUBLIC SECTOR
SI.NO. COMPANY NAME1 HUDCO2 Sardar Sarovar Narmada Nigam3 Tamilnadu Power Finance Corporation Ltd.4 NTPC
[Table 5: Public Sector FD with Karvy Deals]
NON BANKING FINANCE COMPANIESSI.NO COMPANY NAMES1 Ashok Leyland Finance Ltd.2 Bajaj Auto Finance Ltd.3 Birla Home Finance Ltd.4 Cholamandalam Investment & Finance Co.Ltd.5 Escorts Finance Ltd.6 First Leasing Company Of India ltd.7 IDBI Suvidha8 Nicco Uco Alliance Credit Ltd.
[Table 6: FD nonbanking finance companies with whichKarvy deals]
11

8/3/2019 Final 2nd Sam Project Report
http://slidepdf.com/reader/full/final-2nd-sam-project-report 12/82
HOUSING FINANCE COMPANIESSI.NO COMPANY NAMES1 CAN Fin Homes LTD.2 Dewan Housing Finance Corporation Ltd.3 Gruh Finance Ltd.
4 HDFC Ltd.5 PNB Housing Finance Ltd.6 Sundaram Home Finance Ltd.
[Table 7: FD Housing Finance Companies with Which Karvy Deals]
MANUFACTURING COMPANIESSI.NO COMPANY NAMES1 AP Paper Mills Ltd.2 Amtek India Ltd.3 Ballarpur Industries Ltd.4 Chambal fertilizers& Chemicals Ltd.5 Escorts Ltd.6 Greaves Ltd.7 Gujarat Alkalis & Chemicals Ltd.8 Indian Express9 Indi-Swift Ltd.10 JK Industries Ltd.11 Jindal Steel & Power Ltd.12 Sound Craft Industries ltd.
13 Atul Ltd.14 Supreme Industries Ltd.15 Zauri Industries Ltd.
[Table 8: FD of Manufacturing Companies with Which KarvyDeals]
BONDS:
Karvy is dealer of following bonds
RBI Saving Bonds
NHB
REC
IPO:
12

8/3/2019 Final 2nd Sam Project Report
http://slidepdf.com/reader/full/final-2nd-sam-project-report 13/82
Company is also provides services related to initial public offer of company. Company provides stationary at the time of IPO as well
as provides information to investor regards IPO and solve theirquarries.
INVESTMENT ADVISORY SERVICES
This division provides portfolio management services to high net-worth individuals and corporate. The expertise of Karvy in
research and stock brocking gives it the right perspective toprovide investment advisory services. Company provides
advisory services to its clients. Financial goal of each individualvaries according to his dream, ambition and family size andfuture financial planning for the children &old age pension for
their self and wife so does the path way to achieve it .Karvy applythe principles of financial planning as both science and art, it
understand the time horizon, risk bearing capacity andinvestment goals of investor to plan their entire life up to
retirement, taxes, insurance needs and other important personalfinancial goals. It design portfolio for investor to invest theirsaving in various financial products like shares, bonds,
debentures, mutual funds, fixed deposits, insurance etc.,company design portfolios by following factors.
Investors requirement of getting money back, Investors willingness to take risk,
Investors tax planning etc.
4. Corporate Finance &Merchant Banking
Corporate finance is the financial activity of corporation. It deals
with the firms operations with regard to investing and financing. It
concerned with how firms raise capital and the consequences of alternative methods of raising capital. Firm’s capital can be raisedby raising loans, issuing shares, and acquiring and merging with
other businesses by public or private companies.
Merchant banking is a financial intermediation that matches entitiesthat need capital and those that have capital. Hence they facilitate
the flow of capital in the market.
Karvy enjoy’s SEBI category (I) authorization for merchant banking.Karvy offers the full spectrum of merchant banking services,
beginning from identifying the best time for an issue to final stageof marketing it, to harvest unparalleled success.
13

8/3/2019 Final 2nd Sam Project Report
http://slidepdf.com/reader/full/final-2nd-sam-project-report 14/82
As a merchant banker Karvy offers following services:
Issue management
Instrument designing
Pricing of the issue
Registration process for the issue of shares
Marketing efforts
Final allotment to investors
Listing details on stock exchanges
Loan syndication
Lease financing
Corporative advisory services
Under writing
Portfolio management
5. Insurance:Karvy is also dealer of many private life insurance companies. At
Jamnagar branch, company is associated with dealing of followingcompanies.
ICICI Prudential Life Insurance
HDFC Life Insurance
TATA AIG Insurance
6. Mutual fund Services:
Since its inception in 1982, Karvy has demonstrated a dedicationcoupled with dynamism that has inspired trust from varioussegments- corporate, government bodies and individuals. Karvy has
since been preforming a pivotal role as intermediary- the interface-between these players.
With mutual funds emerging as distinct asset class, Karvy has made
a strategic choice to leverage the power of latest technology to
14

8/3/2019 Final 2nd Sam Project Report
http://slidepdf.com/reader/full/final-2nd-sam-project-report 15/82
provide a cutting edge to its services. Karvy, today, services nearly80% of the asset management companies (AMCs) across an
extensive network of services centers with assets under services inexcess of Rs. 10,000 crores.
Karvy’s ability to mass customize and offer a diverse range of product for a diverse range of customers has helped mutual fundcompanies to uniquely position themselves in the market place.
These diverse range of services cut across multiple deliverychannels- service centers, web, mobile phones, call center- has
brought home the benefits of technology to investors, distributors,and the mutual funds.
Going forward Karvy shall strive to create new products and
services, which would address the needs of end customer.Company’s single minded focus on delivering products forcustomers has given it the distinguished position of being the
preferred provider of financial services in the country.
List of mutual funds clients of Karvy:
1 Alliance Mutual Fund2 Birla Mutual Fund3 Bank of Baroda Mutual Fund
4 Can Bank Mutual Fund5 Chola Mutual Fund6 Duetsche Mutual Fund7 DSP Merrill Lynch Mutual Fund8 Franklin Templeton Investment9 GIC Mutual Fund10 HDFC Mutual Fund11 HSBC Mutual Fund12 IL & FS Mutual Fund13 JM Mutual fund14 Kotak Mutual Fund15 LIC Mutual Fund16 Punjab National Bank Mutual Fund17 Prudential ICICI Mutual Fund18 Principal Mutual Fund19 Reliance Mutual Fund20 State Bank Of India Mutual Fund21 Standard Chartered Mutual Fund22 Sundaram Mutual Fund23 SUN F&C Mutual Fund24 Tata Mutual Fund
15

8/3/2019 Final 2nd Sam Project Report
http://slidepdf.com/reader/full/final-2nd-sam-project-report 16/82
[Table 9: List of MF companies with which karvy deals]
7. Income Tax enabled services:
Karvy has started these services since March, 2004. Karvy is work
as TIN Facilitation center it provides following IT enabled services.
a) Distribution of PAN card
b) Distribution of TAN card
c) Services related to e-TDS.
Karvy work as intermediary between NSDL and IT payers. Karvyprovides various form for different IT enabled services and guide
people to fill that forms. It also solves queries of tax payers. It alsodistributes PAN and TAN card to tax payers.
TIN OVERVIEW
National securities depository Ltd. (NSDL) has established
nationwide tax information network (TIN) on behalf of income taxdepartment (ITD). This is designed to make the tax administrationmore effective, furnishing of returns convenient, reduce compliance
cost and bring greater transparency.
While NSDL primary agency responsible for design, implementationand maintenance of TIN as per the requirements of ITD, otheragencies will also play key roles in the TIN system.
Karvy has established infrastructure required to provide IT enabled
services so, Karvy provides TIN facilitation centers all over India onbehalf of NSDL.besides Karvy following companies can also work asintermediary between NSDL and customers.
Alan kit assignments Ltd.
Integrated Enterprise Ltd.
Shell Tran Source Ltd.
16

8/3/2019 Final 2nd Sam Project Report
http://slidepdf.com/reader/full/final-2nd-sam-project-report 17/82
[Fig 2: TIN system]
The banking system, being the agency that collects the money onbehalf of the ITD against tax obligations from the tax payers will belinked to the TIN central system to provide accounting information
on tax paid by various entities under various heads. As banks is
relatively technology to the TIN central system enabling online taxaccounting.
On the other hand, the entities depositing the tax (deductor) varysubstantially with respect to their computer skills and hence TIN
design provides for TIN facilitation centers managed by NSDL tohelp digitization and upload of tax payment related information to
the TIN central system.
Besides NSDL, UTI an investor service Ltd. May also provides itENABLED SERVICES.
17

8/3/2019 Final 2nd Sam Project Report
http://slidepdf.com/reader/full/final-2nd-sam-project-report 18/82
8. Registrars & Transfer agents:
In 1985, Karvy entered the registrar and share transfer business to
create a market niche in competitive field of financial services. In1994-95, it reached a milestone when it processed 104 public issues
constituting 46% market share. Now its second decade of existence,Karvy is the leader in the industry: in an opinion poll conducted byan independent market research agency-MARG, Karvy has been
rated as India’s most admired registrar on various parameters:-
Overall Excellence
Handling of volumes
Timely Dispatch
Quality management and technological up gradation.
A SEBI category 1 registrar, so far, Karvy has handled over 675issues as registrar to public issues processed over 52 millionapplications and is servicing over 16 million investors from various
locations spread over205 clients.
9.Loan:
Karvy has recently started his services at selected branches of metro cities. This service has not been started in saurashtra- kucch
region. Karvy provides loans for following.
Vehicle loan
Home loan
Personal loan
18

8/3/2019 Final 2nd Sam Project Report
http://slidepdf.com/reader/full/final-2nd-sam-project-report 19/82
MARKETING STRATEGY OF KARVY
Market poisoning:
Market positioning statements of Karvy are “At karvy we give you
single window service” we also ensure your comfort.
So, Karvy focus on the consumers who prefer almost all investmentactivities at same place by providing number of various financial
services. At Karvy a person can purchase or sell shares, debenturesetc. at same place also demat it. Karvy also provide other
investment options to the same person at same place like mutualfund, insurance, fixed deposits, bonds etc. Help the person indesigning his portfolio. By this way Karvy comfort to its consumers.
Karvy is also positioned according to rise and trout. Karvy ispromoted as a no. 1 investment product distributor and R&T agentof India.
Target Marketing:
Karvy uses demographic segmentation strategy and segmentpeople based on their occupation. Karvy uses selective
specialization strategy for market targeting. Target person for theKarvy stock broking and Karvy investment services are persons who
can work as sub-brokers for the company. Companies focus onadvisors of insurance and post office, Tax consultants and CAs for
making sub- brokers.
Marketing channel system:
Karvy uses one level marketing channel for investment product
distribution. Sub-brokers work as intermediary between consumerand company. Company has both forward and backward flow of
activity through channel. Company distribute stationary, brokerage,and information forward to its sub-brokers send filled forms, queries,amount of investment etc. back to company.
Training channel members:
Karvy provide the training to the sub-brokers because they will beviewed as the company by the investors. The executive of karvy
explain various new schemes of investment to the sub-brokers with
its objective, risk factor and expected return. Company alsoperiodically arrange seminar to guide sub-brokers.
19

8/3/2019 Final 2nd Sam Project Report
http://slidepdf.com/reader/full/final-2nd-sam-project-report 20/82
Advertising and promotion:
The objective of advertising of Karvy is to create awareness about
services of Karvy among investors and sub-brokers and increasesub-brokers of karvy.
Company doesn’t give advertisement in media like TV, Newspaper,and Magazines etc. Karvy’s advertisement is made indirectly by the
companies associate with it. Karvy is R&T agent of around 700companies. They publish name, address and logo of karvy on their
annual report.
Karvy also publish its weekly stock market newsletter “karvybazaar” baatein’ and monthly magazine” the fin polis” to guide
investors and sub-brokers about market.
20

8/3/2019 Final 2nd Sam Project Report
http://slidepdf.com/reader/full/final-2nd-sam-project-report 21/82
HR POLICY OF KARVY
Recruitment and Selection Policy: The upper level members like zonal managers, regional members,branch managers and senior executives are recruited by publishing
recruitment advertisement in leading national level newspaper. Thequalified applicant are then called for interview and selected.
The regional manager has authority to select lower level employeelike peon, marketing executives, accountant etc. by approval of zonal manager.
Training and Development:
Continuous training and upgrading technical, behavioral andmanagerial skills is a way of life in Karvy. Karvy encouragesemployees to hone their skills regularly to enable them to face the
challenges of the changing requirements of customers that fitmarket up and down.
Training needs analysis is done on a regular basis and systematic
methodologies are ensured that skills and capabilities of allemployees are constantly upgraded to enable them to perform in
the challenging work environment.
New employee has given training under experienced employee. Thenew employee work under experience employee and observe his all
activities. When company employs new technology or there is anychance in the working of the company the training program is
arranged.
21

8/3/2019 Final 2nd Sam Project Report
http://slidepdf.com/reader/full/final-2nd-sam-project-report 22/82
HR POLICY OF KARVY
[Fig 4 Branch level structure of Karvy]
22

8/3/2019 Final 2nd Sam Project Report
http://slidepdf.com/reader/full/final-2nd-sam-project-report 23/82
Quality Policy of Karvy:
To achieve and retain leadership, Karvy shall aim for complete
customer satisfaction, by combining its human and technologicalresources, to provide superior quality financial services. In theprocess, Karvy will strive to exceed customer’s expectations.
Quality Objectives of Karvy:
Build in- hours processes that will ensure transparent
and harmonious relationship with its clients andinvestors to provide high quality of services.
Establish a partner relationship with its investor servicesand agents and vendors that will help in keeping up its
commitment to the customers.
Provide high quality of work life for all its employees and
equip them with adequate knowledge and skills so as torespond to customers needs.
Continue to uphold the value of honesty and integrityand strive to establish unparalleled standards in
business ethics.
Use state-of-the art information technology indeveloping new and innovative financial products and
services to meet the changing needs of investors andclients.
Strive to be a reliable source of value added financial
product and services aand constantly guide theindividuals and institutions in making a judious choice of
same.
Strive to keep all the stake holders ( shareholders,
clients, investors, employ, suppliers, and regulatoryauthorities) proud and satisfied.
23

8/3/2019 Final 2nd Sam Project Report
http://slidepdf.com/reader/full/final-2nd-sam-project-report 24/82
Achievements of Karvy:
Largest mobilizer of funds as per PRIME DATABASE
First ISO – 9002 certified registrar in india
A category- 1Registrar to public issues
A category- 1 Merchant Banker
Ranked as “The most admired registrar” by MARG
Handled the largest – ever public issues – IDBI
Strategic tie-up with jardine fleming India securities Ltd.
Handled over 500 public issues as registrars
Handling the reliance account which accounts for nearly 10
million account holders
First depository participant from Andhra Pradesh
24

8/3/2019 Final 2nd Sam Project Report
http://slidepdf.com/reader/full/final-2nd-sam-project-report 25/82
SWOT ANALYSIS OF KARVY Strengths:
Employees are highly empowered.
Strong communication network.
Good co-operation between employees.
Number 1 registrar andtransfer agent in India
Number 1 dealer of investment products in india.
Weaknesses:
High employee turnover.
Opportunity:
Growth rate of mutual fund industry is 40 to 50% during lastyear and it expected that this rate will be maintained in future
also.
Marketing at rural and semi-urban areas.
Threats:
Increasing number of local players.
Past image of mutual fund.
25

8/3/2019 Final 2nd Sam Project Report
http://slidepdf.com/reader/full/final-2nd-sam-project-report 26/82
1.1 GENERAL INTRODUCTION
Mutual fund is a pool of funds which is divided into units of equalvalue and sold to investing public and the funds so collected are
utilized for collective investments in various capitals and money
market instrument. In today’s market people invest money to gain
more. So when they take into account, they mostly look out for
Investment Company where they can get more income.
Investment companies can be classified into closed-end and open-
end investment companies. Closed-end is when it is readily
transferable in the market. Open-end funds sell their own shares to
investors and ready to buy back their old shares. If we talk about
the investment options today, in India we have so many investment
companies like UTI, LIC etc, all have their own special ways of
servicing the customers. The investors also feel that they are worth
to be the part of that company. These days’ people mainly look for
avoiding tax so normally they look out for some investments which
can help them in doing so. When it comes to this point of view,
people mainly look out for mutual fund.
Mutual fund is a trust at law; it is a special type of managed, pooled
portfolio financial company or financial service organization that
sells shares/units/stocks in itself, to the public to obtain its resources
and it invests the savings so mobilized or pooled in a large,
diversified, & sound portfolio of equity shares, bonds, money market
instruments etc., Redeemable trust certificates are sold to investors
at net asset value (NAV) plus a small commission. All
interest/dividend and principal repayments are distributed to the
holders of the certificates.
26
8/3/2019 Final 2nd Sam Project Report
http://slidepdf.com/reader/full/final-2nd-sam-project-report 27/82
1.2 THEORETICAL BACKGROUND
Meaning of Mutual Funds
Mutual fund is a pool of funds which is divided into units of equal
value and sold to investing public and the funds so collected are
utilized for collective investment in various capital and money
market instrument. Investment is a commitment of a person’s funds
to derive future income in the form of interest, dividends, rent,
premiums, pension benefits or the appreciation of the value of their
principal capital. Investments have a return but there can be no
return without risk.
Definitions
Different persons in different words have defined mutual fund.
The SEBI (MF) Regulations, 1993 defines mutual fund as “A fund
established in the form of a trust by a sponsor to raise money by the
trustees through the sale of units to the public under one or more
schemes for investing in securities in accordance with these
regulations.”
Investment is the allocation of monetary resources to assets
that are expected to yield some gain or positive return over a given
period of time. These assets range from safe investments to risky
investments. Investments in this form are also called ‘Financial
Investments’.
27

8/3/2019 Final 2nd Sam Project Report
http://slidepdf.com/reader/full/final-2nd-sam-project-report 28/82
Characteristics of MF
A mutual fund actually belongs to the investors who have
pooled their funds. The ownership of the MF is in the hands of
the investors.
A MF is managed by investment professionals and other
service providers, who earn a fee for their services from the
fund.
The pool of funds is invested in a portfolio of marketable
investment. The value of the portfolio is updated every day.
The investor’s share in the fund is denominated by units. The
value of the units changes with change in the portfolio’s value,
every day. The value of one unit of investment is called as the
net assets value or NAV.
The investment portfolio of the Mutual fund is vested
according to the stated Investment objectives of the fund.
Investment Company
A company or trust that uses its capital to invest in other
companies. There are two principal types – closed-ended and the
open-ended. Shares in closed-ended investment companies, some
of which are listed on the New York Stock Exchange are readily
transferable in the open market and are bought and sold like other
shares.
28

8/3/2019 Final 2nd Sam Project Report
http://slidepdf.com/reader/full/final-2nd-sam-project-report 29/82
Open-ended funds sell their own shares to investors, stand ready to
buy back their old shares and are not listed. These funds are so
called because their capitalization is not fixed; they issue more
shares as people want them.
Fig.1.1 Concept of Mutual Fund Industry
When an investor subscribes for the units of a mutual fund, hebecomes part owner of the assets of the fund in the same
29

8/3/2019 Final 2nd Sam Project Report
http://slidepdf.com/reader/full/final-2nd-sam-project-report 30/82
proportion as his contribution amount put up with the corpus (thetotal amount of the fund). Mutual Fund investor is also known as a
mutual fund shareholder or a unit holder. Any change in the value of the investments made into capital market instruments (such as
shares, debentures etc) is reflected in the Net Asset Value (NAV) of
the scheme. NAV is defined as the market value of the Mutual Fundscheme's assets net of its liabilities. NAV of a scheme is calculated
by dividing the market value of scheme's assets by the total numberof units issued to the investors.
CONSTITUENTS OF MUTUAL FUND
There are many entities involved and the diagram below illus
trates the constitution of a mutual fund:
Fig.1.2 Constituents of Mutual Fund Industry
30

8/3/2019 Final 2nd Sam Project Report
http://slidepdf.com/reader/full/final-2nd-sam-project-report 31/82
Formation process starts from sponsor {the investment advisor or
manager}. Sponsor selects & appoints the Board of Trustees.
Trustees again hire or contract a separate AMC that is run by
professional managers. The AMC conducts the necessary research &
based on it, manages the fund or portfolio. It is responsible for
floating, managing, redeeming the schemes; it also handles the
administrative chares. It receives the fees for the services rendered
by it. The custodian is responsible for co-ordination with brokers, the
actual transfer & storage of stocks, & handling the property of the
trust.
Finally the unit holders are investors from who a pool of money is
collected & invested according to the stated investment objectives.
Mutual fund investors are like share holders & they own the fund.
They are neither lenders nor the deposit holders in the fund. Unlike
a holder of stock of company, unit holders have no voting rights.
Organization of a Mutual Fund
All mutual funds comprise four constituents – Sponsors, Trustees,
Asset Management Company (AMC) and Custodians.
1. Sponsors:
The sponsors initiate the idea to set up a mutual fund. It could be a
registered company, scheduled bank or financial institution. A
sponsor has to satisfy certain conditions, such as capital, record (at
least five years’ operation in financial services), de-fault free
dealings and general reputation of fairness. The sponsors appoint
the Trustee, AMC and Custodian. Once the AMC is formed, thesponsor is just a stakeholder.
31

8/3/2019 Final 2nd Sam Project Report
http://slidepdf.com/reader/full/final-2nd-sam-project-report 32/82
2. Trust/ Board of Trustees:
Trustees hold a fiduciary responsibility towards unit holders by
protecting their interests. Trustees float and market schemes, and
secure necessary approvals. They check if the AMC’s investments
are within well-defined limits, whether the fund’s assets are
protected, and also ensure that unit holders get their due returns.
They also review any due diligence by the AMC. For major decisions
concerning the fund, they have to take the unit holders consent.
They submit reports every six months to SEBI; investors get an
annual report. Trustees are paid annually out of the fund’s assets –
0.5 percent of the weekly net asset value.
3. Fund Managers/ AMC:
They are the ones who manage money of the investors. An AMC
takes decisions, compensates investors through dividends,
maintains proper accounting and information for pricing of units,
calculates the NAV, and provides information on listed schemes. It
also exercises due diligence on investments, and submits quarterly
reports to the trustees. A fund’s AMC can neither act for any other
fund nor undertake any business other than asset management. Its
net worth should not fall below Rs. 10 crore. And, its fee should not
exceed 1.25 percent if collections are below Rs. 100 crore and 1
percent if collections are above Rs. 100 crore. SEBI can pull up an
AMC if it deviates from its prescribed role.
4. Custodian:
Often an independent organization, it takes custody of securities
and other assets of mutual fund. Its responsibilities include receipt
and delivery of securities, collecting income-distributing dividends,
safekeeping of the units and segregating assets and settlements
32

8/3/2019 Final 2nd Sam Project Report
http://slidepdf.com/reader/full/final-2nd-sam-project-report 33/82
between schemes. Their charges range between 0.15-0.20 percent
of the net value of the holding. Custodians can service more than
one fund.
Investment Alternatives
I. Direct Investment Alternatives
A. Fixed Principal Investments
i. Cash
ii. Savings account
iii. Savings Certificate
iv. Government Bonds
v. Corporate Bonds and Debentures
B. Variable Principle Securities
i. Equity Shares
ii. Convertible Debentures or Preference
Securities
C. Non-Security Investments
i. Real Estate
ii. Mortgages
33
8/3/2019 Final 2nd Sam Project Report
http://slidepdf.com/reader/full/final-2nd-sam-project-report 34/82
iii. Commodities
iv. Business Ventures
v. Art, Antiques and Other Valuables
II. Indirect Investment Alternatives
A. Pension Fund
B. Provident Fund
C. Insurance
D. Investment Companies
E. Unit Trust of India and Other Trust Funds
F. Mutual Funds
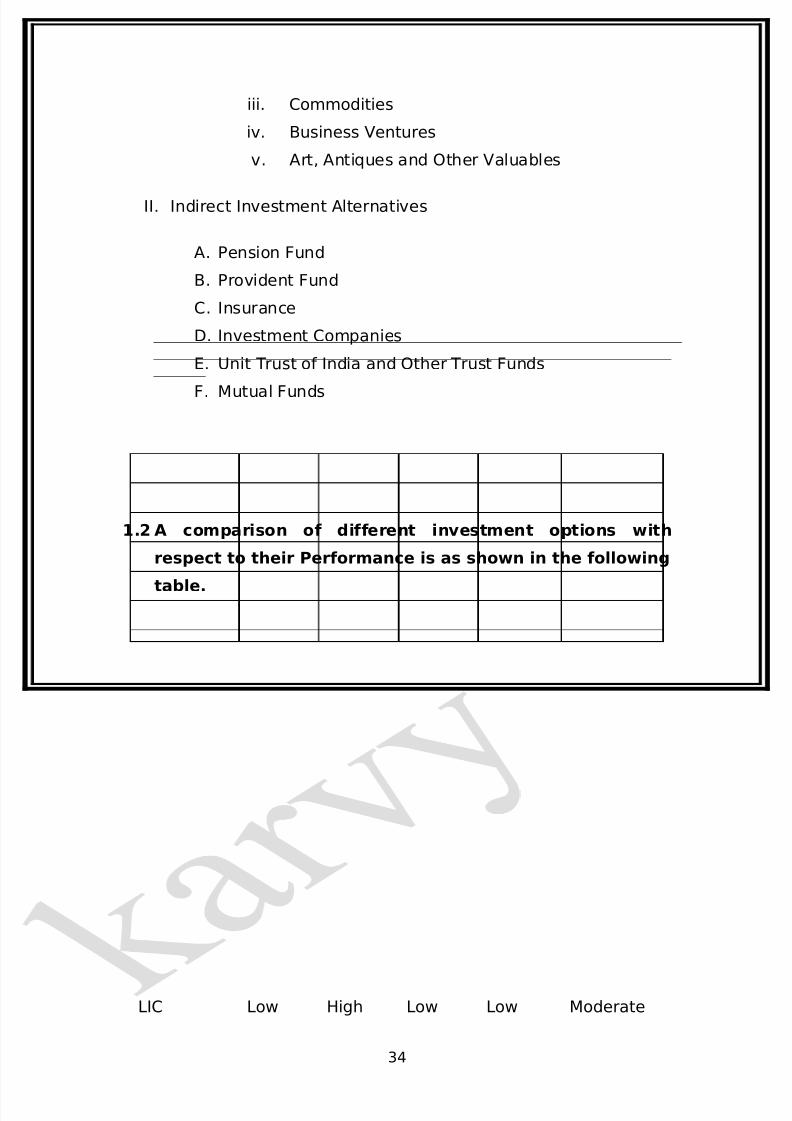
1.2 A comparison of different investment options with
respect to their Performance is as shown in the following
table.
Options Returns Safety Volatilit
y
Liquidity Convenien
ceEquity High Low High High/Lo
w
Moderate
FI Bond Modera
te
High Modera
te
Moderat
e
High
Debentures Modera
te
Modera
te
Modera
te
Low Low
Company
FD
Modera
te
Low Low Low Moderate
PPF Modera
te
High Low Moderat
e
High
LIC Low High Low Low Moderate
34

8/3/2019 Final 2nd Sam Project Report
http://slidepdf.com/reader/full/final-2nd-sam-project-report 35/82
Gold Modera
te
High Modera
te
Moderat
e
Low
Real Estate High Modera
te
High Low Low
Mutual
Fund
High High Modera
te
High High
Bank
Deposit
Low High Low High High
Financial Institutions:
Financial institutions are business organizations that act as
mobilizes & depositors of savings & purveyors of credit or finance.
Financial Institutions are engaged in these activities
Financing by way of loans, advances, and so on any activity
except its own.
Acquisition of shares/ stocks/ bonds/ debentures/ securities
Hire- purchase
Any class of insurance, stock- broking, etc.
Chit funds and
35

8/3/2019 Final 2nd Sam Project Report
http://slidepdf.com/reader/full/final-2nd-sam-project-report 36/82
Financial
Financial
MarketsFinancial
Instruments
Financial
Services
Intermediaries
Banking
OthersNon-
intermediaries
Regulat
Financial
Institutions
Collection of money by way of subscription/ sale of units or
other instruments/ any other manner and their disbursement.
Fig 1.4. Typical Financial System
36
Non-
banking UnorganizedPrimaryOrganizShor
Secondary
SecondaryMoney
Market
Capital
Market
Long
term
Medium
term
Primary

8/3/2019 Final 2nd Sam Project Report
http://slidepdf.com/reader/full/final-2nd-sam-project-report 37/82
LEGAL & REGULATORY FRAME WORK:
Mutual funds are regulated by the SEBI (Mutual Fund) Regulations1996. SEBI is the regulator of all funds except off share funds.
Where as Bank-sponsored mutual funds are jointly regulated jointly
by SEBI & RBI.
RBI also regulates money market & Government. Securities Markets,
in which mutual funds invest. Since the AMC & Trustee Company is
Companies, they are regulated by the department of Company
37
8/3/2019 Final 2nd Sam Project Report
http://slidepdf.com/reader/full/final-2nd-sam-project-report 38/82
affairs. They have to send periodic reports to the Registrar of the
Company (ROC) & the Company Law Board (CLB).
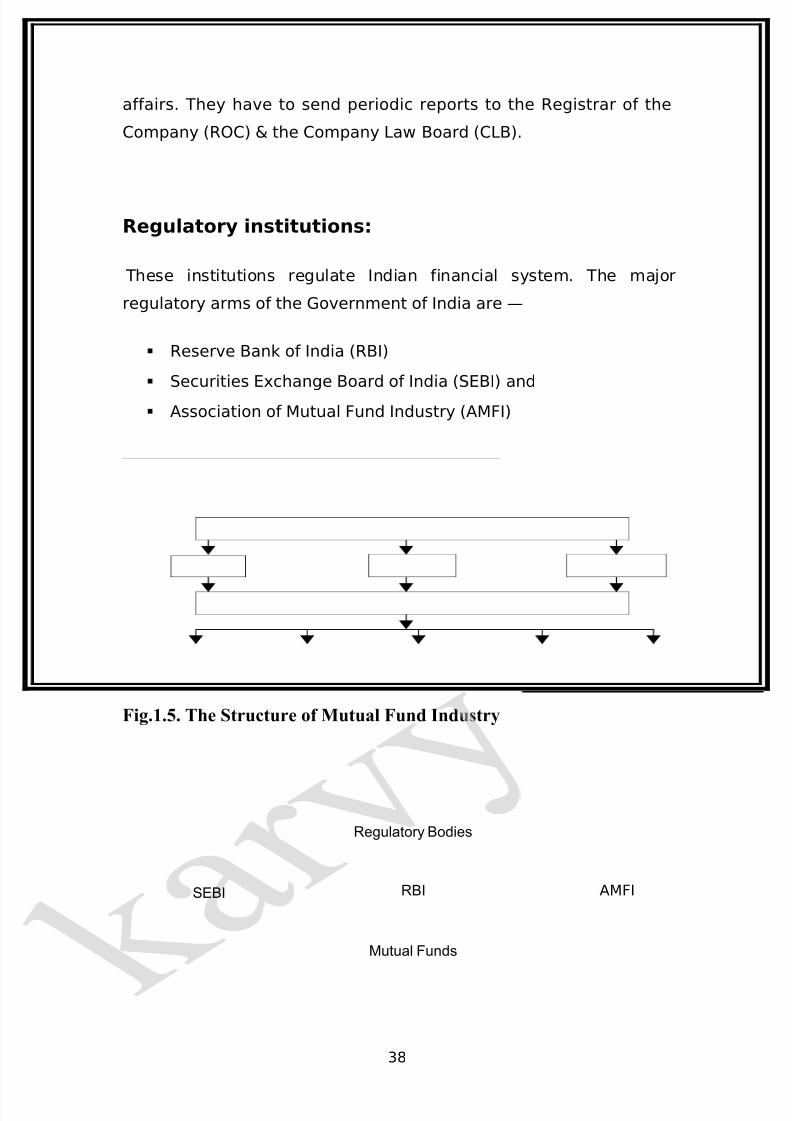
Regulatory institutions:
These institutions regulate Indian financial system. The major
regulatory arms of the Government of India are —
Reserve Bank of India (RBI)
Securities Exchange Board of India (SEBI) and
Association of Mutual Fund Industry (AMFI)
Fig.1.5. The Structure of Mutual Fund Industry
38
AMFISEBI RBI
Mutual Funds
Regulatory Bodies

8/3/2019 Final 2nd Sam Project Report
http://slidepdf.com/reader/full/final-2nd-sam-project-report 39/82
THE RESERVE BANK OF INDIA ( RBI ):
The RBI as the central bank of the country is the center of the Indian
financial and monetary system. As the apex institution it has been
guiding monitoring, regulating controlling and promoting the destiny
of the Indian Financial System since its inception. It started
functioning from April 1, 1935 on the terms of the reserve Bank of
India Act 1934. It was a shareholders’ institution till January 1949,
after which it become a state-owned institution under the reserve
Bank (transfer to public ownership) of India Act, 1948.
39
Sponsor AMC CustodianTrustee
Public Sector Funds Private Sector Funds
Investor
Bank
Sponsored
Financial Institutions
Sponsored
Domestic
Schemes
Offshore
Closed ended
UTI
Open ended
Growth
Funds
Income
Funds
Balanced
Funds
Sect oral
Funds
Special purpose
Funds
Tax saving
Funds

8/3/2019 Final 2nd Sam Project Report
http://slidepdf.com/reader/full/final-2nd-sam-project-report 40/82
FUNCTIONS OF RBI
SECURITIES AND EXCHANGE BOARD OF INDIA (SEBI)
The SEBI was established on April.12.1982 through an
administrative order, but it became a statutory and really powerful
organization only since 1992. SEBI was set up on 21st
February.1992 through an ordinance issued on 30th January.1992.
The SEBI Act on 4th April.1992 replaced the ordinance. The SEBI is
under the overall control of the ministry of Finance, and it has head
office at Mumbai. It has now become a very important constituent of
the financial regulatory framework in India.
OBJECTIVES:
40
Central banking functions
Supervisory functions
Promotional functions
Monetary planning and
control system
F
U
N
C
T
I
O
N

8/3/2019 Final 2nd Sam Project Report
http://slidepdf.com/reader/full/final-2nd-sam-project-report 41/82
To regulate stock exchanges & securities industry to promote
their orderly functioning.
To protect the interest of investors so that there is a steadyflow of savings in to the capital market and educating
individual investors.
To prevent trading malpractices and aims at achieving a
balance between self-regulation by securities industry and its
statutory regulation.
ASSOCIATION OF MUTUAL FUND INDUSTRY (AMFI)
AMFI is an Industry Association. AMFI is not yet the Self
Regulatory Organization (SRO), though SEBI consults AMFI on a
number of issues. AMFI can only issue guidelines. The objectives of
AMFI are-
To define and maintain high professional and ethical
standards in all areas of operation of mutual fund industry
41

8/3/2019 Final 2nd Sam Project Report
http://slidepdf.com/reader/full/final-2nd-sam-project-report 42/82
To interact with the Securities and Exchange Board of India
(SEBI) and to represent to SEBI on all matters concerning the
mutual fund industry.
To represent to the Government, Reserve Bank of India and
other bodies on all matters relating to the Mutual Fund
Industry.
To undertake nation wide investor awareness programme so
as to promote proper understanding of the concept and
working of mutual funds.
To disseminate information on Mutual Fund Industry and to
undertake studies and research directly and/or in association
with other bodies.
INDIAN MUTUAL FUND INDUSTRY
Structure Of The Indian Mutual Fund Industry
Structure wise Mutual fund Industry can be classified in to three
categories:
Unit Trust of India
42

8/3/2019 Final 2nd Sam Project Report
http://slidepdf.com/reader/full/final-2nd-sam-project-report 43/82
The Indian Mutual Fund industry is dominated by the Unit Trust of
India, which has a total corpus of Rs.51,100 crore collected from
over 20 million investors. The UTI has many funds/ schemes in all
categories i.e. Equity, Balanced, Debt, Money Market etc. With somebeing open ended and some being closed ended. The Unit scheme
1964 commonly referred to as US 64, which is a balanced fund, it is
the biggest scheme with a corpus of about 10,000 crore.
Public Sector Mutual Funds
The second largest categories of mutual funds are the ones floated
by nationalized banks. Canbank asset management floated by
Canara Bank and SBI Funds Management floated by State Bank of
India are the largest of these. GIC AMC floated by General Insurance
Corporation and Jeevan Bima Sahayog AMC floated by the LIC are
some of the other prominent ones. The aggregate corpus of the
funds managed by this category of AMC’s is around Rs. 8,300 crore.
Private Sector Mutual fund
The third largest categories of mutual funds are the ones floated by
the Private Sector Domestic Mutual funds and the Private Sector
Foreign Mutual Funds. The largest of these in Private Sector
Domestic Mutual funds are Cholamandalam Asset Management
Co.Ltd., J.M Capital Management Co. Ltd., Escort Asset Management
Ltd., Birla Sun Life Asset Management Pvt.Ltd., and in Private Sector
Foreign Mutual Funds these are Alliance Capital Asset Management
Pvt.Ltd., Prudential ICICI Management Co. Ltd. The aggregate corpus
of the assets managed by this category of AMC’s is about Rs. 42,200
crore .
History of the Indian Mutual Fund Industry
The mutual fund industry in India started in 1963 with the formation
of Unit Trust of India, at the initiative of the Government of India and
43

8/3/2019 Final 2nd Sam Project Report
http://slidepdf.com/reader/full/final-2nd-sam-project-report 44/82
Reserve Bank the. The history of mutual funds in India can be
broadly divided into four distinct phases
First Phase – 1964-87
An Act of Parliament established Unit Trust of India (UTI) on 1963. It
was set up by the Reserve Bank of India and functioned under the
Regulatory and administrative control of the Reserve Bank of India.
In 1978 UTI was de-linked from the RBI and the Industrial
Development Bank of India (IDBI) took over the regulatory and
administrative control in place of RBI. The first scheme launched by
UTI was Unit Scheme 1964. At the end of 1988 UTI had Rs.6, 700
crores of assets under management.
Second Phase – 1987-1993 (Entry of Public Sector Funds)
1987 marked the entry of non- UTI, public sector mutual funds set
up by public sector banks and Life Insurance Corporation of India
(LIC) and General Insurance Corporation of India (GIC). SBI Mutual
Fund was the first non- UTI Mutual Fund established in June 1987
followed by Can bank Mutual Fund (Dec 87), Punjab National Bank
Mutual Fund (Aug 89), Indian Bank Mutual Fund (Nov 89), Bank of
India (Jun 90), Bank of Baroda Mutual Fund (Oct 92). LIC established
its mutual fund in June 1989 while GIC had set up its mutual fund in
December 1990. At the end of 1993, the mutual fund industry had
assets under management of Rs.47, 004 crores.
Third Phase – 1993-2003 (Entry of Private Sector Funds)
44

8/3/2019 Final 2nd Sam Project Report
http://slidepdf.com/reader/full/final-2nd-sam-project-report 45/82
With the entry of private sector funds in 1993, a new era started in
the Indian mutual fund industry, giving the Indian investors a wider
choice of fund families. Also, 1993 was the year in which the first
Mutual Fund Regulations came into being, under which all mutualfunds, except UTI were to be registered and governed. The erstwhile
Kothari Pioneer (now merged with Franklin Templeton) was the first
private sector mutual fund registered in July 1993.
The 1993 SEBI (Mutual Fund) Regulations were substituted by a
more comprehensive and revised Mutual Fund Regulations in 1996.
The industry now functions under the SEBI (Mutual Fund)
Regulations 1996. The number of mutual fund houses went on
increasing, with many foreign mutual funds setting up funds in India
and also the industry has witnessed several mergers and
acquisitions. As at the end of January 2003, there were 33 mutual
funds with total assets of Rs. 1,21,805 crores. The Unit Trust of India
with Rs.44, 541 crores of assets under management was way ahead
of other mutual funds.
Fourth Phase – since February 2003
In February 2003, following the repeal of the Unit Trust of India Act 1963 UTI was
bifurcated into two separate entities. One is the Specified Undertaking of the Unit
Trust of India with assets under management of Rs.29,835 crores as at the end of
January 2003, representing broadly, the assets of US 64 scheme, assured return and
certain other schemes. The Specified Undertaking of Unit Trust of India, functioning
under an administrator and under the rules framed by Government of India and does
not come under the purview of the Mutual Fund Regulations.
The second is the UTI Mutual Fund Ltd, sponsored by SBI, PNB, BOB and LIC. It is
registered with SEBI and functions under the Mutual Fund Regulations. With the
bifurcation of the erstwhile UTI which had in March 2000 more than Rs.76,000 crores
of assets under management and with the setting up of a UTI Mutual Fund,
conforming to the SEBI Mutual Fund Regulations, and with recent mergers taking
place among different private sector funds, the mutual fund industry has entered its
45

8/3/2019 Final 2nd Sam Project Report
http://slidepdf.com/reader/full/final-2nd-sam-project-report 46/82
current phase of consolidation and growth. As at the end of October 31, 2003, there
were 31 funds, which manage assets of Rs.126726 crores under 386 schemes.
The graph indicates the growth of assets over the
years.
GROWTH IN ASSETS UNDER MANAGEMENT
46

8/3/2019 Final 2nd Sam Project Report
http://slidepdf.com/reader/full/final-2nd-sam-project-report 47/82
47
8/3/2019 Final 2nd Sam Project Report
http://slidepdf.com/reader/full/final-2nd-sam-project-report 48/82
Future of Mutual Funds in India
By December 2004, Indian mutual fund industry reached Rs
1,50,537 crore. It is estimated that by 2010 March-end, the
total assets of all scheduled commercial banks should be Rs
40,90,000 crore.
The annual composite rate of growth is expected 13.4%
during the rest of the decade. In the last 5 years we have
seen annual growth rate of 9%. According to the current
growth rate, by year 2010, mutual fund assets will be
double.
Some facts for the growth of mutual funds in India :
• 100% growth in the last 6 years.
• Number of foreign AMC's are in the que to enter the
Indian markets like Fidelity Investments, US based, with
over US$1trillion assets under management worldwide.
• Our saving rate is over 23%, highest in the world.
Only channelizing these savings in mutual funds sector is
required.
• We have approximately 29 mutual funds which is
much less than US having more than 800. There is a big
scope for expansion.
• 'B' and 'C' class cities are growing rapidly. Today most
of the mutual funds are concentrating on the 'A' class cities.
Soon they will find scope in the growing cities.
• Mutual fund can penetrate rurals like the Indian
insurance industry with simple and limited products.
• SEBI allowing the MF's to launch commodity mutual
funds.
• Emphasis on better corporate governance.
• Trying to curb the late trading practices.
48

8/3/2019 Final 2nd Sam Project Report
http://slidepdf.com/reader/full/final-2nd-sam-project-report 49/82
• Introduction of Financial Planners who can provide
need based advice.
INDIAN INDUSTRY DETAILS
Following are the list of mutual fund companies in India.
SI.NO Mutual fund name No. of schemes
1 Alliance Mutual Fund 362 Benchmark Mutual Fund 53 Birla Mutual Fund 74
4 Bank Baroda Mutual Fund 175 Can Mutual Fund 256 Chola Mutual Fund 457 Deutsche Mutual Fund 408 DSP Merrill Lunch Mutual Fund 409 Escort Mutual Fund 1510 Franklin Templeton Investment 13011 GIC Mutual Fund 512 HDFC Mutual Fund 7913 HSBC Mutual Fund 32
14 IL & FS Mutual Fund 4315 ING Vysya Mutual Fund 5516 JM Mutual Fund 5517 Kotak Mutual Funds 5618 LIC Mutual Funds 3519 Morgan Stanley Mutual Fund 120 Punjab National Bank Mutual Fund 421 Prudential ICICI Mutual Fund 12422 Principal Mutual Fund 6823 Reliance Mutual Fund 74
24 Sahara Mutual Fund 1225 State Bank Of India Mutual Fund 5926 Standard Chartered Mutual Fund 10027 Sundaram Mutual Fund 5228 SUN F & C Mutual Fund 129 Tata TD Mutual Fund 10030 Taurus Mutual Fund 931 Unit Trust Of India 4232 UTI Mutual Fund 66
[Table 10: Mutual Fund In India]
49

8/3/2019 Final 2nd Sam Project Report
http://slidepdf.com/reader/full/final-2nd-sam-project-report 50/82
ADVANTAGES OF MUTUAL FUNDS: -
If mutual funds are emerging as the favorite investment vehicle, it is
because of the many advantages they have over other forms and
avenues of investing, particularly for the investor who has limited
resources available in terms of capital and ability to carry out
detailed research and market monitoring. The following are the
major advantages offered by mutual funds to all investors:
• Portfolio diversification:
Mutual Funds normally invest in a well-diversified portfolio or
securities. Each investor in a fund is a part owner of all of the
fund’s assets. This enables him to hold a diversified
investment portfolio even with a small amount of investment
that would otherwise require big capital.
• Professional Management:
Even if and investor has a big amount of capital available to
him, he benefits from the professional management skills
brought in the management of the investor’s portfolio. The
investment management skills, along with the needed
research into available investment options, ensure a much
better return than what an investor can manage on his own.
Few investors have the skills and resources of their own to
succeed in today’s fast moving, global and sophisticated
markets.
• Reduction/Diversification of Risk:
50

8/3/2019 Final 2nd Sam Project Report
http://slidepdf.com/reader/full/final-2nd-sam-project-report 51/82
An investor in a mutual fund acquires a diversified portfolio,
no matter how small his investment. Diversification reduces
the risk of loss, as compared to investing directly in one or two
shares or debentures or other instruments. When and investorinvests directly, all in the pool of funds with other investors,
any loss on one or two securities is also shared with other
investors. This risk reduction is one of the most important
benefits of a collective investment vehicle like the mutual
fund.
• Reduction of transaction cost:
What is true of risk is also true of the transaction costs. A
direct investor bears all the costs of investing such as
brokerage or custody of securities. When going through a
fund. He has the benefit of economies of scale; the funds pay
lesser costs because of larger volumes, a benefit passed on to
its investors.
• Liquidity:
Often, investors hold shares or bonds they cannot directly,
easily and quickly sell. Investment in a mutual fund, on the
other hand, is more liquid. An investor can liquidate the
investment, by selling the units to the fund if open-end or
selling them in the market if the fund is closed-end, and
collect funds at the end of a period specified by the mutual
fund or the stock market.
• Convenience and Flexibility:
Mutual Fund management companies offer many investor
services that a direct market investor cannot get. Investors
can easily transfer their holdings from one scheme to the
other; get updated market information, and so on.
51

8/3/2019 Final 2nd Sam Project Report
http://slidepdf.com/reader/full/final-2nd-sam-project-report 52/82
RISK FACTORS ASSOCIATED WITH MUTUAL FUNDS
Mutual funds & securities investments are subject to
market risks and there is no assurance or guarantee
that the objectives of the Scheme will be achieved.
Past performance of the Sponsor or that of existing
Schemes of the Fund does not indicate the future
performance of the Schemes.
As with any securities investment, the NAV of the Units
issued under the scheme can go up or down depending
on the factors and forces affecting the capital and
money market.
Tax laws may change, affecting the return on
investment in Units.
TYPES OF MUTUAL FUND SCHEMES
I. Schemes according to Maturity Period:
A mutual fund scheme can be classified into open-ended scheme or
close-ended scheme depending on its maturity period.
i. Open-ended Fund/ Scheme
An open-ended fund or scheme is one that is available for
subscription and repurchase on a continuous basis. These schemes
do not have a fixed maturity period. Investors can conveniently buy
and sell units at Net Asset Value (NAV) related prices which are
52

8/3/2019 Final 2nd Sam Project Report
http://slidepdf.com/reader/full/final-2nd-sam-project-report 53/82
declared on a daily basis. The key feature of open-end schemes is
liquidity.
ii. Close-ended Fund/ Scheme
A close-ended fund or scheme has a stipulated maturity period e.g.
5-7 years. The fund is open for subscription only during a specified
period at the time of launch of the scheme. Investors can invest in
the scheme at the time of the initial public issue and thereafter they
can buy or sell the units of the scheme on the stock exchanges
where the units are listed. In order to provide an exit route to the
investors, some close-ended funds give an option of selling back the
units to the mutual funds NAV related prices. SEBI Regulations
stipulate that at least one of the two exit routes is provided to the
investor i.e. either repurchase facility or through listing on stock
exchanges. These mutual funds schemes disclose NAV generally on
weekly basis.
II. Schemes according to Investment Objective:
A scheme can also be classified as growth scheme, income scheme,
or balanced scheme considering its investment objective. Such
schemes may be open-ended or close-ended schemes as described
earlier. Such schemes may be classified mainly as follows:
i. Growth / Equity Oriented Scheme
The aim of Growth funds is to provide capital appreciation over the
medium to long-term. Such schemes normally invest a major part of
their corpus in equities. Such funds have comparatively high risks.
These schemes provide different options to the investors like
dividend option, capital appreciation, etc. and the investors may
choose an option depending on their preferences. The investors
must indicate the option in the application form. The mutual funds
also allow the investors to change the options at a later date.
53

8/3/2019 Final 2nd Sam Project Report
http://slidepdf.com/reader/full/final-2nd-sam-project-report 54/82
Growth schemes are good for investors having a long-term outlook
seeking appreciation over a period of time.
ii. Income / Debt Oriented Scheme
The aim of the income funds is to provide regular and steady
investors. Such scheme generally invests in fixed income securities
such as bonds, corporate debentures, Government securities and
money market instruments. Such funds are less risky compared to
equity schemes. These funds are not affected because of
fluctuations in equity markets. The NAVs of such funds are affected
because of change in interest rates in the country.
iii. Balance Fund
The aim of balance funds is to provide both growth and regular
income as such schemes invest both in equities and fixed income
securities in the proportion indicated in their offer documents. These
are appropriate for investors looking for moderate growth. They
generally invest 40-60% in equity and debt instruments. These
funds are also affected because of fluctuations in share prices in the
stock markets. However, NAVs of such funds are likely to be less
volatile compared to pure equity funds.
iv. Gilt Fund
These funds invest exclusively in government securities.
Government securities have no default risk. NAVs of these schemes
also fluctuate due to change in interest rates and other economic
factors as are the case with income or debt oriented schemes.
54

8/3/2019 Final 2nd Sam Project Report
http://slidepdf.com/reader/full/final-2nd-sam-project-report 55/82
v. Index Funds
Index Funds replicate the portfolio of a particular index such as the
BSE Sensitive index, S&P NSE 50 index (Nifty), etc. These schemes
invest in the securities in the same weight age comprising of an
index. NAVs of such schemes would rise or fall in accordance with
the rise or fall in the index, though not exactly by the same
percentage due to some factors known as “tracking error” in
technical terms.
vi. Money-Market Mutual Funds
These funds invest in highly liquid and safe securities like
commercial paper, banker’s acceptances, and certificates of
deposits. Treasury bills… etc., which are called money market
instruments.
vii. Tax Saving Schemes
This schemes offer tax rebates to the investors under specific
provisions of the Indian Income Tax laws as the Government. Offerstax incentives for investment in specified avenues. Investment
made in Equity Linked Saving Schemes (ELSS) and Pension Schemes
are allowed as deduction u/s 88 of the Income Tax Act 1961.
55

8/3/2019 Final 2nd Sam Project Report
http://slidepdf.com/reader/full/final-2nd-sam-project-report 56/82
LIMITATIONS OF THE STUDY
1. A descriptive research was undertaken for the purpose of project.
But descriptive research has its own limitations regarding the
selection of sample size of sample unit.
2. Some of the data gathered from the mutual fund holders may not
be reliable.
3. Time limit was also a constraint while conducting the study. So,
the study does not give a picture of the whole market.
4. Time factor, as a period of two month, for gathering data is
inadequate as the gamut of information needs to be synchronized
to give much more comprehensive view of the problems and
prospects.
5. Detailed and depth research was not conducted due to financial
factors.
56

8/3/2019 Final 2nd Sam Project Report
http://slidepdf.com/reader/full/final-2nd-sam-project-report 57/82
6. The study curtails comparison as it was done only in one city i.e.
Ludhiana.
7. The information provided by the organizations was limited to a far
extent due to drawbacks like competition.
OBJECTIVES OF THE STUDY
1. To track investor’s attitude, performance and behavior with respect to
financial institutions and financial products.
2. To find new and more effective ways of ensuring investor satisfaction
and to find efficient ways of communicating it.
3. To conduct the study with references to Kotak Mahindra products and
the competitive scenario in which Kotak Mahindra operates.
4. To study the structure of investment opportunities.
57
8/3/2019 Final 2nd Sam Project Report
http://slidepdf.com/reader/full/final-2nd-sam-project-report 58/82
SCOPE OF THE STUDY
The study includes investors, financial institutions, investors who are interested in
Karvy stock exchange ltd. Company’s mutual fund and also the individuals who are
interested in the investment on the mutual fund. The individuals without investment
are also included in the scope of the study.
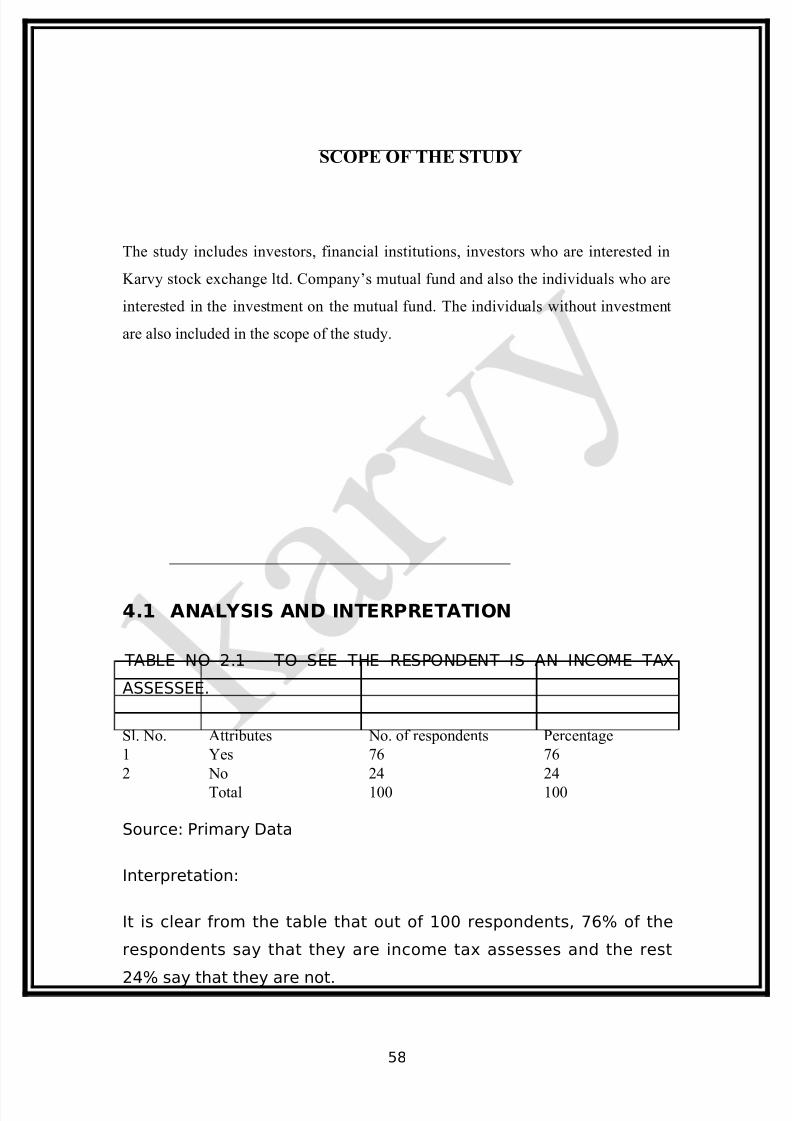
4.1 ANALYSIS AND INTERPRETATION
TABLE NO 2.1 – TO SEE THE RESPONDENT IS AN INCOME TAX
ASSESSEE.
Sl. No. Attributes No. of respondents Percentage
1 Yes 76 76
2 No 24 24
Total 100 100
Source: Primary Data
Interpretation:
It is clear from the table that out of 100 respondents, 76% of the
respondents say that they are income tax assesses and the rest
24% say that they are not.
58

8/3/2019 Final 2nd Sam Project Report
http://slidepdf.com/reader/full/final-2nd-sam-project-report 59/82
This is illustrated in the following graph.
GRAPH NO.1 – TO SEE THE RESPONDENT IS AN INCOME TAX
ASSESSEE.
Source: - Table No: 2.1
TABLE NO 2.2. TO SEE WHETHER REPONDENTS INVEST FOR TAX
EXEMPTION OR TAX SAVINGS
Sl. No. Attributes No. of respondents Percentage
1 Yes 70 70
2 No 30 30
Total 100 100
Source: Primary Data
Interpretation:
It is clear from the table that out of 100 respondents, 70% of the
respondents say that they invest for tax exemption and the rest
30% say that they do not.
This is illustrated in the following graph.
59

8/3/2019 Final 2nd Sam Project Report
http://slidepdf.com/reader/full/final-2nd-sam-project-report 60/82
GRAPH NO 2. TO SEE WHETHER REPONDENTS INVEST FOR TAX
EXEMPTION OR TAX SAVINGS
Source: Table No: 2.2
TABLE NO 2.3. INVESTMENT PREFERENCE OF RESPONDENTS
Sl. No. Attributes No. of respondents Percentage
1 Fixed Deposits 33 33
2 Real Estate 27 27
3 Insurance 21 21
4 Mutual Fund 9 9
5 Gold 9 9
Total 100 100
Source: Primary Data
Interpretation:
It is clear from the table that out of 100 respondents, 33% of the
respondents invest in fixed deposits, 27% invest in Real Estate, 21%
in Insurance, 9% in Mutual Fund and the rest 9% say that they
invest in gold.
60

8/3/2019 Final 2nd Sam Project Report
http://slidepdf.com/reader/full/final-2nd-sam-project-report 61/82
This is illustrated in the following graph.
GRAPH NO 3. INVESTMENT PREFERENCE OF RESPONDENTS
Source: Table No: 2.3
TABLE NO 2.4 REASONS OF INVESTMENT PREFERENCE OF
RESPONDENTS
Sl. No. Attributes No. of respondents Percentage
1 Less Risk 28 28
2 Good Returns 21 21
3 Liquidity 12 12
4 Assured Returns 36 36
5 Other Reasons 3 3
Total 100 100
Source: Primary Data
Interpretation:
It is clear from the table that out of 100 respondents, 28% of the
respondents prefer investment due to less risk, 21% due to good
returns, 12% due to liquidity, 36% due to assured returns and the
rest 3% do it due to other reasons.
61

8/3/2019 Final 2nd Sam Project Report
http://slidepdf.com/reader/full/final-2nd-sam-project-report 62/82
This is illustrated in the following graph.
GRAPH NO 4. REASONS OF INVESTMENT PREFERENCE OF
RESPONDENTS
Source: Table No: 2.4
TABLE NO 2.5. CURRENT INVESTMENT PORTFOLIO OF
RESPONDENTS
Sl. No. Attributes No. of respondents Percentage
1 Govt securities and bonds 61 61
2 Mutual funds & company FD’s 18 18
3 Equity Shares 21 21
Total 100 100
Source: Primary Data
Interpretation:
It is clear from the table that out of 100 respondents, 61% of the
respondents invest in Govt securities and bonds, 18% in Mutual
funds and company fixed deposits and the rest 21% in equity
shares.
62

8/3/2019 Final 2nd Sam Project Report
http://slidepdf.com/reader/full/final-2nd-sam-project-report 63/82
This is illustrated in the following graph:
GRAPH NO 5. CURRENT INVESTMENT PORTFOLIO OF RESPONDENTS
Source: Table No: 2.5
TABLE NO 2.6. NATURE OF INVESTMENT THAT THE RESPONDENTS
LIKE
Sl. No. Attributes No. of respondents Percentage
1 Steadily 61 61
2 At average rate 27 27
3 Fast 12 12
Total 100 100
Source: Primary Data
Interpretation:
It is clear from the table that out of 100 respondents, 61% of the
respondents like their investment to grow steadily, 27% in an
average rate and the rest 12% in a fast rate.
This is illustrated in the following graph.
63

8/3/2019 Final 2nd Sam Project Report
http://slidepdf.com/reader/full/final-2nd-sam-project-report 64/82
GRAPH NO 6. NATURE OF INVESTMENT THAT THE RESPONDENTS
LIKE
Source: Table No: 2.6
TABLE NO 2.7 PERCENTAGE OF INCOME THAT THE RESPONDENTS
INVEST
Sl. No. Attributes No. of respondents Percentage
1 5 % 24 24
2 5% - 10% 37 37
3 More than 10% 39 39
Total 100 100
Source: Primary Data
Interpretation:
It is clear from the table that out of 100 respondents, 24% of the
respondents invest 5% of their total income, 37% invests 5-10% and
the rest 39% invest more than 10%.
This is illustrated in the following graph.
64

8/3/2019 Final 2nd Sam Project Report
http://slidepdf.com/reader/full/final-2nd-sam-project-report 65/82
GRAPH NO 7. PERCENTAGE OF INCOME THAT THE RESPONDENTS
INVEST
Source: Table No: 2.7
TABLE NO 2.8 TO SEE WHETHER THE RESPONDENT IS AN INVESTOR
OF MUTUAL FUND
Sl. No. Attributes No. of respondents Percentage
1 Yes 27 27
2 No 73 73
Total 100 100
Source: Primary Data
Interpretation:
It is clear from the table that out of 100 respondents, only 27% of
the respondents are investors of mutual funds and the rest 73% are
not.
This is illustrated in the following graph.
65

8/3/2019 Final 2nd Sam Project Report
http://slidepdf.com/reader/full/final-2nd-sam-project-report 66/82
GRAPH NO 8. TO SEE WHETHER THE RESPONDENT IS AN INVESTOR
OF MUTUAL FUND
Source: Table: 2.8.
TABLE NO 2.9 REASONS FOR NOT INVESTING IN MUTUAL FUNDS
Sl. No. Attributes No. of respondents Percentage
1 Awareness 15 15
2 Risky 58 58
3 Returns not assured 27 27
Total 100 100
Source: Primary Data
Interpretation:
It is clear from the table that out of 100 respondents, 15% of the
respondents do not invest in mutual funds because of lack of
awareness, 58% as it is risky and the rest 27% as the returns are
not assured.
This is illustrated in the following graph.
66

8/3/2019 Final 2nd Sam Project Report
http://slidepdf.com/reader/full/final-2nd-sam-project-report 67/82
GRAPH NO 9. REASONS FOR NOT INVESTING IN MUTUAL FUNDS
Source: Table No: 2.9
TABLE NO 2.10 REASONS FOR INVESTING IN MUTUAL FUNDS
Sl. No. Attributes No. of respondents Percentage
1 Less Risky 21 21
2 Liquidity 30 30
3 Professional Mgmt 24 24
4 Fast Appreciation 25 25
Total 100 100
Source: Primary Data
Interpretation:
It is clear from the table that out of 100 respondents, 21% of the
respondents feel that investing in mutual funds are less risky and
hence they invest, 30% invest due to liquidity, 24% due to
Professional management and the rest 25% due to fast
appreciation.
This is illustrated in the following graph.
67

8/3/2019 Final 2nd Sam Project Report
http://slidepdf.com/reader/full/final-2nd-sam-project-report 68/82
GRAPH NO 10. REASONS FOR INVESTING IN MUTUAL FUNDS
Source: Table No: 2.10
TABLE NO 2.11 KIND OF MUTUAL FUND THAT THE RESPONDENTS
PREFER
Sl. No. Attributes No. of respondents Percentage
1 Open-ended 57 57
2 Closed-ended 43 43
Total 100 100
Source: Primary Data
Interpretation:
It is clear from the table that out of 100 respondents, 57% of the
respondents prefer open-ended mutual funds and the rest 43%
closed-ended ones.
This is illustrated in the following graph.
GRAPH NO 11. KIND OF MUTUAL FUND THAT THE RESPONDENTS
PREFER
68
8/3/2019 Final 2nd Sam Project Report
http://slidepdf.com/reader/full/final-2nd-sam-project-report 69/82
Source: Table No: 2.11
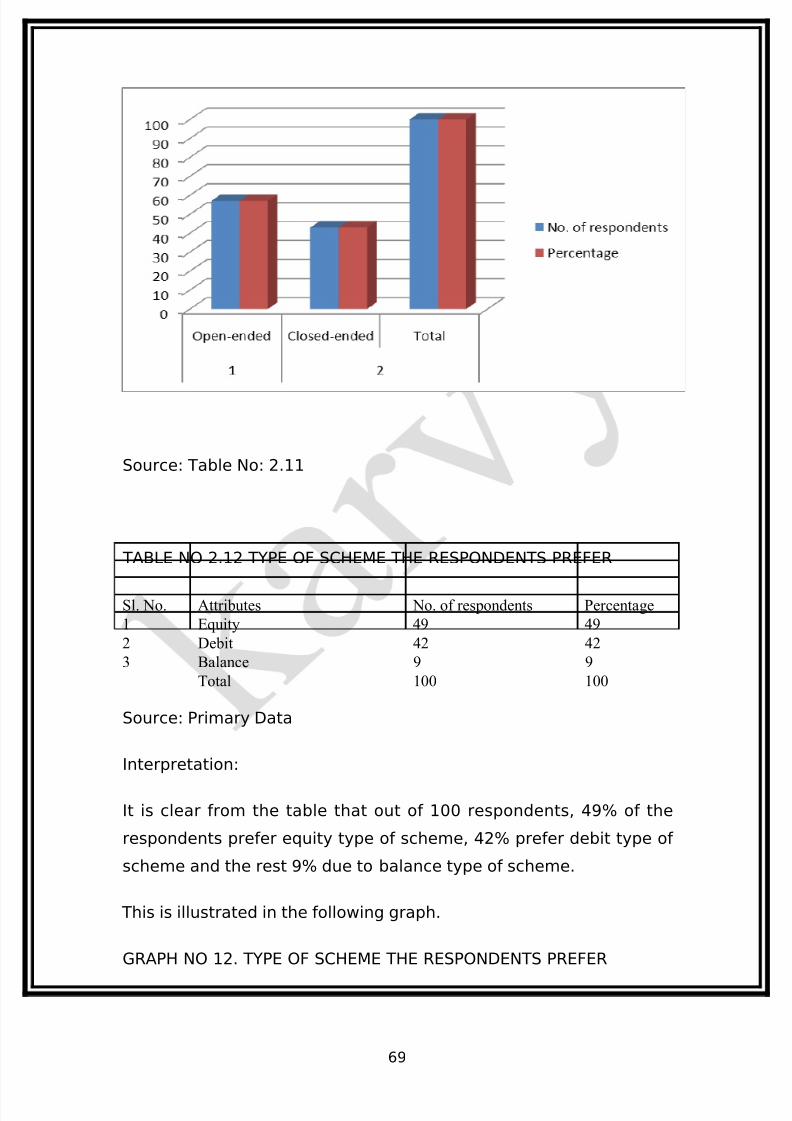
TABLE NO 2.12 TYPE OF SCHEME THE RESPONDENTS PREFER
Sl. No. Attributes No. of respondents Percentage
1 Equity 49 49
2 Debit 42 42
3 Balance 9 9
Total 100 100
Source: Primary Data
Interpretation:
It is clear from the table that out of 100 respondents, 49% of the
respondents prefer equity type of scheme, 42% prefer debit type of
scheme and the rest 9% due to balance type of scheme.
This is illustrated in the following graph.
GRAPH NO 12. TYPE OF SCHEME THE RESPONDENTS PREFER
69
8/3/2019 Final 2nd Sam Project Report
http://slidepdf.com/reader/full/final-2nd-sam-project-report 70/82
Source: Table No: 2.12
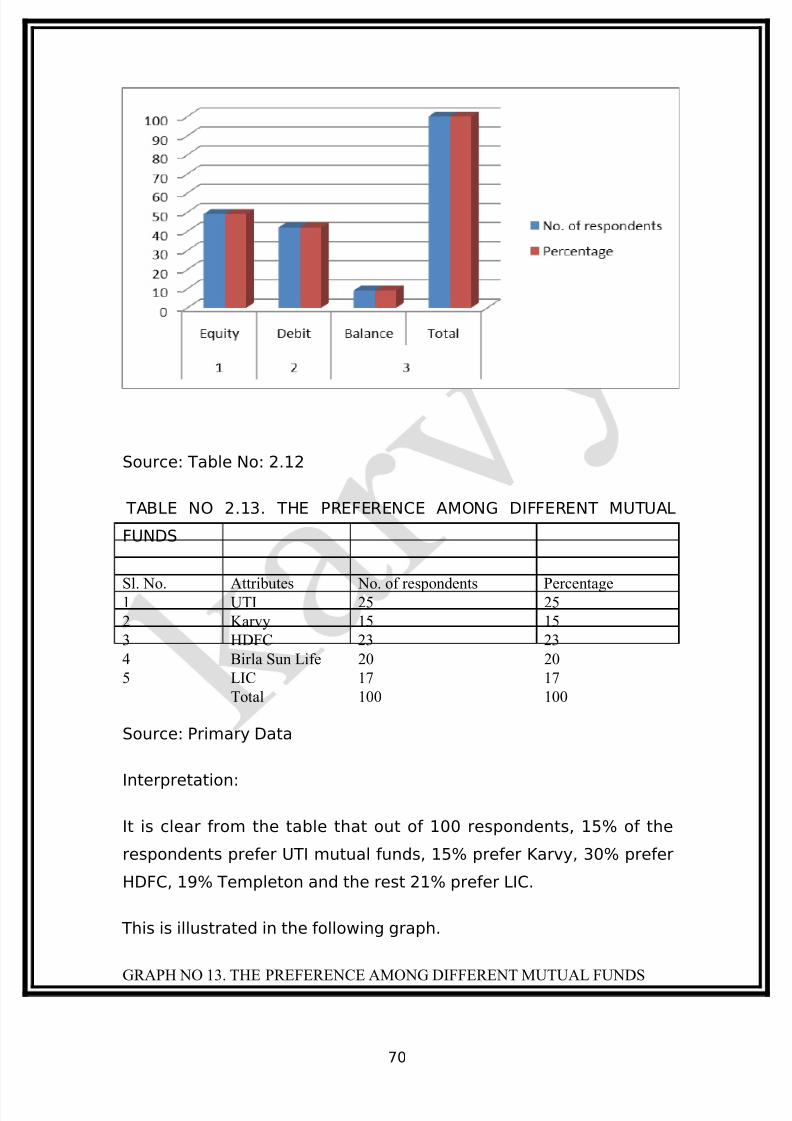
TABLE NO 2.13. THE PREFERENCE AMONG DIFFERENT MUTUAL
FUNDS
Sl. No. Attributes No. of respondents Percentage1 UTI 25 25
2 Karvy 15 15
3 HDFC 23 23
4 Birla Sun Life 20 20
5 LIC 17 17
Total 100 100
Source: Primary Data
Interpretation:
It is clear from the table that out of 100 respondents, 15% of the
respondents prefer UTI mutual funds, 15% prefer Karvy, 30% prefer
HDFC, 19% Templeton and the rest 21% prefer LIC.
This is illustrated in the following graph.
GRAPH NO 13. THE PREFERENCE AMONG DIFFERENT MUTUAL FUNDS
70

8/3/2019 Final 2nd Sam Project Report
http://slidepdf.com/reader/full/final-2nd-sam-project-report 71/82
Source: Table No: 2.13
TABLE NO 2.14 TO ANALYSE WHETHER THE RESPONDENT SEES THE
BRAND NAME WHILE INVESTING
Sl. No. Attributes No. of respondents Percentage
1 Yes 94 94
2 No 06 06Total 100 100
Source: Primary Data
Interpretation:
It is clear from the table that out of 100 respondents, 94% of the
respondents see brand name while investing and the rest 6% are
not.
This is illustrated in the following graph.
GRAPH NO 14. TO ANALYSE WHETHER THE RESPONDENT SEES THE
BRAND NAME WHILE INVESTING
71

8/3/2019 Final 2nd Sam Project Report
http://slidepdf.com/reader/full/final-2nd-sam-project-report 72/82
Source: Table: 2.14
TABLE NO 2.15 IMMEDIATE REACTIONS IN CASE OF SUDDEN DIP IN
STOCK MARKET
Sl. No. Attributes No. of respondents Percentage
1 Would withdraw the investment 39 392 Would wait and watch 55 55
3 Would invest more in it 6 6
Total 100 100
Source: Primary Data
Interpretation:
It is clear from the table that out of 100 respondents, 39% of therespondents would withdraw the investment, 55% would wait and
watch the show and the rest 6% say that they would invest more.
This is illustrated in the following graph.
GRAPH NO 15. IMMEDIATE REACTION IN CASE OF SUDDEN DIP IN
STOCK MARKET
72

8/3/2019 Final 2nd Sam Project Report
http://slidepdf.com/reader/full/final-2nd-sam-project-report 73/82
Source: Table No: 2.15
TABLE NO 2.16 TO KNOW THAT THE RESPONDENTS HAVE HEARD OF
KARVY MUTUAL FUND SERVICES
Sl. No. Attributes No. of respondents Percentage
1 Yes 100 100
2 No 00 00
Total 100 100
Source: Primary Data
Interpretation:
It is clear from the table that out of 100 respondents, all 100
respondents have heard of KARVY Mutual Fund Services.
This is illustrated in the following graph.
GRAPH NO 16. TO KNOW THAT THE RESPONDENTS HAVE HEARD OF
KARVY MUTUAL FUND SERVICES
73

8/3/2019 Final 2nd Sam Project Report
http://slidepdf.com/reader/full/final-2nd-sam-project-report 74/82
Source: Table: 2.16
TABLE NO 2.17 VIEWS ON KARVY MF SERVICES AND ITS SCHEMES
Sl. No. Attributes No. of respondents Percentage
1 Good 25 252 Moderate 49 49
3 Not aware 26 26
Total 100 100
Source: Primary Data
Interpretation:
It is clear from the table that out of 100 respondents, 15% of therespondent’s view that KARVY MF is good, 36% feel that it is
moderate and the rest 49% say that they are not aware.
This is illustrated in the following graph.
GRAPH NO 17. VIEWS ON KARVY MF SERVICES AND ITS SCHEMES
74

8/3/2019 Final 2nd Sam Project Report
http://slidepdf.com/reader/full/final-2nd-sam-project-report 75/82
Source: Table No: 2.17
5.1 FINDINGS
Majority of the respondents are income tax assesses
and invest for the purpose of Tax exemption or
savings..
Most of the respondents prefer to invest in Fixed
Deposits, Real Estate and Insurance because of less
risk and assured returns.
The investment portfolio of majority of the
respondents is in govt securities and bonds.
Though mutual funds exist in the market, the people
who tend to invest in it is very low compared to other
investments. The reason behind is the high risk factor
involved with Mutual Funds.
Majority of the people prefer open-ended equityscheme.
75

8/3/2019 Final 2nd Sam Project Report
http://slidepdf.com/reader/full/final-2nd-sam-project-report 76/82
Majority of Investors prefer brand name of the
company and then invest in their schemes so UTI as
gained more investors as risk is less and there is an
assured return. If there is a sudden dip in Stock Market majority of
Investors doesn’t withdraw their money instead wait
for some time.
Among the surveyed Investors everyone has heard
Karvy Mutual Fund and majority of them have rated
Karvy Mutual Fund schemes as Moderate.
5.2 SUGGESTIONS
1. Proper care should be taken to give the correct guidance to the investors so
that they will invest more.
2. Good campaigns can be arranged so that people will know more about Mutual
Funds and will tend to invest in it.
3. Nice advertisements can be entertained so that people will get interest in
Mutual Funds.
4. Karvy can come up with good, attractive schemes for its investors.
76
8/3/2019 Final 2nd Sam Project Report
http://slidepdf.com/reader/full/final-2nd-sam-project-report 77/82
5. Nowadays Indian Mutual fund Industry is attracting more and more retail
investors because of economic stability and increasing growth rate, it leads to gradual
increase in the stock market indices.
6. Interest rates are falling gradually and mutual fund industry is booming
because of this reason investors can move from Bank deposits to mutual funds so
mutual fund organizations should bring new schemes to satisfy the investors.
7. Mutual fund schemes have not gained importance as there is a lack of
awareness about Mutual fund schemes so the executives of the organization should
take certain steps to educate the investors.
5.4 CONCLUSION
The study “Investors preferences towards Mutual Funds” was
carried out on behalf of Mutual Funds of Kotak Mahindra Asset
Management Company Ltd. The data was collected from various
sources and also through the tools like questionnaires and relevant
interactions with concerned persons. The needs were identified in
the form of findings and suitable suggestions were put forth in the
form of recommendations to the concerned authorities for further
discussions. A few recommendations have been considered for
implementation.
77

8/3/2019 Final 2nd Sam Project Report
http://slidepdf.com/reader/full/final-2nd-sam-project-report 78/82
Mutual fund schemes are subject to market risk.
On the basis of above statements it has proved higher
the risk higher the return and lower the risk lower the
return. Nowadays Mutual Fund schemes are increasing because
of falling interest rates so the organization can provide
further new schemes and attract the new customers.
Investment in Mutual fund schemes gives diversified
portfolio to investors.
Nowadays Indian Mutual Fund industry is attracting
more and more retail investors because of economicstability and increasing growth rate, it leads to gradual
increase in the stock market Indices.
QUESTIONNAIRE ON INVESTORS PREFERENCES
TOWARDS MUTUAL FUNDS WITH REFERENCE
TO KARVY MUTUAL FUND
Dear Sir/Madam,
I, Gurkirat Singh, student of R.I.M.T, would like your kind
attention for a few minutes to answer this questionnaire. This is part
of a survey on ‘Investors preference towards Mutual Funds
with reference to Karvy’ as a partial fulfillment of MBA course.
Therefore, I kindly request you to fill the following questionnaire.
78

8/3/2019 Final 2nd Sam Project Report
http://slidepdf.com/reader/full/final-2nd-sam-project-report 79/82
The information provided by you will be used for academic purpose
only & will be kept confidential.
1. Name :
2. Age :
3. Gender : Male ( ) Female
( )
4. Occupation : Business ( ) Profession
( )
Housewife ( ) Students ( )
Service ( ) Others
( )
5. Annual Income : Below 100,000 ( ) 100,001 to 200,000
( )
200,001 to 300,000 ( ) 300,001 to
500,000 ( )
500,001 & above ( )
6. Number of dependents:
Please put tick on your answers for the following questions
1. Are you an Income Tax Assesse?
Yes
No No
2. Are you investing for tax exemption or tax savings?
YesNo
79

8/3/2019 Final 2nd Sam Project Report
http://slidepdf.com/reader/full/final-2nd-sam-project-report 80/82
3. What kind of invest options you prefer?
Fixed Deposit
Real Estate
Insurance
Mutual Fund
Gold
4. Why you prefer the above option?
Less Risk
Good Returns
Liquidity
Assured Returns
Other Reasons
5. Your current investment portfolio includes majority of
Govt. securities and Bonds
Mutual funds & company fixed deposits
Equity shares
6. You would like your investment to grow
Steadily
At average rate
Fast
7. What percentage of your income do you invest?Up to 5 %
5%--- 10%
More than 10%
8. Are you an investor in mutual fund?
Yes
No
80

8/3/2019 Final 2nd Sam Project Report
http://slidepdf.com/reader/full/final-2nd-sam-project-report 81/82
9. If answer is No, why you are not investing in mutual fund?
Awareness
Risky
Returns not assured
10. If answer is Yes, why do you prefer mutual fund?
Less risky
Liquidity
Professional mgt.
Fast appreciation
11. What kind of mutual fund you prefer?
Open- ended
Closed-ended
12. What type of scheme do you prefer?
Equity
Debt
Balance
13. If you are an investor of MF, which Company you prefer?
UTI
KARVY
HDFC
Birla Sun Life
LIC
14. While buying a Mutual Fund scheme do you see brand name?
Yes
No
81
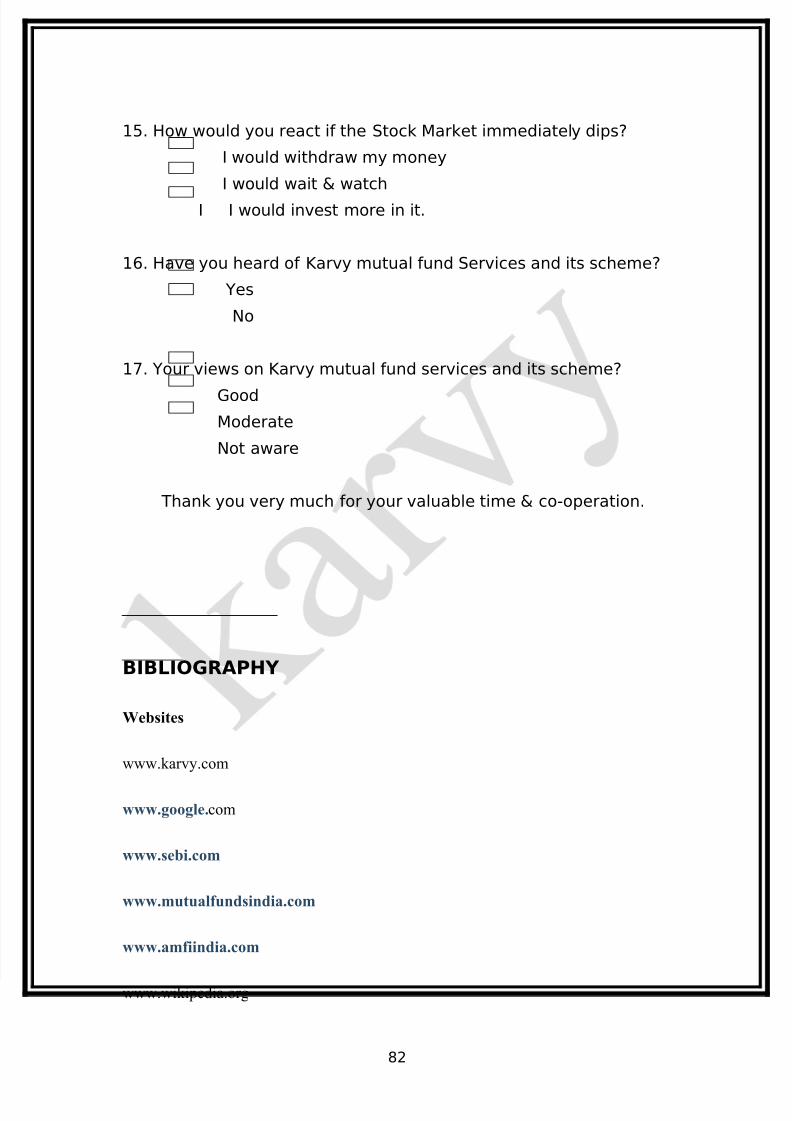
8/3/2019 Final 2nd Sam Project Report
http://slidepdf.com/reader/full/final-2nd-sam-project-report 82/82
15. How would you react if the Stock Market immediately dips?
I would withdraw my money
I would wait & watch
I I would invest more in it.
16. Have you heard of Karvy mutual fund Services and its scheme?
Yes
No
17. Your views on Karvy mutual fund services and its scheme?
Good
Moderate
Not aware
Thank you very much for your valuable time & co-operation.
BIBLIOGRAPHY
Websites
www.karvy.com
www.google.com