


Languages
Pages
Legal


For investment professional use only and not for general public distribution
FF Global Financial Services Fund
February 2017
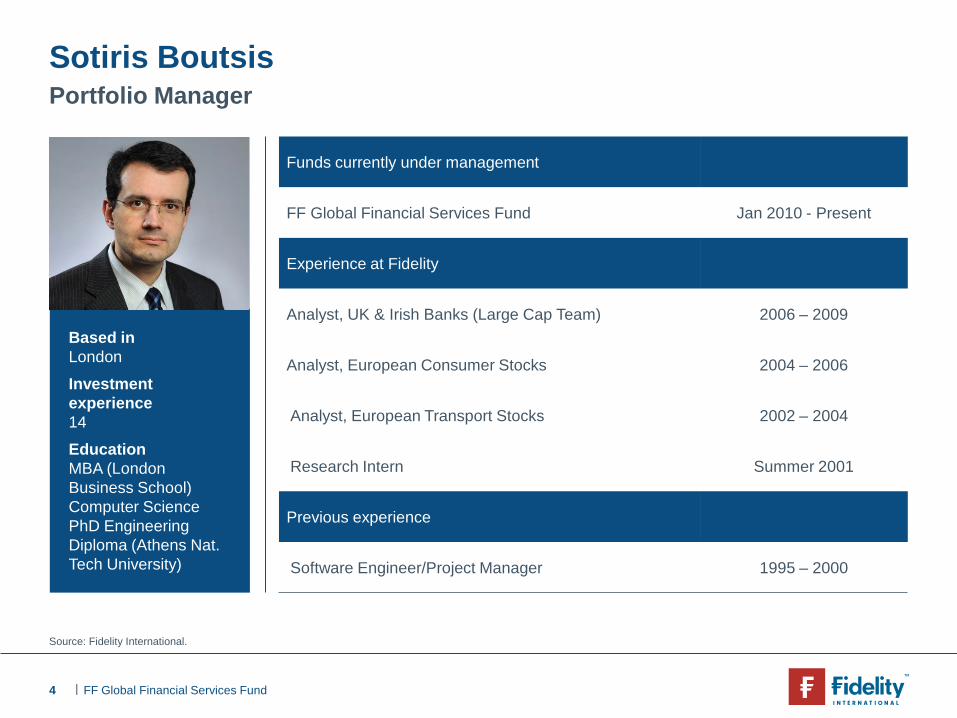
Sotiris Boutsis Portfolio Manager
Radhika Surie Investment Director

Contents
1. Portfolio manager & team
2. Outlook
3. Why financials?
4. Investment philosophy & process
5. Performance & positioning

1. Portfolio manager & team
| 4 FF Global Financial Services Fund
Source: Fidelity International.
Portfolio Manager Sotiris Boutsis
Based in London
Investment experience 14
Education MBA (London Business School) Computer Science PhD Engineering Diploma (Athens Nat. Tech University)
Funds currently under management
FF Global Financial Services Fund Jan 2010 - Present
Experience at Fidelity
Analyst, UK & Irish Banks (Large Cap Team) 2006 – 2009
Analyst, European Consumer Stocks 2004 – 2006
Analyst, European Transport Stocks 2002 – 2004
Research Intern Summer 2001
Previous experience
Software Engineer/Project Manager 1995 – 2000
| 5 FF Global Financial Services Fund
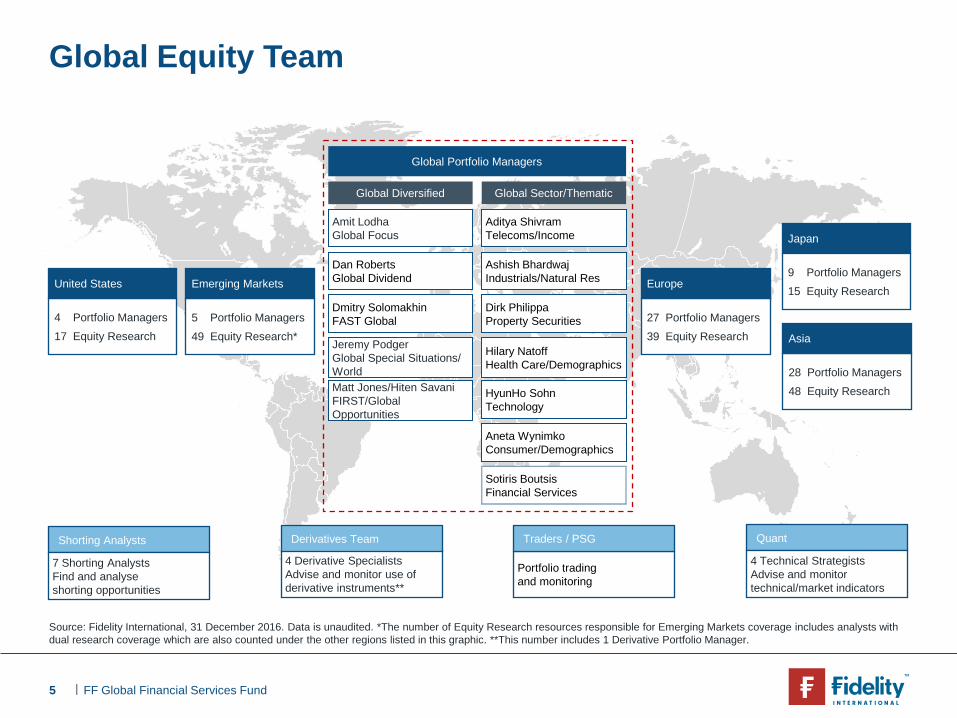
Global Equity Team
Source: Fidelity International, 31 December 2016. Data is unaudited. *The number of Equity Research resources responsible for Emerging Markets coverage includes analysts with dual research coverage which are also counted under the other regions listed in this graphic. **This number includes 1 Derivative Portfolio Manager.
28 Portfolio Managers 48 Equity Research
Asia
4 Portfolio Managers 17 Equity Research
United States
5 Portfolio Managers 49 Equity Research*
Emerging Markets
4 Derivative Specialists Advise and monitor use of derivative instruments**
Derivatives Team
Portfolio trading and monitoring
Traders / PSG Shorting Analysts
7 Shorting Analysts Find and analyse shorting opportunities
Quant
4 Technical Strategists Advise and monitor technical/market indicators
27 Portfolio Managers 39 Equity Research
Europe
Global Portfolio Managers
Aditya Shivram Telecoms/Income
Dirk Philippa Property Securities
Dan Roberts Global Dividend
Ashish Bhardwaj Industrials/Natural Res
Dmitry Solomakhin FAST Global
Hilary Natoff Health Care/Demographics
Sotiris Boutsis Financial Services
Aneta Wynimko Consumer/Demographics
Jeremy Podger Global Special Situations/ World
HyunHo Sohn Technology
Global Diversified Global Sector/Thematic
Japan
9 Portfolio Managers 15 Equity Research
Amit Lodha Global Focus
Matt Jones/Hiten Savani FIRST/Global Opportunities

| 6 FF Global Financial Services Fund
7 Shorting Analysts, 3 Technical Analysts
US
Europe
Japan
Asia Pac ex-Japan
EMEA & LATAM
Global Equity – Research Resources
3
11
3
7
26
Financials / Real Estate
2
1
7
3
6
22
TMT
5
4
6
33
Consumer
0
6
2
3
13
Health Care
2
2
14
3
6
26
Natural Resources & Utilities
1
1
11
2
9
29
Industrials / Cyclicals
6
4
0
3
7
Country Generalists
0
0
48
17
40
131
Total Team Size*
17
9
Source: Fidelity International as at 31 December 2016. Each region defines the sector teams slightly differently to reflect local dynamics (e.g. Media in consumer or TMT, autos in consumer or industrials, Telecom in TMT or Utilities), the table overall is the best overall global fit to describe all of the roles (it is not perfect for any region). Where analysts cover more than 1 sector they may appear in more than one box. TMT stands for Telecommunications, Media and Technology. Data is unaudited. *Total team size regional breakdown excludes shorting and technical analysts, overall total includes these analysts.
156 Total roles (from regional breakdown):
Analysts in multiple sectors/roles:
10
141 Total Analyst Headcount:
25
16
5
2
Single platform team, structured by region then sector

2. Outlook

| 8 FF Global Financial Services Fund
1,2%
1,4%
1,6%
1,8%
2,0%
2,2%
2,4%
2,6%
2,8%
Mai
-14
Ago-
14
Nov
-14
Fev-
15
Jun-
15
Set-1
5
Dez
-15
Mar
-16
Jul-1
6
Out
-16
Jan-
17
US 10-Year Treasury Note yield
75
80
85
90
95
100
105
Mai
-14
Ago-
14
Nov
-14
Fev-
15
Jun-
15
Set-1
5
Dez
-15
Mar
-16
Jul-1
6
Out
-16
Jan-
17
US Dollar Index (DXY)
Source: Datastream, January 2017.
From loose monetary & tight fiscal policy, to tight monetary & loose fiscal policy
US 10-Year Treasury Note yield US Dollar Index
Source: Datastream, January 2017.

| 9 FF Global Financial Services Fund
Europe: Cyclical recovery with political risk
Citigroup Eurozone Economic Surprise Index
Source: Citigroup Global Markets, Bloomberg, 31 January 2017. The Citi Economic Surprise Index measure data surprises relative to market expectations. A positive reading means that data releases have been stronger than expected and a negative reading means that data releases have been worse than expected.
-150
-100
-50
0
50
100
150
Dez
-09
Mai
-10
Out
-10
Mar
-11
Ago-
11
Jan-
12
Jun-
12
Nov
-12
Abr-
13
Set-1
3
Fev-
14
Jul-1
4
Dez
-14
Mai
-15
Out
-15
Mar
-16
Ago-
16
Jan-
17
Economic Surprise Index - Eurozone

| 10 FF Global Financial Services Fund
Source: Datastream, January 2017
China: Rebalancing & incremental tightening
2,5
3,0
3,5
4,0
4,5
5,0
Fev-
16
Mar
-16
Abr-
16
Mai
-16
Jun-
16
Jul-1
6
Ago-
16
Set-1
6
Out
-16
Nov
-16
Dez
-16
Jan-
17
China 1-month repo rate
China 1-month repo rate

| 11 FF Global Financial Services Fund
Japan: Continued reflation
Bank of Japan monetary base
Source: Bank of Japan, Bloomberg, 31 January 2017. This concept tracks notes and coins in circulation plus minimum reserves that credit institutions hold with the central bank. It is sometimes also referred to as base money.
20
70
120
170
220
270
320
370
420
470
Jul-9
6
Nov
-97
Mar
-99
Jul-0
0
Nov
-01
Mar
-03
Jul-0
4
Nov
-05
Mar
-07
Jul-0
8
Nov
-09
Mar
-11
Jul-1
2
Nov
-13
Mar
-15
Jul-1
6
BOJ monetary base, JPY trillions
95
100
105
110
115
120
125
130
Fev-
15
Mar
-15
Abr-
15
Mai
-15
Jun-
15
Jul-1
5 Ag
o-15
Se
t-15
Out
-15
Nov
-15
Dez
-15
Jan-
16
Fev-
16
Mar
-16
Abr-
16
Mai
-16
Jun-
16
Jul-1
6 Ag
o-16
Se
t-16
Out
-16
Nov
-16
Dez
-16
Jan-
17
USDJPY
USDJPY
Sep 16: BoJ Governor Kuroda states ‘no limit to monetary policy’ in efforts to beat deflation

| 12 FF Global Financial Services Fund
M1 Money Supply
Source: Datastream, 31 December 2016.
6m %
cha
nge
Liquidity cycle has peaked
0
2
4
6
8
10
12
14
16
18
Jul-1
5
Ago-
15
Set-1
5
Out
-15
Nov
-15
Dez
-15
Jan-
16
Fev-
16
Mar
-16
Abr-
16
Mai
-16
Jun-
16
Jul-1
6
Ago-
16
Set-1
6
Out
-16
Nov
-16
Dez
-16
Eurozone Japan US UK China

| 13 FF Global Financial Services Fund
Source: DataStream, 31 January 2017
Bond yields rebounding from generational low
G7 average 10-year government bond yield %
0,5%
1,5%
2,5%
3,5%
4,5%
5,5%
2001
2002
2003
2004
2005
2006
2007
2008
2009
2010
2011
2012
2013
2014
2015
2016
2017
G7 Benchmark Bond Yield
Rising inequality and populism to drive fiscal spending
Rising protectionism to slow speed of globalisation
Increased spending to absorb more excess savings
Combination of reflation and fiscal spending to ultimately steepen the yield curve
3. Why Financials?
| 15 FF Global Financial Services Fund
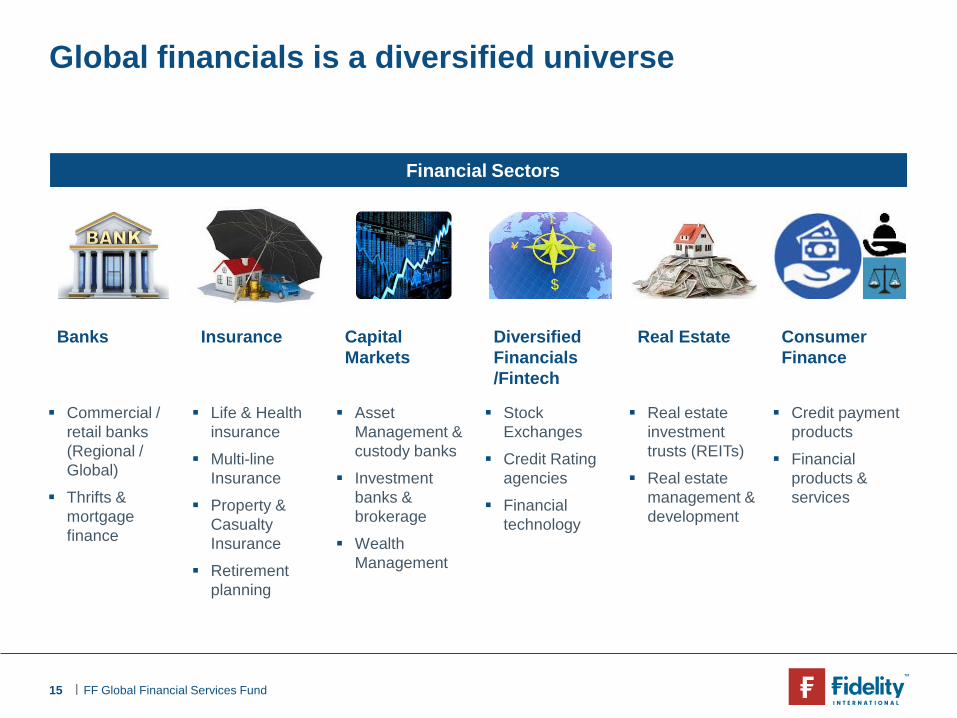
Global financials is a diversified universe
Financial Sectors
Banks
Commercial / retail banks (Regional / Global)
Thrifts & mortgage finance
Insurance
Life & Health insurance
Multi-line Insurance
Property & Casualty Insurance
Retirement planning
Capital Markets
Asset Management & custody banks
Investment banks & brokerage
Wealth Management
Diversified Financials /Fintech
Stock Exchanges
Credit Rating agencies
Financial technology
Real Estate
Real estate investment trusts (REITs)
Real estate management & development
Consumer Finance
Credit payment products
Financial products & services

| 16 FF Global Financial Services Fund
5%
6%
7%
8%
9%
10%
11%
2005
2006
2007
2008
2009
2010
2011
2012
2013
2014
2015
E
2016
E
2017
E
EU Banks US Banks
EU Banks
US Banks
Source: Autonomous, company data, July 2015.
Regulation has strengthened financials
Historical Common Equity Tier 1 Ratios
Source: Datastream, Bloomberg. Total return , rebased to 100 from 31 December 2012 to 31 August 2016. ‘Well Capitalised Banks’ composite index comprises all global banks with minimum market cap $35bn as of 31 January 2016 with Tier 1 Common Equity Ratios >10%. Market cap weighted as of 31 January 2016.
Performance of Well Capitalized Banks
Well Capitalized Banks
MSCI AC World Financials
MSCI AC World Banks
80
90
100
110
120
130
140
150
Dez
12
Fev
13
Abr 1
3 Ju
n 13
Ag
o 13
O
ut 1
3 D
ez 1
3 Fe
v 14
Ab
r 14
Jun
14
Ago
14
Set 1
4 N
ov 1
4 Ja
n 15
M
ar 1
5 M
ai 1
5 Ju
l 15
Set 1
5 N
ov 1
5 Ja
n 16
M
ar 1
6 M
ai 1
6 Ju
n 16
Ag
o 16
Well Capitalized Banks MSCI ACWI Financials
MSCI ACWI Banks

| 17 FF Global Financial Services Fund
0
50
100
150
200
250
Dez
12
Fev
13
Mar
13
Abr 1
3 Ju
n 13
Ju
l 13
Ago
13
Out
13
Nov
13
Dez
13
Fev
14
Mar
14
Abr 1
4 Ju
n 14
Ju
l 14
Ago
14
Out
14
Nov
14
Dez
14
Jan
15
Mar
15
Abr 1
5 M
ai 1
5 Ju
l 15
Ago
15
Set 1
5 N
ov 1
5 D
ez 1
5 Ja
n 16
M
ar 1
6 Ab
r 16
Mai
16
Jul 1
6 Ag
o 16
Se
t 16
Out
16
Dez
16
Jan
17
Fintech Composite Index MSCI AC World Financials
Source: Datastream, ‘Fintech Composite Index’ comprises 21 largest ‘Fintech’ companies as defined by www.dailyfintech.com, Index is Equal weighted. Price Index returns from 31 December 2012 to 31 January 2017.
Fintech creating new opportunities
Performance return from 31 December 2012 to 31 January 2017

| 18 FF Global Financial Services Fund
Source: Fidelity International. These are a selection of themes in the portfolio.
Several positive value drivers
Improving shareholder returns as less capital needs to be retained
Political resistance to further Basel initiatives for the banks, and an easing of US regulatory pressure post election
Several pockets of value
Easing regulatory headwinds as capital ratios adjust to higher standards
Improving loan growth
Rising bond yields to support margins

| 19 FF Global Financial Services Fund
Source: Fidelity International. These are a selection of themes in the portfolio.
Themes in the portfolio
Selected Emerging Markets Rebound in manufacturing and search for yield
Residential Property Demographics, attractive supply/demand, search for yield
Exchanges A relatively non-cyclical source of diversified returns
Beneficiaries of easing regulation Notably in the US, where the new administration is less keen to add to regulation
Financial Technology Opportunities arising from technological disruptions
Rate Sensitivity Where the market does not price upside from higher yields

4. Investment philosophy & process
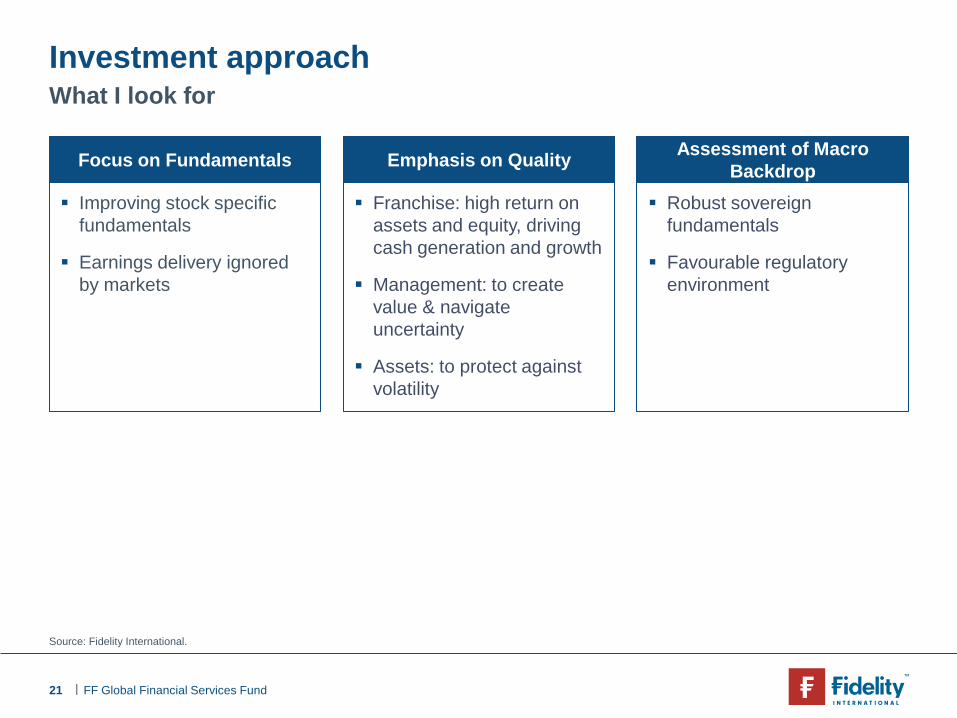
| 21 FF Global Financial Services Fund
Improving stock specific fundamentals
Earnings delivery ignored by markets
Franchise: high return on assets and equity, driving cash generation and growth
Management: to create value & navigate uncertainty
Assets: to protect against volatility
Emphasis on Quality
Robust sovereign fundamentals
Favourable regulatory environment
Assessment of Macro Backdrop
What I look for Investment approach
Source: Fidelity International.
Focus on Fundamentals Emphasis on Quality

| 22 FF Global Financial Services Fund
Idea generation
Fidelity research
Regional and global portfolio managers
Conferences
Third party research
Investment themes and screens
Research & analysis
Fundamental and technical research
Analysis of historic performance, industry and competitor dynamics
Industry reviews and thematic research
Management meetings
Formulation of investment thesis
Portfolio construction
Risk evaluation
Regional & thematic exposure
Style analysis
In depth analysis, fund fit, contribution to risk Investment Process
Source: Fidelity International.
Buy/Sell discipline
Price targets
Investment thesis monitoring
Ongoing company dialogue
Long term winners Special situations Earnings upgrades Forgotten / Out-of-favour

| 23 FF Global Financial Services Fund
Source: Fidelity International.
Research & analysis – a detailed approach Investment analysis
Stock specific fundamentals
Liquidity/ funding
Margins
Capital
Credit cost
Competition
Management track record
Improving ROA,ROE
Macro background & scenarios
Interest rate cycle
Property market
Health of sovereign
Economic growth
Inflation outlook
Regulation
Penetration potential
Market structure
Valuation
Price/Tangible book
Price/ Earnings
Price/ Pre-provision profits
Dividend yields
Discounted cash flow
Are the stock’s fundamentals improving? Is this reflected in its valuation?

| 24 FF Global Financial Services Fund
Source: Fidelity International.
Buy Discipline
Buy/Sell discipline
1 Stock has reached target price - Bull/Bear thesis review identifies no further upside
2 Investment thesis broken – Business likely to experience deterioration in fundamentals
3 Adverse change in economic, regulatory, governance environment
1 Improving operating metrics and return on equity (ROE)
2 Strong balance sheet with adequate liquidity, reserves and capital
3 Operating in countries with sound macroeconomic drivers
4 Strong management track record achieving attractive returns for shareholders
Sell Discipline

| 25 FF Global Financial Services Fund
Risk Management
Source: Fidelity International.
The Fidelity governance framework
Quarterly Fund Review (QFR)
Forum
Investment Risk Oversight Committee Review (IROC)
Fund Review
Risk Monitoring
Quarterly
Monthly
Monthly
Daily
Responsibility
Head of Equities
Head of Investment Risk
Chief Investment Officer
Portfolio Manager
Investment Compliance
Risk Discussions
Performance Risk metrics including beta & tracking error Portfolio concentration Liquidity, active money, trading & Style factors
Ex-post & ex-ante tracking errors vs. target ranges Return distribution/risk model analysis Trading activity & compliance
Risk metrics including beta & tracking error as well as sources of Common Factor Risks
Consistency of risk/return Liquidity, active money & trading activity % Cash Held
Stock specific risk Tracking Error as well
as sources of Common Factor Risks
Daily monitoring of portfolio guidelines and constraints, regulatory requirements
Portfolio construction Sector/Regional allocation Position size & liquidity

5. Performance & positioning
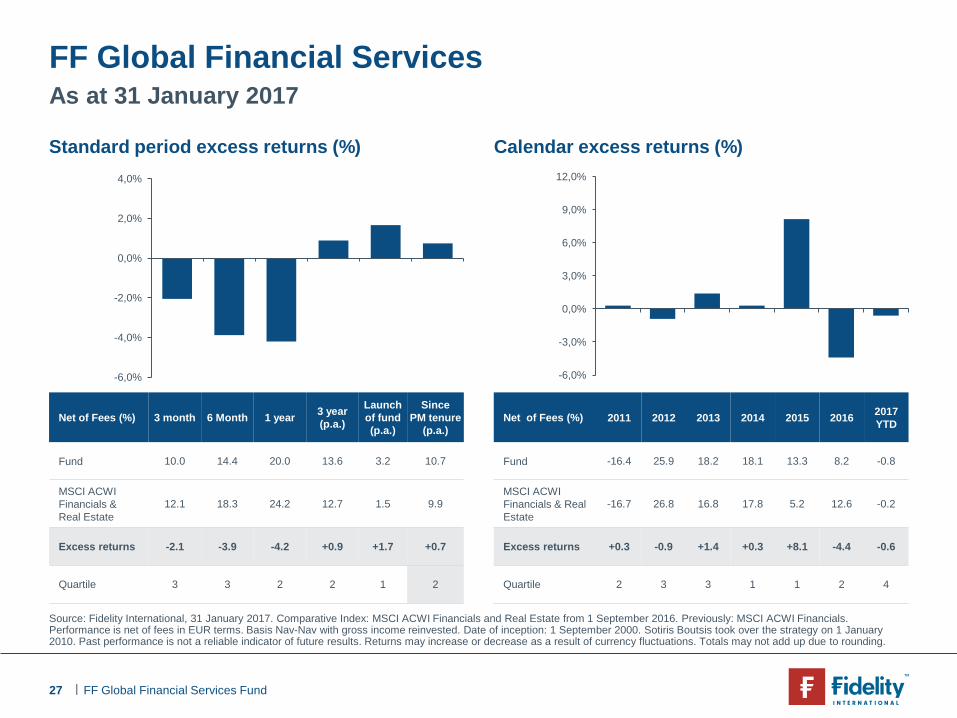
| 27 FF Global Financial Services Fund
Source: Fidelity International, 31 January 2017. Comparative Index: MSCI ACWI Financials and Real Estate from 1 September 2016. Previously: MSCI ACWI Financials. Performance is net of fees in EUR terms. Basis Nav-Nav with gross income reinvested. Date of inception: 1 September 2000. Sotiris Boutsis took over the strategy on 1 January 2010. Past performance is not a reliable indicator of future results. Returns may increase or decrease as a result of currency fluctuations. Totals may not add up due to rounding.
As at 31 January 2017 FF Global Financial Services
Calendar excess returns (%) Standard period excess returns (%)
-6,0%
-4,0%
-2,0%
0,0%
2,0%
4,0%
-6,0%
-3,0%
0,0%
3,0%
6,0%
9,0%
12,0%
Net of Fees (%) 3 month 6 Month 1 year 3 year (p.a.)
Launch of fund (p.a.)
Since PM tenure
(p.a.)
Fund 10.0 14.4 20.0 13.6 3.2 10.7
MSCI ACWI Financials & Real Estate
12.1 18.3 24.2 12.7 1.5 9.9
Excess returns -2.1 -3.9 -4.2 +0.9 +1.7 +0.7
Quartile 3 3 2 2 1 2
Net of Fees (%) 2011 2012 2013 2014 2015 2016 2017 YTD
Fund -16.4 25.9 18.2 18.1 13.3 8.2 -0.8
MSCI ACWI Financials & Real Estate
-16.7 26.8 16.8 17.8 5.2 12.6 -0.2
Excess returns +0.3 -0.9 +1.4 +0.3 +8.1 -4.4 -0.6
Quartile 2 3 3 1 1 2 4

| 28 FF Global Financial Services Fund
Sector, regional and stock level – 3 months to 31 January 2017 Attribution
Source: Fidelity International, 31 January 2017. Comparative Index: MSCI ACWI Financials and Real Estate since 1 September 2016. Previously: MSCI ACWI Financials. Performance is gross of fees in EUR terms. Past performance is not a reliable indicator of future results. Returns may increase or decrease as a result of currency fluctuations.
Company Industry Region Avg rel. weight (%)
Contribution (bps)
Huntington Banc. Banks N. America 1.4 25.6
Goldman Sachs Capital Markets N. America 0.8 18.0
Morgan Stanley Capital Markets N. America 1.0 15.1
JPMorgan Chase Banks N. America 1.3 14.8
Fifth Third Bancorp Banks N. America 1.2 14.4
Sony Finl. Insurance Japan 1.0 12.8
Mitsubishi Banks Japan 0.8 11.8
Comerica Banks N. America 0.2 10.0
Deutsche Boerse Capital Markets Europe ex UK 0.1 9.8
Simon Ppty - REIT Equity REITS N. America -0.7 8.4
American Tower Equity REITS N. America 0.9 -28.4
Orix Div. Financial Svcs Japan 1.5 -25.8
Bank Of America Banks N. America -0.9 -22.1
Fleetcor Technologies IT Services N. America 0.1 -19.5
AIA Insurance Pacific ex Jp. 1.3 -19.3
Suruga Bank Banks Japan 0.9 -18.6
Sun Hung Kai Prop. Real Estate Mgmt Pacific ex Jp. 0.7 -16.8
Visa IT Services N. America 0.4 -15.4
FNF Insurance N. America 0.2 -15.1
Broadridge Fin. Sol. IT Services N. America 1.2 -14.5
-1.0% -0.5% 0.0% 0.5% 1.0%Stock selection Industry selection Total relative contribution
Region name Avg rel. weight (%) Contribution (%)
Total
Cash & Others
North America
UK
Pacif ic ex Jp.
Japan
Europe ex UK
EM
5.1
-1.3
0.7
-1.5
1.0
0.0
-3.8
Industry attribution: Top 5 / Bottom 5
Regional attributions
Stock level
Cash & OthersIT ServicesBanksDiv. Financial SvcsConsumer FinanceProf. ServicesReal Estate Mgmt Mortgage REITSThrifts & Mtge Fin.Equity REITSCapital Markets
5.12.83.40.1-0.20.2-0.8-0.2-0.5-5.4-4.9
Industry name Avg rel.weight (%) Contribution (%)
-2.0% -1.5% -1.0% -0.5% 0.0% 0.5% 1.0%Stock selection Country selection Currency selection Total rel. contribution

| 29 FF Global Financial Services Fund
Sector, regional and stock level – 6 months to 31 January 2017 Attribution
Source: Fidelity International, 31 January 2017. Comparative Index: MSCI ACWI Financials and Real Estate since 1 September 2016. Previously: MSCI ACWI Financials. Performance is gross of fees in EUR terms. Past performance is not a reliable indicator of future results. Returns may increase or decrease as a result of currency fluctuations.
Company Industry Region Avg rel. weight (%)
Contribution (bps)
DNB ASA Banks Europe ex UK 1.3 34.4
Simon Ppty - REIT Equity REITS N. America -0.8 31.5
Huntington Banc. Banks N. America 1.0 31.5
Fifth Third Bancorp Banks N. America 1.2 28.4
Morgan Stanley Capital Markets N. America 0.8 25.8
JPMorgan Chase Banks N. America 1.6 23.6
BNP Paribas Banks Europe ex UK 1.3 20.3
Comerica Banks N. America 0.3 16.3
KBC Banks Europe ex UK 0.6 14.4
Nordea Bank Banks Europe ex UK 0.8 14.3
Grand City Properties Real Estate Mgmt Europe ex UK 1.1 -55.7
American Tower Equity REITS N. America 1.4 -36.7
Broadridge Fin. Sol. IT Services N. America 1.6 -34.0
Goodman Stapled Unit Equity REITS Pacific ex Jp. 1.1 -32.2
Bank Of America Banks N. America -0.9 -32.2
Scentre Stapled Unit Equity REITS Pacific ex Jp. 0.4 -30.2
LEG Immobilien Real Estate Mgmt Europe ex UK 0.6 -29.9
Vonovia Real Estate Mgmt Europe ex UK 0.7 -28.6
AIA Insurance Pacific ex Jp. 1.5 -24.2
FNF Insurance N. America 0.5 -23.2
-3.0% -2.0% -1.0% 0.0% 1.0%Stock selection Country selection Currency selection Total rel. contribution
Region name Avg rel. weight (%) Contribution (%)
Total
Cash & Others
Europe ex UK
UK
Pacif ic ex Jp.
EM
Japan
North America
4.0
1.7
0.3
-0.6
-3.8
0.4
-2.1
Industry attribution: Top 5 / Bottom 5
Regional attribution
Stock level
Cash & OthersReal Estate Mgmt IT ServicesBanksInsuranceProf . ServicesCapital MarketsDiv. Financial SvcsMortgage REITSThrif ts & Mtge Fin.Equity REITS
4.01.14.61.5-2.60.5-3.90.3-0.2-0.5-3.6
Industry name Avg rel.weight (%) Contribution (%)
-1.5% -1.0% -0.5% 0.0% 0.5% 1.0% 1.5%Stock selection Sector allocation Total relative contribution
| 30 FF Global Financial Services Fund
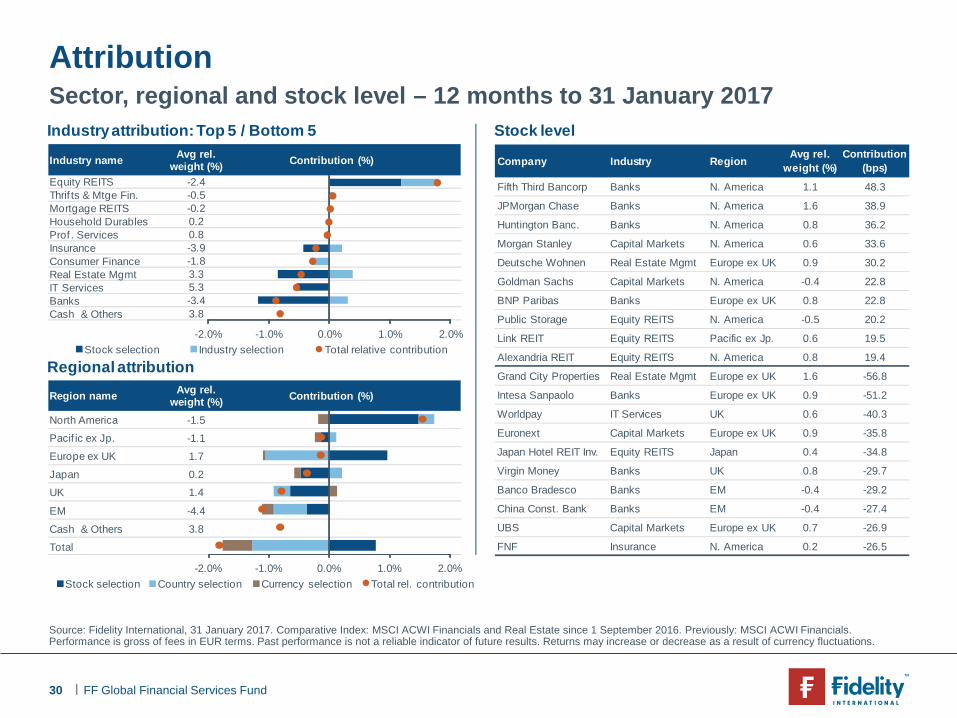
Sector, regional and stock level – 12 months to 31 January 2017 Attribution
Source: Fidelity International, 31 January 2017. Comparative Index: MSCI ACWI Financials and Real Estate since 1 September 2016. Previously: MSCI ACWI Financials. Performance is gross of fees in EUR terms. Past performance is not a reliable indicator of future results. Returns may increase or decrease as a result of currency fluctuations.
Company Industry Region Avg rel. weight (%)
Contribution (bps)
Fifth Third Bancorp Banks N. America 1.1 48.3
JPMorgan Chase Banks N. America 1.6 38.9
Huntington Banc. Banks N. America 0.8 36.2
Morgan Stanley Capital Markets N. America 0.6 33.6
Deutsche Wohnen Real Estate Mgmt Europe ex UK 0.9 30.2
Goldman Sachs Capital Markets N. America -0.4 22.8
BNP Paribas Banks Europe ex UK 0.8 22.8
Public Storage Equity REITS N. America -0.5 20.2
Link REIT Equity REITS Pacific ex Jp. 0.6 19.5
Alexandria REIT Equity REITS N. America 0.8 19.4
Grand City Properties Real Estate Mgmt Europe ex UK 1.6 -56.8
Intesa Sanpaolo Banks Europe ex UK 0.9 -51.2
Worldpay IT Services UK 0.6 -40.3
Euronext Capital Markets Europe ex UK 0.9 -35.8
Japan Hotel REIT Inv. Equity REITS Japan 0.4 -34.8
Virgin Money Banks UK 0.8 -29.7
Banco Bradesco Banks EM -0.4 -29.2
China Const. Bank Banks EM -0.4 -27.4
UBS Capital Markets Europe ex UK 0.7 -26.9
FNF Insurance N. America 0.2 -26.5
-2.0% -1.0% 0.0% 1.0% 2.0%Stock selection Industry selection Total relative contribution
Region name Avg rel. weight (%) Contribution (%)
Total
Cash & Others
EM
UK
Japan
Europe ex UK
Pacif ic ex Jp.
North America
3.8
-4.4
1.4
0.2
1.7
-1.1
-1.5
Industry attribution: Top 5 / Bottom 5
Regional attribution
Stock level
Cash & OthersBanksIT ServicesReal Estate Mgmt Consumer FinanceInsuranceProf . ServicesHousehold DurablesMortgage REITSThrif ts & Mtge Fin.Equity REITS
3.8-3.45.33.3-1.8-3.90.80.2-0.2-0.5-2.4
Industry name Avg rel.weight (%) Contribution (%)
-2.0% -1.0% 0.0% 1.0% 2.0%Stock selection Country selection Currency selection Total rel. contribution

| 31 FF Global Financial Services Fund
Sector, regional and stock level – Since tenure to 31 January 2017 Attribution
Source: Fidelity International, 31 January 2017. Comparative Index: MSCI ACWI Financials and Real Estate since 1 September 2016. Previously: MSCI ACWI Financials. Performance is gross of fees in EUR terms. Past performance is not a reliable indicator of future results. Returns may increase or decrease as a result of currency fluctuations. Date of inception: 1 September 2000. Sotiris Boutsis took over the strategy on 1 January 2010. Returns may increase or decrease as a result of currency fluctuations.
Company Industry Region Avg rel. weight (%)
Contribution (bps)
Aozora Bank Banks Japan 0.7 382.0
Ocwen Financial Thrifts & Mtge Fin. N. America 0.3 248.7
Nasdaq Capital Markets N. America 0.7 239.2
Central Pattana Public Real Estate Mgmt EM 0.3 235.7
Shinsei Bank Banks Japan 0.2 225.7
Chubb Insurance N. America 0.7 211.6
Banco Santander Banks Europe ex UK -1.1 209.9
Affiliated Managers Capital Markets N. America 1.0 198.9
Orix Div. Financial Svcs Japan 1.4 178.7
Mastercard IT Services N. America 0.5 173.5
Aeon Mall Real Estate Mgmt Japan 0.7 -190.0
Regions Financial Banks N. America 0.3 -182.3
ING Group Banks Europe ex UK 0.2 -178.8
Berkshire Hathaway Div. Financial Svcs N. America -1.2 -137.8
Wells Fargo Banks N. America -0.1 -133.3
AXA Insurance Europe ex UK -0.3 -126.1
American Express Consumer Finance N. America -0.5 -111.0
Citigroup Banks N. America 1.4 -108.1
AP Thailand NVDR Real Estate Mgmt EM 0.1 -99.0
Canadian Imp. Bank Banks N. America 0.1 -98.0
-5.0% 0.0% 5.0% 10.0% 15.0%Stock selection Sector allocation Total relative contribution
Region name Avg rel. weight (%) Contribution (%)
Total
Cash & Others
Pacif ic ex Jp.
Japan
Europe ex UK
UK
North America
EM
3.3
-3.8
0.1
-0.6
3.2
-2.0
-0.2
Industry attribution: Top 5 / Bottom 5
Regional attribution
Stock level
Cash & OthersConsumer FinanceDiversif ied TelcoIndust. Conglom. Mortgage REITSHousehold DurablesEquity REITSIT ServicesReal Estate Mgmt Capital MarketsBanks
-2.40.10.10.4-0.30.2-1.63.02.52.1-6.0
Industry name Avg rel.weight (%) Contribution (%)
-20.0% 0.0% 20.0% 40.0% 60.0%Stock selection Country selection Currency selection Total rel. contribution
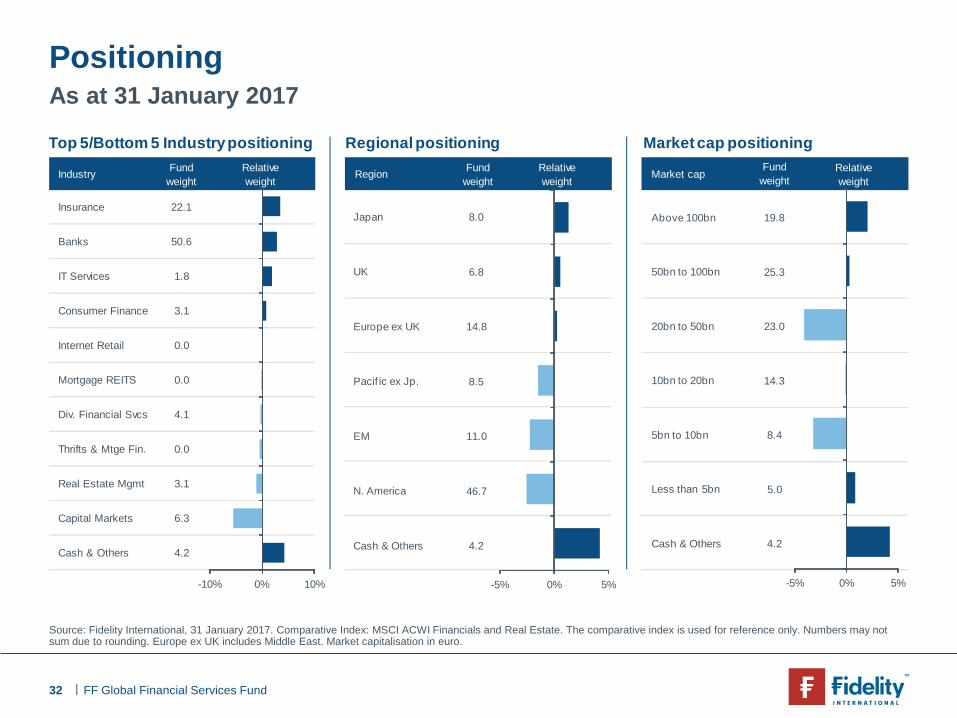
| 32 FF Global Financial Services Fund
Source: Fidelity International, 31 January 2017. Comparative Index: MSCI ACWI Financials and Real Estate. The comparative index is used for reference only. Numbers may not sum due to rounding. Europe ex UK includes Middle East. Market capitalisation in euro.
As at 31 January 2017 Positioning
Industry Fund weight
Relative weight
Region Fund weight
Relative weight
Market capFund
weight Relative weight
Insurance 22.1
Banks 50.6
IT Services 1.8
Consumer Finance 3.1
Internet Retail 0.0
Mortgage REITS 0.0
Div. Financial Svcs 4.1
Thrifts & Mtge Fin. 0.0
Real Estate Mgmt 3.1
Capital Markets 6.3
Cash & Others 4.2
UK
Europe ex UK
Pacif ic ex Jp.
N. America
EM
Cash & Others
Japan 8.0
6.8
14.8
8.5
46.7
11.0
4.2
Above 100bn
50bn to 100bn
20bn to 50bn
10bn to 20bn
Less than 5bn
5bn to 10bn
Cash & Others
19.8
25.3
23.0
14.3
5.0
8.4
4.2
-5% 0% 5%
Top 5/Bottom 5 Industry positioning Regional positioning Market cap positioning
-10% 0% 10% -5% 0% 5%

| 33 FF Global Financial Services Fund
As at 31 January 2017 Positioning
Source: Fidelity International, 31 January 2017. Comparative Index: MSCI ACWI Financials and Real Estate. The comparative index is used for reference only. Numbers may not sum due to rounding. Europe ex UK includes Middle East.
Security Name Industry Country Fund (%) Index (%) Relative (%)
Discover Fin. Svcs. Consumer Finance USA 2.0% 0.3%
Australia & Nz. Banking Banks Australia 2.3% 0.8%
Sony Finl. Insurance Japan 1.6% 0.0%
Sberbank Russia Banks Russia 1.8% 0.4%
GGP Equity REITS USA 1.5% 0.2%
Huntington Bancshares Banks USA 1.5% 0.2%
AIA Insurance Hong Kong 2.2% 0.9%
Orix Div. Financial Svcs Japan 1.4% 0.2%
Beazley Insurance UK 1.2% 0.0%
Metlife Insurance USA 1.7% 0.6%
PNC Financial Services Banks USA 0.0% 0.7%
UBS Capital Markets Switzerland 0.0% 0.7%
American Express Consumer Finance USA 0.0% 0.7%
Chubb Capital Markets USA 0.0% 0.7%
National Australia Bank Banks Australia 0.0% 0.7%
Westpac Banking Banks Australia 0.0% 1.0%
Banco Santander (Spain) Banks Spain 0.0% 1.0%
Bank Of America Banks USA 1.7% 2.8%
Toronto-Dominion Bank Banks Canada 0.0% 1.1%
Commonwealth Bk Of Australia Banks Australia 0.0% 1.3%
1.7%
1.6%
1.5%
1.4%
1.4%
1.3%
1.3%
1.2%
1.2%
1.1%
-0.7%
-0.7%
-0.7%
-0.7%
-0.7%
-1.0%
-1.0%
-1.0%
-1.1%
-1.3%
Top 10 / Bottom 10 Relative Positions

| 34 FF Global Financial Services Fund
c. 55 -75 stocks
The fund typically holds higher growth names than the MSCI AC
World Financials (N) benchmark.
Source: Fidelity International, 31 January 2017; Benchmark: MSCI ACWI Financials and Real Estate. The FF Global Financials Fund has been run through Barra analysis to give an indication of what the volatility key metrics would look like for this discipline. 1) Active money includes cash. 2) Tracking error is ex-ante. Holdings will vary from the index quoted. For this reason, the comparison index is used for reference only.
Key portfolio metrics – as at 31 January 2017 Fidelity Funds Global Financial Services
Beta 0.99
Number of stocks 81
Active Money1 60.9%
Tracking Error2 1.8%
Annual Turnover 59.2%
Largest stock position 4.7%
1 Yr Est. Earnings Growth %
Fund: Benchmark:
17.5% 16.4%
Active money > 70%
Tracking error guidelines 2-4%
Turnover has trended downwards
| 35 FF Global Financial Services Fund
Important Information This information is for Investment Professionals only and should not be relied upon by private investors. It must not be reproduced or circulated without prior permission. This communication is not directed at, and must not be acted upon by persons inside the United States and is otherwise only directed at persons residing in jurisdictions where the relevant funds are authorised for distribution or where no such authorisation is required. Research professionals include both analysts and associates. Fidelity International refers to the group of companies which form the global investment management organisation that provides information on products and services in designated jurisdictions outside of North America. Fidelity International does not offer investment advice based on individual circumstances. Any service, security, investment, fund or product mentioned or outlined in this document may not be suitable for you and may not be available in your jurisdiction. It is your responsibility to ensure that any service, security, investment, fund or product outlined is available in your jurisdiction before any approach is made to Fidelity International. This document may not be reproduced or circulated without prior permission. Past performance is not a reliable indicator of future results. Unless otherwise stated all products are provided by Fidelity International, and all views expressed are those of Fidelity International.Reference in this document to specific securities should not be interpreted as a recommendation to buy or sell these securities, but is included for the purposes of illustration only. Investors should also note that the views expressed may no longer be current and may have already been acted upon by Fidelity. The research and analysis used in this documentation is gathered by Fidelity for its use as an investment manager and may have already been acted upon for its own purposes. Fidelity, Fidelity International, the Fidelity International logo and F symbol are trademarks of FIL Limited. Fidelity Funds is an open-ended investment company established in Luxembourg with different classes of shares. Reference to FF before a fund name refers to Fidelity Funds. Fidelity only offers information on products and services and does not provide investment advice based on an individual's circumstances. The value of investments can go down as well as up and investors may not get back the amount invested. For funds that invest in overseas markets, changes in currency exchange rates may affect the value of an investment. Foreign exchange transactions may be effected on an arm's length basis by or through Fidelity companies from which a benefit may be derived by such companies. Past performance is not a reliable indicator of future results. This document may not be reproduced or circulated without prior permission. No statements or representations made in this document are legally binding on Fidelity or the recipient. Data Source – © 2016 Morningstar, Inc. All Rights Reserved. The information contained herein: (1) is proprietary to Morningstar and/or its content providers; (2) may not be copied or distributed; and (3) is not warranted to be accurate, complete or timely. Neither Morningstar nor its content providers are responsible for any damages or losses arising from any use of this information. Germany: Investments should be made on the basis of the current prospectus and/or the Key Investor Information Document (KIID), which is available along with the current annual and semi-annual reports free of charge from FIL Investment Services GmbH, Postfach 200237, 60606 Frankfurt/Main or www.fidelity.de. Issued by FIL Investment Services GmbH. Austria: Investments should be made on the basis of the current prospectus and/or the Key Investor Information Document (KIID), which is available along with the current annual and semi-annual reports free of charge from FIL (Luxembourg) S.A, Kastanienhöhe 1, D-61476 Kronberg im Taunus, Germany; as well as with the Austrian paying agent UniCredit Bank Austria AG, Vordere Zollamtstrasse 13, A-1030 Wien, FIL (Luxembourg) S.A. – Zweigniederlassung Wien, Mariahilfer Strasse 36, 1070 Wien or www.fidelity.at. Malta: Investments should be made on the basis of the current prospectus / the Key Investor Information Document (KIID), which is available along with the current annual and semi-annual reports free of charge from Growth Investments Limited, which is licensed by the MFSA. Fidelity Funds is promoted in Malta by Growth Investments Ltd in terms of the EU UCITS Directive and Legal Notices 207 and 309 of 2004. The Funds are regulated in Luxembourg by the Commission de Surveillance du Secteur Financier. Switzerland: We recommend you obtain detailed information before taking any investment decision. Investments should be made on the basis of the current prospectus and KIID (key investor information document), which is available along with the current annual and semi-annual reports free of charge from our distributors, from our European Service Centre in Luxembourg and from our legal representative and paying agent in Switzerland: BNP Paribas Securities Services, Paris, succursale de Zurich, Selnaustrasse 16, 8002 Zurich. Issued by FIL Investment Switzerland AG, authorised and regulated in Switzerland by the Swiss Financial Market Supervisory Authority. Italy: Please contact your financial advisor or the local branch of your bank in Italy. Spain: For the purposes of distribution in Spain, Fidelity Funds, Fidelity Funds II, Fidelity Active Strategy and Fidelity Alpha Funds SICAV are registered with the CNMV Register of Foreign Collective Investment Schemes under registration numbers 124, 317, 649 and 1298 respectively, where complete information is available from Fidelity Funds, Fidelity Funds II, Fidelity Active Strategy SICAV and Fidelity Alpha Funds SICAV’s authorised distributors. The purchase of or subscription for shares in Fidelity Funds, Fidelity Funds II, Fidelity Active Strategy and Fidelity Alpha Funds SICAV shall be made on the basis of the Key Investor Information Document (KIID) that investors shall receive in advance. The Key Investor nformation Document (KIID) is available free of charge and for inspection at the offices of locally authorised distributors as well as at the CNMV. Portugal: In Portugal, Fidelity Funds are registered with the CMVM and the legal documents can be obtained from locally authorised distributors. United Kingdom: Please note that not all funds in the SICAV fund range are suitable for UK investors and tax advice should be sought before investing. Fidelity Funds are recognised under section 264 of the Financial Services and Markets Act 2000 as amended by Rule 2(24) of the Undertakings for Collective Investment in Transferable Securities (UCITS) Regulations 2011. Investors should note that loss caused by such recognised funds will not be covered by the provisions of the Financial Services Compensation Scheme (or by any similar scheme in Luxembourg) if the fund is unable to meet its obligations, however claims for loss in regards to such recognised funds against a Financial Conduct Authority-authorised firm such as Fidelity will be. The full prospectus and Key Investor Information Document (KIID) for these funds are available from Fidelity on request by calling 0800 414 181. The UK distributor of Fidelity Funds is FIL Investments International. The Netherlands: Investments should be made on the basis of the current prospectus and KIID (key investor information document), which is available along with the current annual and semi-annual reports free of charge from our distributors, from our European Service Centre in Luxembourg, FIL (Luxembourg) S.A. 2a, rue Albert Borschette BP 2174 L-1021 Luxembourg (tel. 0800 – 022 47 09). In the Netherlands, documents are available from FIL (Luxembourg) S.A., Netherlands Branch (registered with the AFM), World Trade Centre, Tower H, 6th Floor, Zuidplein 52, 1077 XV Amsterdam (tel. 0031 20 79 77 100). [Fidelity Funds/Fidelity Funds II] is authorised to offer participation rights in the Netherlands pursuant to article 2:66 (3) in conjunction with article 2:71 and 2:72 Financial Supervision Act. Belgium: We recommend that you obtain detailed information before taking any investment decision. Investments should be made on the basis of the current Key Investor Information Document (KIID) and prospectus, which are available along with the current annual and semi-annual reports free of charge from our distributors, from FIL (Luxembourg) S.A. and the financial service provider in Belgium, CACEIS België NV, with head office at Havenlaan 86C, B320, 1000 – Brussels. Poland: This information is for Investment Professionals in the meaning of the Annex II to the Directive 2004/39/EC of the European Parliament and of the Council of 21 April 2004 on markets in financial instruments amending Council Directives 85/611/EEC and 93/6/EEC and Directive 2000/12/EC of the European Parliament and of the Council and repealing Council Directive 93/22/EEC only and should not be distributed to and relied upon by private investors. This material does not constitute a recommendation within the meaning of the Regulation of the Polish Minister of Finance Regarding Information Constituting Recommendations Concerning Financial Instruments or Issuers Thereof dated October 19, 2005. No statements or representations made in this document are legally binding on Fidelity or the recipient and not constitute an offer within the meaning of the Polish Civil Code Act of 23 April 1964. We recommend that you obtain detailed information before taking any investment decision. Investments should be made on the basis of the current prospectus, KIID (key investor information document) and Additional Information for Investors, which is available along with the current annual and semi-annual reports free of charge from our distributors, from our European Service Centre in Luxembourg FIL (Luxembourg) S.A. 2a, rue Albert Borschette BP 2174 L-1021 Luxembourg and the representative office in Poland. Czech Republic: Investments can only be made on the basis of the current prospectus/Key Investor Information Document (KIID), which is available along with the current annual and semi-annual reports free of charge from our European Service Centre in Luxembourg (FIL (Luxembourg) S.A., 2a, rue Albert Borschette, BP 2174, L-1021, Luxembourg) and from our paying agent UniCredit Bank Czech Republic a.s., Zeletavska 1525/1, 14092 Prag 4 - Michle, Czech Republic. The KIID is available in Czech language. Hungary: Investments can only be made on the basis of the current prospectus/Key Investor Information Document (KIID), which is available along with the current annual and semi-annual reports free of charge from our distributor Raifeisenbank Zentralbank Österreich AG, Akademia u. 6, 1054 Budapest. The KIID is available in Hungarian language. Slovakia: Investments can only be made on the basis of the current prospectus/Key Investor Information Document (KIID), which is available along with the current annual and semi-annual reports free of charge from our European Service Centre in Luxembourg (FIL (Luxembourg) S.A., 2a, rue Albert Borschette, BP 2174, L-1021, Luxembourg) and from our paying agent UniCredit Bank Slovakia, a.s., Sancova 1/A 81333, Slovakia. The KIID is available in Slovak language. Issued by FIL Investments International (FCA registered number 122170) a firm authorised and regulated by the Financial Conduct Authority, FIL
GLEMUS2196-0517
(Luxembourg) S.A., authorised and supervised by the CSSF (Commission de Surveillance du Secteur Financier) and FIL Investment Switzerland AG, authorised and supervised by the Swiss Financial Market Supervisory Authority FINMA. Hong Kong: Please refer to the relevant offering documents for further information including the risk factors. If Investment returns are not denominated in HKD/ USD, US/HK dollar-based investors are exposed to exchange rate fluctuations. The material is issued by FIL Investment Management (Hong Kong) Limited and it has not been reviewed by the Securities and Futures Commission (“SFC”). Korea: This document is for intermediaries’ internal use only (or institutional investor) and not for external distribution or fund promotion. All external distribution, amendment and variation of this information require prior written approval from Fidelity International. Fidelity International is not responsible for any errors or omissions relating to specific information provided by third parties. All views may have changed due to market movements or other circumstances thereafter. Please read the (simplified) prospectus thoroughly before you subscribe to any specific fund. Profit or loss that can be incurred in accordance to outcome of management and currency exchange fluctuation is reverted to investors. Past performance is no guarantee of future returns. The investment is not protected by Korea Deposit Insurance Corporation under Investor Protection Act. Investment involves risks. Funds investing in foreign markets are open to risks related to country’s market, political and economic conditions which may cause loss on asset value. Fidelity, Fidelity International, the Fidelity International logo and F symbol are trademarks of FIL Limited. Singapore: FIL Investment Management (Singapore) Limited [“FIMSL”] (Co. Reg. No.: 199006300E) is the representative for the fund(s) offered in Singapore. Potential investors should read the prospectus, available from FIMSL, before investing in the fund(s).
Top Related