


Languages
Pages
Legal

Ferguson, Holly Jane (2018) Studies of the responses of cattle and sheep to
rapidly fermentable carbohydrate challenges. PhD thesis.
https://theses.gla.ac.uk/30652/
Copyright and moral rights for this work are retained by the author
A copy can be downloaded for personal non-commercial research or study,
without prior permission or charge
This work cannot be reproduced or quoted extensively from without first
obtaining permission in writing from the author
The content must not be changed in any way or sold commercially in any
format or medium without the formal permission of the author
When referring to this work, full bibliographic details including the author,
title, awarding institution and date of the thesis must be given
Enlighten: Theses
https://theses.gla.ac.uk/
Studies of the responses of cattle and sheep to rapidly fermentable
carbohydrate challenges
Holly Jane Ferguson
BSc (Hons)
Submitted in fulfilment of the requirements for the Degree of
Doctor of Philosophy (PhD)
Institute of Biodiversity, Animal Health and Comparative Medicine
College of Medical, Veterinary and Life Sciences
University of Glasgow
19th February 2018

i
Abstract
Subacute ruminal acidosis (SARA) occurs in ruminants following disruption of
normal ruminal fermentation and is commonly observed in cattle on diets that are
high in rapidly fermentable carbohydrate. SARA has been shown to lower
production efficiency of cattle and reported global economic implications of SARA
are consistently high. Individual animal responses to diets that are expected to
induce acidosis vary but specific mechanisms responsible for this variation are
unknown. This project examined the range of responses in variables commonly
associated with SARA among animals and among herds - reticuloruminal pH,
histamine and LPS, biochemistry and haematology and expression of inflammatory
related genes - with the aim of observing how individuals vary in response to a diet
expected to induce SARA.
The first trial detailed in this thesis involved the creation of a histological scoring
system for the ruminal mucosa of adult cattle, and the subsequent histological
examination of rumen wall tissue from animals (n = 195) from diverse management
styles and nutritional backgrounds (commercial grass-fed beef, commercial silage-
fed culled dairy, commercial mixed fed beef cattle (silage and concentrate),
commercial cereal-fed (barley beef) cattle and research cereal-fed beef (high
challenge)). Six beef farms were selected to provide broadly similar high and low-
risk profiles and were classified by risk (RISK) of developing SARA according to the
amount of concentrate in the diet (BARLEY), the proportion of particles <1.2 mm
(FINES) and the percentage of straw and silage in the diet. Risk and specific dietary
and management practices were related to histological scores and differences in
the severity or nature of selected response variables. Effect of farm of origin, RISK,
FINES and BARLEY were investigated. Farm of origin affected 32 of 33 dependent
variables, many more than the a priori risk category, BARLEY or FINES. Animals
on high-risk farms showed increased concentrations of reticuloruminal LPS and
lactate (p <0.01), thicker stratum corneum (SC) and stratum granulosum (SG) (p
<0.05), higher relative expression of TLR4 (p <0.05), reduced reticuloruminal short
chain fatty acid (SCFA) concentrations (p <0.05) and reduced caecal LPS
concentrations (p <0.05). Initial histological investigations were consistent with
previous light microscopic descriptions of the tissue architecture in the literature but
the consistent finding of increased SC and SG with increased BARLEY conflicted
with current literature. The scoring system was shown to be able to differentiate

ii
between animals according to their specific diet (p <0.001) or based on less specific
groupings of FORAGE or CONCENTRATE (p <0.05).
The second study investigated and quantified variation among individual animals in
their susceptibility to the effects of high levels of starch supplementation. The
efficacy of novel direct fed microbials (DFM) for the control of performance and
health effects related to the diet was also assessed. Forty lactating Holstein-Friesian
cattle were allocated to 5 groups and fed a basal ration for 3 weeks, a basal ration
plus a group-specific DFM for 3 weeks and then 2 weeks on a diet intended to induce
ruminal acidosis plus their allocated DFM. The challenge diet resulted in an increase
in variables associated with an inflammatory response; including increased plasma
concentrations of SAA (p <0.05), increased expression of the TLR4 and IFNγ genes
in peripheral blood leukocytes (p <0.01) and increased counts of monocytes in blood
(p <0.01). This inflammatory response occurred at the same time as an increase in
milk yield and an indication of improved energy balance with decreased βHB and
triglycerides (p <0.01). Reticuloruminal SCFA varied significantly with time-point (p
< 0.05). Total SCFA decreased when the DFM were introduced (p <0.05) and again
when the challenge diet was offered (p <0.01). Introduction of the DFM treatments
resulted in a significant increase in reticuloruminal pH values (p <0.001). The
challenge ration did not affect mean or median reticuloruminal pH values but did
increase the number of observations below pH 6.0 and increased the range of daily
mean pH observations. The study clearly showed that several variables associated
with an inflammatory response increased rapidly after challenge with a diet high in
rapidly fermentable carbohydrates and that this inflammatory response was evident
although there was an increase in milk yield, an improvement in the metabolic state
of most animals and a complete absence of clinical signs of acidosis.
The final study examined to what extent sheep should be used as a model for dietary
manipulation studies in cattle. Six cattle and 4 sheep were maintained on a basal
diet for 4 weeks, followed by 1 week on a diet intended to induce acidosis. Changes
in reticuloruminal pH, ruminal histology, SCFA proportions, reticuloruminal LPS and
histamine concentration and haematology and biochemistry were compared
between species. The trial provided baseline data on the comparative rumen
microbiome of both species using 16S rRNA sequencing. Both species showed
similar response patterns to the challenge diet, despite variations in the severity of
responses between species. Both species showed significant reductions in

iii
reticuloruminal pH (p <0.0001) following introduction of the challenge diets. Gene
expression levels were not significantly altered following the introduction of the
challenge diet for either species. The more substantial change in reticuloruminal pH
responses and the greater feed refusal in the sheep, relative to cattle, indicated that
the selected treatment rations were disproportionately challenging to the sheep.
Other than this, the observation that varied most between species was the 16S
rRNA results. Sheep showed a greater loss of diversity following the introduction of
the challenge diet. However, a common microbiome was observed and those sheep
which were not severely acidotic mirrored the cattle in their 16S results. With care
applied to the selection of challenge rations, the work described here suggests that
the use of sheep as a model for dietary manipulation studies in cattle is justifiable.
The key outcomes from this thesis were that an inflammatory type response in
various parameters may become evident before clinical symptoms in animals
suffering ruminal acidosis; that farm of origin has a more substantial effect on all
variables than the a priori risk classification or other measured dietary inputs; that
SCFA concentrations decreased in animals fed high carbohydrate diets; and that a
new scoring system for ruminal epithelium is capable of differentiating among diets
fed to animals. The reduced SCFA concentrations noted in animals fed on high
carbohydrate diets is likely a result of rapid adaptation, including increased SCFA
flux across the reticuloruminal epithelium. The inflammatory response noted in cattle
prior to any clinical symptoms suggests potential for the identification of
inflammatory markers prior to acidosis and for selective breeding as an acidosis
resistant phenotype.
iv
Table of Contents
Introduction and literature review ..................................................................... 1
Introduction ................................................................................................ 1
The bovine forestomach and abomasum ................................................... 3
The reticulorumen ...................................................................................... 5
Development ........................................................................................... 5
Histology ................................................................................................. 6
Ruminal physiology ............................................................................... 12
Measurement and assessment of reticuloruminal function ................... 20
Potential genetic contributions .............................................................. 25
Reticuloruminal dysfunction ..................................................................... 26
Acute acidosis ....................................................................................... 26
SARA .................................................................................................... 27
Motility disorders ................................................................................... 37
Reticuloruminal alkalosis ...................................................................... 39
Strategies for controlling SARA ............................................................... 40
Mineral buffers ...................................................................................... 40
Caustic treatment .................................................................................. 40
Clays ..................................................................................................... 41
Ammonia ............................................................................................... 42
Particle size .......................................................................................... 43
Direct fed microbials ............................................................................. 44
Aims ......................................................................................................... 46
General materials and methods ..................................................................... 48
Post-mortem sampling ............................................................................. 48
Rumen sampling ................................................................................... 48
Hindgut sampling .................................................................................. 49
Processing ............................................................................................ 49
Histochemistry ......................................................................................... 50
Preparation of paraffin embedded tissues ............................................ 50
Haematoxylin and eosin stain ............................................................... 50
EMSB (Elastin Martius Scarlet Blue) stain ............................................ 50
Immunohistochemistry ............................................................................. 51
Image viewing and capture ...................................................................... 52
Blood testing ............................................................................................ 53
Collection and processing ..................................................................... 53
Biochemistry ......................................................................................... 53
Haematology ......................................................................................... 53

v
Acute phase proteins ............................................................................ 54
Semi-Quantitative PCR ............................................................................ 54
RNA Extraction from rumen tissue ........................................................ 54
RNA Extraction from EDTA blood ......................................................... 55
2.6.2.3 Reverse transcription ......................................................................... 56
Consortium work - Aberdeen ................................................................... 58
LPS analysis - Aberdeen ...................................................................... 59
SCFA analysis – Aberdeen ................................................................... 59
Microbiome analysis – Aberdeen .......................................................... 60
Histamine ELISA assay ........................................................................... 61
Rumen fluid histamine ELISA ............................................................... 61
Plasma histamine ELISA ...................................................................... 62
LPS EndoLISA endotoxin detection ......................................................... 63
Processing ............................................................................................ 63
Assay procedure ................................................................................... 64
Quantification of results ........................................................................ 64
SCFA and ethanol analysis .................................................................. 64
On farm and post-mortem observations associated with sub-acute ruminal acidosis in beef and dairy cattle ............................................................................ 66
Introduction .............................................................................................. 66
Aims ......................................................................................................... 70
Materials and methods............................................................................. 71
Study design ......................................................................................... 71
Feed analysis ........................................................................................ 72
Post mortem sampling .......................................................................... 73
Histology and immunohistochemistry.................................................... 74
Grid-Sampling ....................................................................................... 74
Image capture ....................................................................................... 74
Scoring system ..................................................................................... 74
Semi-Quantitative PCR ......................................................................... 78
Histamine in reticuloruminal fluid .......................................................... 78
Lipopolysaccharides in reticuloruminal and caecal fluid...................... 78
Short chain fatty acids (SCFA) and ethanol in reticuloruminal fluid .... 79
Statistical analyses ............................................................................. 79
Results ..................................................................................................... 81
Grid Sampling ....................................................................................... 81
Initial observations of tissue structure ................................................... 82
Preliminary sample examination (n=25) ................................................ 87
Farm characteristics.............................................................................. 95
vi
Full sample set examination (n=195) .................................................... 99
Discussion ............................................................................................. 105
Beef farm analysis .............................................................................. 105
Histology ............................................................................................. 106
Effects of a challenge diet high in soluble carbohydrates on production and physiological parameters associated with SARA, with and without direct-fed microbials ............................................................................................................ 110
Introduction ............................................................................................ 110
Aims ....................................................................................................... 112
Materials and methods........................................................................... 113
Experimental design ........................................................................... 113
Rations ................................................................................................ 114
Blood collection and laboratory analysis ............................................. 116
Plasma histamine ............................................................................... 117
Acute phase proteins .......................................................................... 117
Semi-Quantitative PCR ....................................................................... 117
Rumen fluid collection ......................................................................... 118
SCFA and ethanol in reticuloruminal fluid ........................................... 118
Histamine in reticuloruminal fluid ........................................................ 118
LPS in reticuloruminal fluid ............................................................... 119
Milk production and composition ....................................................... 119
Body condition scoring (BCS), liveweight (LWT) and mobility scoring ..................................................................................................................... 119
Feed analysis .................................................................................... 120
Statistical analyses ........................................................................... 120
Results ................................................................................................... 122
Test product and ration consumption .................................................. 122
Reticuloruminal pH ............................................................................. 123
Body condition score (BCS) ................................................................ 126
Mobility score ...................................................................................... 126
Production parameters........................................................................ 127
Biochemistry, haematology and acute phase proteins ........................ 129
Reticuloruminal SCFA......................................................................... 133
Histamine concentrations .................................................................... 133
Lipopolysaccharide (LPS) concentration............................................. 133
Gene expression ............................................................................... 135
Discussion ............................................................................................. 137
A direct comparison of physiological responses in cattle and sheep to diets intended to induce acidosis ................................................................................. 143
Introduction and background ................................................................. 143

vii
Aims ....................................................................................................... 144
Materials and methods........................................................................... 145
Study design ....................................................................................... 145
Timeline .............................................................................................. 146
Rations ................................................................................................ 147
Boluses ............................................................................................... 148
Rumen cannulation of sheep .............................................................. 148
Weights ............................................................................................... 149
Reticuloruminal fluid............................................................................ 149
Reticuloruminal lipopolysaccharide (LPS)........................................... 149
Reticuloruminal SCFA and ethanol ..................................................... 149
Histamine .......................................................................................... 150
Microbiome analysis ......................................................................... 150
Ruminal papillae biopsies ................................................................. 153
Ruminal histology ............................................................................. 153
RNA extraction from rumen papillae ................................................. 154
Semi-Quantitative PCR ..................................................................... 154
Blood collection and laboratory analysis ........................................... 155
Statistical analysis ............................................................................ 155
Results ................................................................................................... 158
Diet and weights ................................................................................. 158
Reticuloruminal pH ............................................................................. 159
Haematology ....................................................................................... 162
Semi-Quantitative PCR ....................................................................... 165
SCFA .................................................................................................. 167
Histamine and lipopolysaccharide (LPS) ............................................ 170
16S ribosomal RNA sequencing ......................................................... 171
Histology ............................................................................................. 177
Discussion ............................................................................................. 182
General Discussion ...................................................................................... 193
References .................................................................................................. 204
Appendix 1 .......................................................................................................... 224
Appendix 2 .......................................................................................................... 226
Appendix 3 .......................................................................................................... 228
viii
List of Tables
Table 1-1: Differing pH thresholds as detailed in literature,dependent on collection method and criteria. .............................................................................................. 28
Table 1-2: Dietary thresholds for monitoring and preventing acidosis, as detailed by Mulligan et al. (2006) ........................................................................................ 30 Table 1-3: Parameters associated with acute and subacute acidosis, and how they differ. Table adapted from “Ruminal acidosis in beef cattle: the current microbiological and nutritional outlook” (Nagaraja and Titgemeyer, 2007) ........... 32
Table 2-1: Primary antibody and dilution, secondary antibodies and enzymatic retrieval agent used by Veterinary Diagnostic Services (VDS). ............................ 52 Table 2-2: Thermal cycling condition for TaqMan ................................................ 57 Table 2-3: Genes studied , the type of gene, accession number, amplicon length and location of the gene probe by the exon. ......................................................... 58
Table 3-1: Histological scoring system .................................................................. 76 Table 3-2: Summary of rumen histological observations of 25 samples from animals on diverse diets.. ..................................................................................... 89 Table 3-3: Results of Horn's Parallel Analysis for factor retention with 5000 iterations. .............................................................................................................. 92 Table 3-4: Table showing the loading estimates and uniqueness for each of the variables in the two factor model ........................................................................... 93 Table 3-5: Scores for histological change: variables and association of each score with diet. ................................................................................................................ 93 Table 3-6: List of the dietary components from each of the 6 beef farms: dietary composition, chemical analysis and particle size .................................................. 96
Table 3-7: Mean and SD of reticuloruminal fluid and caecal fluid concentrations of selected variables by FARM. ................................................................................ 98
Table 3-8: Median relative expression of each of the studied genes for all high-risk farms and all low-risk farms and for each farm considered alone. ........................ 99 Table 3-9: Summary of rumen histological observations on 195 samples from animals on diverse diets.. .................................................................................... 100
Table 4-1: Feed ingredient analysis as fed ......................................................... 115
Table 4-2: Partial mixed ration (PMR) composition for each period .................... 116
Table 4-3: Daily dairy blend parlour concentrate allocations for individual cattle for each period. ........................................................................................................ 116 Table 4-4: Composition of the predicted diets for a cow on the median level of parlour supplementation during the BASAL and CHALLENGE 2 periods ........... 116 Table 4-5: Guide to body condition scoring (BCS) as detailed in “Condition scoring of dairy cows” by the Department for Environment, Food and Rural Affairs (DEFRA). ............................................................................................................ 120 Table 4-6: Mobility scoring as detailed in the Agriculture and Horticulture Development Board (AHDB) guidelines for dairy mobility scoring in their Healthy Feet programme ................................................................................................. 120
Table 4-7: Consumption of treatments for each DFM treatment group. .............. 123
Table 4-8: Body condition score by time-point as scored using DEFRA guidelines detailed in section 4.3.12. ................................................................................... 126 Table 4-9: Mobility score by time-point as scored using AHDB guidelines detailed in section 4.3.12. ................................................................................................. 127 Table 4-10: Mean and median values for selected production-related variables for each time-point and treatment group.. ................................................................ 128 Table 4-11 Mean and median values for selected plasma biochemical variables for each time-point and treatment group. ................................................................. 130

ix
Table 4-12: Mean and median values for selected haematological variables for each time-point and treatment group. ................................................................. 132 Table 4-13: Mean and median values for concentrations of selected compounds in ruminal fluid for each time-point and treatment group. .................................... 134
Table 4-14: Mean and median values for relative gene expression for each time-point and treatment group.. ................................................................................. 136 Table 5-1: Table showing cattle and sheep information: age, bolus ID and weights across the trial.. ................................................................................................... 147 Table 5-2: Feed residues at AM and PM feedings, for both cattle and sheep over the challenge period.. .......................................................................................... 158 Table 5-3: Animal weights (kg) pre surgery and across the whole trial for all individuals for both species.. ............................................................................... 159 Table 5-4: Table showing the time spent below commonly reported pH thresholds for each animal. .................................................................................................. 162
Table 5-5: The effect of time-point, species and their interaction term on haematological parameters across all time-points and the significance of the change between D-38 and D-30 and between D-28 and D-35 ........................... 163
Table 5-6: Mean, median and SD for each haematological variable across all time-points for cattle and sheep and the mean, median and SD for each individual time-point (D-28, D-30 and D-35)................................................................................ 164
Table 5-7: Table showing the effect of time-point, species and their interaction term on gene expression levels for each of the 4 genes studied and the significance of the change in gene expression levels between D-28 and D-30 and between D-28 and D-35 ...................................................................................... 166 Table 5-8: Table showing the effect of time-point, species and their interaction term on SCFA proportions across time-points and the significance of the change in SCFA proportions between D-28 and D-30 and between D-28 and D-35. .......... 168 Table 5-9: Table showing the mean, median and SD for SCFA concentrations for cattle and sheep across all time-points and at each individual time-point (D-28, D-30, D-35). ............................................................................................................ 169
Table 5-10: Table showing the significance of the effect of time-point, species and their interaction on reticuloruminal fluid and plasma histamine concentration and LPS concentration for both species across all time-points and the significance of the change between D-28 and D-30 and between D-28 and D-35. .................... 171 Table 5-11: Table showing the mean, median and SD for reticuloruminal fluid and plasma histamine and reticuloruminal LPS for cattle and sheep across all time-points and at each individual time-point (D-28, D-30 and D-35).......................... 171 Table 5-12: Mean rarefaction measure for all animals and the difference in PD between the two time-points.. ............................................................................. 172 Table 5-13: Table showing the biomarkers identified at D-28 for both species.. . 176 Table 5-14: Table showing the biomarkers identified at D-30 for both species. .. 177 Table 5-15: Table showing the significance of overall time-point, species and their interaction term on histological parameters and the significance of the change in values for histological parameters between D-28 and D-30 and D-28 and D-35. 178
Table 5-16: Table showing the mean, median and SD for histological parameters for cattle and sheep across all time-points, and at each individual time-point (D28, D-30 and D-35). .................................................................................................. 178 Table 5-17: Table showing the count of each categorical score1 for the histological variables for cattle and sheep across all time-points. .......................................... 180 Table 5-18: Table showing the count of each categorical score1 for the histological variables for each species for each sampling day. .............................................. 181
x
List of Figures
Figure 1-1: H&E section showing (A) Section through the tip of a papillae showing clearly the basal columnar cells round the connective tissue fibres (arrow) and the gradual flattening of the cells as you move towards the outer keratinised layers, particularly in the SC (x40). (B) Section of a papillae showing sloughing of the outer layers of the SC and clear vacuolation in the SG (arrow) (x40). (C) Section of papillae showing the large swollen cells of the SC which have a high refractive index (arrow) (x40).. ................................................................................................ 8
Figure 1-2: Images showing the range in papillae density, width and height across the rumen of cattle. Figures from “Das Oberflach enrelief der Pansenschleimhaut bei Rind und Ziege” (Schnorr and Vollmerhaus, 1966). .......................................... 9 Figure 1-3: Left and right view of the rumen and reticulum, detailing the density and height of the papillae present. Figures from “Das Oberflach enrelief der Pansenschleimhaut bei Rind und Ziege” (Schnorr and Vollmerhaus, 1966). ........ 10 Figure 3-1: H&E (x20) staining of sections from black and white areas of the rumen. ................................................................................................................... 81 Figure 3-2: H&E (x40) stained papillae section showing the 4 characteristic cell layers (stratum corneum, stratum granulosum, stratum spinosum and stratum basale) and vasculature. ....................................................................................... 83
Figure 3-3: Comparative examples of single papillae stained with H&E (2A) and EMSB (2B) stains,. ................................................................................................ 83
Figure 3-4: H&E (x40) stained sections of ruminal papillae illustrating representative low and high examples of stratum corneum thickness and low and high examples of stratum granulosum thickness .................................................. 84
Figure 3-5: H&E (x40) stained sections of ruminal papillae illustrating representative examples of low and high examples of cytoplasmic swell score and perinuclear vacuolation ......................................................................................... 85 Figure 3-6: EMSB stained sections of ruminal papillae illustrating representative examples of low and high examples of clefting score, stratum corneum integrity and sloughing score. ............................................................................................. 86 Figure 3-7: (x40) Sections of ruminal papillae illustrating representative examples of low and high examples of CD3 and MHC2. ...................................................... 87
Figure 3-8: Composite bar charts of categorical parameters for each diet, where the lowest score is represented by the darkest shade of grey.. ............................ 90 Figure 3-9: Composite bar charts for categorical variables for each group (FORAGE and CONCENTRATE), where the lowest score is represented by the darkest shade of grey ........................................................................................... 91
Figure 3-10: Results from Horn’s PA and PCA. Horns PA shows only 2 factors should be retained ................................................................................................ 92 Figure 3-11: Box and whisker plots showing results from each of the 4 scores created from the histological variables for diet ...................................................... 94 Figure 3-12: Composite bar charts for categorical variables for each diet .......... 101
Figure 3-13: Composite bar charts for categorical variables for each Group. ..... 102
Figure 3-15: Histological score results for scores 1-4 ......................................... 103
Figure 3-16: Box and whisker plots showing score 1 results for each of the 6 beef farms and showing high SCT and SGT values for farm BH6. ............................ 104 Figure 4-1: Stacked bar chart showing the percentage of treatment consumed considered as Yes, No or Partial at each afternoon milking for all animals in all groups. ................................................................................................................ 122 Figure 4-2: Diurnal variation in mean individual cow reticuloruminal pH over all time-points and treatments. ................................................................................ 124
xi
Figure 4-3: Daily mean pH observations, daily minimum pH observations and daily standard deviation in pH. Shown for individual cows across the whole trial for all groups. ................................................................................................................ 125
Figure 4-4: Sum of the observations for each group, where pH was below pH 6 across all time-points. ......................................................................................... 126 Figure 5-1: Schematic of the study timeline, detailing the samples collected at each time-point and the analysis they were used for at a later date ................... 146 Figure 5-2: Reticuloruminal pH at each time-point: basal (D-28), 1 day post challenge (D-30) and 1 week post challenge (D35) for each species. ................ 160
Figure 5-3: Box and whisker plots showing daily reticuloruminal pH for all cattle and all sheep at time-points A and time-point B ................................................. 161 Figure 5-4: Box and whisker plot showing the neutrophil count at D-28, D-30 and D-35 for both species. ......................................................................................... 165 Figure 5-5: Box and whisker plot showing monocyte count at D-28, D-30 and D-35 for both species.. ................................................................................................. 165 Figure 5-6: Bar chart showing the fold change for each gene of interest between D-28 (basal diet) and D-30 (1 day post challenge) relative to the housekeeping genes GAPDH and RPLPO for each individual animal. ...................................... 166 Figure 5-7: Bar chart showing the fold change for each gene of interest between D-30 (1 day post challenge) and D-35 (1 week on the challenge diet) relative to the two housekeeping genes GAPDH and RPLPO, for each individual animal. ....... 167 Figure 5-8: Box and whisker plot showing the acetate concentration at D-28, D-30 and D-35 for each species.. ................................................................................ 169
Figure 5-9: Box and whisker plot showing the total SCFA concentration at D-28, D-30 and D-35 for each species.. ........................................................................... 170
Figure 5-10: PD whole tree diversity at 5,000 reads for each animal at D-28 and D-30 (basal diet and challenge diet).. ..................................................................... 172 Figure 5-11: Unweighted UniFrac plot for cattle and sheep at D-28 and D-30 .... 173
Figure 5-12: Stacked bar plot showing those phyla observed at D-28 and D-30, for each individual animal and the percentage of the total phyla represented by each for each individual bacteria or archaea present as created in Qiime. .................. 174 Figure 5-13: Taxa biomarkers for D-28 (basal ration) for both species. .............. 175
Figure 5-14: Taxa biomarkers for D-30 (challenge diet) for both species. .......... 176
Figure 5-15: Box and whisker plot showing average stratum corneum thickness at D-28, D-30 and D-35 for each species. ............................................................... 179 Figure 5-16: Box and whisker plot showing the average MHC2 positive count at D-28, D-30 and D-35 for each species. .................................................................. 179

xii
Acknowledgements
There are many people to whom I owe thanks. Firstly, I would like to express my
thanks to my primary supervisor Nicholas Jonsson for the patience, motivation, and
immense knowledge he provided to me throughout my 4 years. Nick helped push
me in both my research and writing skills and put up with endless questions shouted
across the office. I may not have ended up in this field were it not for Nick’s
enthusiasm and encouragement with my initial honours project and I will always be
thankful for this.
I would also like to thank my secondary supervisor Peter Hastie. Peter’s door was
always open to allow a chat, whether about PhD work or otherwise, and his insights
helped to shape my thesis and kept me going – particularly during this last hard year
– something I won’t forget. I wouldn’t have gotten to where I am without Peter’s help.
Thanks must also go to Caline Koh-Tan for all her guidance and help in the lab.
Caline pushed me to understand things that I did not think I ever would. I have
learned a huge amount from her and I am grateful for her help in the early stages of
my PhD.
The team from Aberdeen, Christine McCartney and John Wallace and everyone
else who helped with collection of samples and trials must be thanked too. Abattoir
trips, gut rooms and parlours are not everyone’s idea of fun, but we kept each other
going through the early starts and long days and I appreciate it.
Huge thanks go to my colleagues and friends in the old cell sciences lab, especially
the JYT (Aynsley, Callum, Zoë and Amy) and my honorary supervisors Neil, Fiona
and Maureen. You all kept me going when I needed it most and made my final few
years of my PhD the best. You let me vent, helped me sample, provided a distraction
and generally cheered me up.
Finally, I must thank my family for putting up with me when I was crabbit, for forgiving
my stressing and late nights and for reading things, though you did not know what I
meant half the time. Your support has seen me through this project to its completion
– thank you!

xiii
“I declare that except where explicit reference is made to the contribution of others,
that this dissertation is the result of my own work and has not been submitted for
any other degree at the University of Glasgow or any other institution”
Name: Holly Jane Ferguson
Signature:
xiv
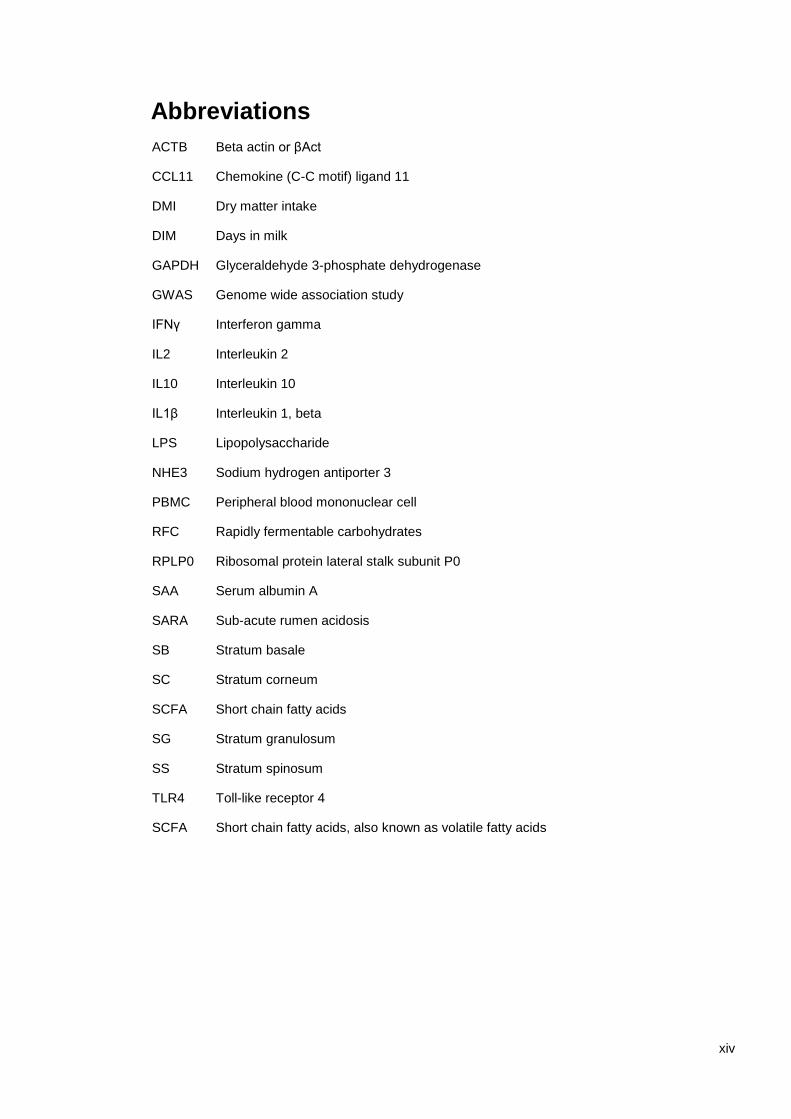
Abbreviations
ACTB Beta actin or βAct
CCL11 Chemokine (C-C motif) ligand 11
DMI Dry matter intake
DIM Days in milk
GAPDH Glyceraldehyde 3-phosphate dehydrogenase
GWAS Genome wide association study
IFNγ Interferon gamma
IL2 Interleukin 2
IL10 Interleukin 10
IL1β Interleukin 1, beta
LPS Lipopolysaccharide
NHE3 Sodium hydrogen antiporter 3
PBMC Peripheral blood mononuclear cell
RFC Rapidly fermentable carbohydrates
RPLP0 Ribosomal protein lateral stalk subunit P0
SAA Serum albumin A
SARA Sub-acute rumen acidosis
SB Stratum basale
SC Stratum corneum
SCFA Short chain fatty acids
SG Stratum granulosum
SS Stratum spinosum
TLR4 Toll-like receptor 4
SCFA Short chain fatty acids, also known as volatile fatty acids

1
Introduction and literature review
Introduction
The ruminant stomach originates from a single diverticulum at the oesophagus and
splits into 3 large and distinct chambers – the rumen, reticulum and omasum. These
3 chambers - known collectively as the forestomach - along with the abomasum,
create a structure with 4 chambers in total (Frandson et al., 2003). The rumen
contains a range of archaea, bacteria and eukaryota responsible for fermentation of
feed and the subsequent creation of short chain fatty acids (SCFA), used by
ruminants as their main source of energy. The rumen is present in all species of the
suborder Ruminantia, which includes cattle, sheep, goats and deer among others.
The key function of the rumen is to allow ruminants to digest complex structural
carbohydrates like cellulose via fermentation, thus allowing them to inhabit a niche
not available to monogastric animals (Fernando et al., 2010). Despite this key
function, the rumen itself has many more important roles than simply just a
fermentation chamber.
In modern agriculture, increased yield in areas such as meat, milk and wool
production in ruminants is favoured by high levels of dietary supplementation with
rapidly fermentable, starch rich carbohydrates. Beef cattle fed a diet high in rapidly
fermentable carbohydrates prior to slaughter have shown an increase in carcass
weight, conformation, degree of finishing, fat depth and rib eye area (Realini et al.,
2004). In dairy cattle, milk parameters are consistently reported to be affected by
rapidly fermentable carbohydrates in the diet (Enemark et al., 2002, Danscher et al.,
2015, Xu et al., 2016). In both beef and dairy cattle, there is a need to balance an
increase in yield with increasing levels of rapidly fermentable carbohydrates and the
negative effects noted when these optimum levels of feeding are exceeded.
Above an optimum level, dietary supplementation with rapidly fermentable
carbohydrates eventually leads to an increase in protons in the rumen, due to short
chain fatty acid (SCFA) production and accumulation (also known as volatile fatty
acids or VFA), which eventually leads to decreased reticuloruminal pH. Decreased
reticuloruminal pH causes challenges arising from the resulting loss of the diversity
of the ruminal microbiome, which in turn affects fermentation, and the overall
function of the rumen. Although to some extent increased acid production is a
2
desired effect of a diet high in rapidly fermentable carbohydrates - SCFA being
responsible for a large proportion of the energy requirements in cattle - the
accumulation of protons and associated reticuloruminal pH drop and negative
consequences is not. Decreased reticuloruminal pH, known as ruminal acidosis or
often referred to in literature as sub-acute ruminal acidosis (SARA), can lead to a
number of negative consequences for the animal, including poor production, poor
body condition, mild anorexia, diarrhoea, depression, decreased ruminal motility,
rumenitis, general inflammation, laminitis, epistaxis and in severe cases can even
lead to death (Plaizier et al., 2008).
There is substantial variation among individual animals fed the same ration in the
extent to which they can maintain the reticuloruminal pH within its “normal” range
and prevent a drop in pH due to proton accumulation, or are resistant to ill effects of
ruminal acidosis (Garrett, 1996; Morgante et al., 2007; Kleen et. al., 2009).
Identifying the range of responses among animals, or a specific mechanism present
in those animals able to maintain their reticuloruminal pH or cope with negative
consequences associated with decreased pH, would allow for selection of animals
genetically predisposed to cope better with or not develop ruminal acidosis. This
would mean better welfare, better production and better returns for farmers globally.
Adverse effects of ruminal acidosis are commonly reported, particularly in the dairy
industry, primarily due to abrupt change in diets in cows post-parturition to a diet
higher in rapidly fermentable carbohydrates. Cows in the early post-partum period
are particularly vulnerable to ruminal acidosis, due to this immediate diet change
post-calving and correspondingly, the number of cases reported is often higher in
animals at calving time (Rabelo et al., 2003, Penner et al., 2007). Although a
common condition, the prevalence of ruminal acidosis in European and North
American dairy production systems has been shown to vary widely. Some herds
might show no indication of acidosis, yet similarly managed herds may show a
prevalence of up to 40% (Morgante et al., 2007, Kleen et al., 2009, Kleen et al.,
2013). Despite variation in reported prevalence, estimates of the financial impact of
acidosis are consistently high globally; through production losses, increased culling
rate and death losses. It has been estimated that the financial costs associated with
ruminal acidosis are between USD $500 million to $1 billion annually (Enemark,
2008).
3
The bovine forestomach and abomasum
Microbial fermentation of feedstuffs by the microbiome of the rumen allows
ruminants to inhabit a distinct niche that differs from that of the monogastric animal,
by providing them the ability to breakdown complex carbohydrates like cellulose and
hemicellulose. The bovine forestomach is composed of the 3 distinct and separate
chambers (rumen, reticulum and omasum) before the final acidic digestion chamber,
the abomasum. The rumen, reticulum and omasum are lined with non-glandular
mucous membranes, while the abomasum is lined with a glandular secretory
mucosa (Nickel et al., 2013). Food is fermented and broken down in the reticulum,
regurgitated as a bolus (or cud) and chewed again to break it down further and
retrieve as much nutritional value as possible. The cud is then swallowed again and
passed through to the omasum where liquid is reabsorbed before it passes into the
abomasum for the final acidic digestion, similar to that of a monogastric animal.
Finally, food moves into the small intestine where digestion and further absorption
of nutrients occurs (Dehority, 2002).
The reticulum, the first chamber of the bovine stomach, is located in the abdomen
close to the heart, adjacent to the diaphragm, lungs, abomasum, rumen and liver
(Budras et al., 2003). The reticulum is connected to the rumen and separated from
the rumen chamber by a muscular fold (Dehority, 2002). Together with the rumen,
it is commonly referred to as one entity - the reticulorumen. The mucosa of the
reticulum forms a network of crests, hexagonal in shape, the height and depth of
which varies considerably across species. Crests have been shown to be higher in
sheep and cattle in comparison to okapi, deer or giraffe (Shorrocks, 2016), though
the general size of the reticulum itself is relatively constant across all ruminant
species. The reticulum has long been recognised in domestic ruminants as the site
of particle sorting (Okine et al., 1998). In bovines, the reticulum plays this role in
particle separation though biphasic contractions (Braun and Jacquat, 2011). The
first contraction of the reticulum sends large particles from the reticulum back into
the rumen and smaller particles on to the omasum. The second contraction
contracts the reticulum fully to refill it with contents from the rumen and thus the
cycle of contractions and sorting begins again (Braun and Götz, 1994). Heavy or
dense feed often settles in the reticulum during these contractions, meaning the
reticulum often catches metals or other heavy hardware accidentally or intentionally
ingested (boluses). Metal retention can result in traumatic reticulitis or pericarditis,

4
often known as “hardware disease”, where metal perforates the reticulum during
contractions, resulting in inflammation or infection in the surrounding areas and
pericardium, which can be fatal (Roth and King, 1991, Samad et al., 1994).
The rumen, the second chamber of the ruminant stomach, is the chamber most
commonly referred to in literature when considering bovine acidosis. The rumen is
often referred to as a large fermentation chamber, but plays its own very important
role in ruminant digestion via absorption of SCFA produced during fermentation and
the corresponding sodium bicarbonate secretion. The reticulorumen is discussed in
detail in section 1.3.
The omasum is the third chamber of the ruminant stomach, it is almost spherical in
shape and the lower end of the omasum is connected to the fundus of the
abomasum, the fourth chamber of the ruminant stomach (Budras et al., 2003). The
mucosa of the omasum is mostly smooth with small, lenticular papillae. The surface
of the omasum resembles “book–like” folds, often referred to as leaves (Prins et al.,
1972). The omasum is responsible for absorption of water and SCFA from the
rumen (Holtenius and Bjornhag, 1989). Similarly to the reticulum, the omasum has
biphasic contractions. On the first contraction, the omasum expels fluid from ingesta
that has entered from the reticulum. The second contraction expels solid ingesta left
behind, allowing it to move into the abomasum and allowing the omasum to fill again,
continuing the cycle of contractions and movement of ingesta (Stevens et al., 1960,
Prins et al., 1972).
The fourth and final chamber of the ruminant stomach, the abomasum, is considered
separate from the forestomach (rumen, reticulum, and omasum) and lies upon the
abdominal floor (Budras et al., 2003). The position of the abomasum varies slightly,
dependent on the fullness of other chambers, contraction rate of the rumen and
reticulum (due to attachments), age and pregnancy (Constable et al., 2017).The
abomasum is split into cranial and caudal sections (cranial further split into the
pylorus and body), has a loose folded appearance inside and is coated in mucous
(Wolffram, 1996). The abomasum is secretory (secreting rennet), similar to the
anatomy and function of a monogastric stomach. The main function of the
abomasum is the chemical digestion of food, not the mechanical or fermentation
degradation observed in other forestomachs. The abomasum uses chemical
digestion, via hydrochloric acid and pepsinogen, of microbial and dietary proteins to

5
prepare these protein sources for further digestion and absorption in the small
intestine (Ash, 1961). Cattle fed diets high in rapidly fermentable carbohydrates are
susceptible to a condition of the abomasum due to a build-up of gas from rapid
fermentation of the carbohydrates (Sarashina et al., 1990). From this gas build up,
the abomasum can become left or right (LDA, RDA) displaced in the abdominal
cavity (Sarashina et al., 1990). Displacement can have numerous ill effects for the
animal, including loss of appetite, decreased ruminal contraction rate and decreased
cud rate and can cause economic losses for farmers due to premature culling
(Shaver, 1997). Surgery may be required for serious displacements but some minor
LDA can be corrected via manipulation of the cow. This condition is most commonly
observed in dairy cattle, as a result of their diet high in rapidly fermentable
carbohydrates and sudden diet changes leading up to and postpartum (Shaver,
1997).
The reticulorumen
Development
At birth, ruminants essentially have a single stomach, the abomasum, with the same
function as that of a monogastric animal. In neonates, the rumen is small,
underdeveloped and not functional, and forms only a small portion of the total
stomach in comparison to later life (Ørskov, 1998). From birth, calves gain nutrition
solely from the dam’s milk or calf milk replacer (CMR). Under normal circumstances
in calves, when drinking, milk bypasses the rumen, reticulum and omasum via the
closure of the oesophageal groove, a muscular structure at the lower end of the
oesophagus, and goes to the abomasum where it is digested (Ørskov, 1998). Thus,
milk bypasses the ruminal fermentation chamber and it is digested fully.
Rumen development in ruminants is dependent on access to a fibrous diet,
inoculation by rumen bacteria and essentially, the presence of SCFA to stimulate
the rumen wall and papillae development (Van Soest, 1994). If ruminants are
maintained on a milk only diet without access to fibrous food, the development of
the rumen is greatly limited (Van Soest, 1994). Even if milk were to enter the rumen
through improper closure of the oesophageal groove, milk digestion in the rumen
leads to lactic acid fermentation with little SCFA production, leading to poor
stimulation of the rumen wall (Van Soest, 1994). As calves begin to wean by
6
consuming small parts of fibrous vegetation or pelleted food, this enters the rumen
and becomes a substrate for fermentation by the ruminal microbiome. The
microbiome develops after birth from contact with bacteria from the dam and
surroundings. Fermentation of these pellets or vegetation, rich in complex
carbohydrates, leads to production of SCFA and consequential SCFA induced
stimulation of rumen development (Van Soest, 1994). In a high-intensity commercial
setting, where calves may be removed and weaned at an earlier age, inoculation of
rumen bacteria and development of the rumen, can be ensured via contact with farm
staff and the environment alone (Hobson and Stewart, 1997). Although strictly
isolated animals will develop a rumen microbiome, species present in the
microbiome may differ qualitatively or quantitatively from other animals present in
the same herd (Van Soest, 1994).
Histology
In addition to the rumen increasing greatly in size with diet and age, the
ultrastructure of the rumen also develops. Several studies have allowed for a greater
idea of the structure and organisation of the rumen epithelium (Asari et al., 1985,
Graham and Simmons, 2004, Scala et al., 2011, Steele et al., 2011, Steele et al.,
2012) in juvenile and adult ruminants.
1.3.2.1 Light microscopy studies of the rumen
The surface of the rumen is covered with small, leaf-like projections known as
papillae, the size and shape of which vary across the rumen, from animal to animal,
among species and with diet (Dobson, 1955). Papillae function as absorptive
structures for SCFA and papillary proliferation and size has been shown to respond
to dietary manipulation that alters SCFA production levels. If an animal were to
remain on a milk only diet, rumen papillae would remain small, as a large surface
area for SCFA absorption would not be necessary. As vegetation and fibre is
included in the diet, papillae grow rapidly to provide a larger surface area for
fermentation and absorption of SCFA (Eurell and Frappier, 2013). As the diet
becomes more complex and protein and carbohydrate levels increase, papillary size
and density increases as a result of the regulation of insulin-like growth factor 1
(IGF-1) production by butyrate and propionate, as shown by Shen et al. in the
rumens of juvenile goats (Shen et al., 2004). This butyrate and propionate driven

7
papillary change is key in the rumen’s ability to alter papillary structure dependent
on diet throughout life, to increase surface area for SCFA absorption and increase
the length of papillae, even after the initial juvenile development has taken place
(Sakata and Tamate, 1978, Zitnan et al., 2005, Malhi et al., 2013). Variations in the
effectiveness of this mechanism may be one of the many factors responsible for
variation among cattle in their response to a diet high in rapidly fermentable
carbohydrates. Papillae may be roughly 2 mm broad and 6 mm long at longest and
leaf-like in shape, but change across the rumen and with diet, from lenticular in
shape to leaf-like and conical (Dobson, 1955).
Light microscopy studies of the rumen epithelium have characterised the tissue as
keratinised, stratified, squamous epithelium (Graham and Simmons, 2004). Papillae
consist of a core of densely packed collagen fibres surrounded by a stratified
epithelium and have a rich blood and lymphatic supply in the core that penetrates
into the papillary body (Dobson, 1955). The epithelium of the rumen has 3 main
functions: absorption, protection and metabolism. Papillae themselves consist of 4
layers, the outer epithelial stratum corneum (SC) closest to the lumen of the rumen,
the stratum granulosum (SG), stratum spinosum (SS) and the base layer, the
stratum basale (SB) (Graham and Simmons, 2004). The SC forms a barrier against
rough ingesta and deeper layers metabolise SCFA produced in fermentation and
absorb other products from the rumen (Eurell and Frappier, 2013). Underlying the
SB is connective tissue, rich in capillaries (Graham and Simmons, 2004). Individual
layers can be seen clearly in figure 1-1 (A-C).
The basal layer of the rumen epithelium is adjacent to the capillaries in the papillary
body and consists of columnar cells. The number of cells between these columnar
basal cells and the lumen varies greatly between papillae and among animals
(Dobson, 1955). Next to the basal layer is the SS where cells often appear to have
large interstitial spaces due to the presence of cytoplasmic fibrils. Next to the SS is
the SG, shown to have cytoplasmic fibrils and variable interstitial spaces (Dobson,
1955). Keratinisation of the SG is sometimes evident and cells in this layer often
appear to have undergone flattening and vesiculation/vacuolation (Dobson, 1955).
Next to the lumen of the rumen is the SC that, as with the SG, shows flattened cells
and has a high affinity for most stains, which is very apparent in light microscopy
(Dobson, 1955). At the edge of the SC, nearest the lumen, there are often swollen
8
misshapen cells with a high refractive index, as can be seen in figure 1-1C (Dobson,
1955). Cells at the edge of this layer are in the process of sloughing into the rumen
cavity and therefore, cell layers may appear to be missing here upon examination
under light microscope. Sloughing of the SC can be seen in figure 1-1B.
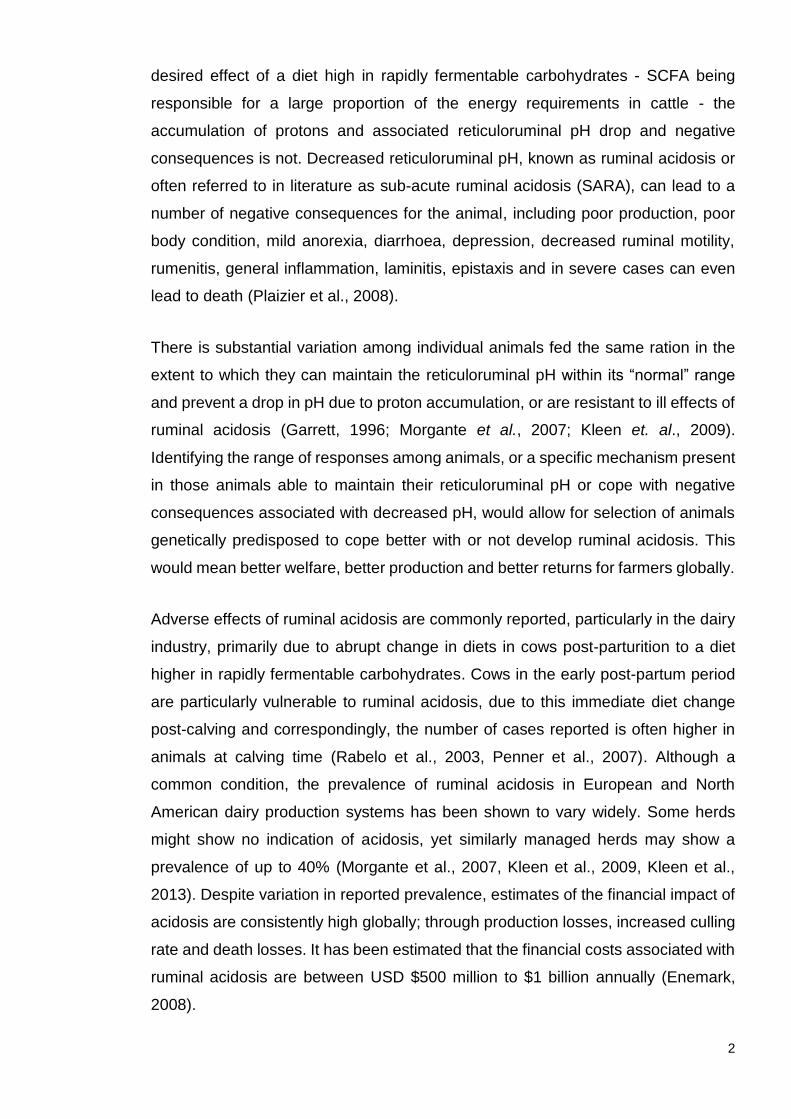
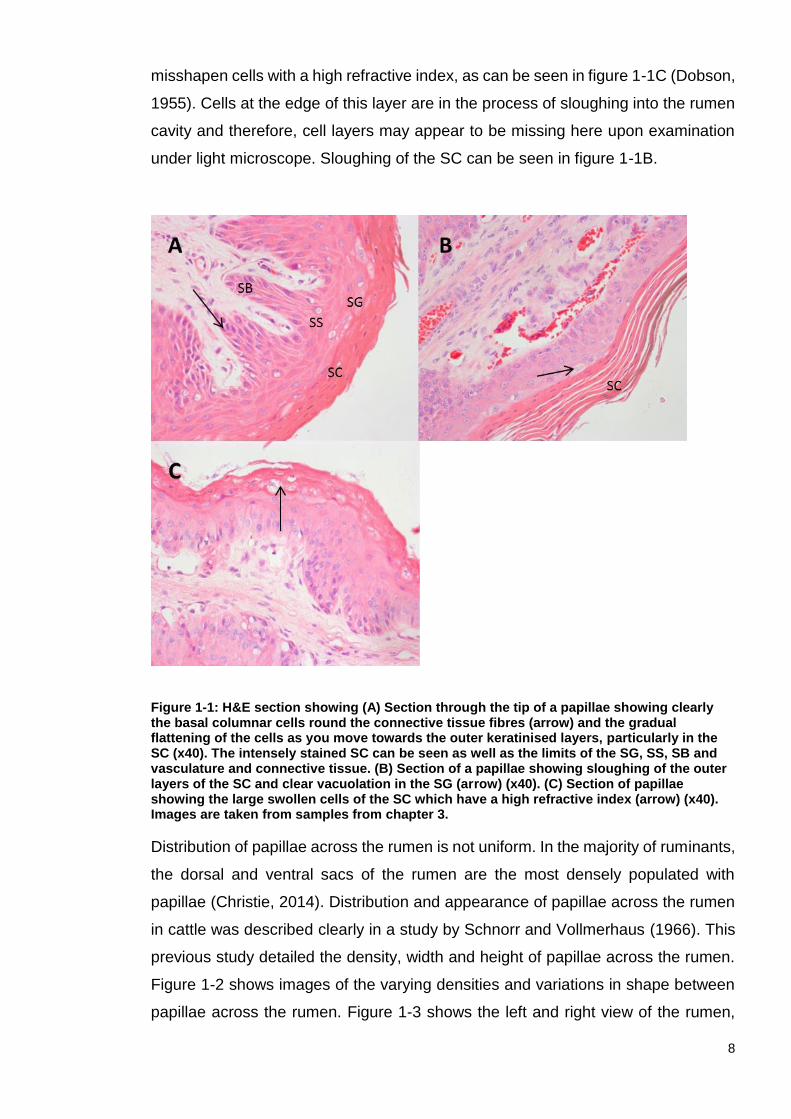
Figure 1-1: H&E section showing (A) Section through the tip of a papillae showing clearly the basal columnar cells round the connective tissue fibres (arrow) and the gradual flattening of the cells as you move towards the outer keratinised layers, particularly in the SC (x40). The intensely stained SC can be seen as well as the limits of the SG, SS, SB and vasculature and connective tissue. (B) Section of a papillae showing sloughing of the outer layers of the SC and clear vacuolation in the SG (arrow) (x40). (C) Section of papillae showing the large swollen cells of the SC which have a high refractive index (arrow) (x40). Images are taken from samples from chapter 3.
Distribution of papillae across the rumen is not uniform. In the majority of ruminants,
the dorsal and ventral sacs of the rumen are the most densely populated with
papillae (Christie, 2014). Distribution and appearance of papillae across the rumen
in cattle was described clearly in a study by Schnorr and Vollmerhaus (1966). This
previous study detailed the density, width and height of papillae across the rumen.
Figure 1-2 shows images of the varying densities and variations in shape between
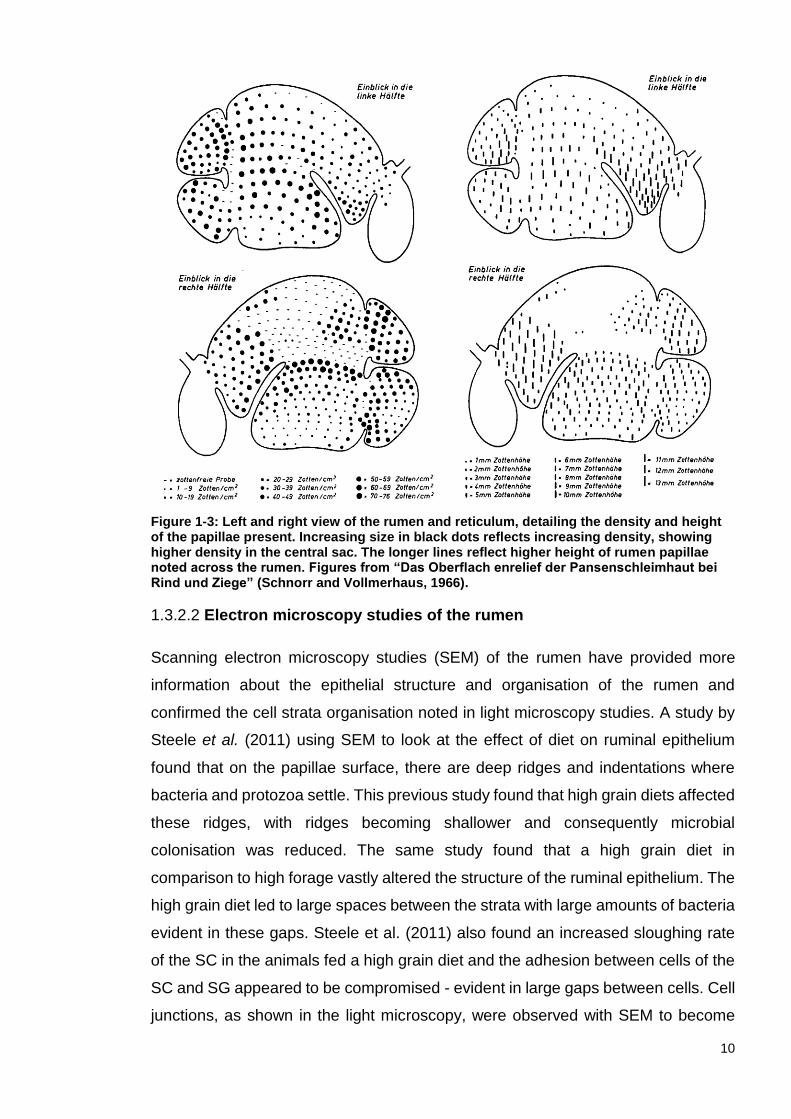
papillae across the rumen. Figure 1-3 shows the left and right view of the rumen,

9
detailing the density and height of papillae across the surface. A higher density of
papillae was found in the dorsal and ventral sacs of the rumen and a longer length
of papillae was found in the dorsal and cranial sac. As a result of this high density
of papillae, many histological studies choose the ventral sac as the site of sampling
for ruminal epithelium (Steele et al., 2011c).
Figure 1-2: Images showing the range in papillae density, width and height across the rumen of cattle. A = papilla-free mucosa; B-I = papillated mucosa with B wart-shaped, C wedge-shaped, D,E, tongue-shaped, F thread-shaped, G,H,I band-shaped, K,L,M, lanceolate, N,O, leaf-shaped papillae. Original size, optical microscope. Figures from “Das Oberflach enrelief der Pansenschleimhaut bei Rind und Ziege” (Schnorr and Vollmerhaus, 1966).
10
Figure 1-3: Left and right view of the rumen and reticulum, detailing the density and height of the papillae present. Increasing size in black dots reflects increasing density, showing higher density in the central sac. The longer lines reflect higher height of rumen papillae noted across the rumen. Figures from “Das Oberflach enrelief der Pansenschleimhaut bei Rind und Ziege” (Schnorr and Vollmerhaus, 1966).
1.3.2.2 Electron microscopy studies of the rumen
Scanning electron microscopy studies (SEM) of the rumen have provided more
information about the epithelial structure and organisation of the rumen and
confirmed the cell strata organisation noted in light microscopy studies. A study by
Steele et al. (2011) using SEM to look at the effect of diet on ruminal epithelium
found that on the papillae surface, there are deep ridges and indentations where
bacteria and protozoa settle. This previous study found that high grain diets affected
these ridges, with ridges becoming shallower and consequently microbial
colonisation was reduced. The same study found that a high grain diet in
comparison to high forage vastly altered the structure of the ruminal epithelium. The
high grain diet led to large spaces between the strata with large amounts of bacteria
evident in these gaps. Steele et al. (2011) also found an increased sloughing rate
of the SC in the animals fed a high grain diet and the adhesion between cells of the
SC and SG appeared to be compromised - evident in large gaps between cells. Cell
junctions, as shown in the light microscopy, were observed with SEM to become
11
indistinct on a high grain diet and cells of the SB became pyramidal and displayed
large intracellular spaces.
Another study using SEM to investigate the keratinisation of cultured rumen
epithelial cells treated with butyrate and lactate found that in butyrate-treated
cultures, there were distinct indications of keratinisation, the appearance of
refractive granules, the formation of keratohyaline granules and thickening of the
cell membrane (Galfi et al., 1983). This previous study also showed the formation
and further detachment of keratinised cells, SC-like in structure, in cultures treated
with butyrate, thus indicating the progression of keratinisation through sloughing, as
shown in the light microscopy studies mentioned previously. This effect of butyrate
is important, as it stresses again the key role of SCFA in both the initial development
of the rumen and overall function and histological organisation of the rumen
epithelium at any age and suggests SCFA may be responsible for epithelial changes
such as parakeratosis (Galfi et al., 1983).
1.3.2.3 Confocal and immunohistochemistry studies of the rumen
In addition to light microscopy and SEM studies, confocal laser scanning microscopy
studies of the rumen has been used in conjunction with FISH (fluorescence in situ
hybridization) in numerous studies. These studies looked to identify and
characterise rumen bacteria and protozoa and define their distributions and ecology
within the rumen environment (Lavker et al., 1969, Schelcher et al., 1992, Lloyd et
al., 1996, Valle et al., 2015).
Immunohistochemical studies of the rumen epithelium have also been used to look
for the presence of inflammatory markers and the effect diet and dietary additives
have on these markers; such as cytokines like CD3, toll-like receptors (TLR4) and
markers of antigen presenting cells like MHCII (Chen et al., 2012, Qadis et al., 2014).
Immunohistochemistry can also be used in histological examinations to highlight the
presence of microabscesses (focal collections of neutrophils) which show strong
positive staining for myeloperoxidase.
12
Ruminal physiology
1.3.3.1 Microbiome
Considerable work has been undertaken in the isolation, taxonomic identification
and enumeration of the bovine rumen microbiome and a large proportion of common
ruminal microbes were identified relatively early in the literature (Hungate, 1950,
Bryant, 1959) but vast numbers are yet to be identified. The majority of bacteria in
the rumen are free floating and detached from plant material but microbiota may be
attached to or within feed particles, and attached to the epithelial cells of the
reticuloruminal wall (Calabro et al., 2012).
A variety of methods can be used to identify species present in the ruminal
microbiome and the structure and composition of a particular microbiome. Older
studies typically used culture based methods (Bryant et al., 1958, Fonty et al., 1987,
Minato et al., 1992), but more recently, analysis of 16S ribosomal RNA (rRNA) gene
sequences and real time PCR is likely to be used (Stevenson and Weimer, 2007,
Jami and Mizrahi, 2012, Han et al., 2015). 16S rRNA sequencing is a commonly
used sequencing method that can identify and compare bacteria present within a
given sample. 16S rRNA gene sequencing is a well-established method for studying
the phylogeny and taxonomy of samples from complex microbiomes or
environments that are difficult or impossible to study by other methods (Illumina,
2016).
The rumen microbiome develops at birth from nose to nose contact with the dam,
contact with surroundings (faeces, other animals, general environment) and contact
with farm staff and is vital for fermentation of complex carbohydrates and for altering
pH (Ørskov, 1998). Rumen microbial ecology has been extensively researched and
numerous studies have been published describing the predominant species of
bacteria, protozoa and fungi (Hungate, 1966, Krause and Russell, 1996, Cheng and
McAllister, 1997).
Globally, similar bacteria are found in all ruminant microbiomes, but different feeding
strategies, diets, climate, farming practices and individual variation all play a role in
the microbial community present in an individual animal (Henderson et al., 2015).
Ruminant microbial communities are composed of varying groups, mostly
13
specialised in hydrolysis and fermentation of polysaccharides, so animals fed similar
diets are expected to have similar populations present to ferment the particular
sugars present in that diet (Firkins and Yu, 2004).
However, variation has been shown in the microbiome present between animals fed
on the same diet. In a study to assess similarity between cattle in the microbiota
present in ruminal fluid samples, a study by Jami and Mizrahi (2012) carried out 16s
sequencing on the V2 and V3 part of the gene and identified and characterised
bacteria present, to look for individual operational taxonomic units (OTU). They
found that roughly 50% of OTU noted only occurred in up to 30% of the animals
sampled, despite similar experimental conditions, diets and sampling procedures,
thus showing individual differences between ruminal microbial populations (Jami
and Mizrahi, 2012).
In contrast, work by Henderson et al. (2015) stated that despite changes in the
rumen microbiome composition as a result of diet and individual host, a large core
microbiome is commonly found across a wide geographical range. They found a
common core microbiome in 742 samples from 32 ruminant species across 35
countries and differences could be attributed to diet, with host being less influential
(Henderson et al., 2015). The most commonly found bacteria were Prevotella,
Clostridiales, Bacteroidales, Ruminococcaceae, Lachnospiraceae, Ruminococcus
and Butyrivibrio (most common to least). These “core bacterial species” comprised
67.1% of all sequence data collected. It is expected that variation outside of this
core can be explained by climate, location and dietary inputs (Henderson et al.,
2015).
1.3.3.2 Biochemistry
The ruminant stomach facilitates microbial fermentation and absorption of the end
products (SCFA) arising from carbohydrate fermentation (Aschenbach et al., 2011).
These SCFA, the largest proportion being acetic, propionic and butyric acid, are
absorbed directly from the rumen and are the main source of energy for ruminants
(Bhagwat et al., 2012). SCFA provide approximately 70% of the caloric
requirements of ruminants, in comparison to approximately 10% for humans and
approximately 20-30% for other omnivorous or herbivorous animals (Chen et al.,
2014). In ruminants, approximately 90% of glucose is supplied by gluconeogenesis,

14
with 50-60% derived from propionate (Reynolds et al., 1988). In diets high in rapidly
fermentable carbohydrates, there is a consequential and deliberate increase in the
amount of propionate produced, which provides more energy for the ruminant, as
propionate provides the largest amount of ATP with the least amount of NADH. In
addition to the 3 main SCFA, ethanol, propanol, formate, acetate, hexanoic acid,
heptanoic acid, lactic acid, valerate, isobutyric acid and isovaleric acid are also
produced. Valeric acid, isobutyric and isovaleric acid account for less than 5% of the
total SCFA and are thought to be more important for microbial protein synthesis
using non-protein nitrogen (NPN) than directly for ruminant energy needs (Husveth,
2011).
Although all 3 forestomach chambers have a squamous epithelial lining, most SCFA
produced are absorbed across the rumen wall (66% absorbed ruminally and 34%
passed on in the liquid phase) (Peters et al., 1990). Absorption rates of SCFA are
higher when reticuloruminal pH is reduced and absorption rates of individual SCFA
are higher in SCFA with longer chain lengths (Thorlacius and Lodge, 1973), e.g.
absorption rate of butyric acid is higher than that of propionic acid. About 50% of
SCFA absorbed are absorbed via passive diffusion in the undissociated state and
the remainder are absorbed as anions, by facilitated diffusion in exchange for
bicarbonate ions (Husveth, 2011). The granulosum cells of the rumen contain
carbonic anhydrase that promotes formation of carbonic acid (Stevens and Stettler,
1967). Carbonic acid associates with SCFA to form undissociated SCFA which
diffuses more easily across the rumen epithelium, leaving bicarbonate ions behind
in the ruminal fluid (Husveth, 2011). This mechanism therefore not only allows
easier SCFA absorption, but also acts as a buffer mechanism in the rumen, by
reducing SCFA concentrations in the rumen for carbonic acid, a weaker acid and by
the presence of bicarbonate, which acts as a buffer itself. This plus salivary buffering
are key ruminant buffer systems for neutralising SCFA.
During absorption of SCFA through the rumen wall, a large proportion of butyric acid
- more in sheep than cattle – is metabolised to β-hydroxybutyrate (βHB). Remaining
butyric acid is transported to the liver and is metabolised here (Husveth, 2011).
Therefore, absorbed butyric acid appears in general circulation almost entirely as
βHB. βHB is metabolised by most of the tissues in the body and is used in the
production of the fatty acids characteristic of ruminant milk (Husveth, 2011).
15
A small amount of acetate is metabolised to CO2 by the rumen epithelium, but the
majority is not changed during absorption or by passage through the liver. Acetate
is the most abundant SCFA in general circulation and is one of the ruminant’s main
metabolic substrates, taken up by the tissues. Acetate is also a main precursor in
the synthesis of body fat in ruminants (Husveth, 2011).
Lactic acid production is commonly discussed in the literature with regards to lactic
acidosis in animals fed a diet high in rapidly fermentable carbohydrates and has
been proposed as playing a dominant role in the development of ruminal acidosis in
general (Huntingdon and Britton, 1978). Lactate is produced in large amounts by
amylolytic bacterial fermentation in the rumen, particularly when rations are high in
rapidly fermentable carbohydrates and reticuloruminal pH drops (Møller et al., 1997).
Lactate can also account for as much as 15% of the total dry matter of silage (Gill
et al., 1984). As lactate proportions increase and the buffering capacity of ruminal
fluid is decreased, lactic acidosis may develop (Møller et al., 1997). Under normal
circumstances, lactic acid is produced in low quantities and is utilised by bacteria to
produce propionate (Gill et al., 1984, Husveth, 2011). However, with diets high in
rapidly fermentable carbohydrates, decreased pH leads to inactivation of propionate
producing bacteria but not lactic acid producing amylolytic bacteria, leading to
accumulation of lactic acid in ruminal fluid (Husveth, 2011). As lactic acid is a
stronger acid than other SCFA and is absorbed slower than other SCFA from the
rumen, accumulation exacerbates the problem by decreasing reticuloruminal pH
further (Møller et al., 1997, Husveth, 2011). Lactic acid has two forms, L(+) and D(-)
lactate (Hernandez et al., 2014). L-lactate is metabolised rapidly by the liver to
pyruvate, which is converted to glucose, and L-lactate acidosis is relatively common,
primarily occurring as a result of tissue hypoxia (Ewaschuk et al., 2005). D-lactate
is formed via the methylglyoxal pathway (carbohydrate, fat and protein metabolism)
(Ewaschuk et al., 2005). D-lactate is thought to be metabolized to pyruvate at about
one-fifth the rate that L-lactate is metabolised (Ewaschuk et al., 2005). D-lactate
acidosis arises in ruminants after grain overfeeding and ruminal fermentation of milk
and is associated with diarrhoea in neonate calves (Ewaschuk et al., 2005).
Production, accumulation, and acidosis from D-lactate is caused by excessive
gastrointestinal fermentation of carbohydrate by lactobacilli and the subsequent
inability to adequately clear the D-lactate (Ewaschuk et al., 2005). Treatment
16
includes bicarbonate and fluid infusion, feeding of hay or enhancing lactate-utilising
ruminal bacteria.
Decreased pH can have numerous ill effects for ruminants and so the animal must
be equipped to try to buffer reticuloruminal pH back to a range most compatible with
microbial and host life. Fluctuation in reticuloruminal pH affects the relative
abundance and activity levels of ruminal microbiota and a reduction in pH can
reduce diversity of species of bacteria and protozoa dramatically, in addition to
consequently reducing efficiency of the rumen for digestion of fibrous material (Xu
and Ding, 2011). Different species of microbiota thrive and die at different pH levels
(Duncan et al., 2009) and a change in reticuloruminal pH would therefore be
expected to affect the populations present.
For the rumen to function efficiently, reticuloruminal pH is usually maintained
between pH 5.5 and 7.2, with an average of between pH 6.5 - 6.8, varying with time
of day, feeding and drinking (Thrall et al., 2012). Under normal feeding conditions,
the pH of the reticulorumen is, in simple terms, maintained at an appropriate pH
level by the balance between acid production and absorption and numerous types
of buffering by the animal. Erdman (1988) states that rumen pH can be explained
as a function of production and active absorption/excretion of SCFA and water,
saliva flow and its buffers into the rumen, feed acidity and outflow through the
omasum to the lower gastrointestinal tract. Failure of regulation by one of these
mechanisms leads to deviation of reticuloruminal pH from physiological levels and
can lead to development of ruminal acidosis and possible serious effects on animal
health and production. Bovidae utilise various types of buffering mechanisms to
attempt to combat pH depression.
Saliva in ruminants, in particular secretions from the parotid gland, is an effective
buffer of reticuloruminal pH and contains high levels of bicarbonate and phosphate
(Van Soest, 1994). Levels of phosphate and bicarbonate in ruminant saliva are
present in a much higher concentration than those of non-ruminant species
(McDougall, 1948; Turner and Hodgetts, 1955). Saliva contributes roughly half of all
bicarbonate entering the rumen, the other being transported across the rumen
epithelium in exchange for ionised SCFA (Owens et al., 1998). It should be noted
however, that although ruminal saliva is a good buffer, decreased reticuloruminal
pH alone cannot trigger increased saliva production to aid buffering. Saliva

17
production is determined by the length of time an animal spends eating, ruminating
and resting (Maekawa et al., 2002).
The ruminal bicarbonate system is considered more sophisticated than the ruminal
SCFA and phosphate buffering systems (Aschenbach et al., 2011). Bicarbonate
buffering in the rumen is part of a double-open system, where bicarbonate can
decay to H2O and CO2, and is in equilibrium with dissolved CO2 in the rumen.
Dissolved CO2 in the rumen may be eructated or absorbed, and as this is steadily
removed from the system, the efficiency of bicarbonate buffering is increased again
(Kohn and Dunlap, 1998). As a result of this double-open system, the buffering
capacity of ruminant saliva is greatly increased. However, despite the buffering
capacity of the saliva, conflicting results have been reported concerning the
effectiveness of the protection from acidosis provided by saliva. In a study by Penner
and Beauchemin (2010), increased rates of salivary secretion were associated with
increased severity of ruminal acidosis. However, it became apparent during this
previous trial that salivary secretion rate is extremely hard to measure. Sponge gags
do not give an accurate representation of salivary rate, as they cannot effectively
measure saliva created during eating or ruminating. Parotid gland measurements
also proved difficult as secretions dried up and stopped after several days of having
a drain in place. Despite saliva being a key buffer, it is hard to measure and it is
thought that other mechanisms of buffering may play a more important role in
protection against ruminal acidosis.
The rumen epithelium itself plays a very important role in buffering the rumen and
has been shown to secrete large amounts of bicarbonate and remove protonated
buffer bases (protonated SCFA known as HSCFA) via absorption (Gäbel et al.,
1991). Both of these processes contribute to returning and stabilising pH to the
correct physiological range (Gäbel and Aschenbach, 2006, Gäbel and Aschenbach,
2007). It is widely accepted that between 50-80% of ruminally produced SCFA are
directly absorbed across the ruminal wall and between 15-50% passes to the distal
digestive system (Aschenbach et al., 2011). Despite energy intake determining the
amount of SCFA available for absorption or passage, there is no linear relationship
between energy intake or SCFA production rates and SCFA passage into the
omasum (Penner et al., 2009b). This is due to the fact that passage of excess acids
into the omasum is counteracted by increased ruminal absorption rates of SCFA at
decreased pH (Dijkstra et al., 1992) and decreased liquid movement into the
18
omasum under high concentrate feeding conditions. However, an extremely high
energy intake has been found to increase the amount of SCFA passing into the
omasum unabsorbed (Tamminga and Van Vuuren, 1988). A decrease in rumen
motility due to decreased pH could account for the decreased movement into the
omasum, as ruminal mixing is an important factor for influencing absorption rates
(Allen et al., 2009). Passage of SCFA into the omasum however does not equal
passage of protons out of the rumen, as not all SCFA passing out will be HSCFA,
carrying a proton (~1% of VFA at pH 6.8) (Aschenbach et al., 2011). It is estimated
that ruminal buffering via proton removal from SCFA passage and other buffering
substances (phosphate/ammonium) is roughly 15% (Allen, 1997). With salivary
buffering of up to 40% of protons, the majority of ruminal buffering via proton removal
has to come via absorption (Aschenbach et al., 2011).
Despite the importance of ruminal buffering via absorption, ruminal homeostasis is
hard to determine by SCFA absorption rates alone as they are influenced by several
contributing factors. Absorption rates are affected by SCFA chain length and pH
itself can affect absorption. It has also been shown that bicarbonate appears in the
rumen when SCFA are absorbed, again altering the pH and therefore absorption
rates (Aschenbach et al., 2011).
The current model of SCFA absorption via HSCFA in the rumen describes lipophilic
diffusion. It is thought that lipophilic diffusion occurs as permeability of the lipid
bilayer of the rumen epithelium to electrically charged SCFA anions is very low, and
therefore passive diffusion must occur with the lipophilic pronated form, HSCFA.
However, there are both quantitative and qualitative constraints that suggest that
lipophilic diffusion is not the only form of SCFA absorption across the rumen wall. A
quantitative constraint is that according to the Henderson-Hasselbalch equation,
HSCFA constitute only a small portion of the HSCFA: SCFA acid base equilibrium
(Aschenbach et al., 2011).
𝑝𝐻 = 𝑝𝐾𝑎 + 𝑙𝑜𝑔10 [𝐴−]
[𝐻𝐴]
i.e. HSCFA (pK 4.8) constitute 1% of the acid: base equilibrium at pH 6.8
(Aschenbach et al., 2009).
A qualitative constraint is that SCFA production rates are inversely related to their
lipophilic permeability (i.e. acid production rates: acetic > propionic > butyric acid

19
but lipophilic permeability: butyric > propionic > acetic acid) and that rate of
intracellular metabolism is inversely related to acid production rates (Aschenbach et
al., 2011). These qualitative constraints could eventually lead to selective
accumulation of large amounts of acetate in the rumen.
All of these varying factors mean that a clear response parameter for a negative
change in the reticuloruminal environment, in response to a diet high in rapidly
fermentable carbohydrates, is extremely hard to define. Buffering mechanisms are
influenced by one another and differ greatly among individuals in the same herd,
receiving the same ration. The variable commonly investigated to determine ruminal
acidosis, reticuloruminal pH, is determined by the equilibrium between these
mechanisms and the supply of protons from the SCFA produced by feed
fermentation and therefore is not a stable or consistent parameter (Calsamiglia et
al., 2012).
As well as SCFA, other parameters in the rumen are often investigated in acidosis
studies, such as the presence of reticuloruminal lipopolysaccharide (LPS) or
histamine. Both LPS and histamine levels in the rumen are affected by acidosis and
the effect of SCFA on pH (Aschenbach et al., 2000, Khafipour et al., 2009). As pH
decreases, the histamine and LPS levels in the rumen are likely to increase. These
parameters are discussed in more detail in section 1.4.2.3.
1.3.3.3 Motility
Reticuloruminal contractions are vital for digestion and have various functions;
mixing ingesta with digesta, minimising effects of stratification and moving
fermentation products to the rumen wall for absorption. They are responsible for
particle sorting and passage, for inoculating ingesta with microbes to allow
fermentative digestion and are vital for regurgitation for rumination and eructation of
free gas arising from fermentation (Waghorn and Reid, 1983).
As with other chambers of the ruminant stomach, the rumen undergoes biphasic
contractions. Rumen motility is controlled via the vagal nerve and contractions occur
every 90 seconds to 3 minutes. The first contraction, the A-wave or backward
moving contraction, originates in the reticulum and passes caudally around the
rumen (Waghorn and Reid, 1983). As some parts of the rumen contract, others relax
and contractions move in a wave like pattern. The second contraction, the B-wave
or forward moving contraction, occurs only in the rumen and is associated with

20
eructation of gas by forcing the gas pocket at the top of the rumen into the cardiac
sphincter to be eructated (Ruckebusch and Tomov, 1973, Waghorn and Reid,
1983). As a result of the A-wave contractions in the reticulum, liquid is rapidly moved
into the rumen. Before completion of the second reticular contraction, the anterior
pillar of the rumen contracts and forms a barrier to the second reticular outflow
(Schalk and Amadon, 1928). The wave of rumen contractions begin at the anterior
pillar and proceed posteriorly, involving the dorsal part of the rumen (Schalk and
Amadon, 1928). Then, as these structures relax, the ventral sac begins its
contraction, forcing ingesta forward and upward into the anterior dorsal region of the
rumen (Baumont and Deswysen, 1991). Following on from this the B-wave involves
only the rumen. Studies into the rate of rumen contractions have been conflicting;
Schalk and Amadon (1928) found that the rate of rumen contractions varies during
rumination, resting and feeding, with contraction most rapid during feeding and
slowest during rumination. In contrast to this, Magee (1932) stated that rumen
movements were most rapid and extensive during rumination. Further work has
suggested that contractions are most frequent during eating and slower during rest
and rumination (Waghorn and Reid, 1983).
A variety of factors can affect the rate of reticuloruminal contractions, such as
reticuloruminal pH, diet and neural conditions. Contraction frequency is highly
affected by diet, and both feed type and intake level play a role in contraction rate,
with high forage diets resulting in a higher frequency of contractions in comparison
to diets high in rapidly fermentable carbohydrates (Waghorn and Reid, 1983). This
follows on from the role of mixing in inoculating ingesta for fermentation; diets high
in forage require more mixing and more rumination to digest, in comparison to diets
high in rapidly fermentable carbohydrates. For example, addition of long forage,
such as barley straw, has been shown to increase contraction frequency of the
reticulorumen during eating and also at rest (Norgaard, 1989).
Measurement and assessment of reticuloruminal function
1.3.4.1 Clinical observations
In addition to clinical examination, several methods are commonly used to observe
reticuloruminal contraction rates. Fistulated animals obviously offer an easier way
to monitor contraction rate, allowing direct access and observations of the rumen
21
wall. However, it is possible to monitor contraction rates in non-fistulated animals
and methods such as electromyography and radiotelemetry do not rely on fistulated
animals, but can be used in them too. Other methods require fistulation, such as
pressure sensitive recordings of ruminal gas or fluids (Egert et al., 2014).
Radiotelemetry measurement of reticuloruminal contractions uses the reticulum’s
ability to retain weighted objects by administering indwelling transmitters which
measure movement or changes in pressure corresponding to reticuloruminal
contractions (Cook et al., 1986). Gyroscopic boluses can be used to collect
frequency change data corresponding to ruminal contractions, measuring motility
(Michie et al., 2015) and can be administered orally, negating the need for fistulated
cattle. As the accuracy and battery life of radiotelemetric systems increases, the use
of bolus-based accelerometers to measure ruminal contraction rate and function will
become easier and more reliable.
1.3.4.2 Fistulated animals
Fistulated animals refer to those which have been surgically fitted with a cannula to
allow access to a specific area to collect samples, introduce feedstuffs or to allow
for transfaunation. In ruminants, cannula are primarily fitted to the rumen but can be
fitted to a number of different areas such as the oesophagus (Van Dyne and Torell,
1964) or other parts of the stomach and GI tract (Harmon and Richards, 1997).
Cannulas vary in size from very small to allow access for tubing/ a syringe to large
enough to allow hand access and bigger.
1.3.4.3 Fistulated animal uses
Animals fitted with ruminal cannula are commonly used in dietary studies to allow
direct access to the rumen for sample collection, to investigate parameters such as
reticuloruminal pH, microbial populations, SCFA concentrations and other
parameters often associated with ruminal acidosis or other dietary conditions.
Cannulae also allow a portal to insert a dietary challenge directly into the rumen,
thus bypassing an animal’s possible refusal to eat a ration. Inappetence is often a
symptom of ruminal acidosis or rumen dysfunction (Radostits et al., 2007) and may
occur in feed trials as a result of the challenge diet fed. There are some limitations
to using a fistulated animal to observe the natural function of a rumen. The rumen
is an anaerobic environment and the presence of a cannula in fistulated animals can

22
change this. However, the presence of the rumen mat above the rumen liquor may
be enough to keep the lower third of the rumen as an anaerobic environment but no
studies address this.
Fistulated animals are also used for collection of ruminal contents to allow for
transfaunation (DePeters and George, 2014). Transfaunation refers to transfer of
ruminal contents from a healthy to a sick individual. Rumen transfaunation has been
used for centuries to alleviate dietary malfunctions. Brag and Hansen (1994) stated
that rumen transfaunation was used long before more recent research
demonstrating the importance of the rumen microorganisms to metabolism, and the
earliest printed reference they found in Swedish literature referring to a similar
practice was from 1776. This early reference stated “it is common practice, even in
the countryside, to take the fodder out of the mouth of a sheep or a goat to give it to
an animal which does not ruminate” (Brag and Hansen, 1994). Subsequent research
related to the discovery of the importance of rumen microbial population occurred
much later in the 1900’s (DePeters and George, 2014). However, as diet affects the
rumen environment and the microbiota, diet has an effect on the success of
transfaunation. This is shown in a study into protozoa-free sheep transfaunation by
Dehority (1978). In this previous study, transfaunation was carried out from an
alfalfa-fed steer into protozoa-free sheep, and found that in sheep fed an alfalfa hay
diet, 24 species of protozoa became established. In contrast, in sheep fed a
concentrate diet, only 9 species of protozoa were established (Dehority, 1978),
showing that diet affects the rumen environment and in turn, the microbiota present.
1.3.4.4 Reticuloruminal pH measurements
Before the use of rumen telemetry, taking samples of ruminal fluid was far more
invasive, requiring oro/nasogastric tubing, fistulation or rumenocentesis to give
access to the rumen to allow repeated measurements to be taken. Reticuloruminal
pH measurements taken this way are more likely to vary due to salivary
contamination (for orogastric tube) (Enemark et al., 2004) and as a result of the fact
that pH varies dependent on the site where the rumenocentesis needle or stomach
tube takes the sample from, pH is not constant across the rumen (Abdela, 2016).
With advances in technology, we have the ability to monitor physiological responses
in cattle, such as temperature, reticuloruminal pH and heart rate, via a telemetric

23
system (AlZahal et al., 2009). Telemetric systems have greatly increased the speed
of disease detection and therefore increased herd health, productivity and welfare
(AlZahal et al., 2009).
The use of rumen telemetry boluses takes advantage of the reticulorumen’s ability
to retain weighted objects, allowing the device to remain in the same position,
transmitting accurate, repeatable recordings for weeks (Mottram et al., 2008). As
technology improves to allow longer battery life and ensure no drift in recordings,
the technology will become even more useful. It is important to note however that
as there are no set standards for ruminal pH yet, interpreting pH observations
obtained via telemetry is still subjective.
Indwelling pH boluses have previously shown a drift in measurements over time.
Drift refers to offset errors in the pH data, commonly due to degradation or damage
to the reference electrode. This degradation or damage can occur due to high
temperatures, extreme pH, high ions in the measurement liquid and any material
coating the glass of the electrode. As a result of this, the reference electrode cannot
function properly and values obtained will begin to gradually increase or decrease -
drifting. Various studies have reported different results when looking at pH drift;
undirected but not significant drifts were noted after 12 hours (Penner et al., 2006),
positive drifts were noted after 10 days (Enemark et al., 2003) and drift was noted
after 48 hours (Kaur et al., 2010). However, it is difficult to compare studies to find
a consistent effect of drift, as there are significant constructional differences and
differences in pH sensors between studies. Glass pH sensors are less likely to drift,
as they are less likely to degrade over time. Additionally, these studies often check
indwelling pH measurements using manual measurement of liquor from the rumen,
and as Enemark et al. (2003) stated there is often a distance between the probe
and the site of the sampling which may account for difference in measured pH (often
between 0.05 and 0.2 units), which appears as drift. In addition, the reticulum’s
ability to retain heavy objects means that boluses are often retained there – not in
the rumen itself. The use of boluses for measuring temperature is well supported
with consistent correlations being shown between indwelling bolus temperature and
rectal temperature (Sievers et al., 2004, Bewley et al., 2008).

24
1.3.4.5 Continuous monitoring
In addition to indwelling rumen boluses, another commonly used method of
continuous monitoring is activity collars. Collars are commonly used to monitor
rumination, eating patterns, activity, oestrus and overall health in cattle (Turner et
al., 2000, Ungar et al., 2005, Kamphuis et al., 2012, González et al., 2015). There
are two main types of collars; accelerometer based and microphone based.
Accelerometer based collars detect changes in movement frequencies, allowing for
identification and notification of changes in activity, eating and rumination. Changes
correlate to overall animal health and are often observed before any clinical
symptoms are observed. This type of collar is able to detect different movement
frequencies, identify, and separate them out as moving, eating and ruminating. The
collars then detect fluctuations from the animal’s norm for each of these types of
movements, to identify when the specific pattern is abnormal for each type of signal.
This allows swift notification for stockowners of changes in rumination or eating that
they may not have detected in a large herd. Microphone style collars work by
recording sounds of mastication. The collars consist of a microphone on the side of
the cow’s neck and the characteristic sounds of regurgitation and rumination are
recorded and processed. Data are then presented as a rumination time for each
individual (Ambris-Vilchis et al., 2015). Collars used in conjunction with indwelling
pH boluses can be a helpful measure for monitoring an animal’s rumination, eating
and oestrous patterns and can help to detect changes earlier than traditional
stockman observations.
1.3.4.6 Other assays for assessing reticuloruminal function
In addition to those methods mentioned, there are other methods used to assess
reticuloruminal function including protozoal counts, gram-positive counts, starch
digestion assays and gas production tests.
Protozoal counts are commonly used in studies into the rumen microbiome and
rumen function, as ciliated protozoal counts are often correlated with digestion in
the animal – the lower the protozoal count, the poorer the rumen function and
fermentation. As protozoal counts are easier and cheaper to carry out than 16S
rRNA sequencing to look at the microbiome as a whole, it allows a small insight into
the presence of different microbiota and gives an idea of the function of the rumen.

25
Rumen activity can also be investigated by studying gas production from the rumen
using the in vitro gas production technique (IVGPT) to simulate the natural
environment of the reticulorumen (Calabro et al., 2012). With IVGPT, feedstuff is
incubated at 39˚C under anaerobic conditions and buffered rumen fluid is added;
gas produced from fermentation of this feedstuff by microbiota present in the rumen
fluid is measured and is indicative of rumen activity (Calabro et al., 2012). IVGPT
has also been used to highlight differences between the rumen activity in different
species of ruminant (cattle, buffalo, ovine etc.) and to allow SCFA determination at
the end of the incubation process, to compare the fermentation process of different
feeds under incubation with SCFA proportions produced (Calabro et al., 2012).
Starch digestibility is often looked at via near infrared analysis (NIR) with faecal
samples. Starch digestibility can be affected by particle size, kernel characteristics,
moisture content, and fermentation (Johnson et al., 2003). Grain is often processed
to increase starch digestibility, to allow for faster fermentation of soluble starches in
the rumen (Johnson et al., 2003). Solubility is therefore important when considering
optimum rumen efficiency and energy utilisation and when considering the risk of
ruminal acidosis from rapid fermentation. By investigating the starch levels in faeces,
the passage and breakdown of starch from the rumen can be tested (Fredin et al.,
2014).
Potential genetic contributions
Although it has not been shown in the literature, as both ruminal acidosis and frothy
bloat are ruminal fermentation disorders associated with dietary input, it is possible
that variation in resistance to ruminal acidosis among individual animals may have
a moderate heritability, given results of studies on the genetic basis of frothy bloat
in cattle. Evidence that susceptibility to bloating is a heritable trait is provided by
variations in expression levels of certain salivary proteins (Rajan et al., 1996) and
greater bloat incidence in the progeny of certain sires (Knapp et al., 1943). There
are several approaches to genetic selection, of which the single nucleotide
polymorphism based (SNP-based) genome-wide association study (GWAS) is most
likely to yield a functional tool for dairy cattle breeders by incorporation into genomic
selection panels. Future studies into the heritability of rumen acidosis may prove
that there is moderate heritability, as with frothy bloat, but this is currently unknown.
However, it should be noted that all GWAS are potentially limited by the ability to

26
define a repeatable and valid phenotype, and rumen acidosis is a challenging
phenotype to define. Given the commonly used name of the condition (sub-acute
ruminal acidosis or SARA), it is surprising that reticulorumen pH is not an excellent
measure. However, pH is limited by the difficulty of measurement, variation in
relation to feeding, diurnal variation and the fact it reflects a chemical end-point of
interactions among SCFA and buffers in the rumen. Possible alternative indicators
might include acute phase proteins such as haptoglobin and serum amyloid A (SAA,
shown to be elevated in SARA), ruminal fluid and plasma histamine concentrations,
ruminal fluid LPS concentrations, expression levels of specific genes (inflammatory
cytokines and immune response markers), variations in specific SCFA
concentrations or some other functional test.
Reticuloruminal dysfunction
Acute acidosis
1.4.1.1 Definition, diagnosis and pathogenesis
Ruminal acidosis can be broken down into 4 categories; peracute, acute, subacute
and mild, as described by Radostits et al. (2007). Acute acidosis is commonly
referred to in the literature by a number of different names: grain poisoning, grain
overload, lactic acidosis, toxic ingestion, acute ruminal impaction, metabolic
acidosis and many more (RAGFAR, 2007). Acute acidosis is referred to as the most
“dramatic” form of ruminal microbial fermentative disorders and can be fatal in less
than 24 hours (Garry and McConnel, 2009). It occurs when animals have access to
a large amount of rapidly fermentable carbohydrates (often grain) which are
consumed in large amounts very quickly. Acute acidosis may occur as a result of a
number of different circumstances; accidental access to grain stores/silos where the
animal may gorge themselves, feeding large amounts of grain without gradual
introduction, sudden change in the type of grain/concentrate being fed, stock
grazing on newly harvested pasture where there may be spilled grain or
unharvested grain present or an animal who is off-feed returning to feed and being
given unrestricted access to rapidly fermentable carbohydrates (Garry and
McConnel, 2009).
Consuming large amounts of rapidly fermentable carbohydrates quickly leads to a
rapid decrease in reticuloruminal pH, development of metabolic acidosis from the

27
absorption of lactic acid, dehydration as a result of diarrhoea and inappetence and
possible endotoxemia from endotoxin release of ruminal bacterial origin as a result
of the lowered pH (Gozho et al., 2005, Cockcroft, 2015). In addition to being rapidly
fermentable, these types of carbohydrates – such as cereal grains – offer less
buffering capacity than high forage/ fibre feeds, due to their decreased particle size,
meaning less salivation and less rumination, lowering the pH and effectiveness of
the ruminal buffering system further (Navarre et al., 2012). Severity of acidosis
therefore depends on the amount and type of carbohydrate ingested and can range
from mild indigestion to fatal toxaemia (Navarre et al., 2012). Affected animals may
die if acidosis is severe and swift action is not taken to remedy it. Severe cases may
require a rumenotomy to remove rumen contents, followed by intravenous (IV)
therapy with 5% sodium bicarbonate, followed by isotonic fluids (Radostits et al.,
2007, Cockcroft, 2015). Less severe cases may be treated with IV alkalinising
therapy, together with a ruminal antacid such as magnesium oxide. Both severe and
less severe cases should be fed hay to encourage salivary buffering and rumination.
Clinical symptoms of acute acidosis include kicking at the abdomen, grinding of
teeth, diarrhoea, inappetence, depression, bloating, elevated heart rate, staggering
and even death (Radostits et al., 2007).
SARA
1.4.2.1 Definition and diagnosis
Subacute ruminal acidosis or SARA is one of the most commonly reported digestive
disorders associated with cattle fed a diet high in rapidly fermentable carbohydrates,
and has been reported globally (Abdela, 2016). In the literature, a wide range of
terms have been used to refer to this condition, leading to confusion over definitions
and which term is technically correct; subacute ruminal acidosis (Nordlund, 2003),
SARA (Garrett et al., 1999), chronic rumen acidosis (Garry, 2002), subclinical rumen
acidosis (Nocek, 1997), as well as chronic latent acidosis and latent acidotic stress
(Kleen et al., 2003). SARA is often reported as being a disorder of high producing
dairy herds, as farmers push for increased milk production with an increase in
rapidly fermentable carbohydrates and a decrease of fibre in the diet to meet energy
requirements. However, despite the focus of SARA research often being on dairy
cattle, it does not solely affect high producing dairy animals, and has been shown in

28
both beef and dairy cattle and under different management styles (Nagaraja and
Titgemeyer, 2007).
The presence of SARA in a herd or individual is usually diagnosed according to
reticuloruminal pH and is characterised by intermittent drops of reticuloruminal pH
below a certain threshold. However, there is much disagreement as to the standard
definition of SARA and there is no definitive standard of ruminal pH values which
are detrimental to cattle health and production (Plaizier et al., 2008).
SARA is often defined as “periods of moderately depressed ruminal pH (about 5.5-
5) that are between acute and chronic in duration”,despite SARA often being
referred to as chronic acidosis in literature (Garrett et al., 1999, Nordlund, 2003).
There are a wide range of current definitions of SARA, based on a varying range of
ruminal fluid pH values and they are dependent on both the method by which
samples are collected and the time of day of sampling, as reticuloruminal pH varies
across 24 hours. Varying thresholds and definitions are noted below in table 1-1.
Table 1-1: Differing pH thresholds as detailed in literature, dependent on collection method and criteria.
pH threshold Criteria Collection Method Reference
5.5 None specified Rumenocentesis (Garrett et al., 1999)
6 4 hr post feeding Oral probe/ stomach tube (Plaizier, 2004)
5.6 Time spent below pH 5.6 Indwelling probe (Gozho et al., 2005)
5.6 Average pH vs. area below pH 5.6 Indwelling probe (Cooper et al., 1999)
Additionally, Duffield et al. (2004) found that ruminal fluid collected via cannula from
the ventral sac and via stomach tube were 0.33 and 0.35 pH units higher than fluid
collected by rumenocentesis. Therefore, creating a standard for the diagnosis of
SARA requires standardising the method and timing of ruminal fluid collection and
the threshold pH value needs to consider these factors. Based on these findings, it
has been proposed that thresholds for pH indicating SARA should be 5.5, 5.8 and
5.9 when rumen fluid samples are collected by rumenocentesis, through rumen
cannula from the ventral sac, and using an oral probe respectively (Abdela, 2016).
Multiple definitions and variability in results of sampling methods have led to many
differing interpretations of “SARA” in the literature.

29
1.4.2.2 Dietary thresholds and risk factors
Feeding a diet high in rapidly fermentable carbohydrates and low in fibre is
extremely common to increase milk production in early lactation dairy cows and is
seen in beef cattle, particularly when finishing cattle for slaughter to boost growth
(Steen, 2001, Hernandez et al., 2014). As the amount of high energy, easily
palatable carbohydrate in the diet increases, reticuloruminal pH decreases due to
the production of SCFA (Dijkstra et al., 2012). There is variation among individual
animals in the extent to which they are susceptible to the low pH associated with
this diet for a number of reasons; feed intake variation, eating rate variation, diet
selection, salivation rate, inherent ruminal microbiome population, previous
exposure to low pH and outflow from the rumen (Dijkstra et al., 2012). With more
rapidly fermentable foods, such as barley and other grains, rate of starch
degradation is increased and leads to faster production of SCFA (Dijkstra et al.,
2012).
Dietary management is key for preventing ruminal acidosis, especially in dairy herds
where dietary changes following calving can increase incidences of acidosis
(Beauchemin, 2007). Cattle require a diet that is adequate in fibre for the proper
functioning of their rumen; if the quantity and quality of dietary fibre is poor, the
normal physiology of the rumen is impaired and there is increased risk of acidosis
(Zebeli et al., 2011). Breaking thresholds suggested for the maximum starch and
sugar in a diet, in conjunction with disregard for the minimum NDF in modern dairy
diets may predispose animals to developing SARA.
The calculation of dietary energy balance for lactating cows is calculated by first
predicting feed intake and considering concentrate feeding level, live weight, week
of lactation and milk yield (NRC, 2001). Early transition cows (where the transition
period refers to the 3 weeks before and after calving) and cows at peak dry matter
intake (DMI) are often reported as being at the most risk of developing SARA due
to rapid introduction to high energy dense diets (Mulligan et al., 2006). However, if
care were taken to ensure an appropriate transition phase in these cattle, instead of
allowing a rapid increase in starch and sugar consumption, coupled with low DMI
and forage intake, then cows would be at less risk of SARA (Mulligan et al., 2016).
As reported by Mulligan et al. (2006), in a study into the prevalence of SARA in dairy
cattle, Oetzel (2011) found higher prevalence in cows ranging from 80-150 days in
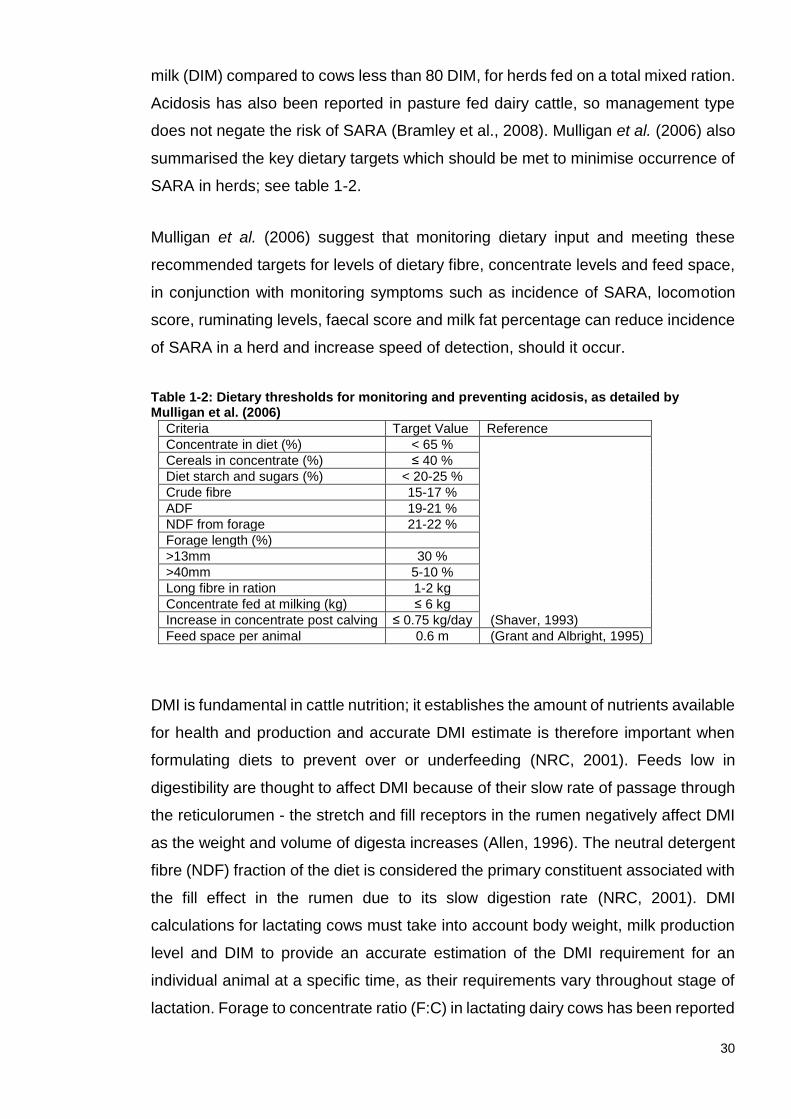
30
milk (DIM) compared to cows less than 80 DIM, for herds fed on a total mixed ration.
Acidosis has also been reported in pasture fed dairy cattle, so management type
does not negate the risk of SARA (Bramley et al., 2008). Mulligan et al. (2006) also
summarised the key dietary targets which should be met to minimise occurrence of
SARA in herds; see table 1-2.
Mulligan et al. (2006) suggest that monitoring dietary input and meeting these
recommended targets for levels of dietary fibre, concentrate levels and feed space,
in conjunction with monitoring symptoms such as incidence of SARA, locomotion
score, ruminating levels, faecal score and milk fat percentage can reduce incidence
of SARA in a herd and increase speed of detection, should it occur.
Table 1-2: Dietary thresholds for monitoring and preventing acidosis, as detailed by Mulligan et al. (2006)
Criteria Target Value Reference
Concentrate in diet (%) < 65 %
(Shaver, 1993)
Cereals in concentrate (%) ≤ 40 %
Diet starch and sugars (%) < 20-25 %
Crude fibre 15-17 %
ADF 19-21 %
NDF from forage 21-22 %
Forage length (%) >13mm 30 %
>40mm 5-10 %
Long fibre in ration 1-2 kg
Concentrate fed at milking (kg) ≤ 6 kg
Increase in concentrate post calving ≤ 0.75 kg/day
Feed space per animal 0.6 m (Grant and Albright, 1995)
DMI is fundamental in cattle nutrition; it establishes the amount of nutrients available
for health and production and accurate DMI estimate is therefore important when
formulating diets to prevent over or underfeeding (NRC, 2001). Feeds low in
digestibility are thought to affect DMI because of their slow rate of passage through
the reticulorumen - the stretch and fill receptors in the rumen negatively affect DMI
as the weight and volume of digesta increases (Allen, 1996). The neutral detergent
fibre (NDF) fraction of the diet is considered the primary constituent associated with
the fill effect in the rumen due to its slow digestion rate (NRC, 2001). DMI
calculations for lactating cows must take into account body weight, milk production
level and DIM to provide an accurate estimation of the DMI requirement for an
individual animal at a specific time, as their requirements vary throughout stage of
lactation. Forage to concentrate ratio (F:C) in lactating dairy cows has been reported
31
to affect DMI, however NRC suggests that this affect is probably more to do with the
amount and digestibility of the forage itself and the limiting effect of propionate on
DMI, rather than a specific ratio of F:C having an effect (Allen, 2000, NRC, 2001).
Neutral detergent fibre (NDF) is also associated with DMI and Mertens (1994)
suggests that NDF be used to define the upper and lower limits of DMI. The NRC
(2001) states that with diets with a high NDF concentration, rumen fill limits DMI and
in diets with low NDF concentrations, energy feedback inhibitors limit DMI (NRC,
2001). Competition for food and space available for feeding also affects DMI.
Behaviour at the feed bunk is affected by dominance and cows with a higher social
rank spend more time feeding and eat more than those with a lower rank, regardless
of their production level and the intake they should be at (Aafjes, 1967, Garry and
McConnel, 2009). Feed bunk surface position can also affect both DMI and buffering
which in turn affect SARA risk. It has been shown than cattle eating in a natural
grazing position with their heads down produce more saliva than cattle with their
heads held horizontally (Garry and McConnel, 2009).
Carbohydrate percentages in diets can be broken down into structural and non-
structural carbohydrates (NSC). Non-structural carbohydrates are those found
inside the cells of plants and structural carbohydrates are those found in plant cell
walls. Structural carbohydrates must be broken down via bacterial fermentation and
cannot be broken down by mammalian enzymes (NRC, 2001). NSC such as sugars,
starches and SCFA are the major source of energy for ruminants. These NSC are
highly digestible, although rate of fermentation varies dependent on source, and
they are usually increased in diets while NDF is reduced, to meet energy
requirements of high producing cattle. The ideal level of this rapidly fermentable
carbohydrate in diets is not well defined and to avoid acidosis an optimal level must
be found. Generally, it is suggested that the maximum concentration of NSC should
be roughly 30-40% of DM (Shaver, 1993, Nocek, 1997). However, in modern
agriculture, animals are often fed at a level which pushes this maximum
concentration far higher to provide a larger amount of energy to increase production,
which can result in ruminal acidosis (Abdela, 2016). Therefore, accurate calculation
of the various percentages of starches, sugars, concentrates and fibre is important
to reduce the risk of SARA in a herd.
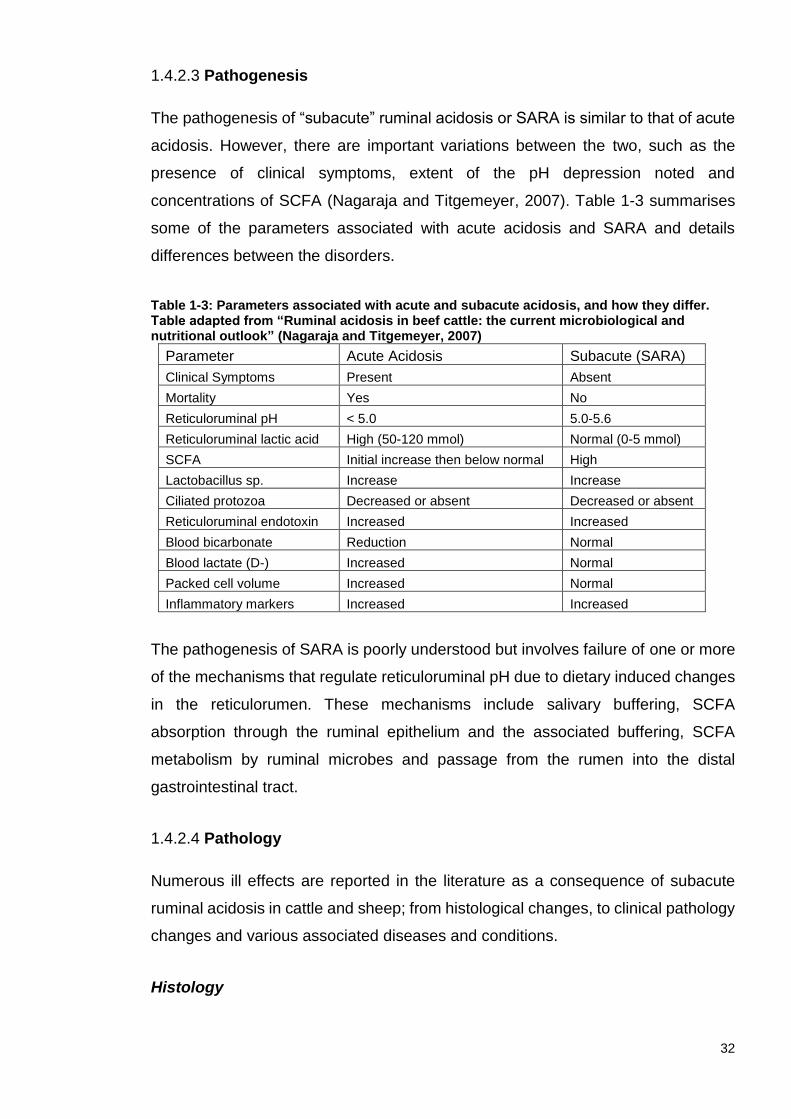
32
1.4.2.3 Pathogenesis
The pathogenesis of “subacute” ruminal acidosis or SARA is similar to that of acute
acidosis. However, there are important variations between the two, such as the
presence of clinical symptoms, extent of the pH depression noted and
concentrations of SCFA (Nagaraja and Titgemeyer, 2007). Table 1-3 summarises
some of the parameters associated with acute acidosis and SARA and details
differences between the disorders.
Table 1-3: Parameters associated with acute and subacute acidosis, and how they differ. Table adapted from “Ruminal acidosis in beef cattle: the current microbiological and nutritional outlook” (Nagaraja and Titgemeyer, 2007)
Parameter Acute Acidosis Subacute (SARA)
Clinical Symptoms Present Absent
Mortality Yes No
Reticuloruminal pH < 5.0 5.0-5.6
Reticuloruminal lactic acid High (50-120 mmol) Normal (0-5 mmol)
SCFA Initial increase then below normal High
Lactobacillus sp. Increase Increase
Ciliated protozoa Decreased or absent Decreased or absent
Reticuloruminal endotoxin Increased Increased
Blood bicarbonate Reduction Normal
Blood lactate (D-) Increased Normal
Packed cell volume Increased Normal
Inflammatory markers Increased Increased
The pathogenesis of SARA is poorly understood but involves failure of one or more
of the mechanisms that regulate reticuloruminal pH due to dietary induced changes
in the reticulorumen. These mechanisms include salivary buffering, SCFA
absorption through the ruminal epithelium and the associated buffering, SCFA
metabolism by ruminal microbes and passage from the rumen into the distal
gastrointestinal tract.
1.4.2.4 Pathology
Numerous ill effects are reported in the literature as a consequence of subacute
ruminal acidosis in cattle and sheep; from histological changes, to clinical pathology
changes and various associated diseases and conditions.
Histology
33
Various ultrastructural and histological changes associated with SARA have been
reported in the literature. In a study by Steele et al. (2009) into the effect of induced
ruminal acidosis with a high grain diet on the ruminal epithelium, animals were split
into high grain and high forage diets. In high forage animals, papillae obtained
showed an intact keratinised SC, as should be expected, with longer and deeper
crevices throughout the surface of the papillae (Steele et al., 2009). In comparison,
papillae from animals from the high grain group showed evidence of extensive
sloughing of the SC and non-differentiated keratinocytes on the surface of the
epithelium – something often associated with parakeratosis (Steele et al., 2009).
Also evident was a difference in the microbial colonisation of the rumen, with
microbiota being far more evident in high forage papillae and a greater number of
microbial phenotypes were present (Steele et al., 2009). The extent of the SC
sloughing in high grain fed animals was further investigated and showed not only an
increase in sloughing but also an increased migration of SB cells towards the lumen,
leading to loss of demarcation of different layers. There was also a loss of cell
adhesion with large gaps between cells of the SC and SG (Steele et al., 2009). In a
further study by Steele et al. (2011a) investigating the ultrastructural changes in an
animal fed an acidosis inducing high grain diet in comparison to a high forage diet,
the study showed significant changes in the thickness of the SC, SB and SS – all of
which were reduced on the high grain diet. The study found that the reintroduction
of high forage diets into these animals resulted in increased thickness in all layers
(Steele et al., 2011a). The high grain diet animals also showed reduced indentations
on the surface of the papillae and reduced microflora present in comparison to the
high forage diet, similar to the results observed in the 2009 study (Steele et al.,
2011a).
Changes in tight junctions in the rumen epithelium have been associated with
“barrier failures” – often reported as being responsible for release of endotoxins and
ruminal bacteria into circulation from the rumen. Loss of tight occluding junctions
was observed in Steele et al.’s (2009) study, where high grain animals displayed
loss of cell adhesion and large gaps were evident between cells and has been
reported in other studies (Steele et al., 2012, Liu et al., 2013). Tight junctions in the
middle layers of the rumen epithelium, SG and SS, play a key role in regulating
permeability of the ruminal barrier and preventing translocation of endotoxins and
bacteria (Liu et al., 2013). Impairment of tight junctions is commonly observed in
34
intestinal inflammatory diseases, such as Crohn’s disease in humans, and similarly,
changes in tight junctions in cattle appear to be as a result of local inflammation
from high grain diet induced inflammation altering tight junction protein expression
and localisation (Liu et al., 2013).
LPS
Soluble lipopolysaccharide (LPS) has long been associated with symptoms thought
to be caused by diets high in rapidly fermentable carbohydrates in ruminants, such
as liver abscesses and laminitis, and is known to be causative in some forms of liver
failure. LPS, also known as endotoxin, is a component of the outer membrane of
gram-negative ruminal bacteria, released during bacterial lysis. It can migrate from
the rumen into the circulation (blood and lymph) as a result of failure of the rumen
epithelial tight junctions, where it can spread to other organs and is capable of
eliciting a host immune response (Plaizier et al., 2012). During bouts of high acid in
the rumen, the barrier function of the rumen wall is reduced, increasing risk of LPS
leaking through and entering the circulation. Despite this, Plaizier (2012) claims
there is limited evidence for increases of LPS in peripheral blood during acidosis but
suggests this may due to inadequate sensitivities of LPS tests or fast clearance of
LPS from blood (Plaizier et al., 2012). Depending on the severity of the leakage of
LPS, immune response may be local or systemic. Different types of rapidly
fermentable carbohydrates can affect the type of inflammatory response observed
in cattle, particularly inflammation/ immune response because of LPS and other
endotoxin translocation. In two studies, it was found that diets high in ground alfalfa
hay pellets induced rumen pH drops representative of those associated with SARA
but without the innate immune response observed in grain induced SARA and
associated with shedding of LPS (Khafipour et al., 2009, Li et al., 2012b). This
difference between the two types of dietary induced pH drop shows that the current
SARA diagnosis, reliant only on pH depression, is perhaps outdated and does not
consider where pH drops but there is no immune or negative response.
Histamine
In addition to an LPS inflammatory response, during reticuloruminal pH depression,
histamine translocation through the rumen wall can further exacerbate inflammation.
Histamine, like LPS, is of ruminal bacterial origin. Studies have shown that under
35
normal pH conditions, the permeability of the rumen wall to histamine is low but as
the pH decreases, absorption increases significantly (Aschenbach et al., 2000).
Histamine is associated with the pathogenesis of bronchial constriction and
cardiovascular shock and is an important regulator of food and drink intake in cattle
(Plaizier et al., 2008). Therefore, changes in histamine levels and absorption across
the rumen wall can be expected to have a systemic effect as opposed to a purely
localised reaction in the rumen (Plaizier et al., 2008).
Blood parameters
In addition to those responses seen in the rumen wall, there are also changes
observed in blood metabolites and haematology and biochemistry profiles. In a
study comparing cattle fed high forage and high grain diets, plasma glucose and
plasma beta-hydroxybutyrate (βHB) were significantly higher in cattle on the high
grain diet than on the high forage diet (Steele et al., 2009). Non-esterified fatty acids
(NEFA) levels in the blood did not change. High glucose levels in the high grain diet
is thought to be as a result of the increased energy intake but increased βHB is
hypothesised to occur from increased ketogenesis in the rumen epithelium as a
result of the grain diet (Steele et al., 2009). This hypothesis was confirmed by qPCR,
looking at the gene responsible for ketogenesis in the rumen. Expression of this
gene increased 1.6 times during the high grain diet in comparison to the high forage
diet (Steele et al., 2009). Increased βHB concentrations in blood indicate stimulation
of lipolysis or excess absorption of butyrate in ruminants, which can arise by feeding
of spoiled silage. Lipolysis is stimulated by any condition leading to negative energy
balance such as anorexia, late pregnancy or lactation and exercise. In cows in late
pregnancy, negative energy balance may be exacerbated by a state of insulin
resistance due to high levels of progesterone. This promotes ketogenesis by
causing a shift in energy metabolism from glucose to fat and by decreasing
conversion of dietary or endogenous triglycerides to stored fat (Cornell University,
2013). However, despite the increase in βHB and non-response seen in NEFA in
the study by Steele et al. (Steele et al., 2009), in another study into the long term
effects of SARA in lactating goats, goats fed a high concentrate diet showed a
significant increase in NEFA levels in comparison to low concentrate fed animals
(Dong et al., 2013). Thus, showing again the variation among animals in their
response to a diet expected to induce acidosis.

36
Extra-ruminal pathology
As well as the pathology associated with the rumen wall and inflammatory
responses, there are various forms of extra-ruminal pathology associated with a diet
high in rapidly fermentable carbohydrates and acidosis or SARA. Milk fat depression
is often referred to as a consequence of SARA in literature. However, there is some
disagreement on whether it should be considered as such. Allen (1997) noted that
milk fat only partly correlates to ruminal pH and is a difficult measurement to interpret
in early lactation cows due to interactions with body fat mobilisation. It is for these
reasons that Kleen et al. (2003) stated that milk fat depression cannot be considered
a direct consequence of decreased ruminal pH and SARA and in fact, low milk fat
disorders are likely to occur independently in situations where SARA may also occur
– not as a direct result of one another. In comparison, Plaizier et al. (2008) stated
that milk fat and milk yield depression do occur as a result of SARA and that it may
cost farmers up to a loss of $400 (USD) per cow, per lactation. However, Plaizier et
al. (2008) did acknowledge that several studies (Keunen et al., 2002, Gozho et al.,
2007) did not see a decline in milk fat as a result of grain induced acidosis in cattle.
It has been proposed that this inconsistency in the literature and results regarding
milk fat could reflect the fact that there is a milk yield reduction in some cases,
positively correlated with milk fat percentage, or could be due to the variation in
durations of the bout of acidosis. Short bouts of acidosis are thought to be unlikely
to have a large effect on milk fat in comparison to repeated or longer bouts (Krause
and Oetzel, 2005). Due to this inconsistency in the results, milk parameters alone
do not make a good candidate as a marker for identifying ruminal acidosis/SARA
susceptibility.
Laminitis
Another condition commonly associated with acidosis and SARA in the literature is
laminitis. Laminitis is defined as an inflammation of the claw laminae. The corium
(layer containing blood vessels, connective tissue and fat) is most susceptible to
injury and inflammation, and other regions such as the sole (papillar region) are also
often affected in bovine laminitis (Greenough and Vermunt, 1991). Release of
vasoactive histamines and endotoxins, like LPS, from the rumen due to decreasing
pH and resulting degradation of the rumen wall are thought to be responsible for
bovine laminitis in animals on a diet high in rapidly fermentable carbohydrates

37
(Nocek, 1997). The vasoactive actions of the substances lead to ischemia and
inflammation in the hoof, eventually leading to physical damage of the structures
between tissues, affecting locomotion. In time, this can result in permanent
anatomical damage to the animal (Nocek, 1997). Symptoms of subclinical laminitis
include haemorrhages on the soles, yellow discolouration, double soles, heel
erosion and ridging of the dorsal wall (Nocek, 1997). Despite the possible
correlations, Brent (1976) stated that laminitis was most likely not caused as a result
of the leakage of ruminal histamine because histamine is poorly absorbed and any
that is absorbed is rapidly metabolised. Brent (1976) also stated that ruminal
histamine was unlikely to be the sole cause of laminitis in cattle, as high levels of
orally administered histamine have failed to create a laminitis type response. The
relationship between laminitis and acidosis is poorly understood and even the
mechanisms of laminitis itself are often reported with contradictory definitions. In
addition to this, laminitis does not always occur, even in animals with acute acidosis.
These various reasons lead to it being a poor parameter to consider alone as a
marker for identifying ruminal acidosis or SARA susceptibility.
Liver abscesses
Also commonly associated in the literature with cattle with decreased reticuloruminal
pH are liver abscesses. These are thought to be caused by translocation of rumen
bacteria, such as Fuscobacterium necrophorum, to the circulation as a result of
decreased ruminal barrier function, due to decreased pH causing leakage (Plaizier
et al., 2008). Nagaraja and Chengappa (1998) found an incidence of liver abscesses
ranging between 12-32% on average in feedlot cattle, on a diet high in rapidly
fermentable carbohydrates, and found F.necrophorum to be the main cause.
Abscesses in cattle can cause major financial losses due to reduced performance
and reduced carcase yield. As with laminitis, liver abscesses are not consistently
reported in cattle diagnosed with acidosis or SARA and this, coupled with the fact
that they are visible only at slaughter, makes them a poor parameter to investigate
as a diagnostic marker.
Motility disorders
Reticuloruminal contractions, as well as being affected by local pH changes and
dietary differences, have been shown to be controlled by the central nervous system
38
(Rousseau and Falempin, 1985). The vagus nerve is involved with both the
stimulation and inhibition of contractions and the splanchnic nerve is involved in
inhibition (Rousseau and Falempin, 1985). Stretch receptors in the rumen stimulate
contractions when the rumen is full via the vagus nerve, and stimulation of epithelial
receptors near the cardiac sphincter stimulates contractions. Duncan (1953)
demonstrated the role of the vagus nerve in a study where sheep underwent a
vagotomy to observe the effect on contractions. These sheep had complete
disappearance of the normal contractions and movements of the rumen and
reticulum, a complete stop in rumination and decreased contraction in the
abomasum, eventually leading to death. This previous study found that after some
weeks, in sheep that survived the vagotomy by directly feeding into the abomasum,
some activity returned to the reticulorumen. However, this movement never
matched the normal, rhythmic contractions of prior to the vagotomy and it was not
propulsive enough to move digesta through the animal (Duncan, 1953). In the same
study, sheep also underwent a sphlanchnotomy to observe the role the splanchnic
nerve plays in contractions. The sphlanchnotomy did not have a significant effect on
rumen or reticular motility or movement through the animal and did not have an
increased effect in animals who had already underwent a vagotomy (Duncan, 1953).
Thus, it appears that stimulation via the vagus nerve is vital for proper reticulorumen
function.
There are a variety of different disorders and mechanisms which cause
reticulorumen dystonia and affect the normal rhythmical contractions of the
reticulorumen. These include acidotic conditions, microflora inactivity, acidosis and
alkalosis (Sederevicius and Kantautaite, 1993), general anaesthesia and disease
which causes pain or fever and can inhibit the hindbrain reflex centre responsible
for contractions in the rumen (Leek, 1983). Indigestion, ruminal impaction and
hypocalcaemia/ milk fever can also all cause ruminal contraction stasis and upset
(Leek, 1983). Grain engorgement and bloat also excite the epithelial receptors of
the ruminal smooth muscle, which inhibits motility (Leek, 1983). In addition, vagal
indigestion (VI) following surgical correction of right abomasal displacement or
abomasal volvulus can affect reticuloruminal motility (Sattler et al., 2000). VI has
been shown to occur in 14-21% of cases following surgery (Smith, 1978, Constable
et al., 1991) and has a high fatality rate in cattle, with only 11.5-20% of affected
cattle returning to production (Constable et al., 1991). As these various conditions

39
affect ruminal motility, monitoring ruminal contractions alone, although giving an
overall idea of ruminal health, is not suitable as a sole marker for acidosis or SARA.
Reticuloruminal alkalosis
Reticuloruminal acidosis is characterised by an increase in hydrogen ion
concentration in the rumen and an associated pH decrease. Conversely,
reticuloruminal alkalosis is characterised by a decrease in hydrogen ions in the
rumen and an associated pH increase. Metabolic alkalosis occurs commonly in
domestic animals and is associated with digestive disturbances in ruminants
(Dehkordi and Dehkordi, 2011). It commonly occurs when microbial fermentation is
reduced while the animal continues to ingest saliva and its buffers (Garry and
McConnel, 2009).
A ruminal fluid pH of between 7 and 7.5 in cattle with alkalosis is often caused by
prolonged anorexia and microbiome inactivity, caused by poorly digestible forage
and simple indigestion. The low rate of fermentation does not generate enough
SCFA to neutralise the alkaline pH of the bovine saliva and absorption of SCFA
continues, causing additional bicarbonate production in the rumen (Aafjes, 1967).
Acetate absorption is associated with greater generation of bicarbonate in the rumen
than other SCFA, and acetate is the SCFA produced in the largest amounts during
the fermentation of forage (Garry and McConnel, 2009). Excessive bicarbonate
administration as an additional dietary buffer is also a potential cause of metabolic
alkalosis (Radostits et al., 2007). The clinical symptoms of reticuloruminal alkalosis
include tetany, elevated serum bicarbonate, elevated blood pH and an increased
abomasal pH and reduction in respiratory ventilation (Busch et al., 2011).
Ruminal alkalosis can also occur in conjunction with the generation of excessive
ammonia. Ammonia concentrations in the rumen increase when high protein diets
are fermented but the pH usually does not rise above neutral, as these diets also
contain enough rapidly fermentable carbohydrates to produce enough SCFA to
counteract the pH increase (Garry and McConnel, 2009). However, with diets high
in protein or diets high in non-protein nitrogen sources such as urea and ammonium
phosphate, much more dramatic increases in ammonia concentration and pH can
occur. Due to this interaction, some of the signs of urea poisoning are similar to

40
those seen in non-urea caused alkalosis, such as bloat, abdominal pain,
inappetence, tympany and diarrhoea (Schelcher et al., 1992).
Strategies for controlling SARA
Mineral buffers
Commonly used as exogenous buffers, sodium bicarbonate (NaHCO3) and
magnesium oxide (MgO) are utilised to stabilise the reticuloruminal pH of cattle
suffering or at risk of ruminal acidosis. NaHCO3 can enter the rumen via the diet or
in saliva, it is a weak base which buffers hydrogen ions and is characterised by an
acid dissociation constant (pka = 6.25), similar to that of the normal rumen pH (Mao
et al., 2017). NaHCO3 is recognised as an efficient buffer because of its high acid
consuming capacity in the rumen, and its mode of action is well documented in the
literature (Marden et al., 2008). Feeding NaHCO3 has been shown to raise ruminal
pH (Le Ruyet and Tucker, 1992) by neutralising excess protons in the rumen,
increasing water intake and increasing the rate of passage through the rumen (Mao
et al., 2017). Some published work has argued that addition of NaHCO3 to ruminal
rations has little direct impact on reticuloruminal pH, as the rumen is already
saturated with CO2 (Russell and Chow, 1993). However, further studies have argued
that NaHCO3 directly neutralises ruminal fluid pH even under high CO2, as CO2 is
eructated (Kohn and Dunlap, 1998, Mandebvu and Galbraith, 1999).
MgO supplementation of the diet is common as both a magnesium source for
ruminants and as a rumen alkalising agent to help raise reticuloruminal pH
(Tsiplakou et al., 2017). As cattle have limited availability to store magnesium, MgO
supplementation of the diet allows them a daily intake to maintain normal body
function as well as acting as a slow realise neutralising agent (Tsiplakou et al., 2017).
MgO supplementation has been shown to increase feed inversion ratio and average
daily gain in sheep and increase feed intake in cattle (Stokes et al., 1986, Hashemi
et al., 2012).
Caustic treatment
In addition to dietary additives, methods of grain processing can also be used to
influence reticuloruminal pH, diet effectiveness and voluntary intake of grain. There
are 2 main types of grain processing; physical and chemical. Physical processing

41
such as rolling, crimping or heating of grain, break down the outer layers of the grain
(de-lignifying) and increase starch digestibility by increasing ease of access for
ruminal microbiota (Theurer, 1986). Chemical treatments with alkalis e.g. sodium
hydroxide (NaOH) (caustic treatment or soda grain), ammonia and urea are also
used to de-lignify grain and increase starch digestibility (Campling, 1991).
In addition to raising reticuloruminal pH, NaOH treated grains were shown to
significantly increase carcass weight in lambs in comparison to lambs fed untreated
grains (Ørskov et al., 1981). However, there were large differences between lambs
fed NaOH treated oat and NaOH treated barley. Lambs fed treated barley had larger
gut content weight, negating their carcass gains but the treated oat group did not
(Ørskov et al., 1981). Therefore, type of grain being treated and fed is important to
consider when interpreting output of carcass gains from studies. Overall however,
there were no significant differences in food utilisation between NaOH treated barley,
wheat and maize, and caustic treatment of the grain did not affect the reticuloruminal
appearance at slaughter and appeared to cause no negative effects (Ørskov et al.,
1981).
As well as caustic treated grains, grains are urea treated, traditionally as a
preservative to stop spoilage. In addition to helping store grain, this added non-
protein nitrogen obtained from the urea can increase crude protein content. There
is a strong anecdotal belief among farmers that urea treated grains are associated
with an increase in reticuloruminal pH. However, there appears to be no literature-
based evidence of this effect and previous limited studies have shown no effect of
urea treated grains on reticuloruminal pH (Ørskov and Fraser, 1975).
Clays
Oral supplementation of diets with clay in cattle is relatively common. Many different
types of clays are used as buffers; phyllosilicates, which can be further broken down
into digestive aids like kaolinite, smectites, chlorites and micas (Adamis and
Williams, 2005) and enterosorbents like smectite bentonites.
Bentonites are clays with a high adsorbent capacity and are not necessarily
regarded as a ruminal pH buffer (Trckova et al.). This capability to bind liquids allows
them to be utilised widely to adsorb toxins such as heavy metals and bacteria

42
(Hassen et al., 2003) or toxic agents such as endotoxins and aflatoxins (Ditter et al.,
1983). In a study into the adsorbent capacity of many different types of clay and
their ability to adsorb and remove toxins, bentonite was shown to be the most
effective at prevention of endotoxemia by adsorbing the endotoxin (Ditter et al.,
1983). In animal diets, bentonites are added to function as an enterosorbent that
rapidly bind toxins from the digestive tract, often aflatoxin, reducing their absorption
by the animal and minimising adverse effects on the host (Phillips et al., 2002).
Bentonite is often used in conjunction with NaHCO3 to regulate ruminal acidosis.
The reported effect of bentonite itself on acidosis varies widely, with some studies
stating there is no effect on acidosis from clay inclusion in the diet and that is purely
an adsorptive measure and others stating that inclusion of clay reduced time spent
at an acidotic pH (Dunn et al., 1979). Sulzburger et al. (2016) found that addition of
clay to a high grain diet in dairy cows, in comparison to a high grain diet with no clay,
showed that cows receiving clay had higher reticuloruminal pH, higher faecal pH,
less time spent below pH 5.6 and had higher milk yield and milk fat.
Ammonia
Ammonia treated grains in the UK are commonly used as a source of non-protein
nitrogen for ruminants (Loosli and McDonald, 1968). Non-protein nitrogen refers to
components in a diet that are not a protein but can be converted to protein by rumen
microbiota and has a lower cost compared to animal and plant proteins in diets. As
with caustic treated grains, there is an anecdotal belief that ammonia treated grains
act as buffering agents, raising ruminal pH and they are marketed as such. However,
there is no literature-based evidence of this effect. The pH of ammonia treated grain
is typically between pH 8 and 9 (Lowman, 2017). Ammonia treated grains are
alkaline, have an increased protein content and increased digestibility, as ammonia
has a de-lignifying effect on the grain (Lowman, 2017). In the UK, 2 commercially
available products, “Maxammon®” (Harbro Ltd.) and “Home n’ Dry®” (FiveF Alka
Ltd.), are most commonly used on farm to increase nitrogen content of grain and
are marketed as rumen buffers, capable of raising reticuloruminal pH (Maxammon
- unpublished, commercial in confidence, 2018) . Treatments are also often reported
as preserving grain, as the urea in these treatments breaks down to ammonia, which
destroys microbes, moulds and mycotoxins in the grain – effectively sterilising it.
43
Particle size
The design of a cattle ration and the manner in which it performs in the rumen is
determined by a balance between the physically effective fibre from neutral
detergent fibre (peNDF) present and its associated salivary flow, and the amount of
rapidly fermentable carbohydrates and their resultant SCFA produced (NRC, 2001).
Mertens (1997) describes physically effective NDF as being specifically “the fraction
of fibre that stimulates chewing and contributes to the floating mat of large particles
in the rumen”. In diets high in rapidly fermentable concentrates, there is often low
fibre content from forage, as the diet focuses on maximising the energy intake of the
cattle - easier to do with higher proportions of concentrates.
Addition of NDF from forage, with an adequate particle length, in these diets is
necessary to allow proper ruminal function, as peNDF, particularly coarse or long
particles, influences the animal’s intake of dry matter and stimulates chewing activity
and rumination and increases salivary output (Beauchemin et al., 2003, Oh et al.,
2016). Finely chopped forages may arise due to the specific type of processing
before silage fermentation. It has been shown that long forage chop lengths may
result in poor silage fermentation due to difficulties packing and maintaining the
anaerobic conditions needed and therefore this may push the industry processing
towards the use of a shorter chop length (Johnson et al., 2003). Feeding finely
processed forages with a small particle size has been shown to decrease the time
spent chewing, lower reticuloruminal pH and can alter the fat percentage of milk
(Yang et al., 2001, Krause and Combs, 2003). The relationship between particle
size and pH is well documented in the literature and smaller particle sizes have been
shown to be associated not only with a decrease in mean ruminal pH but have been
shown to affect the postprandial pH pattern (Grant et al., 1990, Beauchemin, 1991,
Krause et al., 2002). Conversely, as would be expected, increased particle length
has been shown to increase milk fat percentage (Yang et al., 2001). Therefore, chop
length and particle size, along with any treatment of grains is important when
considering the effects of a diet and trying to combat or prevent the occurrence of
acidosis or SARA.
44
Direct fed microbials
In an effort to aid and further natural buffering in cattle, some farms choose to
include a manufactured pre/probiotic additive in the diet. Some commonly used
commercial additives include various types of yeast and bacteria. These additives
have a non-nutrient role and are thought to increase the buffering capacity of the
rumen through various different mechanisms, dependent on the type of additive.
Yeast, bacteria, fungal and protozoal additives, particularly yeast, are very
commonly used in dairy rations globally and are also known as direct fed microbials
(DFM) and sometimes probiotics. The term probiotics has several different
definitions and has been used to refer to microbial cultures, culture extracts, enzyme
preparations and various combinations of these. Due to this confusion, the term
DFM must be used by feed manufacturers in the USA and the term is used
throughout the UK and by the government body the Food Standards Agency (FSA).
DFM are defined by as a “source of live, naturally occurring organisms” (Yoon and
Stern, 1995, Pendleton, 1998). DFM have been hypothesised to increase ruminal
buffering capacity, increase DMI, increase milk production, reduce the use of
antibiotics in neonates and stressed calves and to improve daily gain in cattle via
increased feed efficiency (Krehbiel et al., 2003, Nocek and Kautz, 2006).
1.5.6.1 Bacterial DFM
Specific strains of Enterococcus bacteria have been shown to increase mean rumen
pH and increase mean daily pH (Nocek et al., 2002) and specific Enterococcus
faecium strains have been shown to increase prepartum intake and postpartum
production in high producing dairy cattle (Nocek et al., 2003). These DFM are
intended to exploit interactions between microorganisms present in the rumen and
drive populations and interactions in a direction most favourable to rumen and host
health and production. Cultures of Lactobacillus acidophilus have been shown to
reduce faecal shedding of Escherichia coli O157:H7 (Shiga toxin producing strain,
which causes major disease outbreaks in humans and survives in the bovine GI
tract (Lim et al., 2010)) in feedlot cattle (Krehbiel et al., 2003, Cull et al., 2015). DFM
have also been used to reduce stress-related rumen changes in beef calves
entering feedlots. Young cattle entering the feedlot undergo a variety of stressors
including recent weaning, transport, fasting, vaccination, castration and dehorning

45
(Krehbiel et al., 2003). However, some studies have shown that the microbial
concentrations did not decrease substantially or immediately on arrival at the feedlot.
They suggest that the use of DFM is not necessary or helpful, and that depression
in some animals’ protozoa counts is not as a result of the stressors but the animals
decreased DMI on entering the feedlot (Fluharty and McClure, 1997, Loerch and
Fluharty, 1999). Literature regarding the use of DFM in young cattle is contradictory
and results from trials very often are not repeated in another. It has been suggested
that the wide range in results from DFM trials may reflect the use of non-host specific
species or insufficient levels of dosing (Krehbiel et al., 2003, McAllister et al., 2011).
DFM have been reported to function by modifying the balance of the reticuloruminal
microbiota populations, by adhering to the intestinal mucosa and preventing
pathogen adherence or activation, influencing gut permeability and modulating
immune function (Salminen et al., 1996, Holzapfel et al., 1998). Adherence by
bacterial DFM to the reticuloruminal and intestinal wall is thought to be beneficial to
the host, as enterotoxin producing strains of E.coli need to adhere to the gut wall to
induce diarrhoea through enterotoxin production. Therefore, if the DFM are directly
competing for adherence sites, there is a benefit to the host in preventing toxin-
producing bacteria from attaching, producing and shedding (Krehbiel et al., 2003).
Modifying the balance of the reticuloruminal microbiota populations is one of the key
functions reported as a benefit of using DFM to prevent or control the effects of a
diet high in rapidly fermentable carbohydrates and ruminal acidosis. Strains of
lactate-producing bacteria such as Lactobacillus and Enterococcus may help
prevent SARA by preventing accumulation of lactate in the rumen by utilising it
(Nocek et al., 2002). Studies have shown that inoculation with a lactate utilising
bacteria (Megasphaera elsdenii) has been shown to prevent accumulation of lactate
and corresponding reticuloruminal pH decrease, when used alongside a diet with
high amounts of rapidly fermentable carbohydrates (Kung and Hession, 1995).
However, in other studies, M.elsdenii dosing did not affect ruminal pH or SCFA
proportions and did not affect milk fat (Weimer et al., 2015, Hagg et al., 2010).
Success of DFM in preventing ruminal acidosis and increasing yields in live weight
and milk parameters is variable and needs further investigation to prove their worth.
46
1.5.6.2 Yeast DFM
Yeast strains, often varying strains of Saccharomyces cerevisiae, live or hydrolysed
dead yeasts are one of the most commonly used commercially available fungal DFM.
The use of S.cerevisiae as a “growth promoter” for ruminants was first reported in
1925 (Eckles and Williams, 1925). As with bacterial DFM, benefits from yeasts
appear to be due to changes in ruminal microbiota activity from changes in
populations; leading to increased degradability of forage and utilisation of SCFA. A
review by Robinson (2002) summarised the findings in the literature between 1981
and 2002 on studies into the effect of commercial yeast product use in dairy cattle,
and found the majority of published studies showed the use of yeasts resulted in
consistent improvements in DMI and animal production. Reticuloruminal responses
attributed to the use of yeast are usually related to the stimulation of cellulolytic
bacteria (Newbold et al., 1996), which increases the potential for fibre digestion in
the rumen and the ability to prevent a decline in reticuloruminal pH by decreasing
lactic acid production and/or increasing the utilisation of lactic acid by ruminal
bacteria (Chaucheyras et al., 1996, Guedes et al., 2008). As with bacterial DFM,
there are often inconsistent results between similar studies utilising S.cerevisiae. It
is suggested that this variation in results could be due to confounding effects of
differing ration compositions, amount of yeasts included in the ration and the source
of the yeast culture product being used (Williams et al., 1991). This last source of
variation is perhaps due to the use of non-specific strains, as mentioned by Krehbiel
et al. (2003).
Aims
The goal of the work carried out in this thesis was to examine the range of responses
to a diet expected to induce ruminal acidosis. Sources of variation in the response
to these diets may include variation in the absorptive capacity of the ruminal
epithelium to SCFA, variation in the extent to which individual animals are able to
bind or neutralize specific toxins such as lipopolysaccharide (LPS) and variation in
the rumen epimural microbiome. The main objectives were to examine the range of
responses in commonly studied variables, in response to a challenge diet; to assess
the ability of different additives believed to aid in controlling the effects of ruminal
acidosis in cattle, increasing productivity and feed efficiency; to identify the extent
to which sheep can be used as a model organism for cattle in studies on rumen

47
function; and to try to define a phenotype that is a strong indicator of resistance to
ruminal acidosis for use in future genetic studies.
With variation in the literature concerning the naming of the disorder most commonly
referred to as sub-acute ruminal acidosis or SARA (grain poisoning, grain overload,
lactic acidosis, toxic ingestion, acute ruminal impaction, metabolic acidosis
(RAGFAR, 2007)), for the purposes of this thesis the disorder will be referred to as
SARA throughout.

48
General materials and methods
Materials and methods detailed in this chapter were used across various studies.
For those techniques used in one study only, the protocol is detailed in the materials
and methods of the relevant chapter. The centrifuge used in all protocols was an
Eppendorf 5810R with a 30-place fixed-angle rotor for 1.2 - 2 ml tubes (F45-30-11)
or a high-capacity swing-bucket rotor with four 250 ml buckets (A-4-62) for blood
tubes.
Post-mortem sampling
Cattle in these studies were slaughtered via standard humane stunning and
exsanguination techniques in accordance with U.K. legislation at different times, in
3 commercial abattoirs (Woodhead Brothers - Morrisons PLC, Turrif, Scotland;
Highland Meats - Dawn Meats, Saltcoats, Scotland; ScotBeef – Bridge of Allan,
Scotland). The same protocols were used at each location and for every sample, as
far as was possible. In the lairage, cattle from the farm involved in the study were
separated if possible from other cattle due to be slaughtered and put through the
abattoir as one group. The sampling team were split between the “clean” part of the
abattoir and the “dirty” part (gut room). In the clean part of the abattoir, animals
involved in the trial were followed from the kill point to evisceration and the rumens
marked clearly with a cable tie to allow identification in the gut room. Cattle
containing a ruminal pH bolus were marked using another cable tie.
Rumen sampling
Following evisceration, marked rumens of cattle involved in the studies moved into
the gut room and were separated from the hindgut by abattoir staff. Once the rumen
was separated from the hindgut and cut open, a sample of rumen contents was
taken and strained through muslin into 2 x 50ml Falcon tubes. The rumen contents
were immediately placed in a passive cool box with ice blocks (<4˚C). If the cow
were bolused, the pH bolus was located and removed.
Abattoir staff emptied the rumen and it was photographed to show the size and
shape of papillae and to look for any obvious damage on the surface, such as bald
patches or ulcers. A sample of rumen wall was taken. As abattoir staff carried this
49
out, the area taken each time could not be completely standardised, however an
attempt was made to take the sample from the same area of the ventral sac each
time. The rumen wall sample was washed quickly in water to remove any excess
ingesta and 2 samples were taken, placed in bijou in either RNAlater (Qiagen, Ref.
76104) or formalin (Sigma Aldrich, F1268). The empty rumens were marked again
with a cable tie and numbered metal washer to ensure correct identification after the
blanching process. They were blanched at 80 – 90 °C for 10 min as per abattoir
standard protocol. Photographs were taken post-blanching, to compare with the
initial photographs and to assess for any changes that may become apparent post-
blanching, such as changes in papillae colour or bald spots that may have been
hidden by ingesta prewashing.
Hindgut sampling
Initially, it was intended to collect hindgut samples for all animals and the data was
to be used primarily by consortium partners. However, due to lack of staff and time
at abattoir samplings, hindgut was only sampled and examined for those beef
animals detailed in the trial in chapter 3. Samples of caecum wall were taken and
caecum contents collected and strained through muslin into 50 ml Falcon tubes. The
caecum wall was washed in water to remove any excess digesta and then 2 samples
taken and placed in bijou, in either RNAlater (Qiagen, Ref. 76104) or formalin
(Sigma Aldrich, F1268), as with the rumen samples.
Processing
All post-mortem samples were transferred on ice blocks in a passive cool box (<4˚C)
back to the laboratory. In the laboratory, tissue samples stored in RNAlater (Qiagen,
Ref. 76104) were stored at -20°C for gene expression studies. Tissue samples in
formalin (Sigma Aldrich, F1268) were fixed for between 1-2 days, dependent on size,
then removed and stored in 1x PBS (phosphate buffered saline) until they could be
blocked in paraffin for histology. Rumen fluid samples were stored plain for SCFA
and histamine analysis and diluted 1:1 in 1 x PBS for LPS analysis. All rumen fluid
samples were frozen at -20°C until further use.
50
Histochemistry
Preparation of paraffin embedded tissues
Following fixation in formalin (Sigma Aldrich, F1268), tissue samples were cut into
smaller pieces (1-3 pieces roughly 2 cm long and 0.5 cm thick), removing any rough
edges and ensuring papillae and muscle were present in each sample. Excess fat
was removed , so it would not interfere with future staining. Tissue was processed
using the Shandon Excelsior™ tissue processor (Thermo Scientific, UK) on a pre-
set programme for 17 hours. The paraffin-embedded tissues were cut on a
microtome (Leica RM 2125RT) at 3μm and mounted onto glass slides (Superfrost™,
Thermo Scientific, UK). Slides were dried in an oven at 60˚C for between 1-2 hours,
until excess wax had evaporated and tissues were fixed to the slide. Haematoxylin
and Eosin staining (H&E) and Elastin Martius Scarlet Blue staining (EMSB) were
carried out manually by one operator. EMSB staining is an MSB (Martius Scarlett
Blue) protocol modified to include a Miller’s Elastin stain (Koh-Tan, 2015).
Haematoxylin and eosin stain
3µm baked sections were deparaffinised by immersion in Histo-Clear (National
Diagnostics, New Jersey, USA) and then rehydrated by passing through 100%, 95%,
and 70% ethanol (non-molecular grade) before rinsing in distilled water. Sections
were immersed in Gill’s 2 Haematoxylin (Thermo Scientific, USA, Ref. 6765007) for
1 minute, followed by dipping in 1% acid/alcohol (hydrochloric acid/ethanol, made
in-house) for 30 seconds to eliminate excess haematoxylin, then washing in running
tap water. After washing, sections were placed in 70% ethanol for 1 minute, followed
by 1 minute in Eosin Y solution (Sigma Aldrich, USA, Ref. HT110116) for
counterstaining. Sections were dehydrated with 70%, 95% and 100% ethanol before
being cleared with Histo-Clear (National Diagnostics, New Jersey, USA) and
coverslip mounted using Histomount (National Diagnostics, New Jersey, USA).
EMSB (Elastin Martius Scarlet Blue) stain
3µm baked sections were deparaffinised by immersion in Histo-Clear (National
Diagnostics, New Jersey, USA) and then rehydrated by passing through 100%, 95%,
and 70% ethanol (non-molecular grade) before rinsing in distilled water. Sections
were immersed in Miller’s Elastin stain (VWR, UK, Ref. 351154S) for 30 minutes,
51
followed by washing in running tap water. Sections were placed in Celestin blue
stain (Sigma Aldrich, USA, Ref. 206342-5G) for 5 minutes, followed by washing in
running tap water. Sections were placed in Mayer’s haematoxylin stain (Sigma
Aldrich, USA, Ref. SLBC2066) for 5 minutes, dipped briefly into tap water, dipped
briefly into 1% acid/alcohol (hydrochloric acid/ethanol, in-house) then washed in
running tap water. Sections were immersed in Martius Yellow stain (Sigma Aldrich,
USA, Ref. 377767-25G) for 2 minutes and then washed in running tap water.
Sections were immersed in Brilliant Scarlet (Crystal Ponceau 6R, Sigma Aldrich,
USA, Ref. C0644-5G) stain for 10 minutes, followed by washing in running tap water.
Sections were immersed in Phosphotungstic Acid (Sigma Aldrichm USA, Ref.
P4006) for 1 minute, followed by washing in running tap water. Sections were then
placed in Soluble Blue stain (Aniline Blue, Sigma Aldrich, Ref. CI42755) for 1 minute,
followed by washing in running tap water. Sections were dehydrated by placing in
70%, 95% and 100% ethanol before being cleared with Histo-Clear (National
Diagnostics, New Jersey, USA) and were coverslip mounted using Histomount
(National Diagnostics, New Jersey, USA).
Immunohistochemistry
Immunohistochemistry staining was carried out by Veterinary Diagnostic Services
(VDS), at the University Of Glasgow’s School Of Veterinary Medicine. Sections were
cut at 2.5μm and placed on charged slides. All slides were incubated for 1hr at 56°C
prior to staining. Five slides were stained per sample for all animals; major
histocompatibility complex class 2 (MHCll), myeloperoxidase, cluster of
differentiation 3 (CD3), a negative control for rabbit and a negative control for mouse.
For the negative control, the primary antibody was omitted. The MHCll was carried
out at a dilution of 1:20, Myeloperoxidase at a dilution of 1:1000 and the CD3 at a
dilution of 1:100. Staining was carried out using a Dakoautostainer (Dako, Agilent
Technologies LDA, UK Ltd). All antibodies used were manufactured by Dako
(Agilent Technologies LDA, UK Ltd).
All immunohistochemistry was carried out at room temperature using Tris buffer (pH
7.5) + Tween for all buffer rinses. Heat induced epitope retrieval was carried out
using an Access Retrieval Unit (Menarini, UK) and sodium citrate buffer (pH 6) for
1 min 40 sec at 125˚C on full pressure. Enzymatic antigen retrieval was carried out
using Proteinase K (Dako, Agilent Technologies LDA, UK Ltd). Sections were
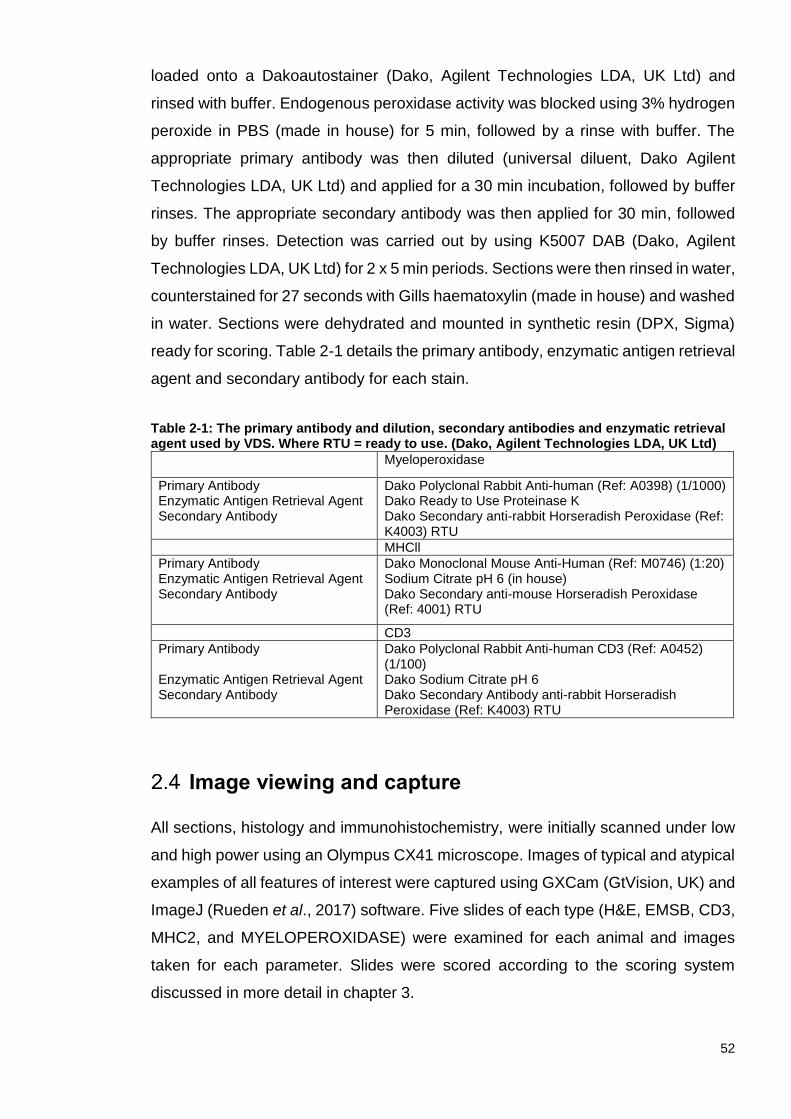
52
loaded onto a Dakoautostainer (Dako, Agilent Technologies LDA, UK Ltd) and
rinsed with buffer. Endogenous peroxidase activity was blocked using 3% hydrogen
peroxide in PBS (made in house) for 5 min, followed by a rinse with buffer. The
appropriate primary antibody was then diluted (universal diluent, Dako Agilent
Technologies LDA, UK Ltd) and applied for a 30 min incubation, followed by buffer
rinses. The appropriate secondary antibody was then applied for 30 min, followed
by buffer rinses. Detection was carried out by using K5007 DAB (Dako, Agilent
Technologies LDA, UK Ltd) for 2 x 5 min periods. Sections were then rinsed in water,
counterstained for 27 seconds with Gills haematoxylin (made in house) and washed
in water. Sections were dehydrated and mounted in synthetic resin (DPX, Sigma)
ready for scoring. Table 2-1 details the primary antibody, enzymatic antigen retrieval
agent and secondary antibody for each stain.
Table 2-1: The primary antibody and dilution, secondary antibodies and enzymatic retrieval agent used by VDS. Where RTU = ready to use. (Dako, Agilent Technologies LDA, UK Ltd)
Myeloperoxidase
Primary Antibody Enzymatic Antigen Retrieval Agent Secondary Antibody
Dako Polyclonal Rabbit Anti-human (Ref: A0398) (1/1000) Dako Ready to Use Proteinase K Dako Secondary anti-rabbit Horseradish Peroxidase (Ref: K4003) RTU
MHCll
Primary Antibody Enzymatic Antigen Retrieval Agent Secondary Antibody
Dako Monoclonal Mouse Anti-Human (Ref: M0746) (1:20) Sodium Citrate pH 6 (in house) Dako Secondary anti-mouse Horseradish Peroxidase (Ref: 4001) RTU
CD3
Primary Antibody Enzymatic Antigen Retrieval Agent Secondary Antibody
Dako Polyclonal Rabbit Anti-human CD3 (Ref: A0452) (1/100) Dako Sodium Citrate pH 6 Dako Secondary Antibody anti-rabbit Horseradish Peroxidase (Ref: K4003) RTU
Image viewing and capture
All sections, histology and immunohistochemistry, were initially scanned under low
and high power using an Olympus CX41 microscope. Images of typical and atypical
examples of all features of interest were captured using GXCam (GtVision, UK) and
ImageJ (Rueden et al., 2017) software. Five slides of each type (H&E, EMSB, CD3,
MHC2, and MYELOPEROXIDASE) were examined for each animal and images
taken for each parameter. Slides were scored according to the scoring system
discussed in more detail in chapter 3.

53
Blood testing
Collection and processing
Biochemistry and haematology testing was carried out by VDS (University of
Glasgow). Bloods were collected on farm into specific vacutainers (EDTA, Heparin)
(Becton Dickinson, BD Vacutainers, USA) from either the jugular or coccygeal vein
by a Home Office licence holder. Blood tubes were kept in a passive cool box with
ice blocks (<4˚C) or in the fridge, until they could be returned to the lab. Once in the
lab, heparin tubes were centrifuged at 664 x g for 20 min at 4°C and 4 ml of the
resulting plasma was removed and stored. The rest of the plasma was passed to
VDS for further processing. 2ml of whole EDTA blood was removed and centrifuged
at 664 x g for 20min at 4°C. The resulting plasma was removed and stored and the
buffy coat removed and stored in Qiazol Lysis Reagent (Qiagen, Ref. 79306) for
RNA extraction. The remainder of the EDTA blood was passed to VDS for further
processing.
Biochemistry
Biochemistry was carried out by VDS using the Dimension Xpand plus (Siemens)
and Dimension Flex reagent cartridges (Siemens) which set the parameters of the
machine automatically. For tests such as GLDH (Glutamate dehydrogenase) and
βHB (β-hydroxybutyrate), where cartridges are not manufactured by Siemens, the
machine allows for 10 open channel tests, which allows the use of Randox lab
cartridges and manual parameter setting. All cartridges follow protocols
recommended by the International Federation of Clinical Chemistry (IFCC).
Haematology
Haematology was carried out by VDS using the ADVIA 20.120 Haematology System
(Siemens). The machine has a “Vet Package” added to it, to allow for discrepancies
in cell sizes between different species. Although the vet package can usually
account for any differences, a manual 5-part differential was carried out for all
haematology samples by VDS staff.
54
2.5.3.1 Quality checks and sample integrity
Internal quality checks (QC) were carried out daily by VDS to ensure accuracy for
all reported results. Specific internal calibrators were used, including specific bovine
calibrators (Randox). Many of the kits used were manufactured and sold for human
use but QC checks ensure that they can accurately be used to test animal samples.
To ensure sample integrity, all samples were given an individual lab number, in
addition to the corresponding animal ID number. This meant that any sample from
an animal at any given time could be differentiated and retested easily.
Acute phase proteins
2.5.4.1 Haptoglobin and SAA
Heparin serum was assayed by another laboratory for haptoglobin (Hp) using the
assay method described by Eckersall et al. (2006), and the concentration of serum
albumin A (SAA) was determined (Eckersall et al., 2006) using a commercial ELISA
kit (Tridelta Development plc, Dublin, Ireland) according to the manufacturer’s
instructions.
Semi-Quantitative PCR
RNA was extracted from both rumen tissue and EDTA blood for use in gene
expression for different studies using the protocols detailed below.
RNA Extraction from rumen tissue
RNA extraction from rumen tissue was carried out using a miRNeasy® mini kit
(Qiagen) and DNase® kit (Qiagen) and a polytron homogenizer (VWR). A small
piece (approximately 1 cm2) of rumen tissue with muscle and papillae from the
frozen RNAlater (Qiagen, Ref. 76104) samples was added to Qiazol Lysis Reagent
(Qiagen, Ref. 79306). The tissue was homogenised immediately using a VWR VDI
12 S2 homogeniser (VWR, UK) in a fume hood and stored on ice. The homogenate
was split into 2 aliquots; 1 frozen at - 80°C and 1 used to continue the protocol for
RNA extraction, which was left at room temperature for 5 minutes. 140μl molecular
grade chloroform was added and the homogenate vortexed fully and transferred to
a pre-spun phase lock gel heavy tube (PLG-H) tube and incubated at room

55
temperature for 3 minutes. The homogenate was then centrifuged at 20,817 x g for
15 minutes and the resulting aqueous phase transferred to an RNase-free tube.
For precipitation, 1.5 volume of 100% ethanol (molecular grade) was added to the
aqueous phase, mixed and the resulting solution pipetted into a column in a 2 ml
collection tube (Qiagen, kit) which was centrifuged at 10,621 x g for 10 minutes and
flow through was discarded. The Qiagen miRNeasy® mini kit with DNase® kit was
then followed according to the kit protocol. The concentration of the RNA created
and the A260/280 and A260/230 ratios was tested using a NanoDrop Microvolume
Spectrophotometer and Fluorometer (Thermo Fisher, UK). If the RNA concentration
was high (>1000 µg/µL), RNase-free water was added to the eluent and it was
placed on the NanoDrop again. RNA was stored at -80˚C until further use.
RNA Extraction from EDTA blood
2.6.2.1 Processing
EDTA blood was brought to the lab and centrifuged at 664 x g for 20 minutes. The
resulting plasma was removed and frozen for future use and the white blood cells
and platelets (WBC/buffy coat) removed and stored in 1.2ml Qiazol Lysis Reagent
(Qiagen, Ref. 79306 ). The WBC/Qiazol mixture was vortexed fully and stored at -
80˚C for up to 1month before RNA extraction.
2.6.2.2 Extraction method
For RNA extraction from EDTA blood, a phenol-chloroform method was used (In-
house method, Koh-Tan, 2015). Once thawed, 300 μl molecular grade chloroform
was added to the Qiazol/WBC homogenate. The homogenate was vortexed
thoroughly until creamy in colour, immediately transferred to a pre-spun PLG heavy
tube and left at room temperature for 5 minutes to separate into layers. The top layer
from the PLG tube was transferred to an RNase-free tube. If the PLG homogenate
had not split, the tube was centrifuged at 4°C for 5 minutes at 15,294 x g, as stated
in the manufacturer’s instructions. The resulting top layer was then added to the
fresh 2 ml RNase-free tube along with the previously removed top layer. An equal
volume of chloroform was added and mixed by inversion before being centrifuged
at 15,294 x g at 4°C for 15 min. The resulting top layer was removed and transferred
into fresh RNase-free tube. An equal volume of isopropanol was added and mixed

56
by inversion then left at room temperature for 3 minutes, before being centrifuged
at 15,294 x g at 4°C for 15 min. The supernatant was poured off carefully without
disturbing the pellet and 1ml 70% ethanol added and vortexed briefly. The tubes
were centrifuged again at 15,294 x g at 4°C for 10 min, supernatant discarded and
the resulting pellets left to dry in the freeze dryer. Once dried, pellets were re-
suspended in RNase-free water and centrifuged briefly, before being analysed using
a NanoDrop to check concentrations and the A260/280 and A260/230 ratios. RNA
was stored at -80˚C until further use.
2.6.2.3 Reverse transcription
Reverse transcription (RT) was carried out using TaqMan Universal Master Mix kit
(ThermoFisher, UK) with the extracted RNA from tissue or blood. The kit protocol
was followed. The RT reaction mix was prepared following the manufacturer’s
instructions and made up to 20 µl by combining the non-enzymatic components and
the enzymatic components (MultiScribe Reverse Transcriptase, RNase Inhibitor
(kit)) and the extracted RNA. The volume of water added to the RT reaction mix was
calculated using the following equation:
H2O =7.7
1000𝑅𝑁𝐴 𝑐𝑜𝑛𝑐 𝑛𝑔/𝜇𝑙
Components were mixed by inversion. Contents were transferred to a MicroAmp
Optical 96 well Reaction Plate (ThermoFisher, UK) and sealed with an Optical
Adhesive Cover (ThermoFisher, UK). The plate was centrifuged briefly to remove
any air bubbles and ensure liquid collected at the bottom of the plate. The plate was
transferred to the thermal cycling block (SimpliAmp Thermal Cycler, Applied
Biosystems). RT was carried out following the kit protocol: 10 minutes at 25˚C for
inhibition, 30 minutes at 48˚C for RT followed by 5 minutes at 95˚C for RT
inactivation. Following thermal cycling, 30μl of RNase-free water was added to each
sample to create 50μl cDNA in total. All cDNA products were stored at -20°C until
further use.
2.6.2.4 TaqMan assay
TaqMan qPCR was used to identify peripheral blood leukocyte gene expression
levels from cDNA - created from RNA from EDTA blood samples and from rumen
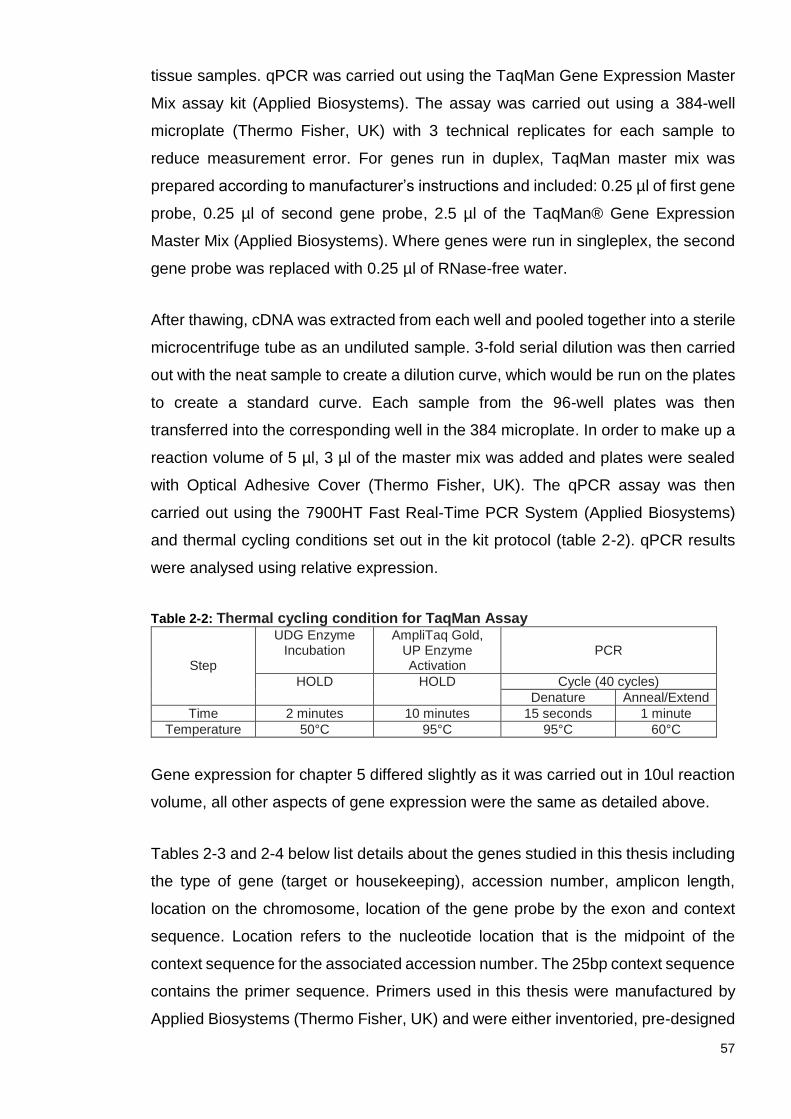
57
tissue samples. qPCR was carried out using the TaqMan Gene Expression Master
Mix assay kit (Applied Biosystems). The assay was carried out using a 384-well
microplate (Thermo Fisher, UK) with 3 technical replicates for each sample to
reduce measurement error. For genes run in duplex, TaqMan master mix was
prepared according to manufacturer’s instructions and included: 0.25 µl of first gene
probe, 0.25 µl of second gene probe, 2.5 µl of the TaqMan® Gene Expression
Master Mix (Applied Biosystems). Where genes were run in singleplex, the second
gene probe was replaced with 0.25 µl of RNase-free water.
After thawing, cDNA was extracted from each well and pooled together into a sterile
microcentrifuge tube as an undiluted sample. 3-fold serial dilution was then carried
out with the neat sample to create a dilution curve, which would be run on the plates
to create a standard curve. Each sample from the 96-well plates was then
transferred into the corresponding well in the 384 microplate. In order to make up a
reaction volume of 5 µl, 3 µl of the master mix was added and plates were sealed
with Optical Adhesive Cover (Thermo Fisher, UK). The qPCR assay was then
carried out using the 7900HT Fast Real-Time PCR System (Applied Biosystems)
and thermal cycling conditions set out in the kit protocol (table 2-2). qPCR results
were analysed using relative expression.
Table 2-2: Thermal cycling condition for TaqMan Assay
Step
UDG Enzyme Incubation
AmpliTaq Gold, UP Enzyme Activation
PCR
HOLD HOLD Cycle (40 cycles)
Denature Anneal/Extend
Time 2 minutes 10 minutes 15 seconds 1 minute
Temperature 50°C 95°C 95°C 60°C
Gene expression for chapter 5 differed slightly as it was carried out in 10ul reaction
volume, all other aspects of gene expression were the same as detailed above.
Tables 2-3 and 2-4 below list details about the genes studied in this thesis including
the type of gene (target or housekeeping), accession number, amplicon length,
location on the chromosome, location of the gene probe by the exon and context
sequence. Location refers to the nucleotide location that is the midpoint of the
context sequence for the associated accession number. The 25bp context sequence
contains the primer sequence. Primers used in this thesis were manufactured by
Applied Biosystems (Thermo Fisher, UK) and were either inventoried, pre-designed
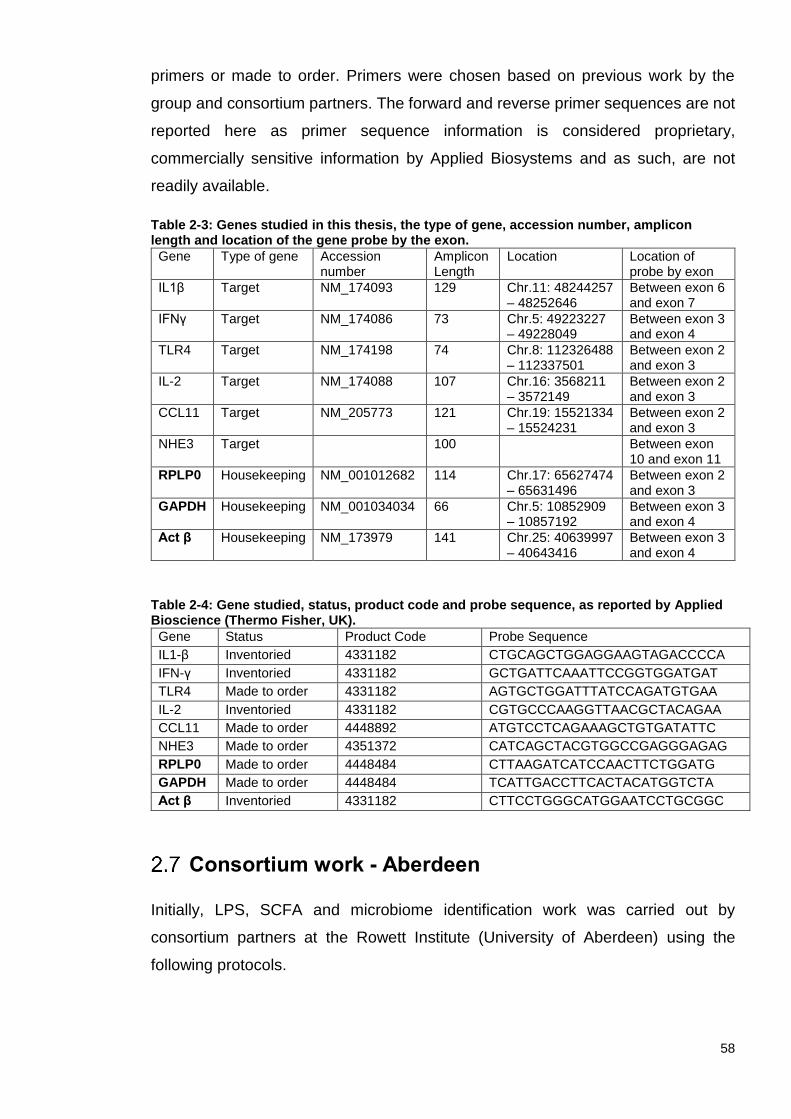
58
primers or made to order. Primers were chosen based on previous work by the
group and consortium partners. The forward and reverse primer sequences are not
reported here as primer sequence information is considered proprietary,
commercially sensitive information by Applied Biosystems and as such, are not
readily available.
Table 2-3: Genes studied in this thesis, the type of gene, accession number, amplicon length and location of the gene probe by the exon.
Gene Type of gene Accession number
Amplicon Length
Location Location of probe by exon
IL1β Target NM_174093 129 Chr.11: 48244257 – 48252646
Between exon 6 and exon 7
IFNγ Target NM_174086 73 Chr.5: 49223227 – 49228049
Between exon 3 and exon 4
TLR4 Target NM_174198 74 Chr.8: 112326488 – 112337501
Between exon 2 and exon 3
IL-2 Target NM_174088 107 Chr.16: 3568211 – 3572149
Between exon 2 and exon 3
CCL11 Target NM_205773 121 Chr.19: 15521334 – 15524231
Between exon 2 and exon 3
NHE3 Target 100 Between exon 10 and exon 11
RPLP0 Housekeeping NM_001012682 114 Chr.17: 65627474 – 65631496
Between exon 2 and exon 3
GAPDH Housekeeping NM_001034034 66 Chr.5: 10852909 – 10857192
Between exon 3 and exon 4
Act β Housekeeping NM_173979 141 Chr.25: 40639997 – 40643416
Between exon 3 and exon 4
Table 2-4: Gene studied, status, product code and probe sequence, as reported by Applied Bioscience (Thermo Fisher, UK).
Gene Status Product Code Probe Sequence
IL1-β Inventoried 4331182 CTGCAGCTGGAGGAAGTAGACCCCA
IFN-γ Inventoried 4331182 GCTGATTCAAATTCCGGTGGATGAT
TLR4 Made to order 4331182 AGTGCTGGATTTATCCAGATGTGAA
IL-2 Inventoried 4331182 CGTGCCCAAGGTTAACGCTACAGAA
CCL11 Made to order 4448892 ATGTCCTCAGAAAGCTGTGATATTC
NHE3 Made to order 4351372 CATCAGCTACGTGGCCGAGGGAGAG
RPLP0 Made to order 4448484 CTTAAGATCATCCAACTTCTGGATG
GAPDH Made to order 4448484 TCATTGACCTTCACTACATGGTCTA
Act β Inventoried 4331182 CTTCCTGGGCATGGAATCCTGCGGC
Consortium work - Aberdeen
Initially, LPS, SCFA and microbiome identification work was carried out by
consortium partners at the Rowett Institute (University of Aberdeen) using the
following protocols.
59
LPS analysis - Aberdeen
Rumen and caecum contents samples were kept on ice after post-mortem collection
before processing. The protocol was the same for both rumen and caecum contents.
Digesta was strained through muslin cloth into separate Falcon tubes. Strained
digesta was diluted 1:1 with 1 x PBS and mixed before being centrifuged at 20,817
x g for 45 minutes. The supernatant was taken up using a syringe, filtered through
a 0.2μm filter into a pyrogen-free glass tube (Lonza, Switzerland) before being
boiled for 30 minutes, cooled and stored at -20°C.
2.7.1.1 Limulus Lmebocyte Lysate (LAL) Kinetic-QCL™
The concentration of LPS was determined by consortium partners using the LAL
Kinetic-QCL kit (Lonza, Switzerland). An inhibition assay was carried out to test for
any substances in the ruminal/caecal fluid that may interfere with the LAL assay, by
testing pooled samples against samples spiked with endotoxin standard (kit). A
dilution curve was created using endotoxin standards to give a reference value to
calculate the endotoxin concentration of unknown samples. The curve was
optimised to be linear from 0.005EU/ml to 50 EU/ml. As LAL reacts with substances
such as β-D-glucans or peptidoglycans, unknown samples were diluted to reach a
non-inhibitory dilution. Dilutions for samples were calculated by following the
scheme suggested by Lonza (LAL Kinetic QCL Kit). The kit protocol was followed
and plates were run on a SpectraMax 190 Microplate Reader with SoftMax Pro 6
microplate data acquisition and analysis software installed. The microplate reader
was set following the parameters outlined in the kit protocol.
Results of the test LPS assay were calculated using the standard curve created from
standards run on the plate and using the straight-line equation to calculate
concentrations of the unknowns. To accept results, the correlation coefficient of the
calibration curve had to be ≥ 0.995 and the coefficient of variation of the standards
had to be less than 4%. The negative controls had to have significantly longer “onset
time” than that of the least concentrated standard on the curve.
SCFA analysis – Aberdeen
Initial SCFA analysis was carried out by the consortium partner using gas
chromatography.
60
2.7.2.1 Procedure
Internal standard of 0.1M 2-ethyl butyric acid was made up using distilled water. A
short chain fatty acid (SCFA) standard was made up by pipetting the following into
a volumetric flask: acetic acid (final conc. 30mM), propionic acid (20mM), isobutyric
acid (5mM), butyric acid (20mM), isovaleric acid (5mM) and valeric acid (5mM). To
the same volumetric flask, sodium formate (final concentration 10mM), lithium
lactate (10mM) and sodium succinate (10mM) were added. Both standards were
stored at 4°C. The same protocol was carried out for the standards, rumen and
caecum fluid samples.
1ml of rumen, caecum fluid or SCFA standard was added to a Sorvall tube and 50μl
2-ethyl butyric acid (0.1M) added. In a designated fume hood, 0.5 ml concentrated
hydrochloric acid and 2ml ether were added and the solution vortexed and
centrifuged at 956 x g for 10 minutes. The resulting ether layer was removed and
stored in a new Sorvall tube. 1 ml ether was added to the original Sorvall tube, which
was vortexed and centrifuged again at 956 x g for 10 minutes and the resulting ether
layer was once again removed and placed in the Sorvall tube containing the first
ether aliquot. 800 μl of the pooled ether was placed in a Wheaton vial and 100μl N-
tert-Butyldimethylsilyl-N-methyltrifluoroacetamide (MTBSTFA) added. The tube was
heated 80°C for 20 minutes and left to incubate at room temperature for 48 hours to
fully derivatise any lactate. The sample was then transferred to a screw top vial and
gas chromatography analysis was carried out by the analytical department of the
Rowett Institute.
Microbiome analysis – Aberdeen
Initial microbiome analysis by consortium partners at the Rowett Institute was
carried out using the following protocol.
2.7.3.1 Sample preparation
5ml of the rumen fluid sample stored in PBS/glycerol (detailed in section 2.1.3) was
centrifuged at 106 x g for 20 minutes to create a pellet and the majority of the
supernatant removed, leaving approximately 1ml, dependent on pellet size. The
pellet was re-suspended as fully as possible in the 1ml using a plastic Pasteur
pipette.

61
2.7.3.2 Cell lysis
0.25g of the sample was added to a screw cap tube containing 0.4g sterile zirconia
beads (a mix of 0.01mm beads and 0.5mm beads). 1ml lysis buffer was added
(500mM NaCl, 50mM Tris-HCl pH8, 50mM EDTA, 4% sodium dodecyl sulphate
(SDS)) and the sample was homogenised at high speed using a vortex for 3 minutes.
The sample was incubated at 70°C for 15 minutes, centrifuged at 17,947 x g for 5
minutes and the resulting supernatant transferred to a microcentrifuge tube. This
was repeated and the supernatant pooled.
2.7.3.3 Precipitation of nucleic acids
1260μl 10mM ammonium acetate was added to the tube, mixed well and incubated
on ice for 5 minutes. The solution was then centrifuged at 17,949 x g for 10 minutes
and the resulting supernatant transferred to 2 microcentrifuge tubes. One volume of
isopropanol was added to the tubes, mixed and incubated on ice for 30 minutes.
The samples were then centrifuged at 17,949 x g for 15 minutes and the
supernatant removed using aspiration. The nucleic acid pellet was washed with 70%
ethanol and dried under a vacuum. The pellet was then dissolved in 100μl Tris-
EDTA buffer and the two aliquots pooled.
2.7.3.4 Removal of RNA, protein and purification
2μl DNase-free RNase (10mg/ml) was added to the pooled aliquot and incubated at
37°C for 15 minutes. 15μl Proteinase K and 200μl Buffer AL (QIAamp DNA Stool
Mini Kit, Qiagen) was added, mixed and incubated at 70°C for 20 minutes. 200μl
ethanol was added and mixed well before the solution was transferred to a QIAamp
column (kit, Qiagen) and centrifuged at 17,949 x g for 1 minute. The QIAamp DNA
Stool Mini Kit was then followed according to manufacturer’s instructions. DNA was
eluted by centrifugation at 17,949 x g for 1 minute and the resulting DNA solution
was aliquoted and stored at -20°C for further use.
Histamine ELISA assay
Rumen fluid histamine ELISA
Analysis of the histamine concentration in rumen fluid was carried out using the
Abnova Histamine ELISA Kit (Abnova, Cat. No. KA1888) intended for the analysis

62
of histamine in stool and a LabTech LT-4500 microplate reader. Duplicate
measurements were used for all standards, controls and samples. Before utilisation,
optimisation was carried out to find the best dilution factor for the rumen fluid, testing
the rumen fluid at various dilutions to see which fell on the kit’s standard curve most
closely. Optimisation showed that 1:300 dilution worked best and this was then used
for all samples. The kit was used according to manufacturer’s instructions.
2.8.1.1 Assay
Duplicate measurements were used for all standards, controls and samples. 100 μL
of standards, 100 μL of controls and 100 μL of controls were pipetted into the
respective wells of the reaction plate. 25 μL Acylation reagent (kit, Abnova) was then
added to all wells, followed by 200 μL of acylation buffer into all wells. The reaction
plate was shaken shortly by hand and incubated at room temperature for 15 minutes.
25 μL of the acylated standards, controls and samples were pipetted into
corresponding wells of the microtiter strips provided in the kit. 100 μL of the
antiserum (kit) was added to all wells and strips were shaken shortly by hand and
incubated for 40 min at room temperature. The contents of the wells were then
discarded and each well washed 3 times thoroughly with 300 μL wash buffer and
blotted dry by tapping the inverted plate on absorbent material. 100 μL of the
enzyme conjugate was pipetted into all wells and incubated, without shaking, for 20
min at room temperature. The contents of the wells was then discarded and again
and each well washed 3 times thoroughly with 300 μL Wash buffer and blotted dry
by tapping the inverted plate on absorbent material. 100μL of the substrate was then
pipetted into all wells and incubated, without shaking, at room temperature for 17
minutes whilst avoiding exposure to sunlight. 100 μL of the Stop Solution (kit) was
added to each well and the microtiter plate shaken to ensure a homogeneous
distribution of the solution. The absorbance of the solution in the wells was then
read within 10 minutes, using a microplate reader set to 450 nm. Standard curves
were plotted and unknown concentrations were calculated from the regression.
Plasma histamine ELISA
The analysis of histamine concentration in plasma fluid was carried out using the
Abnova Histamine ELISA Kit (Abnova, Cat. No. KA2589) for the analysis of
63
histamine concentration in EDTA plasma and a LabTech LT-4500 microplate reader.
Duplicate measurements were used for all standards, controls and samples.
2.8.2.1 Assay
Frozen EDTA plasma aliquots processed as detailed in section 1.5.1 were thawed
at room temperature. Kit components; wash buffer, acylation reagent, were
reconstituted and brought to room temperature. Standards (kit), controls (kit) and
samples were pipetted into the respective wells of the reaction plate (kit). The same
protocol was followed as for the ruminal fluid histamine but samples were not diluted.
The plate was then read within 10 minutes of the ELISA, according to limits outlined
in the kit.
Both the histamine ELISA for rumen fluid and plasma were analysed by creating a
standard curve and the function and regression coefficient, calculated by fitting to
the straight-line equation, as detailed below:
𝑦 = 𝑚𝑥 + 𝑐
Using the equation, the values for each sample were calculated and the results
multiplied by the dilution factor (if required) to give the true result.
LPS EndoLISA endotoxin detection
LPS work was previously carried out by the University of Aberdeen’s Rowett Institute
using the protocol detailed in section 2.7.1. For LPS measurements taken for
chapters 3 and 5, measurements were carried out using the protocol below and the
EndoLISA Endotoxin Detection Assay kit (Hyglos), based on ELISA technology and
the LUX Multimode Microplate Reader (Varioskan). The method is a fluorescent
ELISA.
Processing
Samples of strained rumen fluid, collected as detailed in section 2.1, were returned
to the lab in a cool box and diluted 1:1 with 1 x PBS. The samples were centrifuged
at 20,817 x g for 45 minutes. Supernatant was taken up using a syringe, filtered
through a 0.2 μm filter into a pyrogen-free glass tube (Lonza, Switzerland) before
being boiled for 30 minutes, cooled and stored at -20°C.
64
Assay procedure
For the assay, samples were thawed at room temperature and diluted 1:100,000
with endotoxin-free water. Six serial dilutions were created using LPS endotoxin
(500 Endotoxin units/ml (EU)/ml) (kit). One EU corresponds to 0.1 ng LPS (FDA
RSE E. coli O113 EC-6). The reaction plate was filled with samples and standards
in duplicate, binding buffer was added (kit) and the plate incubated on a shaking
incubator (Grant-bio PMS-1000i and Hybrid Shake ‘n’ Stack, ThermoFisher).
Following incubation, the assay was carried out as per manufacturer’s instructions
and the plate read on the LUX according to the protocol. Serial dilutions and blanks
were used to plot a standard curve of log (endotoxin units or EU/ml) against log
(relative fluorescence units or RFU/ml), and the unknown concentrations were
calculated from the regression.
Quantification of results
Data were transferred to Excel and the results for 0 minutes and 90 minutes
averaged for each individual sample. The 0-minute values were subtracted from the
90-minute values and the results log transformed. The standard curve of log(EU/ml)
vs. log(RFU) was calculated and the function and regression coefficient calculated
by fitting to the straight line equation, as detailed below:
𝑦 = 𝑚𝑥 + 𝑐
Using the equation the EU/ml values for each sample were calculated and the
results multiplied by the dilution factor to give the true result. The readings from the
Varioskan LUX are reported in relative fluorescent units (RFU).
SCFA and ethanol analysis
SCFA analyses in reticuloruminal fluid for all studies were analysed using gas
chromatography (GC). Plain rumen fluid samples were shipped to Sciantec
Analytical (Sciantec Analytical Services, Dalton, UK) on dry ice and tested via GC
for the presence and concentration of 10 SCFA plus ethanol. Concentrations of
ethanol, propan-1-ol, acetic acid, propionic acid, isobutyric acid, propane-1,2-diol,
butyric acid, isovaleric acid, valeric acid, hexanoic acid, heptanoic acid and lactic
acid were determined. Any concentration < 25 mg/kg, fell below the detection level
of the GC and could not be quantified. Molar concentrations of the VFA were

65
obtained by dividing the measured mass of each VFA in mg/kg by its molecular
weight as follows: Acetate - 60.05; Butyrate - 88.11; Propionate - 74.08; Valerate -
102.13; Isobutyrate - 88.11; Isovalerate - 102.13 (g/mol).

66
On farm and post-mortem observations associated with sub-acute ruminal acidosis in beef and dairy cattle
Introduction
It has been known for many decades that the rumen epithelium is capable of change
in response to dietary input - from initial development of the rumen epithelium at
weaning, to changes in later life in adult ruminants (Sander et al., 1959, Tamate et
al., 1962, Lane and Jesse, 1997, Steele et al., 2009). In adult ruminants, a change
in the rumen epithelium in response to dietary input, specifically a diet high in rapidly
fermentable carbohydrates, has been shown in the literature (Shen et al., 2004,
Steele et al., 2011a, Eurell and Frappier, 2013). Observed changes in the rumen
epithelium in response to a diet high in rapidly fermentable carbohydrates include
elongation of papillae (Dirksen et al., 1984), proliferation of papillae (Shen et al.,
2004), branching of papillae (Beharka et al., 1998) and thickening of the outer,
cornified layers of the epithelium (Metzler-Zebeli et al., 2013).
Many studies in the literature have allowed for a greater understanding of the
structure and organisation of the cellular components of the rumen epithelium.
Methods used in these studies include scanning electron microscopy (SEM),
transmission electron microscopy (TEM) and bright field microscopy (Asari et al.,
1985, Graham and Simmons, 2004, Scala et al., 2011, Steele et al., 2011a, Steele
et al., 2012), as well as Western blot (Scala et al., 2011) and confocal laser scanning
microscopy (Stumpff et al., 2011). An in depth overview of the functional
organisation of the bovine ruminal epithelium was carried out by Graham and
Simmons (2004) using electron microscopy, SDS-PAGE and Western blotting. The
vast majority of these methods are highly useful in research settings, but are time
consuming and thus considered unsuitable for a high volume investigation or
screening of many samples at once. Therefore, based on the current literature and
methods, it is difficult to provide a repeatable and relevant classification of gross or
microscopic features of the bovine rumen epithelium as being common, incidental
or indicative of pathology. There is therefore a need for a novel scoring system for
the adult bovine rumen that considers this time constraint and would allow a fast,
repeatable and relevant classification of rumen epithelium as normal, incidental or
pathological.

67
When considering the development of a scoring system for adult bovine ruminal
pathology, the in-depth works of Steele et al. (2011a) are a useful basis. This
previous study investigated differences in the histological appearance of the bovine
rumen epithelium from animals maintained on both forage and grain based diets.
The study allowed a better understanding of the baseline, normal appearance of the
rumen epithelium that could be associated with each diet group. Steele et al.
(2011a), used a combination of bright field microscopy, SEM and TEM to investigate
the rumen epithelium of cattle exposed abruptly to high forage and high grain diets.
Results showed that the thickness of the stratum corneum (SC) did not vary
between diets but the thickness of the stratum granulosum (SG), stratum basale
(SB), stratum spinosum (SS) and the entire rumen epithelium was reduced in
animals on a high grain diet. The study also found that the presence of lesions was
not significant between diets but during the initial introduction of the high grain diet,
the highest incidence of ruminal lesions was observed. They noted that papillae from
cattle maintained on the forage diet showed more and deeper ridges and
indentations on the surface of the papillae – containing bacteria and protozoa - in
comparison to grain fed animals. The high grain diet was associated with increased
sloughing of the outer keratinised layers from the SC, particularly during the initial
grain introduction period. Additionally, they noted that in high forage animals, tight
junctions and desmosomes between cells were tighter, the SC was intact and fewer
transition cells were noted between the SC and SG. In contrast, in animals fed high
grain diets, there was a loss of tissue structure and an increase in spaces between
cells and layers. These findings were similar to a previous study by Steele et al.
(2009) investigating histological changes in the epithelium of a single cow.
Additionally, though not detailed in the text of the 2011 study, illustrations clearly
showed dilatation of vasculature in the papillae of the animals in which symptoms
of grain-induced acidosis were shown. This work by Steele et al. (2011a) focussed
only on the acute response to an abrupt change in diet and used SEM, which as
previously mentioned, is not suited to a high volume or screening approach of many
samples.
Although the 2011 work by Steele et al. is in depth and clearly describes changes
in the epithelial tissue structure in response to dietary inputs, there is no reference
to any rumen epithelial immune or inflammatory processes. Both local and systemic
inflammatory responses in response to a challenge diet high in rapidly fermentable

68
carbohydrates have been shown previously in cattle (Gozho et al., 2007, Emmanuel
et al., 2008, Bondzio et al., 2011). Despite this, few studies detail the immune
components of the bovine forestomaches. One of the few studies in the literature
uses gene expression, immunoblotting and flow cytometry of rumen tissue and
rumen contents (Trevisi et al., 2014). This previous study suggests that the immune
response of the bovine forestomach plays an important role in overall bovine health.
Therefore, from evidence in the literature of an immune involvement in the pathology
of the rumen response to a diet high in rapidly fermentable carbohydrates, it would
be expected that variation in the number or the location of immune cells in ruminal
tissue might relate to the overall health status of the animal. However, as far as it
was possible to determine, there are no published reports in the English literature
that describe the distribution of any immune cells in rumen tissue.
The majority of the work that has been carried out investigating the histological
appearance of ruminal tissue through bright field microscopy uses standard stains
like haematoxylin and eosin (H&E). H&E is good at detailing cellular structure but
does not define collagenous connective fibres well. Trichrome stains such as
Masson’s are better at highlighting collagenous/connective structures (O'Connor
and Valle, 1982). Martius Scarlet Blue (MSB) is a trichrome stain in which methyl
blue is used to stain collagen, crystal scarlet stains fibrin, and picric acid stains red
blood cells. Variants of the MSB stain are commonly used in clinical cardiology
research to identify areas of clotting and fibrosis (Tyrankiewicz et al., 2016) and
MSB has also been combined with Verhoeff’s iron haematoxylin stain to study
connective tissue and vascular pathology (Buk, 1984). Therefore, it would be
expected to be a useful stain to investigate pathology in the ruminal epithelium.
In addition to changes in the rumen histology associated with a diet high in rapidly
fermentable carbohydrates, fermentation disorders such as sub-acute ruminal
acidosis (SARA) also commonly arise from the challenges presented by this type of
diet (Kleen et al., 2003). SARA is widely reported globally, in both dairy and beef
cattle fed on high concentrate rations (Nagaraja and Titgemeyer, 2007, Kleen et al.,
2009, Kleen and Cannizzo, 2012, Kleen et al., 2013). SARA is associated with
numerous ill effects, such as decreased feed intake, laminitis, diarrhoea and
changes in milk parameters, leading to increased culling rates in dairy herds and
consequential financial losses (Plaizier et al., 2008). It has previously been shown
69
that susceptibility to SARA varies greatly among farms, and within herds, with some
individuals more likely to develop SARA than others (Morgante et al., 2007, Kleen
et al., 2009, Penner et al., 2009a). SARA has been shown to lower production
efficiency (Abdela, 2016) and welfare (Enemark, 2008) of cattle in a variety of
production systems and estimates of the financial impact of SARA are consistently
high globally through production losses, increased culling rate and death losses. It
has been estimated that the financial costs associated with SARA are between USD
$500 million to $1 billion annually (Enemark, 2008). The occurrence of SARA in
dairy herds varies globally and was suggested in a review by Kleen and Cannizzo
(2012) to be 14% in Friesland (Kleen et al., 2009), 19-40% in the USA (Garrett et
al., 1999); and over 33% in Italian herds (Morgante et al., 2007).
Despite the majority of studies in the literature focussing on the effects of SARA in
dairy cattle, the condition has been shown to occur in beef cattle (Nagaraja and
Titgemeyer, 2007). Finishing diets in beef cattle are often high in rapidly fermentable
carbohydrates such as grain, to ensure rapid liveweight gain in preparation for
slaughter. As acidosis-related illnesses are painful and negatively affect the overall
health of the animal (Garrett, 1996), there is a need to increase the work done in
this area, investigating the condition in finishing beef cattle. In addition to a primarily
dairy focus, the majority of current studies investigating SARA look at the effects of
experimentally induced SARA. Therefore, there is a need to determine how these
observations of experimentally induced ruminal pathology relate to on-farm,
commercial conditions.
70
Aims
There were 3 main aims for this work:
1. To develop a histological scoring system for ruminal mucosa of beef and dairy
animals
2. To test the performance of the newly created scoring system on a large subset
of animals and describe the histological and immunohistochemical findings from
the rumen of animals with diverse management styles and nutritional
backgrounds
3. To quantify dietary inputs from beef farms and classify predicted risk for
developing SARA and attempt to relate histological score results and differences
in the severity or nature of these responses, to specific dietary or management
practices
71
Materials and methods
Study design
This study was split into 3 main sections: initial observations and preliminary sample
analysis with the novel scoring system; full sample set analysis using the scoring
system and analysis of 6 beef farms using the scoring system and other commonly
studied response variables.
In the year prior to the study, dietary and farm management information was
obtained via questionnaire from 10 beef farms in Aberdeenshire, Scotland. From
these, 6 farms were selected based on dietary composition and perceived
susceptibility to SARA. Farms were classified as “high” or “low” risk of SARA based
on the questionnaire, the proportion of barley, straw and silage in the diet and on-
farm observations of diet appearance and animal behaviour (feed guarding, access
to feed rail). From the 6 selected farms, a total of 119 steers and heifers with an
average age of 700 days and carcase weight of 371 kg were sampled at slaughter.
Breeds included Aberdeen Angus, Blonde d’Aquitaine, Charolais, Limousin, Salers,
Simmental, British Blue and Shorthorn crosses. All animals were reared indoors in
the Grampian region, close to Aberdeen, between January and July 2013.
In addition to the 119 animals from these 6 beef farms, additional post-mortem
samples were collected from animals from a wide range of management and feeding
systems - including dairy, grass fed, barley beef and research cereal fed animals -
to give a full sample set size of 213. Dairy animals were Holstein-Friesian, other
groups were a mix of aforementioned breeds.
The first stage of the study involved histological and immunohistochemical
examination of rumen samples from a small sample set of 25 animals from the total
213. The primary examination of the histological appearance of these rumens was
used to further develop a scoring system for ruminal histology. Samples were split
into one of 5 categories. Each of the 5 categories reflected different feeding systems,
with broadly distinct concentrate to forage ratios, as detailed below.
72
A. Commercial grass-fed beef cattle (CGFB)
B. Commercial silage-fed culled dairy cattle (CSFD)
C. Commercial mixed diet (silage and concentrate) fed beef cattle (CMFB)
D. Commercial cereal-fed beef (barley beef) cattle (CCFB)
E. Research cereal-fed beef (high challenge) cattle (RCFB)
The exact proportion of rapidly fermentable carbohydrates (barley) in each of the
diets was not measured in every case, but based on information provided by farmers
and abattoirs was believed to lie within the following ranges: CGFB: 0%; CSFD: 0-
30%, CMFB: 40-90%, CCFB: 80-90%, RCFB: 90%. Additionally, animals were
grouped into “CONCENTRATE” (groups C-E) and “FORAGE” (groups A-B).
The next stage involved the histological and immunohistochemical examination of
the rumens from the 6 beef farms, together with their dietary input information and
results from other commonly tested parameters, such as ruminal SCFA proportions,
ruminal histamine concentration, ruminal LPS concentration and others. These
results were investigated to see whether there was a correlation between proposed
“risk” factor, farm of origin, proportion of barley in the diet, proportion of fine particles
in the diet and both the histological score and results from other tests.
The final stage of the study involved histological and immunohistochemical
examination of the rumens from the 6 beef farms, together with the full set of
samples collected from animals from a wider range of management backgrounds.
This full sample set was again classified into the 5 categories, based on the
individual feeding systems with broadly distinct concentrate to forage ratios. The
newly created scoring system was applied to the full sample set (n=213) to
determine whether the scoring system could effectively differentiate between
animals based on their concentrate to forage ratios.
Feed analysis
In addition to the questionnaires from the 6 beef farms, total mixed rations (TMR)
were assessed for composition, visual physical characteristics, near infrared (NIR)
and particle size (Penn State sieve test, as carried out by consortium partners). All
73
cattle on the 6 beef farms had ad libitum access to feed, and were estimated to
consume 11-13.5 kg dry matter (DM) feed/day. Cattle on 1 farm (BH6) also had ad
libitum access to barley straw. The main ingredient of all diets on all 6 farms was
barley, grown and processed on each individual farm. Diets varied greatly between
farms; sugar beet pulp, soya hulls and a ruminal buffer intended to prevent acidosis
were fed on 1 farm each and yeast was fed on all farms (as a direct fed microbial
(DFM)). Rumitech feed additive (Harbro, Scotland) was used on 2 high-risk farms
only. Full dietary input information was not provided by 2 farms: BL7 and BH1. It
was not possible to verify statements provided by the farmer regarding the ration
fed to the cattle on BL7 but it was possible to measure the particle size of the TMR
and obtain a measurement of crude protein and fibre. Any unverified data were not
used in any statistical analyses but were used to support the a priori risk
classification of the farm (low).
Penn State sieve test
Penn State sieve testing of the TMR was carried out by consortium partners using
the methods set out by the Pensyllvania State University Penn State Particle
Separator methods (Penn State, 2018). The separator boxes were stacked on top
of each other, with the sieve with the largest holes on top, followed by medium-sized
holes, smallest holes and the solid pan on the bottom. Approximately 3 pints of
forage or TMR was placed on the upper sieve as fed – no physical or chemical
alteration. On a flat surface, sieves were shaken in one direction approximately 5
times, then rotated one-quarter turn. This process was repeated approximately 7
times, as is recommended in the standard protocol. After shaking, the material on
each sieve and on the bottom pan was weighed and the percentage under each
sieve calculated.
Post mortem sampling
All cattle were slaughtered via humane stunning and exsanguination in accordance
with U.K legislation at 3 commercial abattoirs (Woodhead Brothers/Morrisons PLC,
Turrif, Aberdeenshire; Highland Meats/Dawn Meats, Saltcoats, Ayrshire and
Scotbeef, Bridge of Allan, Stirlingshire). Samples were collected at varying times
throughout the year dependent on availability of animals on specific diets. The same
protocol was used for collecting samples, processing at each location and for every

74
sample in the lab, as far as was practicably possible. Post-mortem sampling was
carried out as detailed in section 2.1. Samples were collected of the rumen wall at
slaughter for all animals (section 2.1.1) and hindgut was collected from animals from
the 6 beef farms (section 2.1.2). Photographs were taken of the ruminal surface pre
and post-blanching as described in section 2.1. Rumen tissue samples were
processed in the laboratory as detailed in section 2.1.3.
Histology and immunohistochemistry
Samples collected at post mortem were processed for histology (H&E and EMSB)
and immunohistochemistry as detailed in sections 2.2 and 2.3.
Grid-Sampling
Following initial pre and post-blanching photographs taken of the rumen at slaughter,
black patches were noted on the rumen post-blanching in some animals. To
investigate processes responsible for this black appearance, a grid sampling
approach was devised. Tissue samples were obtained from a notional grid with 100
mm centres over the entire ruminal wall, pre-blanching, from 3 convenience-
sampled animals. Post-blanching, blackened areas were noted and from the original
set of samples, samples corresponding with white and black areas were examined
histologically. Samples were also taken from the post-blanching tissue immediately
adjacent to the sites from which the original (pre-blanching) sample was obtained.
Image capture
Slides were scanned under low and high power using an Olympus CX41 microscope.
Images of typical and atypical examples of features of interest were captured using
GXCam and ImageJ software. Five slides of each type (H&E, EMSB, CD3, MHC2,
and myeloperoxidase) were examined from each animal and images captured of
each slide.
Scoring system
The previously described study by Steele et al. (2011) and an example of a
gastrointestinal inflammation scoring system by Day et al. (2008) was used
alongside input from pathologists to create a histological scoring system for adult
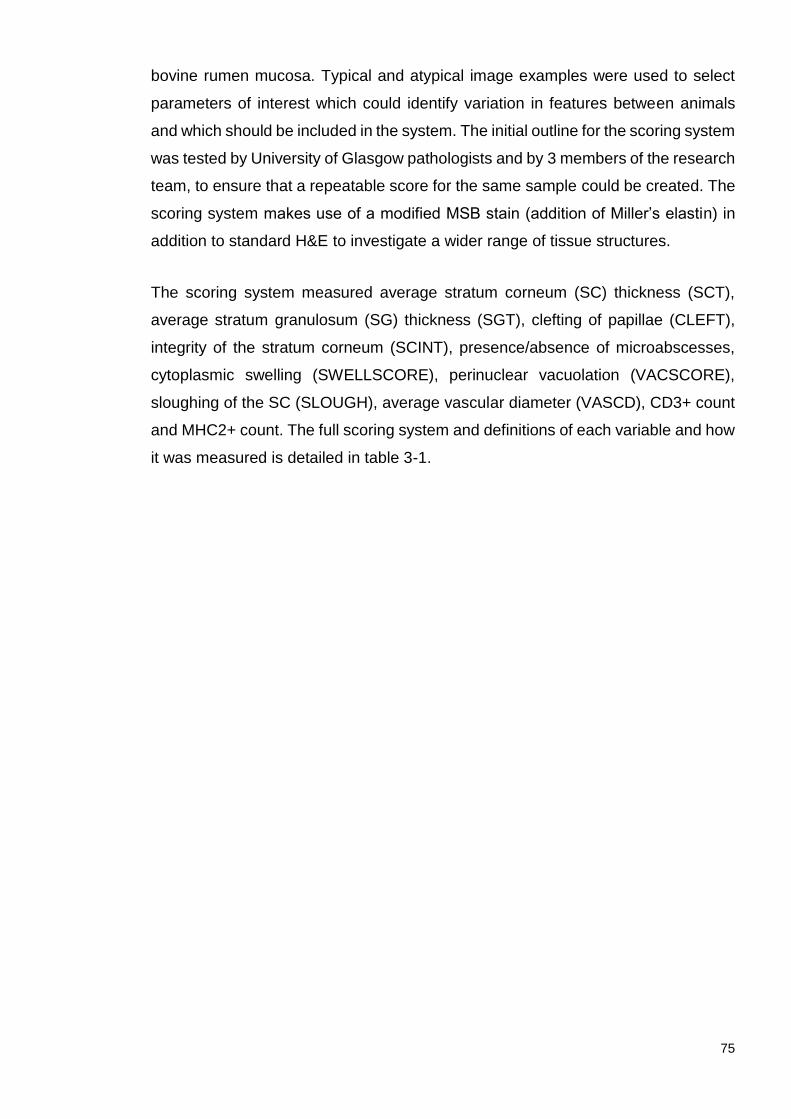
75
bovine rumen mucosa. Typical and atypical image examples were used to select
parameters of interest which could identify variation in features between animals
and which should be included in the system. The initial outline for the scoring system
was tested by University of Glasgow pathologists and by 3 members of the research
team, to ensure that a repeatable score for the same sample could be created. The
scoring system makes use of a modified MSB stain (addition of Miller’s elastin) in
addition to standard H&E to investigate a wider range of tissue structures.
The scoring system measured average stratum corneum (SC) thickness (SCT),
average stratum granulosum (SG) thickness (SGT), clefting of papillae (CLEFT),
integrity of the stratum corneum (SCINT), presence/absence of microabscesses,
cytoplasmic swelling (SWELLSCORE), perinuclear vacuolation (VACSCORE),
sloughing of the SC (SLOUGH), average vascular diameter (VASCD), CD3+ count
and MHC2+ count. The full scoring system and definitions of each variable and how
it was measured is detailed in table 3-1.
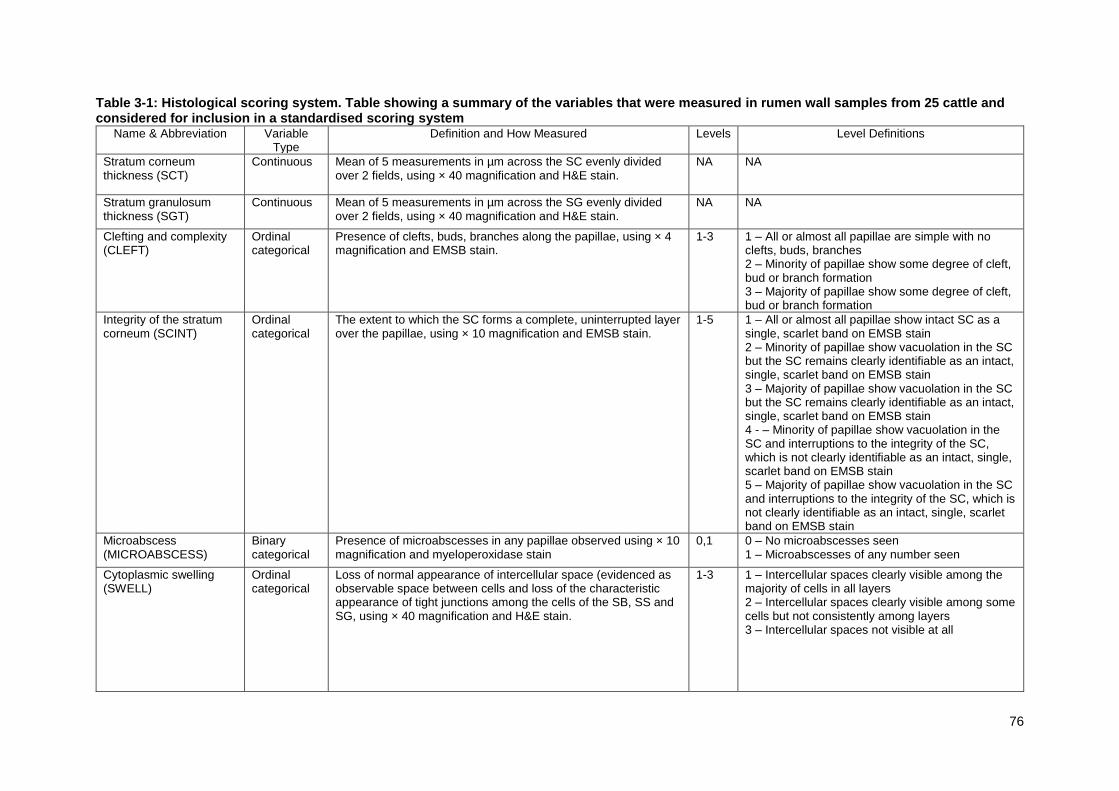
76
Table 3-1: Histological scoring system. Table showing a summary of the variables that were measured in rumen wall samples from 25 cattle and considered for inclusion in a standardised scoring system
Name & Abbreviation Variable Type
Definition and How Measured Levels Level Definitions
Stratum corneum thickness (SCT)
Continuous Mean of 5 measurements in µm across the SC evenly divided over 2 fields, using × 40 magnification and H&E stain.
NA NA
Stratum granulosum thickness (SGT)
Continuous Mean of 5 measurements in µm across the SG evenly divided over 2 fields, using × 40 magnification and H&E stain.
NA NA
Clefting and complexity (CLEFT)
Ordinal categorical
Presence of clefts, buds, branches along the papillae, using × 4 magnification and EMSB stain.
1-3 1 – All or almost all papillae are simple with no clefts, buds, branches 2 – Minority of papillae show some degree of cleft, bud or branch formation 3 – Majority of papillae show some degree of cleft, bud or branch formation
Integrity of the stratum corneum (SCINT)
Ordinal categorical
The extent to which the SC forms a complete, uninterrupted layer over the papillae, using × 10 magnification and EMSB stain.
1-5 1 – All or almost all papillae show intact SC as a single, scarlet band on EMSB stain 2 – Minority of papillae show vacuolation in the SC but the SC remains clearly identifiable as an intact, single, scarlet band on EMSB stain 3 – Majority of papillae show vacuolation in the SC but the SC remains clearly identifiable as an intact, single, scarlet band on EMSB stain 4 - – Minority of papillae show vacuolation in the SC and interruptions to the integrity of the SC, which is not clearly identifiable as an intact, single, scarlet band on EMSB stain 5 – Majority of papillae show vacuolation in the SC and interruptions to the integrity of the SC, which is not clearly identifiable as an intact, single, scarlet band on EMSB stain
Microabscess (MICROABSCESS)
Binary categorical
Presence of microabscesses in any papillae observed using × 10 magnification and myeloperoxidase stain
0,1 0 – No microabscesses seen 1 – Microabscesses of any number seen
Cytoplasmic swelling (SWELL)
Ordinal categorical
Loss of normal appearance of intercellular space (evidenced as observable space between cells and loss of the characteristic appearance of tight junctions among the cells of the SB, SS and SG, using × 40 magnification and H&E stain.
1-3 1 – Intercellular spaces clearly visible among the majority of cells in all layers 2 – Intercellular spaces clearly visible among some cells but not consistently among layers 3 – Intercellular spaces not visible at all

77
Cytoplasmic swelling score (SWELLSCORE)
Ordinal categorical
Loss of normal appearance of intercellular space (evidenced as observable space between cells and loss of the characteristic appearance of tight junctions among the cells of the SB, SS and SG, using × 40 magnification and H&E stain.
2-6 Sum of SWELL results from two slides
Perinuclear vacuolation (VAC)
Binary Presence of perinuclear vacuoles in the stratum basale and stratum sinosum using × 40 magnification and H&E stain.
1,0 0 – No vacuolated cells seen 1 – Vacuolated cells noted
Perinuclear vacuolation score (VACSCORE)
Ordinal categorical
Presence of perinuclear vacuoles in the stratum basale and stratum sinosum using × 40 magnification and H&E stain.
0-4 Sum of binary results from two slides, each treated as per VAC
Sloughing (SLOUGH) Ordinal categorical
Retention or partial retention of sheaths of SC on papillae, observed using × 10 magnification and EMSB stain
1-3 1 – No papillae show evidence of retained sheaths of cornified cells 2 – Few or occasional papillae show evidence of retained sheaths of cornified cells 3 – Many papillae show evidence of retained sheaths of cornified cells
Vessel size (VASCDIAM)
Continuous The diameter of the single largest vessel in each of two papillae using × 40 magnification and H&E stain.
NA NA
CD3 cell density (CD3) Count Count of the total number of CD3+ cells in a single image taken at × 40 magnification.
NA NA
MHC II cell density (MHCII)
Count Count of the total number of MHC II+ cells in a single image taken at × 40 magnification.
NA NA
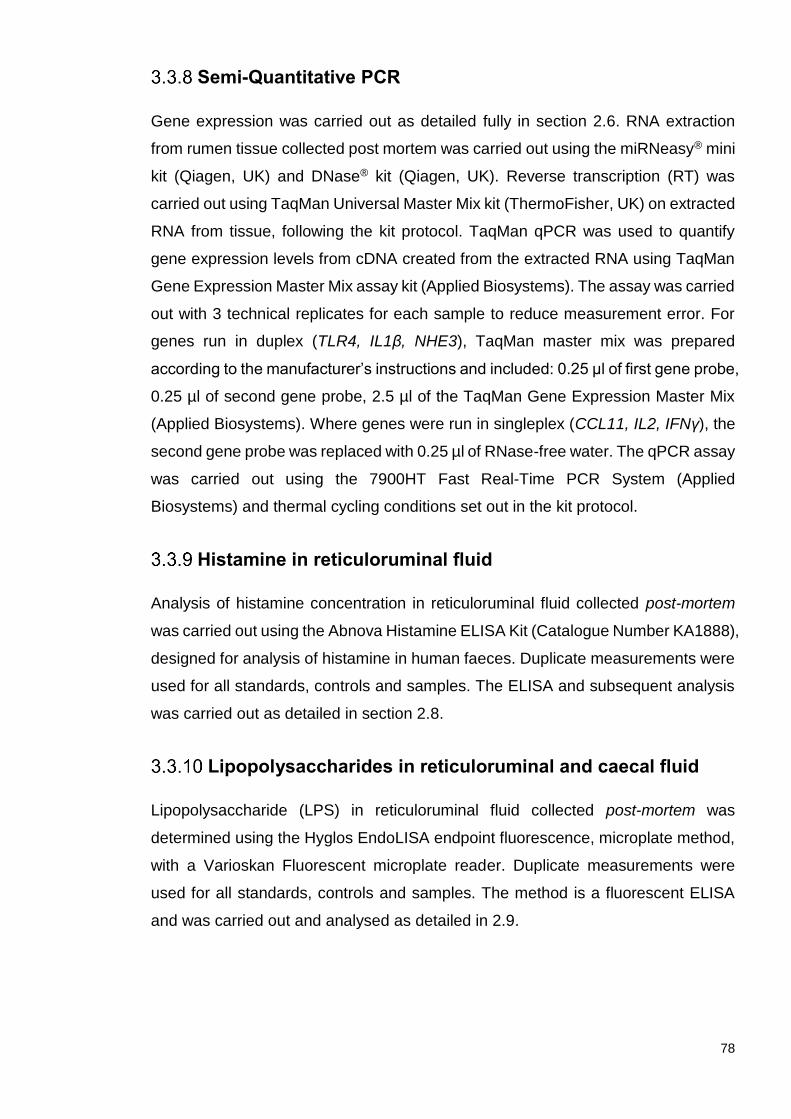
78
Semi-Quantitative PCR
Gene expression was carried out as detailed fully in section 2.6. RNA extraction
from rumen tissue collected post mortem was carried out using the miRNeasy® mini
kit (Qiagen, UK) and DNase® kit (Qiagen, UK). Reverse transcription (RT) was
carried out using TaqMan Universal Master Mix kit (ThermoFisher, UK) on extracted
RNA from tissue, following the kit protocol. TaqMan qPCR was used to quantify
gene expression levels from cDNA created from the extracted RNA using TaqMan
Gene Expression Master Mix assay kit (Applied Biosystems). The assay was carried
out with 3 technical replicates for each sample to reduce measurement error. For
genes run in duplex (TLR4, IL1β, NHE3), TaqMan master mix was prepared
according to the manufacturer’s instructions and included: 0.25 µl of first gene probe,
0.25 µl of second gene probe, 2.5 µl of the TaqMan Gene Expression Master Mix
(Applied Biosystems). Where genes were run in singleplex (CCL11, IL2, IFNγ), the
second gene probe was replaced with 0.25 µl of RNase-free water. The qPCR assay
was carried out using the 7900HT Fast Real-Time PCR System (Applied
Biosystems) and thermal cycling conditions set out in the kit protocol.
Histamine in reticuloruminal fluid
Analysis of histamine concentration in reticuloruminal fluid collected post-mortem
was carried out using the Abnova Histamine ELISA Kit (Catalogue Number KA1888),
designed for analysis of histamine in human faeces. Duplicate measurements were
used for all standards, controls and samples. The ELISA and subsequent analysis
was carried out as detailed in section 2.8.
Lipopolysaccharides in reticuloruminal and caecal fluid
Lipopolysaccharide (LPS) in reticuloruminal fluid collected post-mortem was
determined using the Hyglos EndoLISA endpoint fluorescence, microplate method,
with a Varioskan Fluorescent microplate reader. Duplicate measurements were
used for all standards, controls and samples. The method is a fluorescent ELISA
and was carried out and analysed as detailed in 2.9.
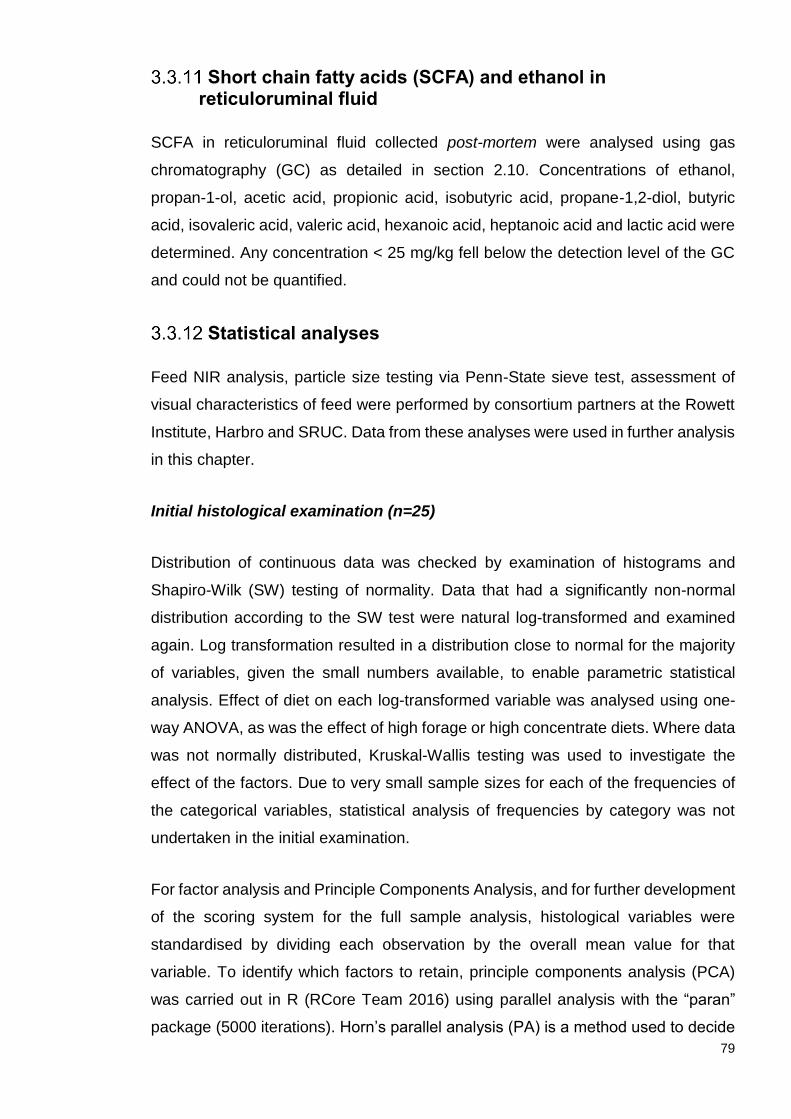
79
Short chain fatty acids (SCFA) and ethanol in reticuloruminal fluid
SCFA in reticuloruminal fluid collected post-mortem were analysed using gas
chromatography (GC) as detailed in section 2.10. Concentrations of ethanol,
propan-1-ol, acetic acid, propionic acid, isobutyric acid, propane-1,2-diol, butyric
acid, isovaleric acid, valeric acid, hexanoic acid, heptanoic acid and lactic acid were
determined. Any concentration < 25 mg/kg fell below the detection level of the GC
and could not be quantified.
Statistical analyses
Feed NIR analysis, particle size testing via Penn-State sieve test, assessment of
visual characteristics of feed were performed by consortium partners at the Rowett
Institute, Harbro and SRUC. Data from these analyses were used in further analysis
in this chapter.
Initial histological examination (n=25)
Distribution of continuous data was checked by examination of histograms and
Shapiro-Wilk (SW) testing of normality. Data that had a significantly non-normal
distribution according to the SW test were natural log-transformed and examined
again. Log transformation resulted in a distribution close to normal for the majority
of variables, given the small numbers available, to enable parametric statistical
analysis. Effect of diet on each log-transformed variable was analysed using one-
way ANOVA, as was the effect of high forage or high concentrate diets. Where data
was not normally distributed, Kruskal-Wallis testing was used to investigate the
effect of the factors. Due to very small sample sizes for each of the frequencies of
the categorical variables, statistical analysis of frequencies by category was not
undertaken in the initial examination.
For factor analysis and Principle Components Analysis, and for further development
of the scoring system for the full sample analysis, histological variables were
standardised by dividing each observation by the overall mean value for that
variable. To identify which factors to retain, principle components analysis (PCA)
was carried out in R (RCore Team 2016) using parallel analysis with the “paran”
package (5000 iterations). Horn’s parallel analysis (PA) is a method used to decide

80
how many components in a principal component analysis (PCA) drive the variance
observed in a data set of “n” observations on “p” variables (Dinno, 2014). Three sets
of standardised variables were selected for inclusion in preliminary scoring systems.
Scores were checked for normality and the effects of treatment and
forage/concentrate on each of the scores were evaluated by one-way ANOVA. Four
scoring systems were selected to apply to the full dataset.
Full sample set analysis (n = 194)
Few variables were normally distributed according to Shapiro-Wilk testing. Data was
initially analysed before transformation using Kruskal-Wallis to investigate the
effects of factors of interest on continuous variables. Variables were then natural log
transformed, and re-tested for normality using Shapiro-Wilk test and histograms. In
some cases, Shapiro-Wilk testing suggested data were not normally distributed, but
visual examination of histograms suggested a near normal distribution that would
allow parametric analysis. For all results, parametric and non-parametric analyses
were applied and results were consistent. For each of the continuous variables,
univariate analysis was carried out with Kruskal-Wallis test. Generalised linear
models (GLM) tested and the p-values of the effects reported. For the full sample
set, categorical count data was analysed using GLM assuming Poisson family
distribution. Data was checked for overdispersion and fit to the Poisson family using
package “AER” in R, no data were overdispersed
(c≥ 1).

81
Results
Grid Sampling
As shown in figure 3-1, histological examination of rumen samples taken pre-
blanching from areas of the rumen that were identified post-blanching as either
normal (white) or black showed no immediate differences.
Figure 3-1: H&E (x20) staining of sections from black and white areas of the rumen. “Pre” refers to samples obtained pre-blanching and “post” to samples obtained post-blanching. The post-blanching sample from the white area of the rumen showed the loss of the 3 outermost layers of the rumen wall and papillae. The remaining cell layers and structures were condensed together and lacked cellular definition. The post-blanching sample from the black areas showed similar changes in loss of cellular and structural integrity and the dissociation of the 3 outmost layers. However, in the black areas, the detached layers were retained (arrow).
Samples of the white areas processed for histology after the blanching process
showed a clear loss of the 3 outermost layers of the rumen wall and papillae (SC,
A – Pre-white
B – Post-white
C – Pre-black D – Post-black

82
SG and SS). The remaining cell layers and structures were condensed and lacked
cellular definition. Post-blanching samples from the black areas showed retention of
the 3 detached outer layers. The heat of the blanching process also appeared to
make any pigmentation present in the SC/SG of the papillae more condensed and
obvious.
Initial observations of tissue structure
Initial light microscopy observation of the ruminal epithelium was consistent with
previous descriptions (Dobson et al., 1956; Graham and Simmons, 2004; Eurell and
Frappier, 2013). The stratified squamous epithelium of the ruminal papillae showed
4 distinct layers: the stratum corneum (SC), followed by the stratum granulosum
(SG), the stratum spinosum (SS), with the stratum basale (SB) at the deepest level.
Underlying this was connective tissue, rich in capillaries and other vasculature.
Figure 3-2 shows low magnification images of a single papillae stained with H&E.
Figure 3-3 shows low magnification images of a single papillae stained with H&E
(Fig 3-3A) and with EMSB (Fig 3-3B). Figures 3-4, 3-5 and 3-6 show representative
examples of high and low values, for each of the features considered for inclusion
as variables in the scoring system, as described in table 3-1. With the exception of
highlighting or confirming the presence of microabscesses (which were otherwise
easily detected using H&E stain), myeloperoxidase staining was not informative and
extememely few positive cells were noted outside microabscesses. Microabscesses
(focal aggregations of neutrophils in the SC) were noted in many samples from
animals on all diets. Old or shedding microabscesses were noted but not counted.
Figure 3-7 shows representative examples of high and low numbers of MHCII+ and
CD3+ staining of ruminal papillae.

83
Figure 3-2: H&E (x40) stained papillae section showing the 4 characteristic cell layers (stratum corneum, stratum granulosum, stratum spinosum and stratum basale) and vasculature consistent with previous descriptions in the literature. Image taken from sample from this study.
Figure 3-3: Comparative examples of single papillae stained with H&E (2A) and EMSB (2B) stains, showing clearly the characteristic cell layers (stratum corneum, stratum granulosum, stratum spinosum and stratum basale). Image taken from a sample from this study (x10 magnification).
vasculature/ connective tissue
SC
SG
SS
SB
10 μm

84
Figure 3-4: H&E (x40) stained sections of ruminal papillae illustrating representative low and high examples of stratum corneum thickness (A – low SC score, B – high SC score) and low and high examples of stratum granulosum thickness (C – low SG score, D – high SG score) as scored using the scoring system in section 3.3.7. Black arrows show examples of the measurements taken using ImageJ. Five representative measurements were taken randomly and averaged, to create a value for average SC and average SG.
A B
C D

85
Figure 3-5: H&E (x40) stained sections of ruminal papillae illustrating representative examples of low and high examples of cytoplasmic swell score (A – low swellscore (clear cellular spaces), B – high swellscore (loss of cellular definition)) and perinuclear vacuolation (C- low vacscore, D – high vacscore). Arrows point to A – cellular spaces and D – examples of perinuclear vacuoles.
A B
C D

86
Figure 3-6: EMSB stained sections of ruminal papillae illustrating representative examples of low and high examples of clefting score (A – low clefting, B – high clefting), stratum corneum integrity (C- low SCINT, D – high SCINT) and sloughing score (E – low slough score, F – high slough score) as scored using the scoring system in section 3.3.7.
A B
C D
E F
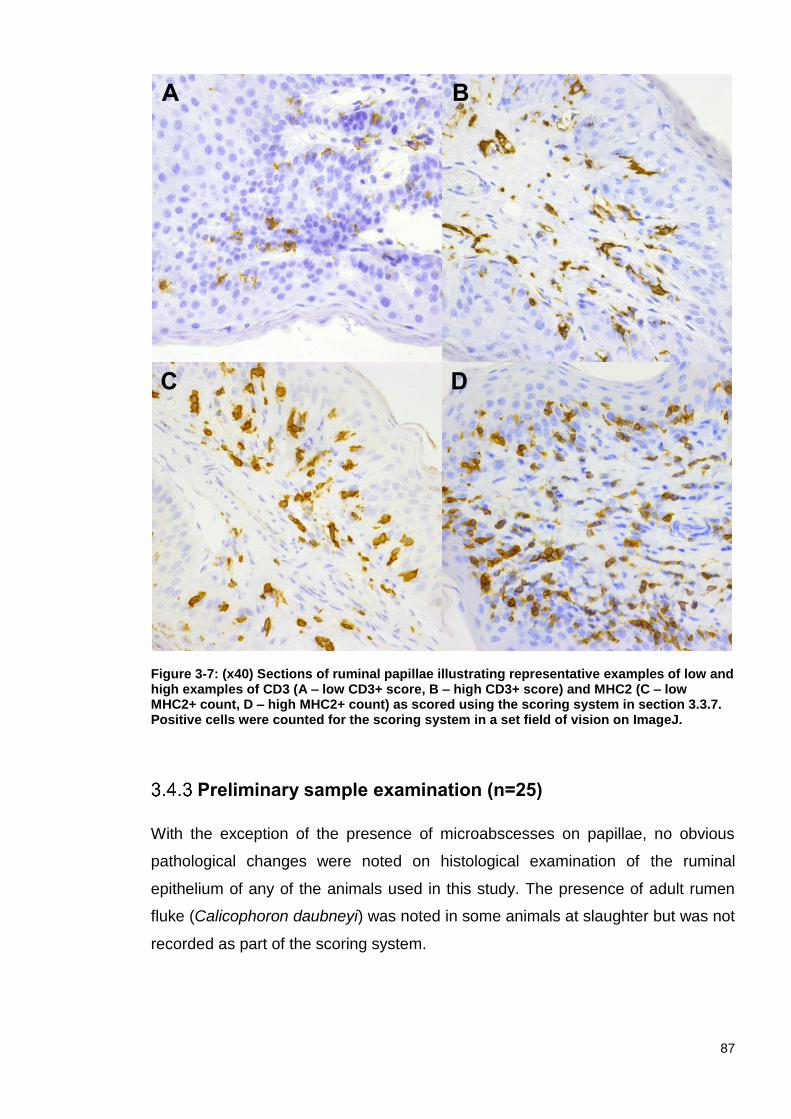
87
Figure 3-7: (x40) Sections of ruminal papillae illustrating representative examples of low and high examples of CD3 (A – low CD3+ score, B – high CD3+ score) and MHC2 (C – low MHC2+ count, D – high MHC2+ count) as scored using the scoring system in section 3.3.7. Positive cells were counted for the scoring system in a set field of vision on ImageJ.
Preliminary sample examination (n=25)
With the exception of the presence of microabscesses on papillae, no obvious
pathological changes were noted on histological examination of the ruminal
epithelium of any of the animals used in this study. The presence of adult rumen
fluke (Calicophoron daubneyi) was noted in some animals at slaughter but was not
recorded as part of the scoring system.
A B
C D

88
3.4.3.1 Continuous scoring variables
Scores for continuous variables were compared between diets (CGFB, CSFD,
CMFB, CCFB and RCFB (A-E)) and between groups (CONCENTRATE (groups C-
E) and FORAGE (groups A-B)), as shown in table 3-2. Between diets, average
stratum corneum thickness and average vascular diameter were significantly
different (p <0.05) but average stratum granulosum thickness, CD3+ and MHC2+
count were not (p >0.05). Between groups (CONCENTRATE and FORAGE),
average stratum corneum thickness, average stratum granulosum thickness and
average vascular diameter were significantly different (p <0.05) but CD3+ and
MHC2+ counts were not (p >0.05).

89
Table 3-2: Summary of rumen histological observations on 25 samples from animals on diverse diets. Continuous data results expressed as mean value for the group (± SD). Categorical data expressed as the count of each possible level. *nt = not tested because of expected small number of observations per category.
HIGH FORAGE HIGH CONCENTRATE
Variable
CGFB (n=5) (grass-fed beef)
CSFD (n=5) (silage-fed dairy)
CMFB (n=5) (mixed diet beef)
CCFB (n=5) (cereal beef)
RCFB (n=5) (cereal beef)
P Value (diet)
P Value (forage/conc.)
Thickness of stratum corneum (µm) 13.45 ± 3.44 11.89 ± 2.20 23.06 ± 11.16 16.97 ± 5.13 25.57 ± 8.62 0.012 0.002
Thickness of stratum granulosum (µm) 63.73 ± 4.06 67.22 ± 8.48 71.27 ± 10.40 69.97 ± 10.10 85.82 ± 18.47 0.075 0.050
Diameter of largest blood vessel (µm) 21.37 ± 6.65 18.52 ± 4.25 24.84 ± 24.51 10.54 ± 2.82 12.12 ± 2.95 0.046 0.025
Count of CD3+ cells 33.40 ± 15.58 26.80 ± 14.17 20.80 ± 8.35 22.00 ± 3.54 35.40 ± 28.52 0.725 0.415
Count of MHCII+ cells 66.40 ± 18.80 55.00 ± 5.79 43.20 ± 33.36 58.20 ± 21.46 39.60 ± 14.52 0.271 0.121
Clefting of papillae CLEFT 1 0 1 0 3 3 nt* nt
CLEFT 2 0 2 2 2 2
CLEFT 3 5 2 3 0 0
Cytoplasmic swelling SWELL 2 4 3 1 0 0 nt nt
SWELL 3 1 2 1 0 0
SWELL 4 0 0 1 1 0
SWELL 5 0 0 1 2 3
SWELL 6 0 0 1 2 2
Perinuclear vacuolation VAC 0 3 0 0 1 0 nt nt
VAC 1 1 2 2 0 0
VAC 2 1 3 3 4 5
Loss of integrity of stratum corneum SCINT 1 5 2 0 0 0 nt nt
SCINT 2 0 2 2 0 0
SCINT 3 0 0 1 3 1
SCINT 4 0 1 0 1 1
SCINT 5 0 0 2 1 3
Sloughing of stratum corneum SLOUGH 1 3 4 3 4 0 nt nt
SLOUGH 2 2 1 2 1 3
SLOUGH 3 0 0 0 0 2
Microabscess in epithelium MICRO 0 5 2 3 5 4 nt nt
MICRO 1 0 3 2 0 1

90
3.4.3.2 Categorical scoring variables
Scores from categorical variables are shown below as composite bar charts in
figures 3-8 and 3-9, where the lowest score is represented by the darkest shade of
grey. As there was a small number of animals which corresponded to each level for
each variable, these data sets could not be analysed statistically. However, it
appears that clefting scores were highest in grass fed animals (group A), whereas
cytoplasmic swelling, perinuclear vacuolation and loss of stratum corneum integrity
were all observed in high concentrate diets (groups C-E).
Figure 3-8: Composite bar charts of categorical parameters for each diet, where the lowest score is represented by the darkest shade of grey. Due to the small number of counts for each score, these variables were not statistically analysed. However, it appears that cleft scores were highest in grass fed animals (Diet A) and cytoplasmic swelling (SWELLSCORE), whereas perinuclear vacuolation (VACSCORE) and stratum corneum integrity (SCINT) were all highest in animals fed high concentrate diets (Diets C-E).

91
Figure 3-9: Composite bar charts for categorical variables for each group (FORAGE and CONCENTRATE), where the lowest score is represented by the darkest shade of grey. Due to the small number of counts for each score, these variables were not statistically analysed. These graphs suggest that clefting was highest in forage fed animals and cytoplasmic swelling (SWELLSCORE), perinuclear vacuolation (VACSCORE) and stratum corneum integrity (SCINT) were all highest in animals fed high concentrate diets.
3.4.3.3 Principle components analysis (PCA)
Horn’s parallel analysis (PA) was carried out to investigate which factors should be
retained in the histological scoring model for future testing. Table 3-3 lists the
Eigenvalues obtained from the PA (where Eigenvalues explain variance among
parameters).
The PA suggested that only 2 factors should be retained. The results of the factor
analysis, selecting 2 factors, are shown in figure 3-10 and the loadings of each of
the variables for the 2 retained factors are listed in Table 3-4. The 2 factors explained
43% of the variance in results.

92
Table 3-3: Results of Horn's Parallel Analysis for factor retention with 5000 iterations, using the mean estimate (RStudio using Paran package).
Factor Adjusted
Eigenvalue Unadjusted Eigenvalue
Estimated Bias
1 1.91 3.65 1.73
2 0.13 1.42 1.29
3 -0.07 0.88 0.96
4 -0.25 0.43 0.69
5 -0.10 0.36 0.45
6 -0.01 0.24 0.25
7 0.13 0.21 0.08
8 0.02 -0.04 -0.06
9 0.14 -0.04 -0.18
10 0.11 -0.16 -0.27
11 0.09 -0.24 -0.34
Figure 3-10: Results from Horn’s PA and PCA. Horns PA shows only 2 factors should be retained, as shown by the two filled black dots above the 0 line on the adjusted eigenvalues (retained) line.
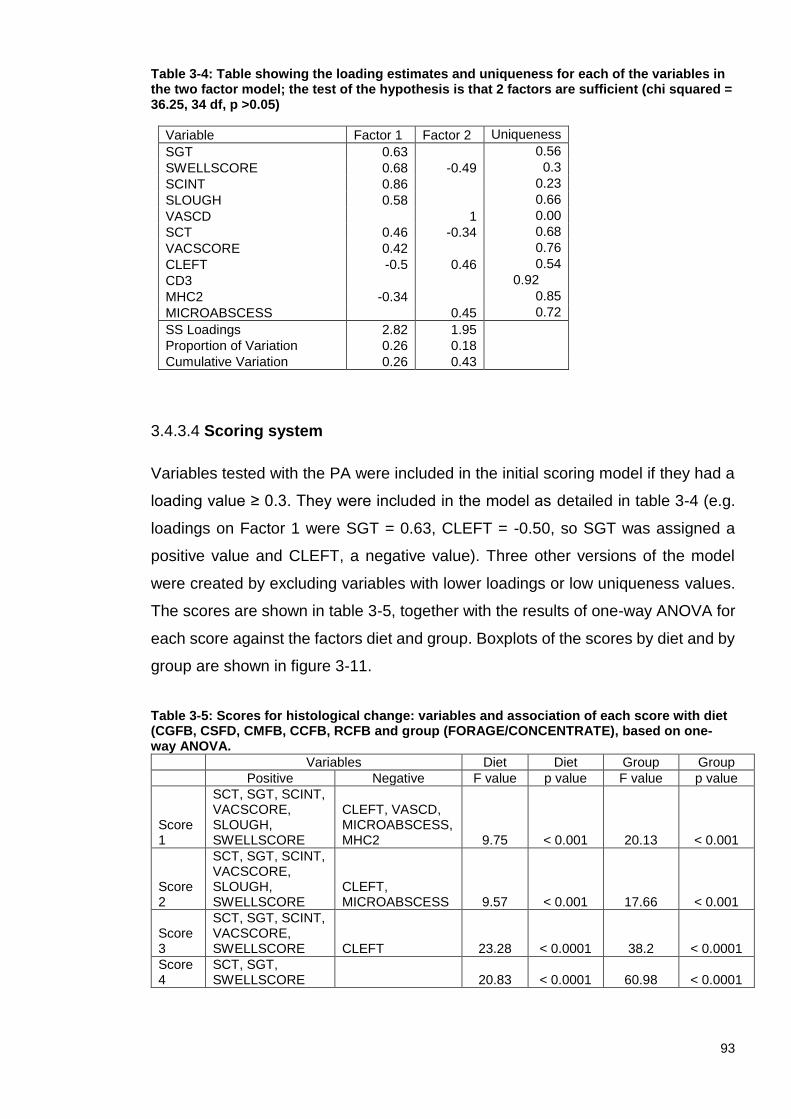
93
Table 3-4: Table showing the loading estimates and uniqueness for each of the variables in the two factor model; the test of the hypothesis is that 2 factors are sufficient (chi squared = 36.25, 34 df, p >0.05)
Variable Factor 1 Factor 2 Uniqueness
SGT 0.63 0.56
SWELLSCORE 0.68 -0.49 0.3
SCINT 0.86 0.23
SLOUGH 0.58 0.66
VASCD 1 0.00
SCT 0.46 -0.34 0.68
VACSCORE 0.42 0.76
CLEFT -0.5 0.46 0.54
CD3 0.92
MHC2 -0.34 0.85
MICROABSCESS 0.45 0.72
SS Loadings 2.82 1.95
Proportion of Variation 0.26 0.18
Cumulative Variation 0.26 0.43
3.4.3.4 Scoring system
Variables tested with the PA were included in the initial scoring model if they had a
loading value ≥ 0.3. They were included in the model as detailed in table 3-4 (e.g.
loadings on Factor 1 were SGT = 0.63, CLEFT = -0.50, so SGT was assigned a
positive value and CLEFT, a negative value). Three other versions of the model
were created by excluding variables with lower loadings or low uniqueness values.
The scores are shown in table 3-5, together with the results of one-way ANOVA for
each score against the factors diet and group. Boxplots of the scores by diet and by
group are shown in figure 3-11.
Table 3-5: Scores for histological change: variables and association of each score with diet (CGFB, CSFD, CMFB, CCFB, RCFB and group (FORAGE/CONCENTRATE), based on one-way ANOVA.
Variables Diet Diet Group Group
Positive Negative F value p value F value p value
Score 1
SCT, SGT, SCINT, VACSCORE, SLOUGH, SWELLSCORE
CLEFT, VASCD, MICROABSCESS, MHC2 9.75 < 0.001 20.13 < 0.001
Score 2
SCT, SGT, SCINT, VACSCORE, SLOUGH, SWELLSCORE
CLEFT, MICROABSCESS 9.57 < 0.001 17.66 < 0.001
Score 3
SCT, SGT, SCINT, VACSCORE, SWELLSCORE CLEFT 23.28 < 0.0001 38.2 < 0.0001
Score 4
SCT, SGT, SWELLSCORE 20.83 < 0.0001 60.98 < 0.0001

94
Figure 3-11: Box and whisker plots showing results from each of the 4 scores created from the histological variables for diet (A: CGFB, B: CSFD, C: CMFB, D: CCFB and E: RCFB) and group (Concentrate and Forage). Score 1 = (+) SCT, SGT, SCINT, VACSCORE, SLOUGH, SWELLSCORE and (-) CLEFT, VASCD, MICROABSCESS, MHC2. Score 2 = (+) SCT, SGT, SCINT, VACSCORE, SLOUGH, SWELLSCORE and (-) CLEFT, MICROABSCESS. Score 3 = (+) SCT, SGT, SCINT, VACSCORE, SWELLSCORE and (-) CLEFT. Score 4 = (+) SCT, SGT, SWELLSCORE.

95
Farm characteristics
Table 3-6 is a list of the dietary inputs on each of the 6 beef farms (high (H) or low-
risk (L)). A small number of farms were involved in the study and each farm had a
wide range of dietary inputs. Due to this small sample size and large range, there
was inconsistency between farms in terms of the dietary components. The fact that
the vast majority of dietary components were not repeated across farms meant it
was not possible to statistically test the majority of the parameters as an explanatory
variable for each of the dependent variables. From the parameters that were
replicated across farms, those chosen to be further investigated were farm of origin
(FARM), initial risk classification (RISK), percentage of DM as barley (BARLEY) and
percentage of TMR particles <1.2 mm (FINES).
The effect of farm of origin (FARM) was significant for the majority of parameters,
except ruminal fluid (RF) butyrate, CLEFT, SCINT, SWELLSCORE and
VACSCORE (p >0.05). The effect of RISK classification was significant on a smaller
number of parameters and was not significant for RF HISTAMINE, RF
ISOBUTYRATE, RF ACETATE: PROPIONATE, caecal fluid (CF) ACETATE, CF
PROPIONAGTE, CF BUTYRATE, CF TOTAL SCFA, CCL11, NHE3, IL2, VASCD,
CLEFT, SCINT, SWELLSCORE and VACSCORE. The percentage of DM as
BARLEY had a significant effect on the majority of parameters except CF
BUTYRATE, CLEFT, SCINT, MICROABSCESS, SWELLSCORE and VACSCORE.
The percentage of FINES had a significant effect on the majority of parameters
except CF BUTYRATE, CLEFT, SCINT, SWELLSCORE and VACSCORE.
3.4.4.1 Effects of breed, sex, age and weight
The effects of breed, sex, age and weight at slaughter were all confounded by the
effect of the farm of origin (FARM). As a result, the possible effects of breed, sex,
age and weight were not investigated further.
3.4.4.2 Histamine in reticuloruminal fluid
RF HISTAMINE concentration was affected significantly by both BARLEY and
FINES in the diet (p <0.05) but not by risk category (RISK) (p >0.05).

96
Table 3-6: List of the dietary components from each of the 6 beef farms. Table shows dietary composition, chemical analysis and particle size. (*values for farm BL7 were verbally confirmed by communication with farmer and could not be verified, thus they are considered estimates only and used only for the initial a priori classification of risk).
Farm
BL2 BL3 BL7 BH1 BH6 BH7
Sex Male 11 1 10 0 18 20
Female 9 19 9 20 2 0
Age at slaughter ±SD (days) 646±149 689±50 671±65 703±19 702±68 788±85
Coldweight at slaughter ± (kg) 297±27 383±34 356±24 384±30 400±10 403±15
Breed Continental 16 19 12 20 20 18
British 4 1 7 0 0 2
Diet (%DM) Barley 48.8 43.5 50* 57.3 67.9 70
Straw 18.3 6.5 20* 10.7 Grass Silage 24.4 50 25* Pot ale syrup 8.5 5* 31.5 10.7 15
Dark grains 10.7 5
Sugar beet pulp 10.7 0
Soya hulls 10
Additives Minerals Y Y Y Y Y Y
Rumitech N N N N Y Y
Yeast N Y Y N Y Y
Buffer N Y N N N N
TMR Composition (%DM) Crude protein 6.62 11.98 13.28 11.06 9.94 12.5
Crude fibre 8.23 5.43 11.48 13.23 5.35 4.84
Starch 24.73 33.26 n/a 37.13 36.93 39.63
NDF 25.85 21.4 n/a 13.81 16.75 19.51
Milled Barley Composition (%DM) Crude protein 10.24 10.41 n/a 11.92 11.06 10.51
Crude fibre 5.51 3.63 n/a 4.83 5.15 3.5
Starch 56.86 57.44 n/a 56.26 55.62 46.98
NDF 25.95 15.62 n/a 19.56 21.83 14.13
TMR Particle Size (mm) >19 75.6 30.7 55.1 23.6 0.1 0
≤ 19 to ≥ 8 7.1 4.2 12.6 7.5 8.2 3
< 8 to ≥ 1.2 16.5 46.9 31.6 65.1 69.5 74.2
< 1.2 0.4 17.3 0.2 3.5 21.3 22.5
Milled Barley Particle Size (mm) >19 0.3 0 n/a n/a 1.3 2.2
≤ 19 to ≥ 8 1.8 0 n/a n/a 37.7 42.3
< 8 to ≥ 1.2 95.7 92.1 n/a n/a 58 60.6
< 1.2 2.7 7.6 n/a n/a 7.6 1.5
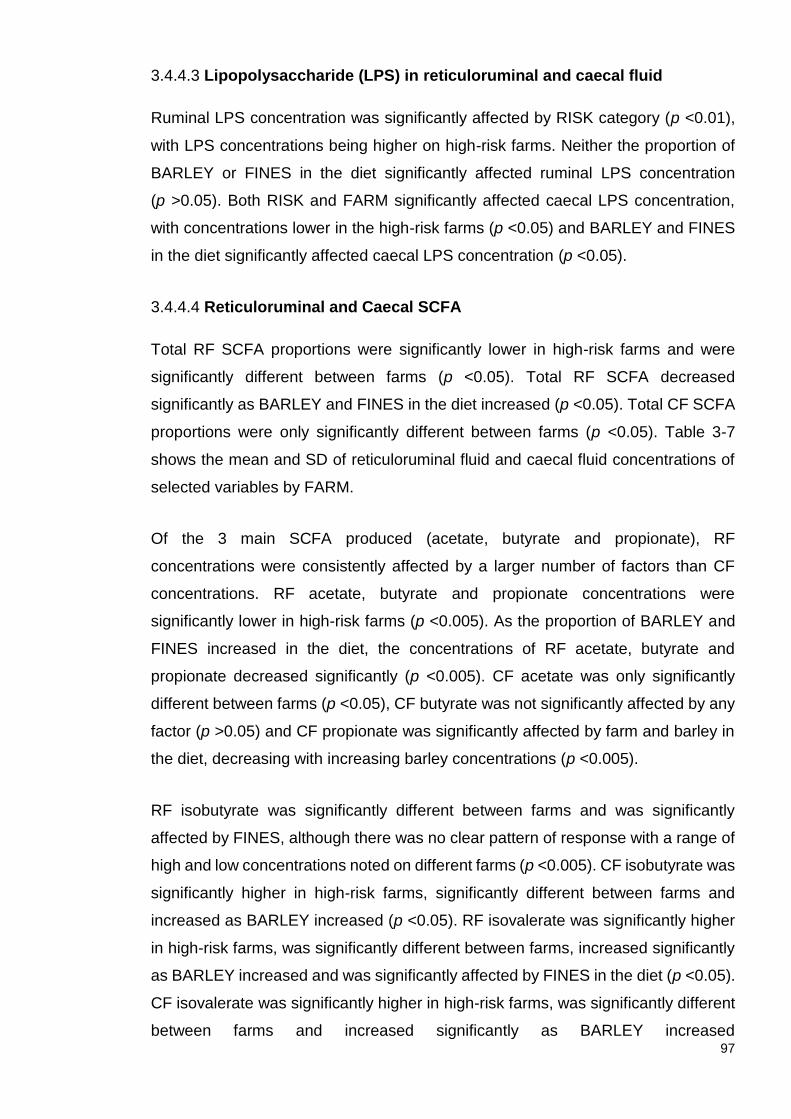
97
3.4.4.3 Lipopolysaccharide (LPS) in reticuloruminal and caecal fluid
Ruminal LPS concentration was significantly affected by RISK category (p <0.01),
with LPS concentrations being higher on high-risk farms. Neither the proportion of
BARLEY or FINES in the diet significantly affected ruminal LPS concentration
(p >0.05). Both RISK and FARM significantly affected caecal LPS concentration,
with concentrations lower in the high-risk farms (p <0.05) and BARLEY and FINES
in the diet significantly affected caecal LPS concentration (p <0.05).
3.4.4.4 Reticuloruminal and Caecal SCFA
Total RF SCFA proportions were significantly lower in high-risk farms and were
significantly different between farms (p <0.05). Total RF SCFA decreased
significantly as BARLEY and FINES in the diet increased (p <0.05). Total CF SCFA
proportions were only significantly different between farms (p <0.05). Table 3-7
shows the mean and SD of reticuloruminal fluid and caecal fluid concentrations of
selected variables by FARM.
Of the 3 main SCFA produced (acetate, butyrate and propionate), RF
concentrations were consistently affected by a larger number of factors than CF
concentrations. RF acetate, butyrate and propionate concentrations were
significantly lower in high-risk farms (p <0.005). As the proportion of BARLEY and
FINES increased in the diet, the concentrations of RF acetate, butyrate and
propionate decreased significantly (p <0.005). CF acetate was only significantly
different between farms (p <0.05), CF butyrate was not significantly affected by any
factor (p >0.05) and CF propionate was significantly affected by farm and barley in
the diet, decreasing with increasing barley concentrations (p <0.005).
RF isobutyrate was significantly different between farms and was significantly
affected by FINES, although there was no clear pattern of response with a range of
high and low concentrations noted on different farms (p <0.005). CF isobutyrate was
significantly higher in high-risk farms, significantly different between farms and
increased as BARLEY increased (p <0.05). RF isovalerate was significantly higher
in high-risk farms, was significantly different between farms, increased significantly
as BARLEY increased and was significantly affected by FINES in the diet (p <0.05).
CF isovalerate was significantly higher in high-risk farms, was significantly different
between farms and increased significantly as BARLEY increased

98
(p <0.05). RF Valerate was significantly lower on high-risk farms, was significantly
different between farms, and was significantly lower with higher BARLEY and FINES
in the diet (p <0.001). CF valerate was significantly different between farms and was
significantly affected by BARLEY, increasing as barley increased
(p < 0.05).
Table 3-7: Mean and SD of reticuloruminal fluid and caecal fluid concentrations of selected variables by FARM. The stated p value is derived from Kruskal-Wallis test on untransformed data. RF = reticuloruminal fluid; CF = caecal fluid. P-values are written as stated unless they fell below 0.0001.
Variable Farm
BH1 BH6 BH7 BL2 BL3 BL7 p value
RF acetate (mmol/l)
62.29 (13.46)
40.97 (6.93)
36.93 (17.21)
66.02 (15.96)
54.16 (22.19)
85.33 (13.93)
<0.0001
RF butyrate (mmol/l)
12.68 (7.89)
4.86 (1.40)
4.56 (1.94)
9.79 (3.78)
9.06 (5.55) 16.73 (5.90)
<0.0001
RF propionate (mmol/l)
25.57 (8.56)
14.28 (2.72)
10.90 (6.88)
23.51 (15.44)
29.00 (14.03)
22.68 (4.90)
<0.0001
RF lactate (mmol/l)
3.37 (1.38)
2.31 (1.16)
2.80 (1.19)
1.26 (0.98)
2.02 (1.07)
0.00 (0.00)
<0.0001
RF Total SCFA (mmol/l)
108.17 (25.79)
65.54 (10.12)
57.53 (26.98)
105.71 (26.39)
97.19 (36.09)
128.04 (22.53)
<0.0001
RF Acetate: Propionate
2.59 (0.65)
2.90 (0.32)
3.69 (0.73)
3.30 (1.16)
2.17 (1.03)
3.86 (0.70)
<0.0001
RF LPS (U/l) 68,493 (61,387)
136,221 (66,806)
55,284 (35,212)
111,704 (102,111)
72,077 (85,301)
24,991 (35,043)
<0.0001
RF Histamine (U/l)
7,553 (5,319)
5,432 (4,846)
1,038 (1,858)
2,540 (2,032)
1,734 (2,654)
2,863 (1,113)
<0.0001
CF acetate (mmol/l)
45.39 (9.76)
43.31 (11.74)
55.60 (12.00)
50.50 (14.61)
47.13 (10.74)
54.09 (10.58)
0.014
CF butyrate (mmol/l)
5.35 (4.51)
3.91 (1.12)
3.69 (1.04)
3.54 (0.78)
3.45 (1.35)
4.62 (1.28)
0.10
CF propionate (mmol/l)
12.51 (2.63)
14.15 (3.43)
16.08 (3.23)
13.94 (4.34)
10.67 (2.44)
14.40 (2.43)
<0.0001
CF lactate (mmol/l)
1.31 (0.70)
1.71 (1.16)
(1.31 (0.66)
1.37 (0.75)
0.53 (0.70)
0.57 (0.25)
<0.0001
CF LPS (U/l) 624,286 (531,296)
125,419 (133,316)
871,261 (424,914)
534,684 (455,379)
1,975,886 (1,126,242)
588,463 (380,156)
<0.000-01
RF Lactate was significantly higher in high-risk farms and was significantly different
between farms (p <0.05). RF lactate was significantly affected by both BARLEY and
FINES in the diet and increased as barley and fines increased
(p <0.05). CF lactate was significantly higher on high-risk farms, was significantly
different between farms and was significantly affected by BARLEY, with similar
values noted across all barley groups except the group fed the lowest amount of
barley, which had lower CF lactate (p <0.05).
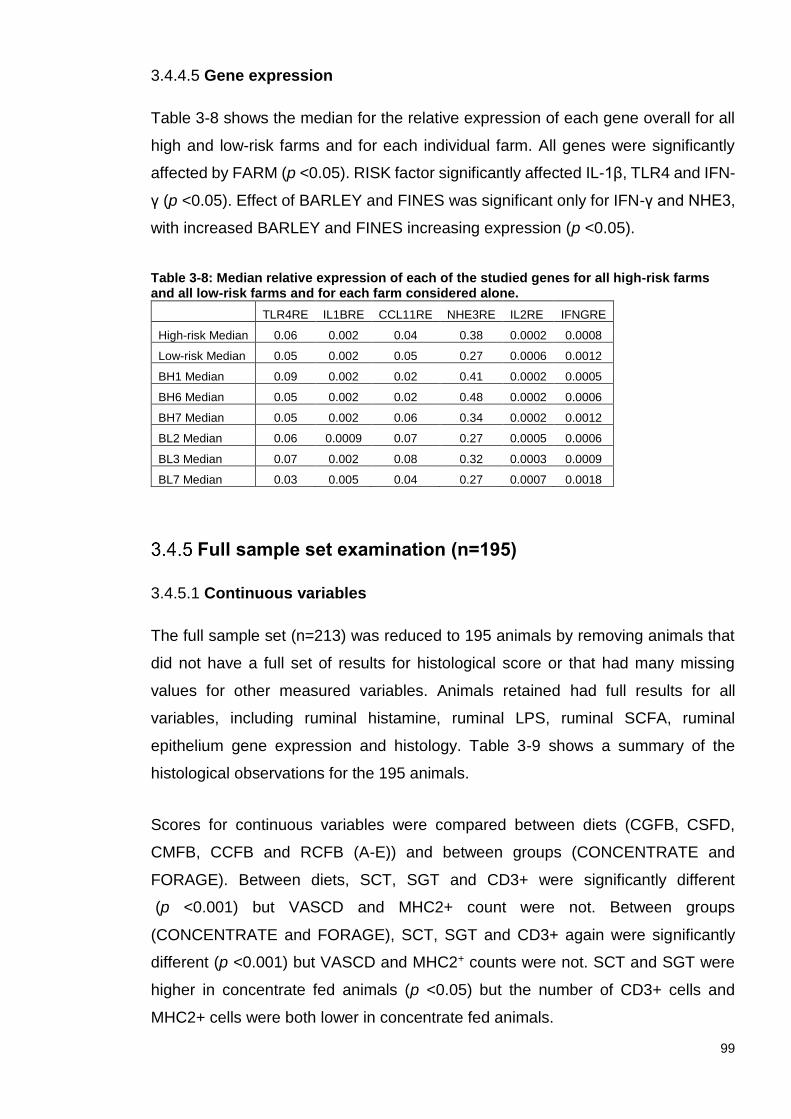
99
3.4.4.5 Gene expression
Table 3-8 shows the median for the relative expression of each gene overall for all
high and low-risk farms and for each individual farm. All genes were significantly
affected by FARM (p <0.05). RISK factor significantly affected IL-1β, TLR4 and IFN-
γ (p <0.05). Effect of BARLEY and FINES was significant only for IFN-γ and NHE3,
with increased BARLEY and FINES increasing expression (p <0.05).
Table 3-8: Median relative expression of each of the studied genes for all high-risk farms and all low-risk farms and for each farm considered alone.
TLR4RE IL1BRE CCL11RE NHE3RE IL2RE IFNGRE
High-risk Median 0.06 0.002 0.04 0.38 0.0002 0.0008
Low-risk Median 0.05 0.002 0.05 0.27 0.0006 0.0012
BH1 Median 0.09 0.002 0.02 0.41 0.0002 0.0005
BH6 Median 0.05 0.002 0.02 0.48 0.0002 0.0006
BH7 Median 0.05 0.002 0.06 0.34 0.0002 0.0012
BL2 Median 0.06 0.0009 0.07 0.27 0.0005 0.0006
BL3 Median 0.07 0.002 0.08 0.32 0.0003 0.0009
BL7 Median 0.03 0.005 0.04 0.27 0.0007 0.0018
Full sample set examination (n=195)
3.4.5.1 Continuous variables
The full sample set (n=213) was reduced to 195 animals by removing animals that
did not have a full set of results for histological score or that had many missing
values for other measured variables. Animals retained had full results for all
variables, including ruminal histamine, ruminal LPS, ruminal SCFA, ruminal
epithelium gene expression and histology. Table 3-9 shows a summary of the
histological observations for the 195 animals.
Scores for continuous variables were compared between diets (CGFB, CSFD,
CMFB, CCFB and RCFB (A-E)) and between groups (CONCENTRATE and
FORAGE). Between diets, SCT, SGT and CD3+ were significantly different
(p <0.001) but VASCD and MHC2+ count were not. Between groups
(CONCENTRATE and FORAGE), SCT, SGT and CD3+ again were significantly
different (p <0.001) but VASCD and MHC2+ counts were not. SCT and SGT were
higher in concentrate fed animals (p <0.05) but the number of CD3+ cells and
MHC2+ cells were both lower in concentrate fed animals.
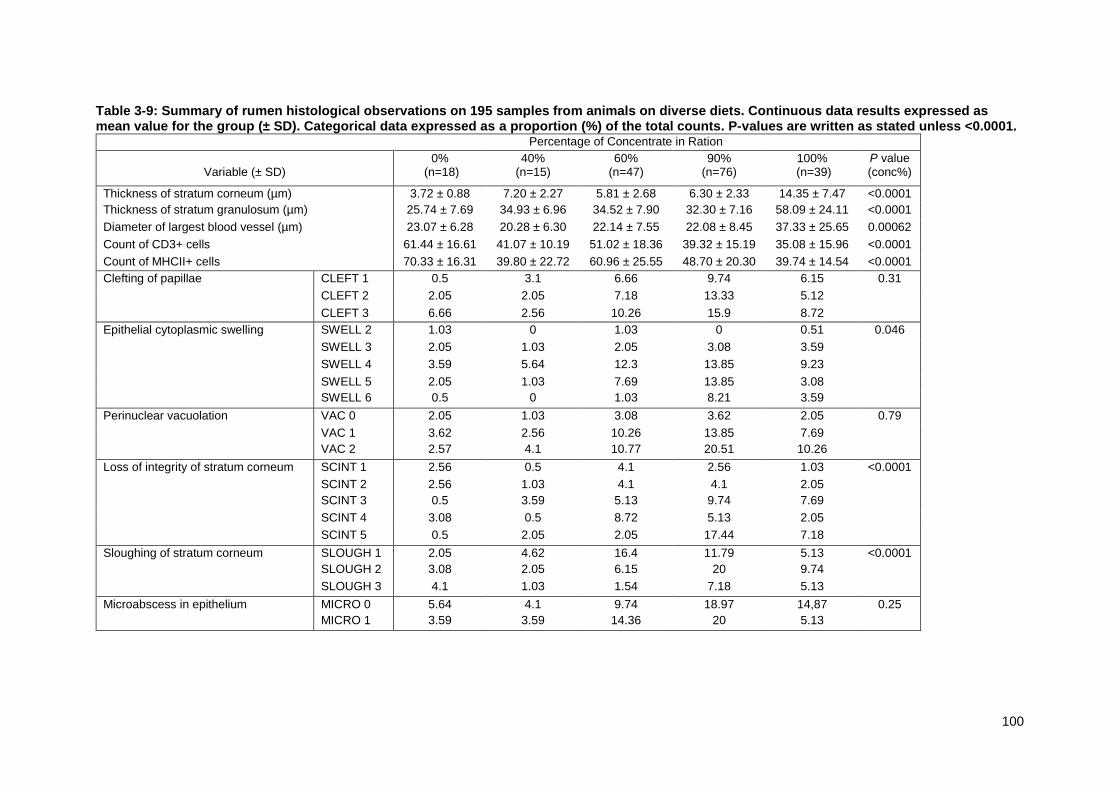
100
Table 3-9: Summary of rumen histological observations on 195 samples from animals on diverse diets. Continuous data results expressed as mean value for the group (± SD). Categorical data expressed as a proportion (%) of the total counts. P-values are written as stated unless <0.0001.
Percentage of Concentrate in Ration
Variable (± SD)
0% (n=18)
40% (n=15)
60% (n=47)
90% (n=76)
100% (n=39)
P value (conc%)
Thickness of stratum corneum (µm) 3.72 ± 0.88 7.20 ± 2.27 5.81 ± 2.68 6.30 ± 2.33 14.35 ± 7.47 <0.0001
Thickness of stratum granulosum (µm) 25.74 ± 7.69 34.93 ± 6.96 34.52 ± 7.90 32.30 ± 7.16 58.09 ± 24.11 <0.0001
Diameter of largest blood vessel (µm) 23.07 ± 6.28 20.28 ± 6.30 22.14 ± 7.55 22.08 ± 8.45 37.33 ± 25.65 0.00062
Count of CD3+ cells 61.44 ± 16.61 41.07 ± 10.19 51.02 ± 18.36 39.32 ± 15.19 35.08 ± 15.96 <0.0001
Count of MHCII+ cells 70.33 ± 16.31 39.80 ± 22.72 60.96 ± 25.55 48.70 ± 20.30 39.74 ± 14.54 <0.0001
Clefting of papillae CLEFT 1 0.5 3.1 6.66 9.74 6.15 0.31
CLEFT 2 2.05 2.05 7.18 13.33 5.12
CLEFT 3 6.66 2.56 10.26 15.9 8.72
Epithelial cytoplasmic swelling SWELL 2 1.03 0 1.03 0 0.51 0.046
SWELL 3 2.05 1.03 2.05 3.08 3.59
SWELL 4 3.59 5.64 12.3 13.85 9.23
SWELL 5 2.05 1.03 7.69 13.85 3.08
SWELL 6 0.5 0 1.03 8.21 3.59
Perinuclear vacuolation VAC 0 2.05 1.03 3.08 3.62 2.05 0.79
VAC 1 3.62 2.56 10.26 13.85 7.69
VAC 2 2.57 4.1 10.77 20.51 10.26
Loss of integrity of stratum corneum SCINT 1 2.56 0.5 4.1 2.56 1.03 <0.0001
SCINT 2 2.56 1.03 4.1 4.1 2.05
SCINT 3 0.5 3.59 5.13 9.74 7.69
SCINT 4 3.08 0.5 8.72 5.13 2.05
SCINT 5 0.5 2.05 2.05 17.44 7.18
Sloughing of stratum corneum SLOUGH 1 2.05 4.62 16.4 11.79 5.13 <0.0001
SLOUGH 2 3.08 2.05 6.15 20 9.74
SLOUGH 3 4.1 1.03 1.54 7.18 5.13
Microabscess in epithelium MICRO 0 5.64 4.1 9.74 18.97 14,87 0.25
MICRO 1 3.59 3.59 14.36 20 5.13
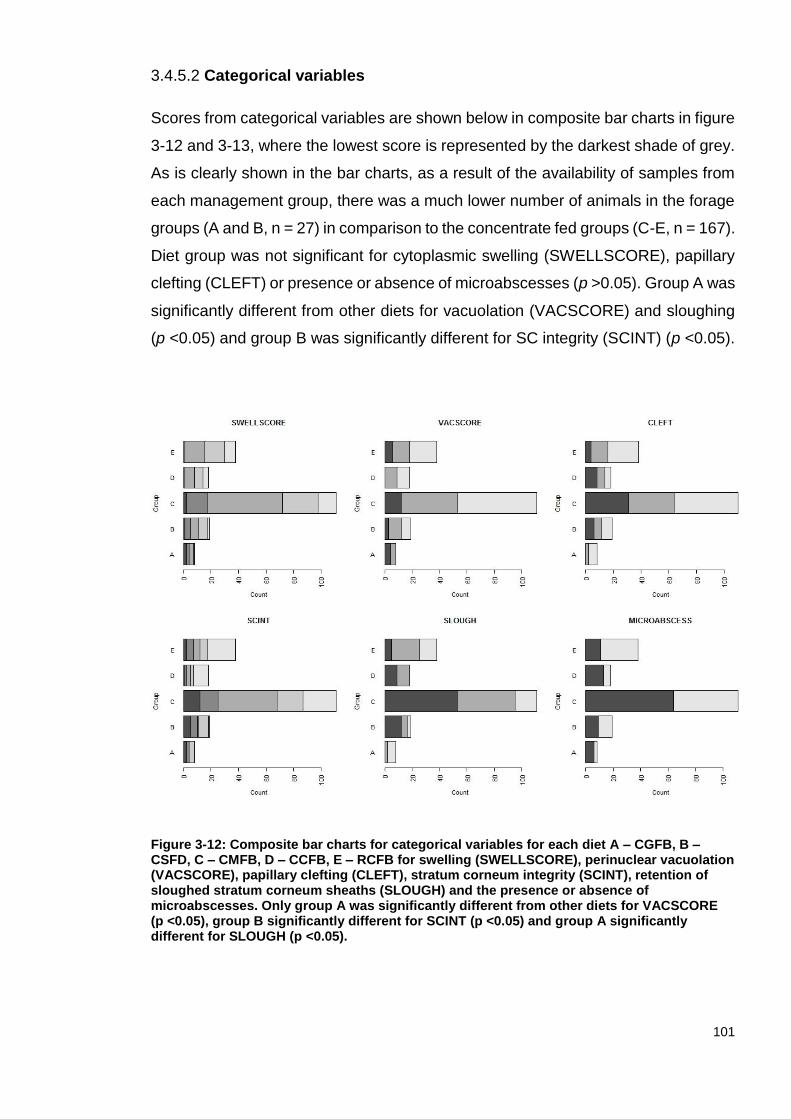
101
3.4.5.2 Categorical variables
Scores from categorical variables are shown below in composite bar charts in figure
3-12 and 3-13, where the lowest score is represented by the darkest shade of grey.
As is clearly shown in the bar charts, as a result of the availability of samples from
each management group, there was a much lower number of animals in the forage
groups (A and B, n = 27) in comparison to the concentrate fed groups (C-E, n = 167).
Diet group was not significant for cytoplasmic swelling (SWELLSCORE), papillary
clefting (CLEFT) or presence or absence of microabscesses (p >0.05). Group A was
significantly different from other diets for vacuolation (VACSCORE) and sloughing
(p <0.05) and group B was significantly different for SC integrity (SCINT) (p <0.05).
Figure 3-12: Composite bar charts for categorical variables for each diet A – CGFB, B – CSFD, C – CMFB, D – CCFB, E – RCFB for swelling (SWELLSCORE), perinuclear vacuolation (VACSCORE), papillary clefting (CLEFT), stratum corneum integrity (SCINT), retention of sloughed stratum corneum sheaths (SLOUGH) and the presence or absence of microabscesses. Only group A was significantly different from other diets for VACSCORE (p <0.05), group B significantly different for SCINT (p <0.05) and group A significantly different for SLOUGH (p <0.05).
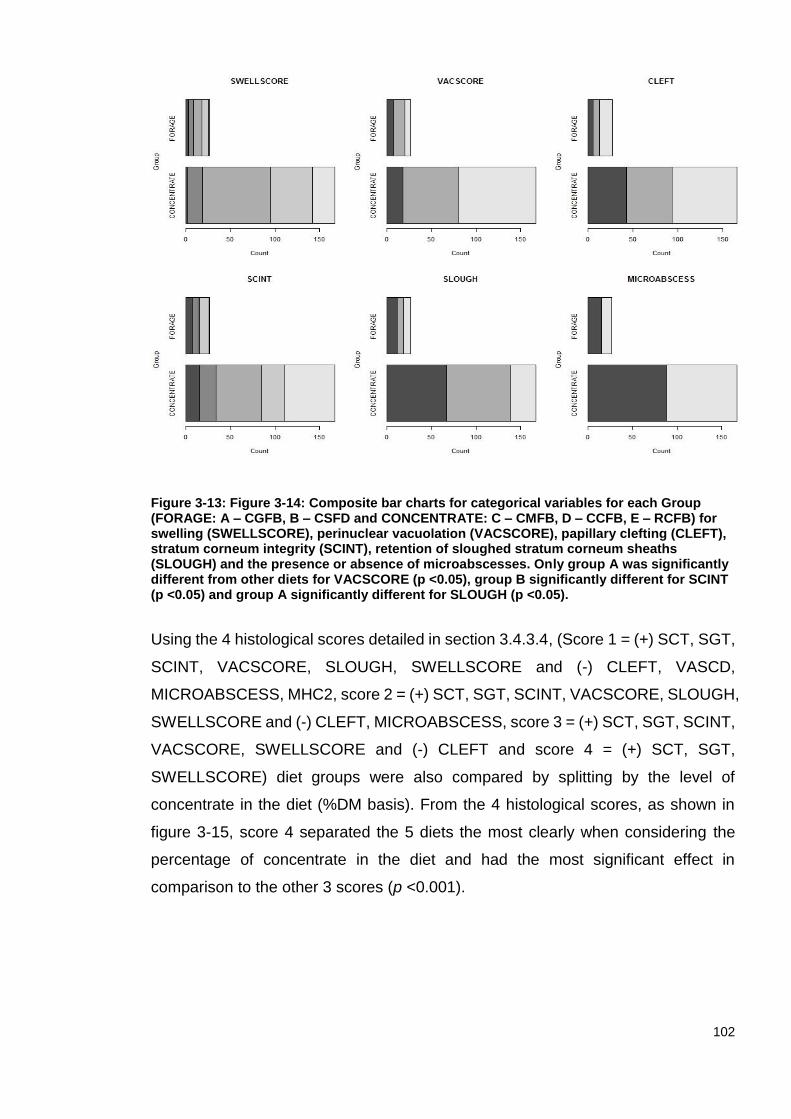
102
Figure 3-13: Figure 3-14: Composite bar charts for categorical variables for each Group (FORAGE: A – CGFB, B – CSFD and CONCENTRATE: C – CMFB, D – CCFB, E – RCFB) for swelling (SWELLSCORE), perinuclear vacuolation (VACSCORE), papillary clefting (CLEFT), stratum corneum integrity (SCINT), retention of sloughed stratum corneum sheaths (SLOUGH) and the presence or absence of microabscesses. Only group A was significantly different from other diets for VACSCORE (p <0.05), group B significantly different for SCINT (p <0.05) and group A significantly different for SLOUGH (p <0.05).
Using the 4 histological scores detailed in section 3.4.3.4, (Score 1 = (+) SCT, SGT,
SCINT, VACSCORE, SLOUGH, SWELLSCORE and (-) CLEFT, VASCD,
MICROABSCESS, MHC2, score 2 = (+) SCT, SGT, SCINT, VACSCORE, SLOUGH,
SWELLSCORE and (-) CLEFT, MICROABSCESS, score 3 = (+) SCT, SGT, SCINT,
VACSCORE, SWELLSCORE and (-) CLEFT and score 4 = (+) SCT, SGT,
SWELLSCORE) diet groups were also compared by splitting by the level of
concentrate in the diet (%DM basis). From the 4 histological scores, as shown in
figure 3-15, score 4 separated the 5 diets the most clearly when considering the
percentage of concentrate in the diet and had the most significant effect in
comparison to the other 3 scores (p <0.001).

103
Figure 3-15: Histological score results for scores 1-4 (Score 1 = (+) SCT, SGT, SCINT, VACSCORE, SLOUGH, SWELLSCORE and (-) CLEFT, VASCD, MICROABSCESS, MHC2, score 2 = (+) SCT, SGT, SCINT, VACSCORE, SLOUGH, SWELLSCORE and (-) CLEFT, MICROABSCESS, score 3 = (+) SCT, SGT, SCINT, VACSCORE, SWELLSCORE and (-) CLEFT and score 4 = (+) SCT, SGT, SWELLSCORE) where diets are split by concentrate percentage (0-100%) where 0% concentrate = diet A, CGFB, 40% concentrate = diet B, CSFD, 60% concentrate = diet C, CMFB, 90% concentrate = diet D, CCFB and 100% concentrate = diet E, RCFB.
From the 4 different scores detailed in section 3.4.3.4, score 1 ((+) SCT, SGT,
SCINT, VACSCORE, SLOUGH, SWELLSCORE, (-) CLEFT, VASCD,
MICROABSCESS, MHC2) was used to analyse the data from the 6 beef farms.
Results from this score were normally distributed and provided more information
than the others. Score 1 differed between farms and was significantly higher in high-
risk groups (p <0.05). BARLEY significantly affected histology score (p <0.05) but
FINES did not (p >0.05). SCT and SGT were significantly different between farms
and were skewed by high results for farm BH6. CD3+ cell count was significantly
affected by RISK and FARM (p <0.05), but was not affected by BARLEY or FINES
(p >0.05). MHC2+ cell count was significantly affected by RISK, FARM, BARLEY
and FINES (p <0.05). Both CD3+ and MHC2+ counts were lower on high-risk farms.
Figure 3-16 shows score 1 results for each of the 6 beef farms and the SG and SG
thickness for each farm, showing clearly the high values for farm BH6.

104
Figure 3-16: box and whisker plots showing score 1 results for each of the 6 beef farms and box and whisker plots showing high SCT and SGT values for farm BH6.
105
Discussion
Beef farm analysis
The factor that strongly affected almost every variable in the study was the farm of
origin. Farm of origin significantly affected all but 1 of the dependent variables
(caecal fluid butyrate). The extent of the variation among farms and in the inputs
and dependent variables was not expected; farms were selected for the trial to
provide broadly similar high and low-risk profiles. Every farm had a unique set of
input variables and the small number of farms involved in the beef study, coupled
with the wide range of differing dietary inputs meant that there was a lack of
replication of the dietary components between farms. This lack of replication meant
it was not possible to test statistically the effect of most of the factors as intended.
Four parameters replicated on all farms were chosen for investigation: farm of origin
(FARM), initial risk classification (RISK: based on barley, straw and silage in the diet
and diet appearance) percentage of DM as barley (BARLEY) and percentage of fine
TMR particles <1.2 mm (FINES). In addition to farm of origin, the proportion of barley
and fine particles in the diet had a significant effect on the largest number of
response variables in comparison to the effect of the initial risk classification.
The risk classification was a significant factor for 22 of 33 continuous dependent
variables. Animals on high-risk farms showed increased concentrations of
reticuloruminal LPS and lactate, thicker stratum corneum and stratum granulosum
and higher relative expression of TLR4. Histological score 1 differed between farms
and was significantly higher in high-risk groups, primarily as a result of this increased
SC and SG, and was also significantly affected by the proportion of barley in diet.
Additionally, animals on high-risk farms showed reduced reticuloruminal SCFA
concentrations and reduced caecal LPS concentrations. The relative expression of
IL1B and IFN-γ and the positive count of MHC2 and CD3 cells were lower in animals
from high-risk farms.
This study investigated the effects of a diet expected to induce acidosis, with the
majority of animals being maintained on a ration containing >40% concentrate to
forage ratios. However, in comparison to the majority of acidosis trials in the
literature that look at an acute effect of diet, animals in this trial had been maintained

106
on the diet for 90-100 days prior to sampling. This long exposure to a diet high in
rapidly fermentable carbohydrates means that results could not be expected to
reflect exactly those noted in acute response studies. As the proportion of barley in
the ration increased, so did the concentration of reticuloruminal and caecal lactate,
reticuloruminal histamine, LPS and the thickness of the stratum corneum and
granulosum. Conversely, there was a reduction in the total SCFA concentration in
the reticulorumen, the expression of IFN-γ and the count of MHCII+ cells in the
ruminal epithelium. Increased LPS, histamine and lactate were expected and
consistent with other studies (Emmanuel et al., 2008). Most studies investigating the
acute effect of a diet high in rapidly fermentable carbohydrates report increases in
reticuloruminal SCFA concentration (Loncke et al., 2009, Aschenbach et al., 2011)
and previous histological studies have shown a decrease in the stratum corneum
and granulosum with the diet (Steele et al., 2011a). This decrease in the main SCFA
and total SCFA concentrations observed in this trial was also observed in the studies
carried out in chapters 4 and 5 during expected “high-risk/challenge” feeding times.
As animals in this present trial were maintained on the diet for a longer duration, this
allowed time for adaptations in the rumen such as proliferation of cells associated
with ion pumps and increased SCFA absorption, leading to increased surface area
(O’Shea et al., 2016). This adaptation would explain the unexpected decrease in
SCFA when barley and proportion of fines increased. The significant effect of barley
and fines on NHE3 relative expression suggests epithelial adaptation as a
mechanism responsible for decreased SCFA. Expression of NHE3 has been shown
to increase in the ruminal epithelium as the papillae surface area increases through
cell proliferation (O’Shea et al., 2016). The fact that the fine particles in the diet had
a significant effect on a wide range of variables reflects the importance of dietary
presentation, in addition to formulation, when considering the risk of acidosis in a
herd.
Histology
The scoring system created in this chapter was shown to be capable of significantly
differentiating animals based on the diet they had been maintained on prior to
slaughter. As with the results from the beef study, there was a wide variation shown
between animals and between diets, except at the most extreme ends of the
spectrum – grass fed and research cereal-fed beef. Contrasting with reports from
107
acute response studies in the literature (Steele et al., 2009, Steele et al., 2011a,
Steele et al., 2012), the most consistent result from the scoring system was an
increase in stratum corneum and stratum granulosum thickness and cytoplasmic
swelling as the level of rapidly fermentable carbohydrates in the diet increased. This
increase has been shown in few studies in the literature in response to a high grain
diets (Nocek et al., 1984, Metzler-Zebeli et al., 2013). As with the SCFA results that
conflict with the current literature regarding acidosis, it is thought the variation in the
histological results occurred due to the length of time the animals were exposed to
the diet and the capacity for adaptation this allowed prior to sampling. Despite these
contrasting observations, initial histological investigations in this chapter were
consistent with previous light microscopic descriptions of the tissue structure and
architecture in the literature and showed the characteristic 4 layers followed by
connective tissue at the deepest level in the papillae (Dobson et al., 1956, Graham
and Simmons, 2004, Eurell and Frappier, 2013). During the initial examination, it
was evident that the modified MSB stain was extremely useful for visualising rumen
histology, despite there being no previous mention of this use for the stain in the
literature that we could find. With the exception of highlighting or confirming the
presence of microabscesses (focal aggregations of neutrophils in the SC, which
were easily identified via EMSB stain), myeloperoxidase staining of the rumen was
not informative and very few myeloperoxidase-positive cells were noted outside
microabscesses. It was not possible to distinguish with the stains used between
vasculature and lymphatics, so all were considered as one – “vasculature”. The
increase in vasculature diameter or increase in the amount of vasculature noted was
significantly different for both diet and group, and fitted with the increase in
vasculature noted by Steele et al (2011a) in animals fed a high grain diet. An
increase in blood supply to the rumen has previously been associated with
increasing SCFA absorption when feeding a high concentrate diet (Dobson, 1984),
fitting with these results and reflecting the decreased SCFA noted in high-risk farms.
Commercial grass-fed beef was significantly different from the others for perinuclear
vacuolation and sloughing. This was unexpected, because as shown by Steele et
al. (2011a), sloughing of the SC is generally associated with higher concentrate
diets. Clefting was associated with the grass fed group in the preliminary sample
examination, then sloughing, vacuolation and higher CD3 and MHC2 positive cell
counts were associated with the grass fed group in the larger group. These are all
parameters expected to be associated with higher grain diets. It is possible that

108
there is another factor influencing the animals in this group, as the diet fed does not
appear to fit with the histological results. Group B (commercial silage fed dairy) was
significantly different for SC integrity, again another parameter that would generally
be associated with sloughing due to a higher carbohydrate diet
With the exception of microabscesses and rumen fluke, no pathological changes
were observed in the rumen of any animals. The only change that was considered
to be of a pathological nature prior to investigation were the black patches noted
post-blanching. However, following investigation there were no obvious
morphological or structural changes between the black and white areas of the rumen
histologically, other than the retention of 3 outermost layers of the epithelium in the
black patches post-blanching, and occasional condensing of pigmentation. The
black areas did not have any associated pathologies and additionally, were not
considered detrimental to rumen sale by abattoir staff - rumens were sold with black
patches intact or simply trimmed. Therefore, post-blanching effects were not
investigated further.
The main and unexpected result of this study was the overwhelming effect of farm
of origin on all variables studied. Farms that had a similar a priori risk classification
based on the major recognised criteria nonetheless showed very diverse patterns
of response in commonly studied variables. The results suggest that as farm of
origin has such a strong effect on results, care is needed when assuming that farms
which appear similar superficially would have a similar risk of animals in the herds
developing acidosis. With finishing cattle, groups are often formed from animals
which originated from many diverse farms and therefore from different neonatal and
genetic backgrounds. This variation in the genetic backgrounds and therefore
epigenetic and microbiome variation could explain some of this strong effect of farm.
Thus, considering the components of a diet and the particle size is not enough when
considering the risk of acidosis.
The scoring system created for this thesis was proven in this chapter to be
successful at significantly differentiating between animals based on their specific
diet groups (such as grass fed beef, barley beef or commercial mixed fed beef) or
based on less specific groupings of forage or concentrate diets. This scoring system
could be useful to investigate further the histological appearance of the rumen and
109
the effects of varying diets. As the need for more efficient, precision farming
increases in the future, the scoring system could be useful for investigating effects
of diet that may not be noticeable clinically or for investigating relationships between
score and observable differences. A future study using the scoring system on larger
subsets of animals from one farm fed differing diets, to investigate the histological
score where farm was not a confounding factor or on a large group of finishing cattle
on one farm where the genetic background was known would provide further
understanding of the effects of farm and genetic background. If the scoring system
could pick up differing results in score from different diets from one farm or differing
results on the same diet with the knowledge of different genetic backgrounds, scores
could possibly be used to help refine diet or be used to select animals for selective
breeding. This refinement or selective breeding could be used to increase
production outputs, whilst minimising negative changes to the rumen epithelium and
the overall rumen environment associated with diet.

110
Effects of a challenge diet high in soluble carbohydrates on production and physiological parameters associated with SARA, with and without direct-fed microbials
Introduction
It has consistently been shown that some herds are more susceptible to sub-acute
ruminal acidosis or SARA than others and that within herds, some animals are more
prone to SARA than others (Garrett, 1996, Kleen et al., 2009, Morgante et al., 2007,
Penner et al., 2009a). This variation in response creates a challenge for nutritional
management, creating the need to balance providing a diet high in fermentable
carbohydrates for energy provision with the risk of developing SARA in the herd
(Penner and Beauchemin, 2010). Some animals in a herd may not adapt well to a
diet high in soluble carbohydrates and the associated reticuloruminal pH decrease,
resulting in a decrease in production parameters such as milk yield, milk fat or daily
live weight gain (Enemark et al., 2002). In contrast, other animals may be able to
maintain their pH or production levels, or both, in response to the same high
carbohydrate diet. This natural variation between animals is not only an opportunity
for genetic selection for those less likely to suffer from SARA, but for the early
recognition of a problem. This variation means that some animals in a herd will show
clinical symptoms well before the entire herd is affected.
This study aimed to describe the variation in commonly used acidosis-indicator traits
in lactating dairy cattle, in response to a challenge diet high in soluble carbohydrates.
The traits investigated in this study have previously been shown repeatedly in the
literature to be associated with SARA in cattle and have been shown to vary among
individuals. Traits studied include reticuloruminal pH, body condition score (BCS),
mobility score, live weight, milk production parameters, blood biochemistry and
haematology, reticuloruminal SCFA proportions, gene expression levels, acute
phase protein concentrations, ruminal and plasma histamine concentrations and
ruminal lipopolysaccharide (LPS) concentrations. For example, movement of SCFA
from the rumen via absorption across the ruminal epithelium has previously been
stated as a key process involved in the regulation of ruminal pH (Eurell and Frappier,
2013), preventing a build-up of SCFA in the rumen and the consequential pH drop.
111
It would be expected that increased levels of SCFA in the rumen would be noted
with decreasing ruminal pH, and those animals with increased absorption or lower
levels of SCFA would show fewer signs associated with acidosis. Ruminal acidosis
and the associated leaking of reactive substances through the ruminal epithelium,
such as LPS and histamine, have been shown to cause a localised or systemic
inflammatory response (Plaizier et al., 2008, Plaizier et al., 2012). Thus, animals
that are more affected by ruminal acidosis would be expected to have higher
expression of inflammatory cytokine genes in response to translocation of these
substances and the corresponding immune response due to ruminal inflammation.
By investigating these parameters and associated mechanisms, it was hoped to
further understand the effects of high starch supplementation on lactating dairy
cattle and to determine the range of individual variation in response to a high starch
challenge diet.
Probiotics and yeasts are commonly fed alongside a high starch diet and have been
shown to have the ability to modulate and maintain the balance of gastrointestinal
microbiota and ruminal pH and increase feed intake and milk production in dairy
cows (Robinson and Garrett, 1999, Dann et al., 2000, Nocek et al., 2003). In this
context, they are referred to as direct-fed microbial (DFM) agents. Supplementation
of diets with yeasts has long been known to stabilise ruminal pH (Bach et al., 2007)
through increasing utilisation of lactic acid (via lactate-utilising bacteria), increasing
microbial growth and by directly competing with ruminal bacteria for rapidly
fermentable carbohydrates. Frequently used DFM in cattle include various strains
of yeasts (commonly Saccharomyces cerevisiae) and lactate producing bacteria
(Enterococcus and Lactobacillus sp.). This study was intended to investigate the
effects of both commonly used, commercially available DFM based on yeast and
novel products developed (by consortium partners) via cultures obtained from
ruminal and caecal fluid samples post-mortem. The novel DFM to be tested in this
study included both yeast and bacterial cultures.

112
Aims
The aims of the work presented in this chapter were to:
1. Quantify the effects of high levels of starch supplementation on specific
physiological parameters that characterise adaptation to soluble carbohydrate
challenges in lactating Holstein-Friesian dairy cows
2. Determine the variation in individual variation in response to high starch
supplementation
3. Determine the efficacy of new DFM for the amelioration of effects related to high
starch supplementation in lactating dairy cows.
4. Contribute to the understanding of the pathogenesis of digestive disturbances in
dairy cattle.

113
Materials and methods
This experiment was conducted during October and November 2015 at the
University of Glasgow’s Cochno Farm and Research Centre under Home Office
Licence project number 60/4156 and Food Standards Agency (FSA) project number
80296.
Experimental design
Forty lactating Holstein-Friesian cattle were divided evenly into 5 treatment groups
via a formal stratified randomisation method. Live weight (kg), milk yield (kg), body
condition score and days in milk were equally represented in each group. There
were no significant differences between groups in any parameters (p >0.05). Cattle
were housed together in the same environment and exposed to the same
management system throughout, so the unit of interest for the study was the
individual cow. To facilitate treatment administration, individual treatment group was
identified by colour coded tail tape. “Treatment” refers to specific DFM as follows:
Treatment 1: Negative control (No protective products used unless clinical signs of
acidosis warranted appropriate veterinary treatment). Fed as 4 g of granulated
sugar/day
Treatment 2: Positive control (BOVAMINE® Complete (Chr.Hansen, Denmark). 1 x
109 CFU of 3 E. faecium strains, 5 x10¹⁰ CFU of live S.cerevisiae, Torula dried yeast
(TDY) and hydrolysed Pichia jadinii, supplying mannan-oligosaccharide (MOS),
beta-glucans and yeast extract. Fed as 14 g BOVAMINE® Complete + 4 g
granulated sugar/day
Treatment 3: Yeast (Vistacell live yeast (AB Vista, UK) + hydrolysed dead yeast)
Fed as 4 g Vistacell + 10 g hydrolysed dead yeast + 4 g granulated sugar/day
Treatment 4: Bacteria (1 × 10¹⁰ CFU/day of Pediococcus acidilactici (Chr.Hansen,
Denmark)). Fed as 4 g + 4 g granulated sugar/day
Treatment 5: Bacteria (1 × 10¹⁰ CFU/day of Biomate SF 20 Enterococcus faecium
Sf 273 (Chr.Hansen, Denmark)). Fed as 4 g + 4 g granulated sugar/day
114
Treatments were top-dressed onto supplemental parlour concentrate during the
afternoon milking on each day. Following milking, consumption of treatments was
noted and recorded for individual cows as “yes”, “no” or “partial”, dependent on the
amount left in individual troughs. Weight of leftover parlour feed was negligible
throughout the trial and was not recorded.
Cattle were fed a basal ration for 3 weeks (D-1 to D-21), fed a basal ration plus
group specific DFM for 3 weeks (D-22 to D-43) then challenged with a diet intended
to induce SARA in addition to their group-specific DFM for 2 weeks (D-45 to D-58).
All animals were fitted with motion-sensing collars (Afimilk Silent Herdsman, UK,
data not presented) and indwelling pH monitoring boluses (smaXtec, Austria).
Samples were collected at 3 time-points: commencement of study (TP-A),
immediately after treatment + basal (TP-B) and immediately after the challenge diet
(TP-C). At each of these 3 sample collections, rumen fluid and blood samples were
taken. Samples were collected from an additional 3 animals at the end of the first 3-
week period (also denoted TP-A), to replace animals removed from the trial for
health reasons. Replacement animals were maintained on the same basal ration as
experimental animals. Live weight, BCS and mobility scoring was carried out weekly
by the same person.
Rations
Cows were given ad libitum access to a partial mixed ration (PMR), fed out in a
single feed bunk and supplementary parlour concentrate (according to existing farm
algorithms for production, lactation stage and BCS). Rations were formulated from
only 4 ingredients: grass silage, straw, parlour concentrate blend and PMR blend.
Representative samples were taken from each of these ingredients and the analysis
is shown in table 4-1.

115
Table 4-1: Feed ingredient analysis (as fed % except where specified)
Parlour Mix Blend for TMR Silage Straw
ME (DM basis) 13.1 13.2 9.7 5.6
NDF 21.9 21.6 9.8 78.7
CP 16.9 16.2 3.2 3.6
CF 5.9 7.4 5.5 41.1
Moisture 13 12.5 81.2 10.9
Sucrose 6.03 3.33 0.1 0.88
Starch 23.3 30.5 0.2 0.2
Soluble CHO 9.55 5.73 0.11 1.8
Cellulose 7.8 8 5 37.1
Table 4-2 and 4-3 show the components of the partial mixed ration (PMR) and the
daily dairy blend parlour allocation for each of the diets. The basal ration was fed to
achieve daily milk production levels consistent with a 300-day lactation yield of
9,000-10,000 litres. Cows were fed at 4 different levels during the period on the
basal diet: “low”, “medium”, “high” and “top”, dependent on milk yield and liveweight.
The challenge ration consisted of an increase in the proportion of concentrate in the
PMR, an increase in concentrate fed in the parlour and a reduction in silage and
straw in the PMR. The objective of the challenge was to provide an increase in
soluble carbohydrates to a level where one would expect the onset of subclinical to
clinical signs of an induced ruminal fermentation disorder. Signs could include
diarrhoea, reduced appetite, reduced milk production and reduced milk fat
percentage. Cows were fed at 3 different levels during the challenge diet: “medium”,
“high” and “top”, dependent on milk yield and live weight. The challenge ration was
designed to fall within a range of values observed on UK dairy farms, result in a
statistically significant reduction in rumen pH to levels previously associated with
SARA, to significantly decrease milk yield/components in the negative control group
or to significantly decrease both pH and milk parameters. It was intended that the
diet would not be so extreme that it caused unacceptably severe welfare outcomes
for cattle or excessive financial loss to the farm. It was also necessary to ensure that
the challenge was approximately equivalent for the late lactation and the low yielding
cows in the herd. Hence, there was unavoidable variation among individuals in the
extent of the challenge.
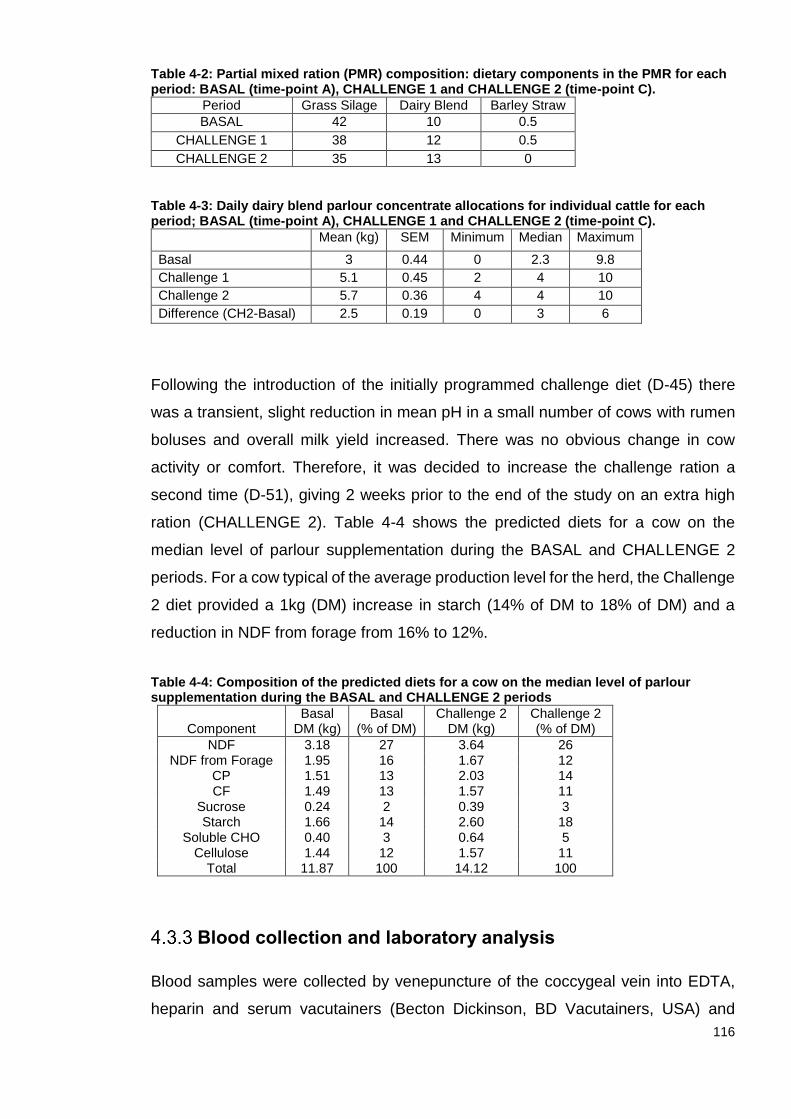
116
Table 4-2: Partial mixed ration (PMR) composition: dietary components in the PMR for each period: BASAL (time-point A), CHALLENGE 1 and CHALLENGE 2 (time-point C).
Period Grass Silage Dairy Blend Barley Straw
BASAL 42 10 0.5
CHALLENGE 1 38 12 0.5
CHALLENGE 2 35 13 0
Table 4-3: Daily dairy blend parlour concentrate allocations for individual cattle for each period; BASAL (time-point A), CHALLENGE 1 and CHALLENGE 2 (time-point C).
Mean (kg) SEM Minimum Median Maximum
Basal 3 0.44 0 2.3 9.8
Challenge 1 5.1 0.45 2 4 10
Challenge 2 5.7 0.36 4 4 10
Difference (CH2-Basal) 2.5 0.19 0 3 6
Following the introduction of the initially programmed challenge diet (D-45) there
was a transient, slight reduction in mean pH in a small number of cows with rumen
boluses and overall milk yield increased. There was no obvious change in cow
activity or comfort. Therefore, it was decided to increase the challenge ration a
second time (D-51), giving 2 weeks prior to the end of the study on an extra high
ration (CHALLENGE 2). Table 4-4 shows the predicted diets for a cow on the
median level of parlour supplementation during the BASAL and CHALLENGE 2
periods. For a cow typical of the average production level for the herd, the Challenge
2 diet provided a 1kg (DM) increase in starch (14% of DM to 18% of DM) and a
reduction in NDF from forage from 16% to 12%.
Table 4-4: Composition of the predicted diets for a cow on the median level of parlour supplementation during the BASAL and CHALLENGE 2 periods
Component Basal
DM (kg) Basal
(% of DM) Challenge 2
DM (kg) Challenge 2 (% of DM)
NDF 3.18 27 3.64 26 NDF from Forage 1.95 16 1.67 12
CP 1.51 13 2.03 14 CF 1.49 13 1.57 11
Sucrose 0.24 2 0.39 3 Starch 1.66 14 2.60 18
Soluble CHO 0.40 3 0.64 5 Cellulose 1.44 12 1.57 11
Total 11.87 100 14.12 100
Blood collection and laboratory analysis
Blood samples were collected by venepuncture of the coccygeal vein into EDTA,
heparin and serum vacutainers (Becton Dickinson, BD Vacutainers, USA) and

117
stored in a passive cool box on ice blocks (<4˚C) until processing. Bloods were
processed in the laboratory as detailed in section 2.5. Bloods were analysed for
standard bovine biochemistry and haematology profiles by Veterinary Diagnostic
Services (VDS) of the University Of Glasgow School Of Veterinary Medicine, using
the Dimension Xpand Plus (Siemens) and ADVIA 20.120 Haematology System
(Siemens) as detailed in sections 2.5.2 and 2.5.3 respectively.
Plasma histamine
Circulating plasma histamine concentration was determined using the Abnova
Histamine ELISA Kit (Cat. No. KA2589) intended for determination of histamine in
EDTA plasma, using a LabTech LT-4500 microplate reader, as detailed in section
2.8. Duplicate measurements were used for all standards, controls and samples.
Quantification of unknown samples was calculated by creating standard curves of
known standards and calculating from the regression.
Acute phase proteins
Serum, collected after centrifugation of coagulated blood samples, was assayed for
haptoglobin (Hp) using the haemoglobin-binding assay method described by
Eckersall et al. (1999). The concentration of serum albumin-A (SAA) was
determined using a commercial ELISA kit (Tridelta Development plc, Dublin, Ireland)
according to manufacturer’s instructions.
Semi-Quantitative PCR
EDTA RNA was extracted from buffy coat stored in Qiazol Lysis Reagent (Qiagen,
Ref. 79306) for CCL11, IFN-γ, TLR-4, IL1-β and IL2 expression analysis by semi-
quantitative, real-time PCR (qPCR), as detailed in section 2.6. In brief, RNA was
extracted from Qiazol/buffy coat homogenates following an in-house standard
phenol-chloroform method (In-house method, Koh-Tan, 2015). Extracted RNA was
converted to cDNA using the TaqMan Universal Master Mix kit (Thermo Fisher,
Paisley, UK). qPCR was carried out using TaqMan Gene Expression Master Mix
assay kit (Applied Biosystems) with the extracted cDNA according to manufacturer’s
instructions. The relative quantification of each gene was calculated utilising the
comparative cycle threshold (Ct) method (2−ΔΔCt) of relative quantification (Livak and
118
Schmittgen, 2001, Steibel et al., 2009) using GAPDH as the reference gene.
Samples were compared between time-points, each animal at time-point A was its
own calibrator.
Rumen fluid collection
Rumen fluid was collected using a SELEKT pump and SELEKT collector (Nimrod).
The collector was connected to the pump, placed down the oesophagus into the
rumen and pumped into a bucket. Ruminal fluid was pumped through for several
pumps to reduce saliva contamination prior to collection. Fluid was collected into 2
x 15 ml tubes, 1 plain and 1 with 20% glycerol (cryoprotectant). Fluid was
transported on ice blocks in passive cool box (<4˚C) and stored at -20˚C before
processing for SCFA, LPS and histamine concentrations. Fluid with glycerol was
stored at -20˚C for future microbiome work.
SCFA and ethanol in reticuloruminal fluid
SCFA analysis was carried out by Sciantec Analytical Ltd. using gas
chromatography (GC) as detailed in section 2.10. Reticuloruminal fluid was tested
for the presence of ethanol, propan-1-ol, acetic acid, propionic acid, isobutyric acid,
propane-1,2-diol, butyric acid, isovaleric acid, valeric acid, hexanoic acid, heptanoic
acid and lactic acid. Any concentration < 25 mg/kg fell below the detection level of
the GC and could not be quantified. Molar concentrations of the SCFA were
obtained by dividing the measured mass of each SCFA in mg/kg by its molecular
weight: acetate - 60.05; butyrate - 88.11; propionate - 74.08; valerate - 102.13;
isobutyrate - 88.11; isovalerate - 102.13 (g/mol).
Histamine in reticuloruminal fluid
Analysis of histamine concentration in reticuloruminal fluid was carried out using the
Histamine ELISA Kit (Abnova, cat no. KA1888), designed for analysis of histamine
in human faeces, as detailed in section 2.8. Duplicate measurements were used for
all standards, controls and samples. Quantification of unknown samples was
calculated by creating standard curves of known standards and calculating from the
regression.

119
LPS in reticuloruminal fluid
Lipopolysaccharide (LPS) concentration in reticuloruminal fluid was determined
using the EndoLISA endpoint fluorescence microplate kit (Hyglos), with a Varioskan
Fluorescent microplate reader, as detailed in section 2.9. Serial dilutions were used
to plot a standard curve of log (endotoxin units or EU/ml) against log (relative
fluorescence units or RFU/ml), and the unknown concentrations calculated from the
regression.
Milk production and composition
Milk production was measured by pre-existing in-house systems (ALPRO, DeLaval)
and by National Milk Recording (NMR) at morning and afternoon milking. Milk weight
(kg) was obtained by recording the values for total volume of milk collected at the
morning and afternoon milking. For milk composition, individual cow samples were
tested for butterfat percentage (%) protein percentage (%), lactose percentage (%)
and somatic cell count (1000 cells/ml) by NMR.
Body condition scoring (BCS), liveweight (LWT) and mobility scoring
Weekly BCS, LWT change and mobility scores were recorded by one individual.
Standard BCS scoring was used (scoring 1-5 in increments of 0.5) based on the
Department for Environment, Food and Rural Affairs (DEFRA) guidelines. Cattle
were split into 5 categories – poor, moderate, good, fat, grossly fat – dependent on
the appearance and feel of their tail head, loin and overall body. Live weight was
measured using Gallagher W210 scales with Gallagher load-bars, fitted to the crush.
Mobility was scored using 4 point (0-3) scale, based on the Agriculture and
Horticulture Development Board (AHDB) mobility scoring guidelines. Cattle were
followed at their natural pace ensuring a minimum of 6-10 uninterrupted strides were
observed from the rear and side and ensuring cattle were observed turning a corner.
Abnormalities like overgrown claws, which could affect mobility, were noted. Scoring
schemes are detailed tables 4-5 and 4-6.
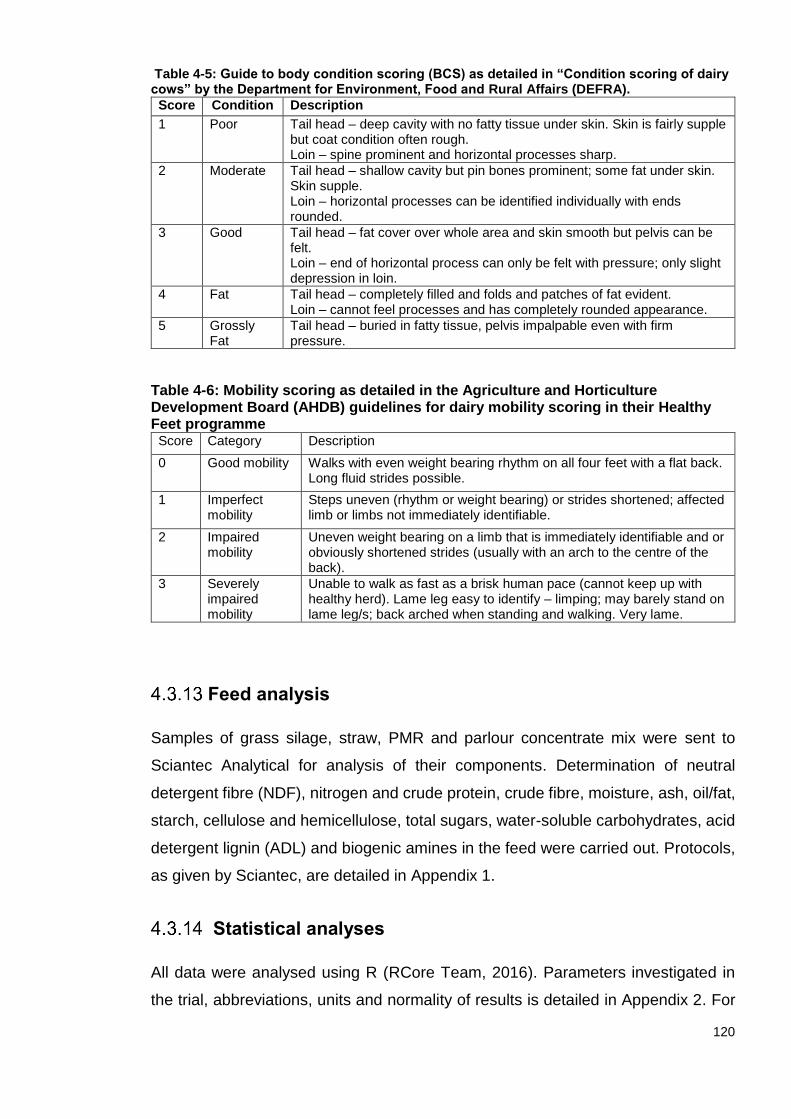
120
Table 4-5: Guide to body condition scoring (BCS) as detailed in “Condition scoring of dairy cows” by the Department for Environment, Food and Rural Affairs (DEFRA).
Score Condition Description
1 Poor Tail head – deep cavity with no fatty tissue under skin. Skin is fairly supple but coat condition often rough. Loin – spine prominent and horizontal processes sharp.
2 Moderate Tail head – shallow cavity but pin bones prominent; some fat under skin. Skin supple. Loin – horizontal processes can be identified individually with ends rounded.
3 Good Tail head – fat cover over whole area and skin smooth but pelvis can be felt. Loin – end of horizontal process can only be felt with pressure; only slight depression in loin.
4 Fat Tail head – completely filled and folds and patches of fat evident. Loin – cannot feel processes and has completely rounded appearance.
5 Grossly Fat
Tail head – buried in fatty tissue, pelvis impalpable even with firm pressure.
Table 4-6: Mobility scoring as detailed in the Agriculture and Horticulture Development Board (AHDB) guidelines for dairy mobility scoring in their Healthy Feet programme
Score Category Description
0 Good mobility Walks with even weight bearing rhythm on all four feet with a flat back. Long fluid strides possible.
1 Imperfect mobility
Steps uneven (rhythm or weight bearing) or strides shortened; affected limb or limbs not immediately identifiable.
2 Impaired mobility
Uneven weight bearing on a limb that is immediately identifiable and or obviously shortened strides (usually with an arch to the centre of the back).
3 Severely impaired mobility
Unable to walk as fast as a brisk human pace (cannot keep up with healthy herd). Lame leg easy to identify – limping; may barely stand on lame leg/s; back arched when standing and walking. Very lame.
Feed analysis
Samples of grass silage, straw, PMR and parlour concentrate mix were sent to
Sciantec Analytical for analysis of their components. Determination of neutral
detergent fibre (NDF), nitrogen and crude protein, crude fibre, moisture, ash, oil/fat,
starch, cellulose and hemicellulose, total sugars, water-soluble carbohydrates, acid
detergent lignin (ADL) and biogenic amines in the feed were carried out. Protocols,
as given by Sciantec, are detailed in Appendix 1.
Statistical analyses
All data were analysed using R (RCore Team, 2016). Parameters investigated in
the trial, abbreviations, units and normality of results is detailed in Appendix 2. For

121
each parameter, Shapiro-Wilk test, Q-Q plots and histograms were carried out to
test and visualise distributions for normality. If data were not normal (i.e. SW
p < 0.05), data were log transformed and re-tested. If normal, or transformed normal,
data were visualised in boxplots to show changes in the parameter over time-points
and between groups. Normal or near-normal data were tested using ANOVA and t-
tests (milk yield, butterfat, milk protein, milk lactose, RBC, Hb, PCV, WBC, MONO,
PLT, CHO, TGs, K+, Ca, PO4, Mg, plasma protein, albumin, acetate, butyrate,
propionate, valerate, isobutyrate, isovalerate). Data considered not normal were
tested using Kruskal-Wallis rank sum test (SCC, NEUT, LYMPH, EOS, BASO, BHB,
urea, creatinine, bilirubin, ALP, AST, GGT, GLDH, globulins, Hp,). Significance
thresholds were set at p <0.05. BCS and mobility score are ordinal, categorical
variables and should be analysed by frequency rather than as a continuous
variables. However, group sizes were not compatible with effective chi-squared
tests, so data were presented in tabular form. Changes in BCS between time-points
were assessed for each animal and classified into three categories: increase,
decrease or no change (<0, 0,>0), which were subsequently used as a categorical
variable in Kruskal-Wallis rank sum test and t-tests.
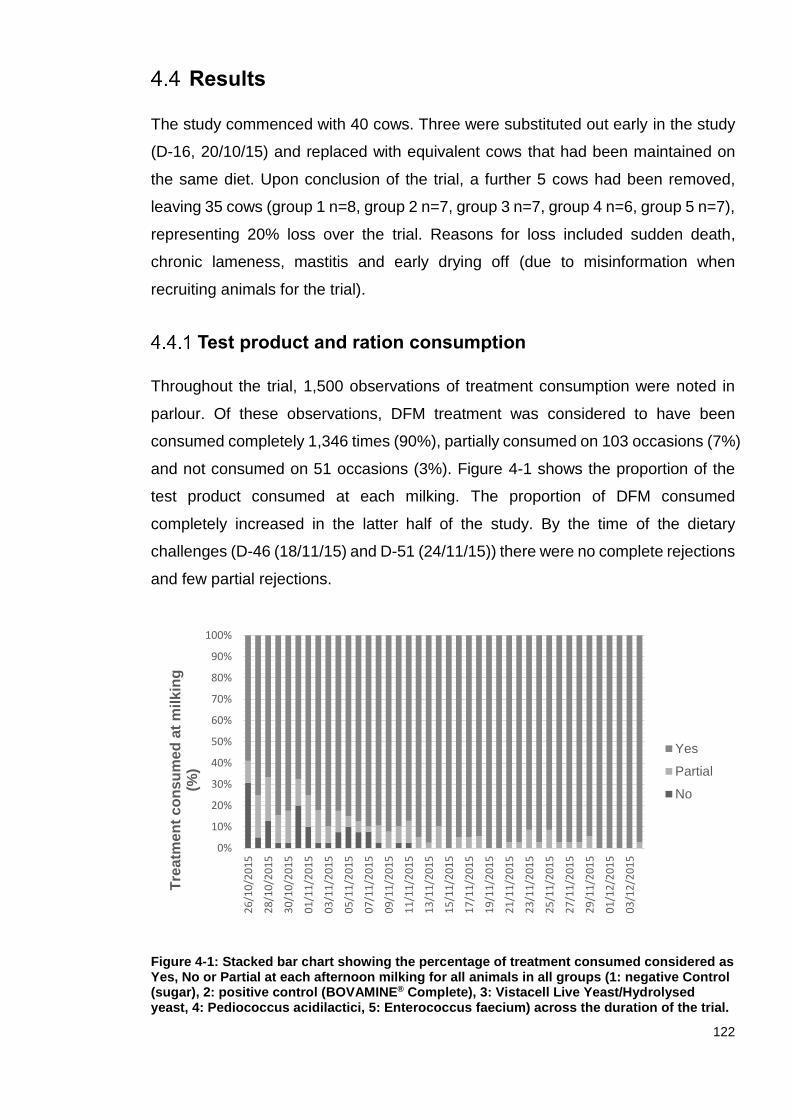
122
Results
The study commenced with 40 cows. Three were substituted out early in the study
(D-16, 20/10/15) and replaced with equivalent cows that had been maintained on
the same diet. Upon conclusion of the trial, a further 5 cows had been removed,
leaving 35 cows (group 1 n=8, group 2 n=7, group 3 n=7, group 4 n=6, group 5 n=7),
representing 20% loss over the trial. Reasons for loss included sudden death,
chronic lameness, mastitis and early drying off (due to misinformation when
recruiting animals for the trial).
Test product and ration consumption
Throughout the trial, 1,500 observations of treatment consumption were noted in
parlour. Of these observations, DFM treatment was considered to have been
consumed completely 1,346 times (90%), partially consumed on 103 occasions (7%)
and not consumed on 51 occasions (3%). Figure 4-1 shows the proportion of the
test product consumed at each milking. The proportion of DFM consumed
completely increased in the latter half of the study. By the time of the dietary
challenges (D-46 (18/11/15) and D-51 (24/11/15)) there were no complete rejections
and few partial rejections.
Figure 4-1: Stacked bar chart showing the percentage of treatment consumed considered as Yes, No or Partial at each afternoon milking for all animals in all groups (1: negative Control (sugar), 2: positive control (BOVAMINE® Complete), 3: Vistacell Live Yeast/Hydrolysed yeast, 4: Pediococcus acidilactici, 5: Enterococcus faecium) across the duration of the trial.
0%
10%
20%
30%
40%
50%
60%
70%
80%
90%
100%
26
/10
/20
15
28
/10
/20
15
30
/10
/20
15
01
/11
/20
15
03
/11
/20
15
05
/11
/20
15
07
/11
/20
15
09
/11
/20
15
11
/11
/20
15
13
/11
/20
15
15
/11
/20
15
17
/11
/20
15
19
/11
/20
15
21
/11
/20
15
23
/11
/20
15
25
/11
/20
15
27
/11
/20
15
29
/11
/20
15
01
/12
/20
15
03
/12
/20
15
Tre
atm
en
t c
on
su
me
d a
t m
ilk
ing
(%
)
Yes
Partial
No

123
The proportion of treatment consumed was higher in group 1 (negative control, 99%
eaten) and groups 4 and 5 (bacterial DFM, 99% and 95% eaten respectively) in
comparison to group 2 (positive control BOVAMINE® Complete, 80% eaten) and
group 3 (Vistacell yeast, 76% eaten), both of which contained yeasts. Difference in
consumption of treatment between groups was statistically significant (p <0.001,
table 4-7).
Table 4-7: Consumption of treatments for each group (1: negative Control (sugar), 2: positive control (BOVAMINE® Complete), 3: Vistacell Live Yeast/Hydrolysed yeast, 4: Pediococcus acidilactici, 5: Enterococcus faecium), where “Yes” refers to all of the treatment eaten, “No” to a complete refusal and “Partial” to partial consumption. The difference in consumption between groups was statistically significant (Pearson’s chi squared test on proportions of treatment eaten: Χ-squared = 152 p < 0.001).
Group Yes No Partial Sum
1: Negative control 317 2 1 320 2: Positive control 243 19 41 303 3: Vistacell Yeast 231 20 51 302 4: P. acidilactici 270 1 3 274 5: E. faecium 285 9 7 301
Reticuloruminal pH
Upon conclusion of the trial, 3 animals with boluses had been removed; 2 dried off
early (group 4) and 1 euthanased due to a dislocated shoulder (group 5). Data were
complete from all boluses from remaining groups and consisted of 156,400 readings
(6,800 readings/cow). As shown in figure 4-2, reticuloruminal pH showed a
significant diurnal pattern of variation across the trial, peaking between 04:00-05:00
h with a nadir between 16:00-17:00h (p <0.001). Daily mean pH varied across the
trial and showed a wider range of values during the period of time after the challenge
diet, shown in figure 4-3A. Daily minimum pH tended towards decline during the
challenge period, shown in figure 4-3B and standard deviation in pH values
increased, shown in figure 4-3C. Across all readings, there was a significant effect
of individual animal ID, time-point and treatment group on pH (p <0.001). Time-point
and treatment group had a significant effect on the number of observations noted
below pH 6 (p <0.001). As shown in figure 4-4, Group 2 (BOVAMINE® Complete)
showed the lowest number of instances of pH below 6.

124
Figure 4-2: Diurnal variation in mean individual cow reticuloruminal pH over all time-points and treatments. Bolus traces showed a peak at 04:00h and a nadir at 16:00h. Effect of hour of day on mean pH was significant (p <0.001).

125
Figure 4-3: (4-3A) Daily mean pH observations (4-3B) daily minimum pH observations (4-3C) Daily standard deviation in pH. Shown for individual cows across the whole trial for all groups. Red lines indicate the introduction of DFM (D-22) and introduction of CHALLENGE 1 and CHALLENGE 2 (initial and revised challenge diets, D-45 and D-51).
A
B
C

126
Figure 4-4: Sum of the observations for each group, where pH was below pH 6 across all time-points. Red lines indicate the introduction of the DFM (D-22) and introduction of CHALLENGE 1 and CHALLENGE 2 (initial and revised challenge diets, D-45 and D-51).
Body condition score (BCS)
There was no clear effect of time on BCS during the trial. As shown in table 4-8,
between time-points A and B, 14 cows lost condition (-0.5 to -2.0 BCS), 10 cows did
not change and 11 cows gained condition (0.5 to 1.5 BCS). Between time-points B
and C, 12 cows lost condition (-0.5 to -1.5 BCS), 11 cows did not change and 12
cows gained condition (0.5 to 1.5 BCS). As was expected, BCS was significantly
higher in pregnant cows (p <0.05) and those in later lactation (p <0.001).
Table 4-8: Body condition score by time-point as scored using DEFRA guidelines detailed in section 4.3.12.
Body Condition Score (BCS)
Time-point 1 1.5 2 2.5 3 3.5
A 0 1 6 20 5 3
B 0 1 6 20 5 3
C 1 2 8 14 8 2
Mobility score
There was no clear effect of time on mobility score during the trial. As shown in table
4-9, between time-points A and B, 10 cows decreased mobility score (improved
mobility), 16 did not change, and 9 cows increased mobility score (impaired mobility).
An equal number of cows increased, decreased or remained the same from time-
point B to time-point C as from A to B.
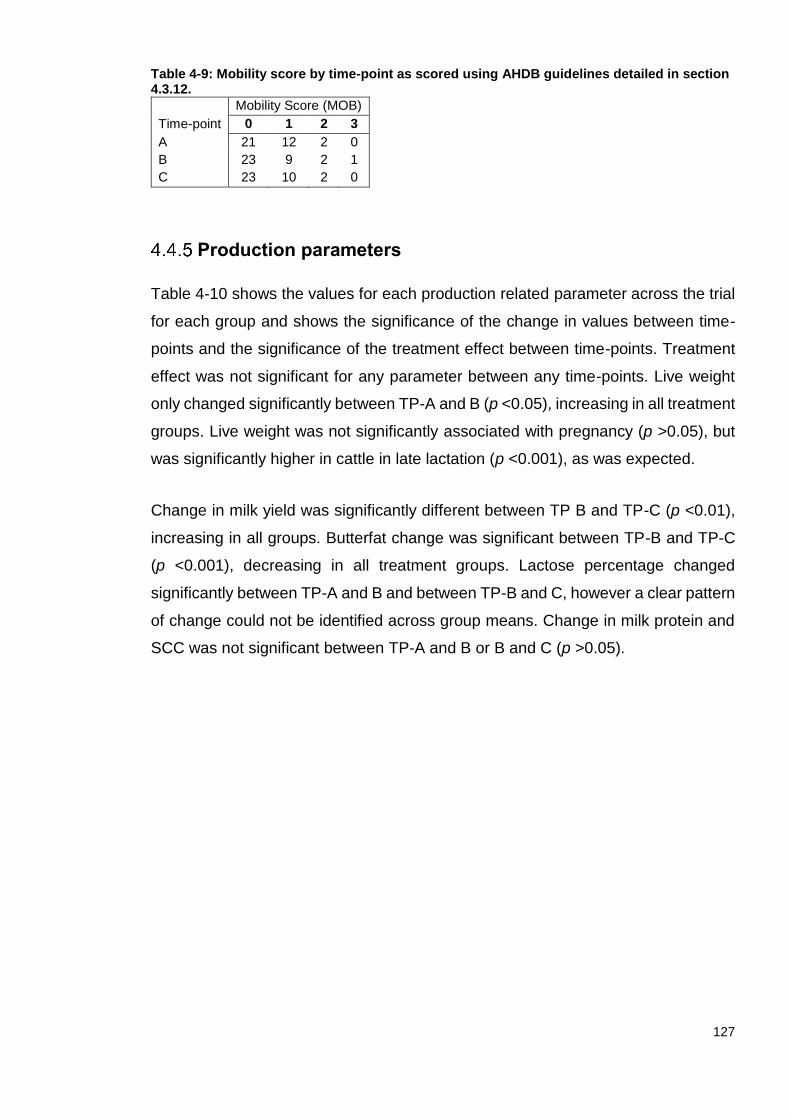
127
Table 4-9: Mobility score by time-point as scored using AHDB guidelines detailed in section 4.3.12.
Mobility Score (MOB)
Time-point 0 1 2 3
A 21 12 2 0
B 23 9 2 1
C 23 10 2 0
Production parameters
Table 4-10 shows the values for each production related parameter across the trial
for each group and shows the significance of the change in values between time-
points and the significance of the treatment effect between time-points. Treatment
effect was not significant for any parameter between any time-points. Live weight
only changed significantly between TP-A and B (p <0.05), increasing in all treatment
groups. Live weight was not significantly associated with pregnancy (p >0.05), but
was significantly higher in cattle in late lactation (p <0.001), as was expected.
Change in milk yield was significantly different between TP B and TP-C (p <0.01),
increasing in all groups. Butterfat change was significant between TP-B and TP-C
(p <0.001), decreasing in all treatment groups. Lactose percentage changed
significantly between TP-A and B and between TP-B and C, however a clear pattern
of change could not be identified across group means. Change in milk protein and
SCC was not significant between TP-A and B or B and C (p >0.05).

128
Table 4-10: Mean (above, for each variable) and median (below for each variable) values for selected production-related variables for each time-point and treatment group.
Time effects are expressed here as the p-value of single-sample t-tests on normally distributed variables or Kruskal-Wallis rank sum tests for non-normally distributed variables applied to the individual animal differences for each variable from time-points A to B and B to C. Treatment effect is expressed here as the p-value estimated from either a one-way analysis of variance of the normally distributed individual animal differences with treatment as the factor, or a Kruskal-Wallis rank sum test applied to non-normally distributed individual animal differences from time-points A to B and B to C. Variables analysed by Kruskal-Wallis rank sum test = liveweight, milk yield, milk protein, milk somatic cell count.
TP -> A B C Time Effect Treatment Effect
Treatment -> 1 2 3 4 5 1 2 3 4 5 1 2 3 4 5 AB BC AB BC
Liveweight (kg) 681 679 681 693 687 686 684 691 702 695 688 686 683 710 690 0.015 0.94 0.97 0.43
median 703 688 668 704 696 710 692 684 708 706 703 686 668 713 692
Milk yield (kg/d) 36.61 35.80 34.26 33.68 35.24 27.48 33.92 32.73 36.50 34.07 39.63 40.33 34.59 38.43 35.26 0.11 0.0025 0.45 0.10
median 32.90 35.05 31.30 33.80 33.60 31.20 29.60 31.10 35.90 37.40 38.40 36.20 35.40 36.20 36.30
Butterfat (%) 4.37 4.74 4.25 4.03 4.28 4.22 4.33 3.84 4.09 4.07 3.78 3.94 3.54 3.74 3.65 0.12 0.00096 0.90 0.99
median 4.39 4.92 4.14 3.89 4.43 4.26 4.53 3.79 4.03 3.98 3.44 3.97 3.41 3.66 3.43
Protein (%) 3.28 3.27 3.24 3.19 3.23 3.28 3.13 3.36 3.35 3.15 3.23 3.25 3.26 2.91 3.30 0.90 0.38 0.49 0.097
median 3.29 3.30 3.19 3.19 3.30 3.28 3.07 3.26 3.29 3.10 3.23 3.20 3.30 3.03 3.29
Lactose (%) 4.54 4.60 4.56 4.51 4.51 4.62 4.57 4.57 4.56 4.54 4.61 4.63 4.54 4.62 4.54 0.038 0.0091 0.33 0.48
median 4.60 4.57 4.63 4.55 4.51 4.65 4.55 4.66 4.53 4.51 4.62 4.66 4.61 4.65 4.54
SCC (×1000/ml) 37.25 59.43 61.14 107.60 76.14 48.63 56.83 144.71 78.83 48.14 21.25 52.71 78.00 48.67 74.86 0.38 0.20 0.087 0.40
median 33.50 40.00 25.00 63.00 63.00 30.00 40.50 50.00 38.00 36.00 20.00 26.00 23.00 19.00 42.00
129
Biochemistry, haematology and acute phase proteins
As shown in tables 4-11 and 4-12, the majority of biochemistry, haematology and
acute phase protein parameters were significantly affected by time-point as a factor,
and showed a significant change between time-points but no parameters were
significantly affected by treatment effect. Many parameters showed similar patterns
of change between time-points. Cholesterol increased significantly in all groups
between TP-A and TP-B. Triglycerides (TGs) increased significantly between TP-A
and TP-B and decreased significantly between TP-B and TP-C, as did calcium. βHB,
albumin and creatinine also decreased significantly between TP-B and TP-C.
Conversely, globulins and urea significantly decreased between TP-A and TP-B and
significantly increased between TP-B and TP-C. AST and haptoglobin followed a
similar response, decreasing significantly between TP-A and TP-B. Magnesium,
GLDH and SAA also increased significantly between TP-B and TP-C.
As with biochemistry parameters, the vast majority of haematological parameters
were significantly affected by time-point as a factor and significantly changed
between time-points A and B and B and C. No haematological parameters were
affected by treatment between time-points. Red cell count, WBC and lymphocyte
count decreased significantly between TP-A and TP-B then increased significantly
between TP-B and TP-C. Neutrophil count decreased significantly between TP-A
and TP-B and monocyte count increased significantly between TP-B and TP-C.

130
Table 4-11 Mean (above, for each variable) and median (below for each variable) values for selected plasma biochemical variables for each time-point and treatment group.
Time effects are expressed here as the p-value of single-sample t-tests on normally distributed variables or Kruskal-Wallis rank sum tests for non-normally distributed variables applied to the individual animal differences for each variable from time-points A to B and B to C. Treatment effect is expressed here as the p-value estimated from either a one-way analysis of variance of the normally distributed individual animal differences with treatment as the factor, or a Kruskal-Wallis rank sum test applied to non-normally distributed individual animal differences from time-points A to B and B to C. Variables analysed by Kruskal-Wallis rank sum test = Ca, ALP, AST, GGT, GLDH, globulin, Hp, SAA, urea, creatinine Time-point A B C Time Effect Treatment
Effect
Treatment 1 2 3 4 5 1 2 3 4 5 1 2 3 4 5 AB BC AB BC
Cholesterol (mmol/l)
5.59 5.43 5.92 5.00 6.13 6.60 6.40 6.97 7.09 6.67 7.13 7.08 6.82 6.75 7.68 0.0035 0.24 0.77 0.642
median 6.23 5.03 5.98 4.93 6.35 6.98 5.61 6.53 7.59 6.33 7.40 7.02 6.60 6.58 8.23
Triglycerides (mmol/l)
0.10 0.09 0.11 0.08 0.12 0.14 0.15 0.16 0.14 0.14 0.09 0.09 0.09 0.08 0.10 <0.0001 <0.0001 0.63 0.83
median 0.10 0.09 0.11 0.08 0.11 0.14 0.14 0.15 0.15 0.14 0.09 0.09 0.09 0.09 0.11
BHB (mmol/l)
0.84 0.80 0.63 0.70 0.60 0.69 0.64 0.56 0.57 0.74 0.45 0.56 0.57 0.53 0.43 0.10 0.0095 0.16 0.18
median 0.90 0.80 0.60 0.70 0.50 0.75 0.60 0.60 0.60 0.80 0.40 0.50 0.50 0.40 0.40
Ca (mmol/l) 2.28 2.32 2.29 2.26 2.35 2.40 2.42 2.40 2.43 2.40 2.36 2.34 2.32 2.34 2.33 <0.0001 <0.0001 0.58 0.84
median 2.27 2.37 2.31 2.22 2.38 2.42 2.44 2.41 2.46 2.35 2.39 2.32 2.32 2.31 2.31
Mg (mmol/l) 1.07 1.00 1.10 0.98 1.05 1.05 0.98 1.10 1.00 1.04 1.08 1.09 1.13 1.05 1.08 0.50 0.0012 0.87 0.57
median 1.04 1.00 1.13 0.99 1.04 1.04 0.96 1.12 1.01 1.04 1.08 1.01 1.12 1.07 1.11
Bilirubin (mmol/l)
8.38 7.43 8.71 7.50 10.14 8.13 8.71 7.29 7.17 8.57 8.25 8.29 6.71 7.50 9.00 0.29 0.95 0.22 0.95
median 9.00 7.00 11.00 7.00 11.00 8.00 7.00 7.00 7.00 9.00 7.00 8.00 7.00 7.00 9.00
ALP (U/l) 76.38 82.29 85.71 78.33 99.14 71.75 84.43 80.71 93.00 95.57 83.50 92.43 87.14 94.83 113.71 0.81 0.21 0.67 0.24
median 68.50 66.00 85.00 77.00 83.00 71.00 79.00 77.00 71.50 88.00 81.50 86.00 76.00 78.00 107.00
AST (U/l) 66.38 77.14 74.71 90.33 92.71 58.88 65.57 59.00 68.33 65.14 64.50 69.14 69.86 69.67 73.43 <0.0001 0.051 0.32 0.69
median 69.50 73.00 76.00 84.50 70.00 57.00 60.00 56.00 63.50 60.00 66.00 66.00 60.00 71.00 75.00
GGT (U/l) 20.25 23.00 20.57 17.83 21.43 22.25 21.43 21.14 24.33 22.14 19.88 17.86 18.86 25.00 15.00 0.58 0.10 0.98 0.65
median 18.50 19.00 21.00 15.50 21.00 21.50 25.00 18.00 19.00 20.00 19.00 17.00 19.00 14.00 15.00
GLDH (U/l) 14.63 13.43 14.71 18.83 28.29 16.75 24.00 20.14 27.17 18.86 23.50 48.57 43.14 23.83 32.14 0.21 0.0097 0.34 0.25
median 13.50 11.00 12.00 12.50 17.00 16.00 17.00 14.00 11.50 17.00 20.00 23.00 22.00 18.50 24.00
Globulin (g/l)
33.75 36.00 33.00 36.17 34.29 29.50 31.00 28.71 33.33 29.86 36.75 38.14 37.43 39.67 38.00 <0.0001 <0.0001 0.93 0.65
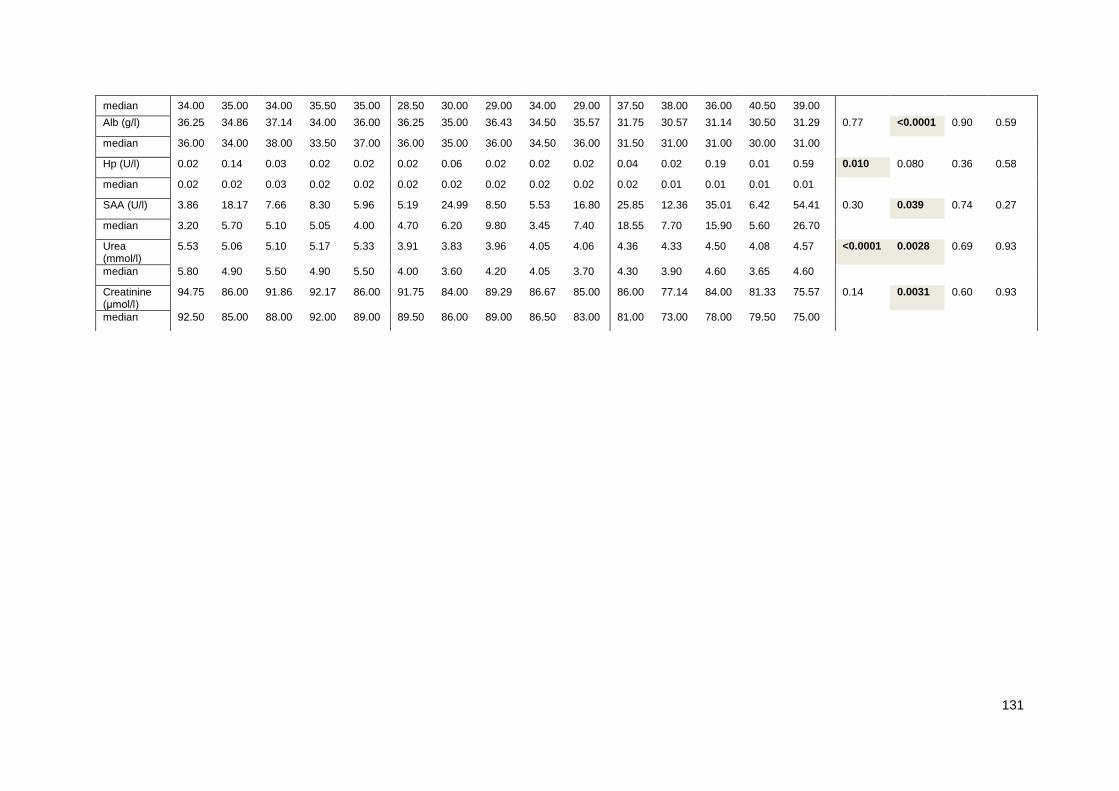
131
median 34.00 35.00 34.00 35.50 35.00 28.50 30.00 29.00 34.00 29.00 37.50 38.00 36.00 40.50 39.00
Alb (g/l) 36.25 34.86 37.14 34.00 36.00 36.25 35.00 36.43 34.50 35.57 31.75 30.57 31.14 30.50 31.29 0.77 <0.0001 0.90 0.59
median 36.00 34.00 38.00 33.50 37.00 36.00 35.00 36.00 34.50 36.00 31.50 31.00 31.00 30.00 31.00
Hp (U/l) 0.02 0.14 0.03 0.02 0.02 0.02 0.06 0.02 0.02 0.02 0.04 0.02 0.19 0.01 0.59 0.010 0.080 0.36 0.58
median 0.02 0.02 0.03 0.02 0.02 0.02 0.02 0.02 0.02 0.02 0.02 0.01 0.01 0.01 0.01
SAA (U/l) 3.86 18.17 7.66 8.30 5.96 5.19 24.99 8.50 5.53 16.80 25.85 12.36 35.01 6.42 54.41 0.30 0.039 0.74 0.27
median 3.20 5.70 5.10 5.05 4.00 4.70 6.20 9.80 3.45 7.40 18.55 7.70 15.90 5.60 26.70
Urea (mmol/l)
5.53 5.06 5.10 5.17 5.33 3.91 3.83 3.96 4.05 4.06 4.36 4.33 4.50 4.08 4.57 <0.0001 0.0028 0.69 0.93
median 5.80 4.90 5.50 4.90 5.50 4.00 3.60 4.20 4.05 3.70 4.30 3.90 4.60 3.65 4.60
Creatinine (μmol/l)
94.75 86.00 91.86 92.17 86.00 91.75 84.00 89.29 86.67 85.00 86.00 77.14 84.00 81.33 75.57 0.14 0.0031 0.60 0.93
median 92.50 85.00 88.00 92.00 89.00 89.50 86.00 89.00 86.50 83.00 81.00 73.00 78.00 79.50 75.00
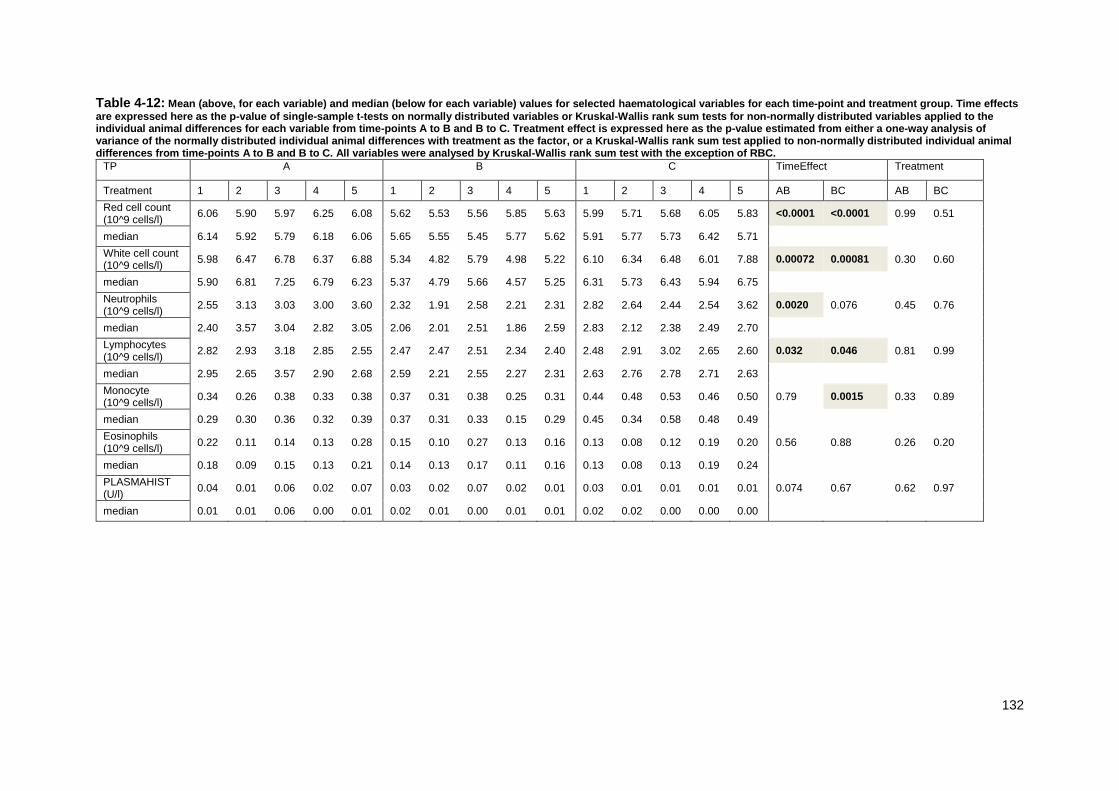
132
Table 4-12: Mean (above, for each variable) and median (below for each variable) values for selected haematological variables for each time-point and treatment group. Time effects
are expressed here as the p-value of single-sample t-tests on normally distributed variables or Kruskal-Wallis rank sum tests for non-normally distributed variables applied to the individual animal differences for each variable from time-points A to B and B to C. Treatment effect is expressed here as the p-value estimated from either a one-way analysis of variance of the normally distributed individual animal differences with treatment as the factor, or a Kruskal-Wallis rank sum test applied to non-normally distributed individual animal differences from time-points A to B and B to C. All variables were analysed by Kruskal-Wallis rank sum test with the exception of RBC.
TP A B C TimeEffect Treatment
Treatment 1 2 3 4 5 1 2 3 4 5 1 2 3 4 5 AB BC AB BC
Red cell count (10^9 cells/l)
6.06 5.90 5.97 6.25 6.08 5.62 5.53 5.56 5.85 5.63 5.99 5.71 5.68 6.05 5.83 <0.0001 <0.0001 0.99 0.51
median 6.14 5.92 5.79 6.18 6.06 5.65 5.55 5.45 5.77 5.62 5.91 5.77 5.73 6.42 5.71
White cell count (10^9 cells/l)
5.98 6.47 6.78 6.37 6.88 5.34 4.82 5.79 4.98 5.22 6.10 6.34 6.48 6.01 7.88 0.00072 0.00081 0.30 0.60
median 5.90 6.81 7.25 6.79 6.23 5.37 4.79 5.66 4.57 5.25 6.31 5.73 6.43 5.94 6.75
Neutrophils (10^9 cells/l)
2.55 3.13 3.03 3.00 3.60 2.32 1.91 2.58 2.21 2.31 2.82 2.64 2.44 2.54 3.62 0.0020 0.076 0.45 0.76
median 2.40 3.57 3.04 2.82 3.05 2.06 2.01 2.51 1.86 2.59 2.83 2.12 2.38 2.49 2.70
Lymphocytes (10^9 cells/l)
2.82 2.93 3.18 2.85 2.55 2.47 2.47 2.51 2.34 2.40 2.48 2.91 3.02 2.65 2.60 0.032 0.046 0.81 0.99
median 2.95 2.65 3.57 2.90 2.68 2.59 2.21 2.55 2.27 2.31 2.63 2.76 2.78 2.71 2.63
Monocyte (10^9 cells/l)
0.34 0.26 0.38 0.33 0.38 0.37 0.31 0.38 0.25 0.31 0.44 0.48 0.53 0.46 0.50 0.79 0.0015 0.33 0.89
median 0.29 0.30 0.36 0.32 0.39 0.37 0.31 0.33 0.15 0.29 0.45 0.34 0.58 0.48 0.49
Eosinophils (10^9 cells/l)
0.22 0.11 0.14 0.13 0.28 0.15 0.10 0.27 0.13 0.16 0.13 0.08 0.12 0.19 0.20 0.56 0.88 0.26 0.20
median 0.18 0.09 0.15 0.13 0.21 0.14 0.13 0.17 0.11 0.16 0.13 0.08 0.13 0.19 0.24
PLASMAHIST (U/l)
0.04 0.01 0.06 0.02 0.07 0.03 0.02 0.07 0.02 0.01 0.03 0.01 0.01 0.01 0.01 0.074 0.67 0.62 0.97
median 0.01 0.01 0.06 0.00 0.01 0.02 0.01 0.00 0.01 0.01 0.02 0.02 0.00 0.00 0.00

133
Reticuloruminal SCFA
As shown in table 4-13, all SCFA, with the exception of propionate, decreased
following the introduction of DFM, though change was only significant between TP-
A and TP-B for butyrate, total SCFA, valerate, isovalerate and isobutyrate. Following
introduction of the challenge (change between B and C), change was significant for
butyrate, acetate and total SCFA, again showing a mean decrease in the majority
of groups. Only the minor SCFA, isovalerate increased significantly between TP-B
and TP-C.
Histamine concentrations
It was not possible to consistently obtain repeatable measurements of histamine in
EDTA plasma and thus data were not analysed. Measurement of histamine
concentration in reticuloruminal fluid showed consistent and repeatable results.
Histamine concentration was significantly affected by time-point as a factor
(p <0.001) and change in histamine concentration was significant between TP-A
and TP-B showing a decrease in the mean. There was no significant effect of
treatment on the change in reticuloruminal histamine between any time-points or for
all time-points combined, as shown in table 4-13.
Lipopolysaccharide (LPS) concentration
As shown in table 4-13, reticuloruminal PS concentration was significantly affected
by time-point as a factor (p <0.001) and change in LPS concentration was significant
between TP-A and TP-B showing an increase in the mean across all groups. There
was no significant effect of treatment on the change in LPS concentration between
any time-points or for all time-points combined (p >0.05).

134
Table 4-13: Mean (above, for each variable) and median (below, for each variable) values for concentrations of selected compounds in ruminal fluid for each time-point and treatment group. Time effects are expressed as the p-value of single-sample t-tests on normally distributed variables or Kruskal-Wallis rank sum tests for non-normally distributed variables applied to the individual animal differences for each variable from time-points A to B and B to C. Treatment effect is expressed as the p-value estimated from either a one-way analysis of variance of the normally distributed individual animal differences with treatment as the factor, or a Kruskal-Wallis rank sum test applied to non-normally distributed individual animal differences from time-points A to B and B to C. Variables analysed by Kruskal-Wallis rank sum test = acetate, rumen fluid LPS, rumen fluid histamine.
TP A B C Time Effect Treatment Effect
Treatment 1 2 3 4 5 1 2 3 4 5 1 2 3 4 5 AB BC AB BC
Butyrate (mmol/l) 10.39
10.47
9.69 9.82 9.15 8.41 9.32 9.07 8.04 8.86 6.44 7.26 7.52 7.38 6.01 0.0014
<0.0001
0.46 0.49
median 10.83
9.68 10.10
9.73 9.17 8.47 9.26 9.15 7.93 9.07 5.97 7.37 7.58 6.50 4.98
Acetate (mmol/l) 61.59
59.57
59.38
59.62
54.43
54.00 55.18 55.11 50.61 53.21 45.22 44.68 46.84 46.28 40.59 0.064 <0.0001
0.86 0.67
median 62.32
59.93
59.57
58.26
55.24
55.00 57.47 53.76 50.68 55.60 42.23 42.11 44.86 45.65 38.03
Propionate (mmol/l) 19.84
17.85
20.59
18.60
16.18
17.60 18.52 16.84 14.50 16.89 18.90 18.43 17.62 19.68 14.85 0.13 0.37 0.48 0.29
median 21.73
16.68
19.51
18.21
15.27
16.21 18.45 17.49 14.98 17.05 18.45 18.71 15.67 20.30 14.61
Total SCFA (mmol/l) 96.03
91.72
93.47
91.70
82.80
82.84 86.42 84.08 75.79 81.91 73.73 73.68 75.30 76.65 64.32 0.022 0.0025
0.75 0.46
median 97.85
91.38
92.22
88.99
87.45
80.99 93.59 79.14 76.85 89.50 70.76 71.65 71.45 78.29 58.81
Valerate (mmol/l) 1.55 1.43 1.45 1.37 1.15 1.00 1.31 1.17 0.95 1.07 1.17 1.21 1.29 1.21 0.99 0.00039
0.36 0.21 0.54
median 1.58 1.35 1.44 1.33 1.25 0.96 1.34 1.16 0.97 1.14 1.11 1.28 1.17 1.24 1.03
Isovalerate (mmol/l) 1.79 1.51 1.54 1.50 1.22 1.19 1.39 1.24 1.10 1.28 1.36 1.47 1.40 1.48 1.30 0.0060
0.038 0.19 0.66
median 1.77 1.40 1.60 1.41 1.10 1.19 1.42 1.15 1.05 1.24 1.29 1.45 1.23 1.37 1.31
Isobutyrate (mmol/l) 0.88 0.88 0.83 0.79 0.67 0.65 0.67 0.65 0.59 0.60 0.65 0.64 0.64 0.62 0.57 <0.0001
0.62 0.40 0.83
median 0.90 0.89 0.83 0.77 0.68 0.64 0.72 0.65 0.58 0.59 0.62 0.70 0.62 0.62 0.54
Rumen Fluid LPS (U/l) 32000
2800
2800
55000
46000
250000
960000
370000
670000
530000
400000
400000
730000
1200000
960000
<0.0001
0.98 0.54 0.60
median 2700 1200
3300
2200 2800 290000
460000
270000
280000
390000
66000
240000
110000
600000
410000
Rumen Fluid Histamine (U/l)
2700 2100
3100
3000 130 100 240 130 120 380 390 1500 840 180 160 0.0039
0.45 0.23 0.69
median 1200 210 160 1000 120 77 180 110 81 110 140 110 92 210 110
135
Gene expression
As shown in table 4-14, there was no significant effect of treatment group on the
gene expression level between any time-point, or when considering time-point as a
factor. Expression levels varied between genes and with the different housekeeping
genes. For TLR4, correlation between the relative expression values derived from
the 2 house-keeping genes GAPDH and β-actin was very low (-0.015) and the
directions of change at each time-point conflicted. Change in TLR4 with bAct was
significant between both TP-A and TP-B and TP-B and TP-C, with expression levels
increasing and decreasing respectively. When considered with GAPDH as the
housekeeping gene, change in expression level was significant between TP-A and
TP-B and showed a decrease. Change in IL1-β was significant between time-points
A and B and B and C when derived from both housekeeping genes. IL1-β relative
expression response varied between time-points A and B with each housekeeping
gene but showed a significant and large increase between time-points B and C when
derived from both housekeeping genes. Change in IFN-γ relative expression
between TP-A and TP-B and between TP-B and TP-C was significant when
considered with GAPDH as the housekeeping gene, and expression levels
decreased then increased respectively.

136
Table 4-14: Mean (above, for each variable) and median (below for each variable) values for relative gene expression for each time-point and treatment group. Values are
expressed as the expression of each gene relative to the house-keeping gene used (ie GAP-DH or β-actin). Time effects are expressed here as the p-value of single-sample t-tests on normally distributed variables or Kruskal-Wallis rank sum tests for non-normally distributed variables applied to the individual animal differences for each variable from time-points A to B and B to C. Treatment effect is expressed here as the p-value estimated from either a one-way analysis of variance of the normally distributed individual animal differences with treatment as the factor, or a Kruskal-Wallis rank sum test applied to non-normally distributed individual animal differences from time-points A to B and B to C. All variables were analysed by Kruskal-Wallis rank sum test.
TP A B C Time Effect Treatment Effect
Treatment 1 2 3 4 5 1 2 3 4 5 1 2 3 4 5 AB BC AB BC
TLR4bAct 2.29 1.29 4.71 0.73 0.48 3.16 3.67 3.22 2.24 2.77 1.18 5.07 0.88 1.38 2.32 0.0014 0.0056 0.63 0.83
median 1.04 0.66 1.03 0.63 0.50 1.83 1.61 2.21 2.38 1.58 1.12 1.06 0.41 0.66 1.74
TLR4GAP 1.94 1.04 1.25 1.48 0.92 0.46 0.32 0.26 0.11 0.16 0.84 0.95 0.35 1.03 0.86 <0.0001 0.0001 0.40 0.66
median 1.44 0.67 1.07 1.08 0.97 0.21 0.18 0.15 0.04 0.07 0.48 0.54 0.30 0.78 0.62
IL1bbAct 4.56 7.40 5.14 48.48 2.26 9.85 4.32 12.78 4.14 10.59 67.73 213.38 23.09 334.28 46.93 0.00020 0.0065 0.46 0.32
median 0.77 0.54 1.31 0.56 1.15 6.05 2.85 2.41 3.92 6.80 8.50 29.26 7.85 238.79 26.14
IL1bGAP 4.77 10.38 1.33 48.38 5.13 6.06 0.95 5.89 0.29 2.26 180.74 844.51 19.92 1101.86 23.09 0.053 0.00019 0.30 0.36
median 2.03 0.13 1.72 1.83 2.01 0.59 0.20 0.28 0.13 0.25 4.38 24.75 10.82 238.11 7.25
IFNgbAct 0.78 1.55 4.96 1.61 0.52 13.73 0.86 1.20 2.11 2.22 1.12 1.06 0.45 6.36 0.70 1.0 0.16 0.19 0.59
median 0.70 1.70 0.40 1.41 0.39 0.68 0.71 0.34 0.71 1.38 0.61 0.36 0.27 1.36 0.52
IFNgGAP 2.01 1.08 2.37 3.37 1.19 0.27 0.22 0.07 0.06 0.09 0.34 0.45 0.45 3.55 0.24 <0.0001 0.0049 0.47 0.087
median 0.68 0.85 0.61 2.12 0.46 0.09 0.16 0.06 0.03 0.08 0.31 0.17 0.13 0.93 0.13

137
Discussion
In this study, the administration of a challenge diet, higher in starch and lower in
NDF than the diet to which the animals were accustomed, resulted in a substantial
increase in production performance in the face of a systemic inflammatory response.
Following introduction of the challenge diet, the changes in WBC, monocyte count,
lymphocyte count and RBC were significant and all increased. Additionally, positive
acute phase proteins, haptoglobin and SAA, and the relative expression levels of
IL1-β also increased following the challenge diet. An increase in these variables has
been associated with an inflammatory response. For example, an increase in
monocyte count has previously been shown to be associated with an increase in
pro-inflammatory cytokine expression ( Pomeroy et al., 2017), which is thought to
occur as a result of decreased reticuloruminal pH, leading to translocation of LPS of
ruminal bacterial origin ( Pomeroy et al., 2017). Additonally, Hp levels have been
shown to increase with ruminal acidosis in dairy cattle (Mount et al., 2009), sheep
(Minato et al., 1992) and goats (Mertens, 1994).
In addition to investigating circulating gene expression levels in the PBMC in this
study, relative expressions of inflammatory genes was investigated in the rumen
epithelial tissue in chapters 3 and 5, and they were shown to increase in response
to a challenge. IL1β is a pro-inflammatory cytokine that plays an important role in
acute and chronic inflammation (Ren & Torres 2009). After the introduction of the
DFM, IL1β expression changed significantly between time-points A and B and B and
C but the pattern of change was not clear. However, following the challenge diet,
the change in expression was significant and relative expression derived from both
housekeeping genes showed a significant increase, suggesting an inflammatory
effect of the challenge diet and fitting with the inflammatory response noted in the
biochemistry. TLR4 is a toll-like receptor responsible for activating the innate
immune system and it recognises LPS via a high specificity for the lipid-A portion of
LPS (Kim et al. 2007). If the rumen epithelial barrier is affected by dietary induced
pH change, LPS of ruminal bacterial origin may be released into circulation.
Therefore, increased TLR4 expression in circulating blood can indicate initiation of
innate responses due to the presence of LPS. In this study, TLR4 results were
difficult to interpret, the correlation between the relative expression values derived
from the 2 house-keeping genes GAPDH and β-actin was very low (-0.015) and the
138
directions of change at each time-point conflicted, suggesting that the treatment
affected the expression of at least 1 of the house-keeping genes. As with TLR4,
IFNγ relative expression results were difficult to interpret as the 2 housekeeping
genes resulted in differing results, though results tended to suggest an increase in
relative expression following the challenge diet.
The increase in variables associated with inflammation preceded and were more
pronounced that those changes observed in variables commonly monitored as a
symptom of reticuloruminal acidosis, such as reticuloruminal pH. Although the
response was less pronounced, pH was significantly different between time-points.
The introduction of the challenge ration resulted in no change to the mean pH, but
an increase in the range of pH values observed. Daily mean pH showed a wide
range of values, which narrowed during the treatment period and widened during
the challenge diet, suggesting that the treatments were buffering the reticuloruminal
pH as intended. Daily minimum pH decreased during the challenge, particularly after
the second dietary challenge, suggesting that the diet was providing a challenge to
the rumen function as intended. The challenge ration did not affect mean or median
reticuloruminal pH values but did increase the number of observations below pH 6.0
and increased the range of pH values noted. However, as there were few pH
observations below 5.5, it is unlikely that the herd would have been classified as
affected by SARA according to classical definitions. This lack of effect on mean pH
suggests that the challenge diet was not severe enough to induce SARA in the
majority of animals, but was having an overall negative effect on rumen function. It
is also suggestive of the variation between animals, with the wider range of values
observed showing some animals were more affected by the diet and showed a
larger pH decrease than others. There was also a significant effect of animal ID,
again reflecting the individual animal variation in reticuloruminal pH. Reticuloruminal
pH showed a significant diurnal pattern previously described in cattle (Mani et al.,
2012, Mandebvu and Galbraith, 1999), with a peak at 04:00-05:00h and a nadir at
16:00-17:00h. It is hypothesised that the reason for this diurnal cycle is the period
at night with a high rate of rumination combined with reduced feeding, likely
increasing saliva production and allowing removal of SCFA from the rumen
(Denwood et al., 2018). Denwood et al. (2018) suggest an alternative method of
analysing pH variation using the absolute deviation from an individual cow model,
consisting of a double or single sine wave (representing diurnal cycles with or
139
without an additional cycle for milking frequency) fitted iteratively to a generalized
additive mode. They found that this approach enabled the identification of periods
when milk yield was depressed, whereas periods of depression of pH below any
arbitrary pH threshold was not effective. The relative lack of a reticuloruminal pH
response to the challenge diet contrasts markedly with the clear evidence of mild
systemic inflammation in response to the challenge diet.
Despite the presence of indicators of an inflammatory syndrome being apparent in
the cattle, production parameters and energy balance increased following the
introduction of the challenge diet. Energy metabolism variables, plasma triglycerides
(TGs) and β-hydroxybutyrate (βHB), both changed significantly with the challenge
diet, both showing a decrease. This decrease in energy metabolism variables was
expected, as the challenge diet was high in energy, leading to improved energy
balance and a decrease in these variables reflects this (Doepel et al., 2002, Butler
et al., 2006).This improved energy balance was reflected in the increased milk yield
noted following the challenge diet. An increase in milk yield when cattle are fed DFM
has previously been shown (McLeay and Smith, 2006) but milk yield has previously
been shown to decrease in animals induced with SARA (Lan et al., 2008), again
suggestive that the challenge was not as severe as intended. Although milk yield
increased, milk fat percentage change was significant following the challenge and
showed a decrease. As with milk yield, decreased milk fat has been previously
associated with SARA (Nocek, 1997), although a decrease in milk fat in conjunction
with ruminal acidosis is not always observed (Lardner, 2001). Milk lactose
concentration changed significantly following introduction of DFM and following the
challenge diet, though a clear pattern of change could not be observed. Increased
lactose percentage has been observed in experimentally induced ruminal acidosis.
(Lardner, 2001). BCS and mobility score were not significantly affected by time-point
or treatment and did not show a clear pattern of change throughout the trial. Live
weight significantly increased following introduction of the DFM, but as treatment
did not have a significant effect on the liveweight change it is thought that this
increase may be partly due to the increased consistency of diets over time after the
trial commencement.
Reticuloruminal SCFA varied significantly with time-point but did not follow the
pattern expected from the literature. Following the challenge diet, the change in the
140
concentrations of 2 of the main SCFA produced in the rumen (Penner et al., 2009b),
acetic and butyric acid, was significantly different, with both decreasing. In
comparison with this, Stefańska et al. (1999) found that in animals from acidotic
farms, higher concentrations of acetate, propionate, n-butyrate, n-valerate were
noted. In another study Martin et al. (2005) found that in “SARA-positive” cows,
fermentation results in more butyrate than propionate production, again something
not seen in our results; the percentage contribution of butyrate decreased
significantly after the challenge diet was introduced and the propionate percentage
contribution increased. Change in total SCFA concentration was significant
following introduction of the DFM and the challenge diet, decreasing with DFM
introduction and again with the challenge diet. This decrease following the challenge
diet was initially unexpected, not following the expected increase in SCFA due to
rapid fermentation of carbohydrates and corresponding SCFA accumulation
detailed in literature. However, this decrease was observed in both trials described
in chapters 3 and 5 and a similar reduction in total SCFA concentrations during a
challenge diet has also been noted in sheep following induction of ruminal acidosis
(Liu et al., 2015). It is hypothesised that this decrease is a consequence of
adaptation, leading to increased rates of SCFA absorption or decreased microbial
activity (Liu et al., 2015). The decrease in SCFA in this trial could not be compared
to levels of sodium-hydrogen antiporter gene (NHE3) as was done in chapters 3 and
5 to confirm the hypothesis that decreased SCFA were due to increased absorption.
Although not directly responsible, increased NHE3 has been associated with
increased SCFA absorption. It is thought that this positive correlation occurs as a
result of cell proliferation in the rumen epithelium increasing sites for NHE3, thus
causing an increase in expression and as a result of the proliferation, increasing
surface area for absorption of SCFA. As NHE3 is expressed only in rumen tissue,
variation in its expression could therefore not be detected in this trial through plasma
gene expression levels. Minor SCFA, valerate, isovalerate and isobutyrate followed
a similar response pattern to the total SCFA and acetate and butyrate, decreasing
following introduction of the DFM but were not significantly changed following the
challenge diet.
The DFM used in the study had little or no effect on most of the changes in response
to the challenge diet, although some of them modulated the reticuloruminal pH -
though the changes were very small in numerical terms - with mean pH significantly
141
increasing following introduction of DFM. Treatment group also had a significant
effect on the number of observations noted below pH 6. The DFM, BOVAMINE®
Complete and E. faecium were most effective at buffering the rumen pH and may
be useful at preventing the negative effects of a high carbohydrate diet.
BOVAMINE® Complete yeast showed the lowest number of instances where of pH
below 6, supportive of its use as a commonly used commercial DFM, marketed as
a successful ruminal buffer. Test product consumption was high, increasing in the
latter part of the study, presumably as cattle became accustomed to the products
and route of administration. Proportion of treatment consumed at each milking was
significantly different between groups, higher in the negative control (group 1) and
the 2 bacterial products (groups 4/5) in comparison to the yeasts (BOVAMINE®
Complete group 2 and group 3) which were a larger volume. This higher rejection
rate may be due to a difference in palatability of the products, or it is possible that
the larger volume of these powders led to a detection bias in leftover doses (larger
treatments more likely to be noted if rejected or partially eaten). Time taken to
administer the larger dose products was also slightly increased and meant
occasionally cattle ate their full concentrate allocation before the dose was fully
administered; meaning cattle were more likely to receive treatments into the trough
alone. Leftover parlour feed was negligible throughout the trial and was not recorded.
This very low feed refusal rate was not as would be expected if significant ruminal
acidosis had been induced.
It was critical that the challenge diet in this trial challenged the rumen to an extent
where variation in production parameters and an effect of DFM could be assessed.
The diet was formulated to provide a challenge and induce SARA but not to cause
severe clinical disease. The expected values for all animals for NDF from forage (%)
were well below recommendations and the expected intake of starch and sugar and
overall concentrate to roughage ratio were above standard recommendations.
However, as animals on farm were parlour fed partly according to yield, it is unlikely
that all animals were challenged to the same level. Higher producing animals would
have experienced a more severe challenge. In future, standardising the amount of
parlour feed would provide a challenge to more animals in the herd, but would
perhaps not be typical of standard feeding on farms, as the majority of animals on
farms will be fed partly to yield.

142
In conclusion, the key finding from the results detailed in this chapter is that feeding
a challenge diet high in rapidly fermentable carbohydrates induced changes
consistent with an inflammatory response. It appears that an inflammatory type
response in cattle may be a pre-cursor to SARA and may become evident before
clinical symptoms arise in individuals. It is possible that by identifying early indicators
of inflammation, fermentation disorders could be identified early, prevented before
symptoms arise and preventing both welfare issues and financial losses.
143
A direct comparison of physiological responses in cattle and sheep to diets intended to induce acidosis
Introduction and background
The majority of studies investigating reticuloruminal function and the effect of a high
carbohydrate diet in ruminants primarily use cattle, often dairy cattle, as the subject.
However, cattle are expensive to purchase, can be expensive to maintain, and
require access to a relatively large amount of space. Conversely, sheep are cheaper
to purchase, easier to maintain and work with and require less space than cattle.
The use of sheep as a model organism for ruminant studies into SARA and ruminal
acidosis would be supported if their responses to a diet expected to induce SARA
were comparable with those of cattle.
Sheep have been shown to be an effective and more economical model for
ruminants and have been used as a model organism in studies investigating
diseases and infections affecting both cattle and sheep, such as Escherichia coli
O157:H7 (Kudva et al., 1995) and comparative prion diseases such as scrapie and
bovine spongiform encephalopathy (BSE) (Hunter, 2003). Both cattle and sheep
have been the subject of extensive nutritional studies and both species have
previously and independently been shown to be affected by ruminal acidosis as a
result of feeding a diet high in rapidly fermentable carbohydrates (Patra et al., 1996,
Aschenbach and Gabel, 2000, Keunen et al., 2002, Penner et al., 2009a, Marchesini
et al., 2013). However, the comparative effects of a diet intended to induce ruminal
acidosis have not previously been reported.
The variables investigated in this study had previously been shown to be affected
by feeding a diet intended to induce SARA in beef and dairy cattle in extensive trials
in the literature (Owens et al., 1998, Aschenbach and Gabel, 2000, Gozho et al.,
2007). It would be expected that if responses in variables previously associated
with SARA, such as reticuloruminal pH (Mulligan et al., 2016), SCFA levels (Penner
et al., 2009b), reticuloruminal LPS (Khafipour et al., 2009) and reticuloruminal
histamine (Wang et al., 2013) were similar in both species then the use of sheep as
a model organism for cattle would be supported.

144
The expression of inflammatory cytokines including C-C motif chemokines, and
interleukins have been shown to increase in response to a challenge diet intended
to induce ruminal acidosis in both the rumen epithelium (Zhang et al., 2016) and
peripheral blood leukocytes (Danscher, 2011). Investigating metabolic, biochemical,
haematological, histological and immune response variables in both species should
enable more complete characterisation of the response to a challenge diet in the
two species. Many variables are already known to differ between sheep and cattle,
including haematology and biochemistry (Jackson and Cockcroft, 2007), so there is
a need to consider the between-species variation in the responses.
The objective of the study was to determine the extent to which sheep and cattle
differ in their reticuloruminal pH, ruminal microbiome, ruminal histology and gene
expression, ruminal SCFA, histamine and LPS concentrations, and haematological
and biochemical profiles, in response to challenge with a diet intended to induce
ruminal acidosis
Aims
There were 3 main objectives for this study:
1. Determine to what extent sheep should be used as a model for dietary
manipulation in cattle
2. Determine to what extent sheep and cattle vary in their response to a diet
intended to induce ruminal acidosis, in their reticuloruminal pH, ruminal histology,
SCFA proportions, LPS concentration, rumen fluid histamine levels, plasma
histamine levels and blood haematology and biochemistry profiles
3. Provide baseline data on the comparative rumen microbiome of sheep and cattle
and their overall gut biology using 16S sequencing

145
Materials and methods
Study design
Samples were collected from 6 ruminally fistulated cattle and 4 ruminally fistulated
sheep when animals were maintained on a basal forage ration and after challenge
with a high carbohydrate ration formulated with the intention of inducing ruminal
acidosis. Each animal was administered an indwelling pH/temperature monitoring
bolus (Well Cow™, Roslin, Midlothian) prior to the beginning of the trial. Blood,
reticuloruminal fluid and ruminal papillae biopsy samples were collected at 3 time-
points during the study: D-28 (basal), D-30 (1 day post challenge) and D-36 (1 week
post challenge). Figure 5-1 shows a schematic of the time line for the study, detailing
sample collection days and the analysis carried out from the samples collected at
each point.
Cattle used in this study were adult, female, purebred Jersey cows, ranging from 6
to 7 years and 466 kg to 624 kg. Cattle were designated FC (fistulated cow) 1-6.
Cattle were previously fistulated animals owned by and kept at the University of
Glasgow’s Cochno Farm and Research Centre.
Sheep used in this study were 4 Scotch Mule ewes aged 11 months and ranging in
weight from 55-79 kg. Sheep were sourced from the Cochno flock and fistulated
specifically for this study, 4 months prior to the commencement, to give an
appropriate surgical recovery time. Six sheep were intended to undergo fistulation,
however 2 failed preclinical tests and thus only 4 were used. Sheep were designated
FS (fistulated sheep) 2, 4, 5 and 6. Sheep were fistulated using a modified Bar-
Diamond cannulation protocol, the same used in the cattle, detailed in full in
Appendix 3.
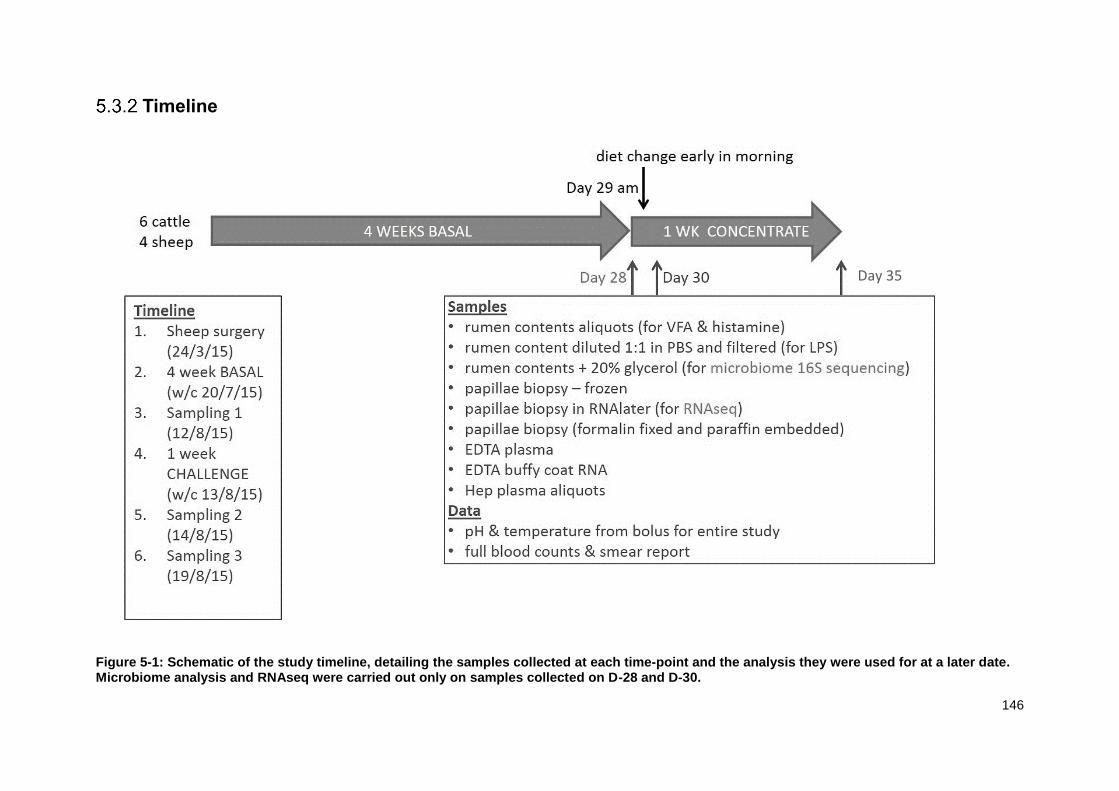
146
Timeline
Figure 5-1: Schematic of the study timeline, detailing the samples collected at each time-point and the analysis they were used for at a later date. Microbiome analysis and RNAseq were carried out only on samples collected on D-28 and D-30.
Day 35

147
Animals were housed in conspecific groups in open sided, straw-bedded sheds, with
ad libitum access to water and individual troughs with locking head gates for feeding
(bucket fed in the absence of individual troughs).
Table 5-1: Table showing cattle and sheep information. The table shows age, bolus ID and weights across the trial. No pre-surgery weight was available for cattle as they were fistulated prior to the beginning of the trial.
Species ID Age Bolus ID
Pre surgery weight (kg)
Start weight (kg)
End weight (kg)
Cow FC1 92 months 664 - 466 462 Cow FC2 89 months 665 - 538 532 Cow FC3 89 months 666 - 584 574 Cow FC4 88 months 667 - 624 618 Cow FC5 74 months 658 - 540 518 Cow FC6 73 months 659 - 500 500 Sheep FS2 11 months 660 66 64 61.5 Sheep FS4 11 months 661 56 56 54 Sheep FS5 11 months 662 60 55 54.5 Sheep FS6 11 months 663 83 79 69
Rations
Before the trial, both species were fed some barley each day as per the farm’s
normal feeding regime. This was standardised and treated as their basal diet (150
g/sheep/day bruised barley or 600 g/cow/day bruised barley) with ad libitum haylage
and water. Both species were fed in shared troughs for the first week of the trial,
after which animals were individually bucket fed or fed in individual troughs to
prevent any feed dominance and ensure an accurate record of feed residues could
be maintained. Leftover feed was weighed using household digital scales (Salter,
maximum capacity 5 kg, measured in 1 g increments).
Prior to the study, sheep received approximately twice the amount of barley per kg
of liveweight as the cattle (2.3 g/kg liveweight compared with 1.1 g/kg liveweight in
cattle). We scaled the increase in barley content allometrically according to the
equation of Sharma and McNeill (2009):
𝑆ℎ𝑒𝑒𝑝 𝐼𝑛𝑐𝑟𝑒𝑎𝑠𝑒 =𝐶𝑜𝑤 𝐼𝑛𝑐𝑟𝑒𝑎𝑠𝑒
(𝑆ℎ𝑒𝑒𝑝 𝑊𝑒𝑖𝑔ℎ𝑡𝐶𝑜𝑤 𝑊𝑒𝑖𝑔ℎ𝑡
)^ 1/3
This resulted in approximately 5-fold increase per kg for cattle (0.6 kg to 3.0 kg) and
10-fold increase for sheep (0.15 to 1.5 kg), thereby compensating for the relatively
148
higher surface area to volume and weight of the sheep. Hence, the basal ration of
cattle was ad libitum haylage plus 600 g/cow/d barley and of sheep was ad libitum
haylage plus 150 g/sheep/d barley. The challenge diet for cattle was ad libitum
haylage plus 3.0 kg/cow/d of barley, and that of sheep was ad libitum haylage and
1.5 kg/sheep/d of barley.
Boluses
One Well Cow™ (Roslin, Midlothian) pH and temperature monitoring bolus was
placed in the reticulum of each animal prior to the commencement of the trial. The
boluses measure pH and temperature every 15 minutes and store data for up to 120
days, until collected via a Bluetooth receiver and Android tablet and sent to a Cloud-
based storage system. Each bolus measures 32 mm x 145 mm and weighs 240 g.
It has a deployed target life of 80-100 d, a range of pH 4-7, and a reported “accuracy”
of +/- 0.3 pH units according to Well Cow (Roslin, Midlothian).
Boluses were calibrated before insertion using 2 pH standard solutions (pH 4 and
pH 10). The bolus is intended to be administered orally using a standard bolus gun.
However, for this study the bolus was placed through the fistula.
Continuously monitored reticuloruminal pH data were collected every 3 days by
restraining the animal and using the handheld Bluetooth reader to collect data stored
on the indwelling bolus. The reader was placed on the animal’s abdomen and an
Android tablet was used to synchronise the bolus and reader, allowing upload of
data.
Rumen cannulation of sheep
Sheep were cannulated on-site at the University of Glasgow’s Cochno Farm and
Research Centre using a protocol adapted from “Rumen cannulation of adult cows
using the Bar – Diamond plastic cannula” (see Appendix 3). Candidates for
cannulation were healthy adults, with no history of chronic conditions such as
lameness. The para-lumbar fossa was checked prior to surgery using a template to
ensure sufficient size to take the cannula. A full clinical examination was performed
and blood was taken from each candidate for standard haematology and
149
biochemistry panels. Two animals were excluded because of elevated white blood
cell counts, leaving 4 animals to be submitted to surgery.
Weights
Cattle and sheep body weights were recorded at each sampling time-point and
throughout the trial. In cattle, liveweight was measured using Gallagher W210
scales with Gallagher load-bars fitted onto a crush. The W210 scales operate
accurately ± 1% between -20 ºC to 50 ºC. The scales have a “zero tracking” feature,
which automatically zero the scales to compensate for accumulation of mud and
faeces. Sheep were weighed using Polden Vale pen-side scales (accuracy of
±0.5kg). Scale calibration was checked by using calibration weights.
Reticuloruminal fluid
Reticuloruminal fluid was collected via the cannula in both species. Ruminal
contents were collected by hand from the ventral sac, close to the reticulum and
strained through muslin. The strained fluid was collected into 2 × 50 ml tubes; either
plain (for SCFA/LPS/histamine analysis), or with 20% glycerol as a cryoprotectant
(16S rRNA microbiome sequencing). Rumen contents were stored in a passive cool-
box with ice blocks (< 4˚C) until they could be processed in the laboratory as per
section 2.1.3.
Reticuloruminal lipopolysaccharide (LPS)
Lipopolysaccharide (LPS) concentration in reticuloruminal fluid was determined
using the EndoLISA endpoint fluorescence microplate kit (Hyglos, France), with a
Varioskan LUX Fluorescent microplate reader (Thermo Fisher, UK) as detailed in
section 2.9. Serial dilutions were used to plot a standard curve of log (endotoxin
units or EU/ml) against log (relative fluorescence units or RFU/ml), and the unknown
sample concentrations calculated from the regression.
Reticuloruminal SCFA and ethanol
Measurement of SCFA concentration in reticuloruminal fluid was carried out by
Sciantec Analytical Ltd. using gas chromatography (GC) as detailed in section 2.10.
Reticuloruminal fluid was tested for the presence of ethanol, propan-1-ol, acetic acid,

150
propionic acid, isobutyric acid, propane-1, 2-diol, butyric acid, isovaleric acid, valeric
acid, hexanoic acid, heptanoic acid and lactic acid. Any concentration < 25 mg/kg
fell below the detection level of the GC and could not be quantified. Molar
concentrations of SCFA were obtained by dividing the measured mass of each
SCFA in mg/kg by its molecular weight: acetate - 60.05; butyrate - 88.11; propionate
- 74.08; valerate - 102.13; isobutyrate - 88.11; isovalerate - 102.13 (g/mol).
Histamine
Histamine concentration in reticuloruminal fluid was measured using the Histamine
ELISA Kit (Abnova, catalogue no. KA1888), designed for analysis of histamine in
human faeces and a LabTech LT-4500 microplate reader, as detailed in section
2.8.1. Duplicate measurements were used for all standards, controls and samples.
The concentration of unknown samples was calculated from standard curves from
samples of known concentrations.
Circulating plasma histamine concentration was measured using the Abnova
Histamine ELISA Kit (Cat. No. KA2589) intended for determination of histamine in
plasma from blood tubes containing EDTA, using a LabTech LT-4500 microplate
reader, as detailed in section 2.8.2. Duplicate measurements were used for all
standards, controls and samples. Concentrations of unknown samples were
estimated from standard curves using samples of known concentrations.
Microbiome analysis
16S ribosomal RNA (rRNA) microbiome analysis was carried out by Glasgow
Polyomics (University of Glasgow) following DNA extracted from rumen fluid using
a protocol adapted from Grahn et al. (2003), as summarised below. Due to
budgetary limitations, full bacterial sequencing was not carried out and the 16S
sequencing in this study sequenced the V3 and V4 regions of the 16S.
151
5.3.11.1 DNA extraction from rumen fluid
Cell lysis
Frozen reticuloruminal fluid plus glycerol was thawed and centrifuged at 10,621 x g
for 20 min. The majority of the supernatant was removed, leaving ~1 ml, varying
with the size of the pellet. The pellet was re-suspended with a plastic Pasteur pipette.
The sample was placed into a 2 ml screw-cap tube containing zirconia beads (0.1
mm and 0.5 mm). 1 ml of lysis buffer was added (NaCl 500 mM, Tris-HCl 50 mM,
EDTA 50 mM, 4% sodium dodecyl sulfate (SDS)) and the sample was homogenised
with a vortex at high speed. It was then incubated at 70˚C for 15 min before being
centrifuged at 17,949 x g. Supernatant was removed and placed into a fresh 2 ml
microtube.
Precipitation of nucleic acids
260 μL ammonium acetate (10 mM) was added to the supernatant, mixed well and
the samples incubated on ice before being centrifuged at 17,949 x g for 10 min. The
solution was added to a microtube, 1 volume of isopropanol (molecular grade) was
added and the tubes were incubated on ice, before being centrifuged at 17,949 x g
for 15 min. The supernatant was removed and the nucleic acid pellet washed with
70% ethanol (molecular grade) before being dried under vacuum in a freeze dryer.
The pellet was dissolved in 100 μL TE (Tris-EDTA 1x) buffer and the purity and
concentration determined using the NanoDrop Microvolume Spectrophotometer
and Fluorometer (Thermo Fisher, UK).
5.3.11.2 Generation of 16S amplicon libraries
DNA samples that had been extracted following the protocol detailed above were
quantified using the High Sensitivity DNA Qubit system (Thermo-Fisher, Paisley,
UK). 16S libraries encompassing the V3 and V4 regions were generated by
Glasgow Polyomics (University of Glasgow). The V3 and V4 regions of bacterial
16S were amplified using Kapa HiFi Hotstart readymix (2x) (Kapa Biosystems,
Wilmington, MA, USA), with the addition of primers specific for the V3 and V4
regions of 16S, based on standard Illumina 16S primers, containing an overlap
sequence which makes the primers compatible with the Nextera XT indexing
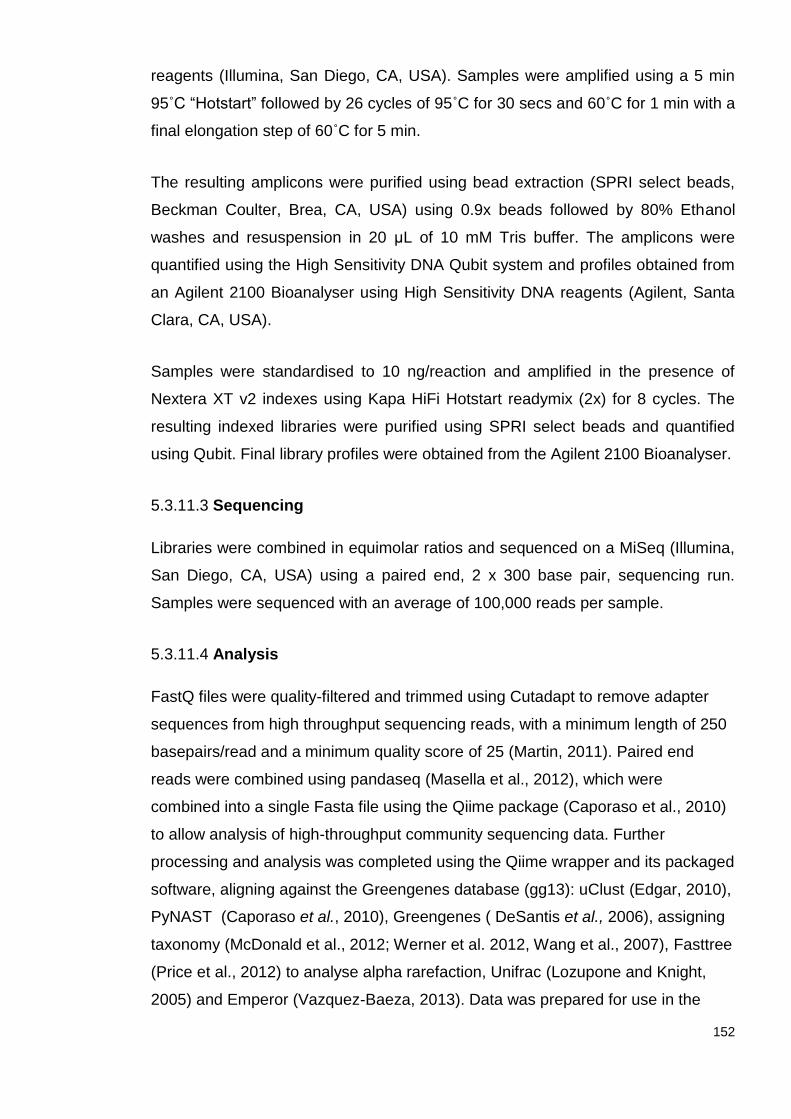
152
reagents (Illumina, San Diego, CA, USA). Samples were amplified using a 5 min
95˚C “Hotstart” followed by 26 cycles of 95˚C for 30 secs and 60˚C for 1 min with a
final elongation step of 60˚C for 5 min.
The resulting amplicons were purified using bead extraction (SPRI select beads,
Beckman Coulter, Brea, CA, USA) using 0.9x beads followed by 80% Ethanol
washes and resuspension in 20 μL of 10 mM Tris buffer. The amplicons were
quantified using the High Sensitivity DNA Qubit system and profiles obtained from
an Agilent 2100 Bioanalyser using High Sensitivity DNA reagents (Agilent, Santa
Clara, CA, USA).
Samples were standardised to 10 ng/reaction and amplified in the presence of
Nextera XT v2 indexes using Kapa HiFi Hotstart readymix (2x) for 8 cycles. The
resulting indexed libraries were purified using SPRI select beads and quantified
using Qubit. Final library profiles were obtained from the Agilent 2100 Bioanalyser.
5.3.11.3 Sequencing
Libraries were combined in equimolar ratios and sequenced on a MiSeq (Illumina,
San Diego, CA, USA) using a paired end, 2 x 300 base pair, sequencing run.
Samples were sequenced with an average of 100,000 reads per sample.
5.3.11.4 Analysis
FastQ files were quality-filtered and trimmed using Cutadapt to remove adapter
sequences from high throughput sequencing reads, with a minimum length of 250
basepairs/read and a minimum quality score of 25 (Martin, 2011). Paired end
reads were combined using pandaseq (Masella et al., 2012), which were
combined into a single Fasta file using the Qiime package (Caporaso et al., 2010)
to allow analysis of high-throughput community sequencing data. Further
processing and analysis was completed using the Qiime wrapper and its packaged
software, aligning against the Greengenes database (gg13): uClust (Edgar, 2010),
PyNAST (Caporaso et al., 2010), Greengenes ( DeSantis et al., 2006), assigning
taxonomy (McDonald et al., 2012; Werner et al. 2012, Wang et al., 2007), Fasttree
(Price et al., 2012) to analyse alpha rarefaction, Unifrac (Lozupone and Knight,
2005) and Emperor (Vazquez-Baeza, 2013). Data was prepared for use in the

153
LefSe pipeline using Koeken.py. Samples were analysed as individual samples
and as groups.
Ruminal papillae biopsies
Biopsies of ruminal papillae were taken using a protocol adapted from Schlau et al.
(2012). The rumen was first partially emptied into a bucket and the densely
papillated surface of the right wall of the dorsal sac of the rumen was pulled across
to the cannula in the left wall, to enable samples to be taken. The biopsy was taken
using 3-4 cuts with curved scissors to harvest 20 to 30 papillae. In both species
following biopsy, contents were replaced in the rumen. As the study was carried out
during summer and the procedure took less than 15 min/animal, it was not
considered necessary to add hot water with the contents to prevent a decrease in
body temperature. Following closure of the cannula, the external surface was
cleaned to remove spilled ingesta. No antibiotics or analgesics were given post
biopsy consistent with practice described elsewhere (Oba, 2015).
Papillae were placed in 0.9% saline solution immediately upon collection then
counted equally into 3 aliquots and transferred into 3 sterile bijou sample containers
(Sigma-Aldrich, UK), each containing one of RNA-later (ThermoFisher), 10%
formalin (Sigma Aldrich, F1268), or plain (immediately placed onto dry ice to freeze
and frozen at -80˚C for future use).
In the laboratory, samples in RNA-later were frozen at -20˚C before being processed
using miRNeasy kit (Qiagen) with BeadBug tubes, detailed in section 5.3.13.
Samples were further processed for Taqman gene expression as per section 5.3.14.
Samples in formalin (Sigma Aldrich, F1268) were fixed before being processed for
histology, as detailed in sections 2.2 and 2.3.
Ruminal histology
Papillary biopsies stored in 10% formalin (Sigma Aldrich, F1268) were fixed and
moved to 1 x PBS solution for storage. Biopsies were prepared and embedded in
paraffin as detailed in section 2.2.1. Sections were stained for both H&E and EMSB
as detailed in section 2.2.and 2.2.3. Immunohistochemistry was carried out for both
CD3 and MHC2 by Veterinary Diagnostic Services, as detailed in section 2.3.
154
Images were captured as detailed in section 2.4. Slides were scored using the
system detailed in section 3.3.7.
RNA extraction from rumen papillae
Five to 10 papillae stored in RNAlater (Qiagen, Ref. 76104) were homogenised in
Qiazol Lysis Reagent (Qiagen) with a Polytron homogeniser (VWR). Homogenates
were kept on ice throughout the protocol. Homogenates were transferred to prefilled
BeadBug™ (Sigma Aldrich, USA) tubes with additional Qiazol and vortexed with
short intervals on ice. Homogenates were transferred to PLG-heavy tubes,
chloroform was added and tubes were left at room temperature for 5 min before
being centrifuged at 20,817 x g for 14 min. The aqueous phase was transferred to
a microtube and 100% ethanol added. The sample was then added to a collection
tube (kit), centrifuged at 10,621 x g for 15 min and the protocol for the miRNeasy kit
was then followed. Resulting RNA was tested for concentration and the A260/280
and A260/230 ratios were determined using a NanoDrop Microvolume
Spectrophotometer and Fluorometer (ThermoFisher, UK). If the RNA concentration
was high (>1000 µg/µL), RNase-free water was added to the eluent and it was again
tested using the NanoDrop Microvolume Spectrophotometer and Fluorometer
(Thermo Fisher, UK). RNA was stored at -80˚C.
Semi-Quantitative PCR
EDTA RNA was extracted from ruminal papillae biopsies for CCL11, IL1-β, TLR-4,
and NHE3 gene expression analysis by semi-quantitative, real-time PCR (qPCR),
as detailed in section 2.6. In brief, RNA extracted as detailed in section 5.3.14 was
converted to cDNA using the TaqMan Universal Master Mix kit (Thermo Fisher,
Paisley, UK). qPCR was carried out using TaqMan Gene Expression Master Mix
assay kit (Applied Biosystems) with the extracted cDNA according to manufacturer’s
instructions. The relative quantification of each gene was calculated utilising the
comparative cycle threshold (Ct) method (2−ΔΔCt) of relative quantification (Livak and
Schmittgen, 2001, Steibel et al., 2009) using GAPDH and RPLPO as the
housekeeping genes, as the correlation between the 2 was good. Relative
expression (fold change) at each time-point was calculated by comparing the gene
of interest (GOI) cycle threshold (Ct) value and the housekeeping gene (HKG) Ct
value. Fold changes for each GOI relative to GAPDH and RPLPO were averaged

155
to give the fold change for the animals between D-28 and D-30 and D-30 and D-35.
βAct was excluded from analysis as a HKG because the reported Ct values varied
greatly for each sample. All plates were carried out in a 10 μl volume (6 μl MasterMix,
4 μl cDNA) and all samples and standards were run in duplicate.
Blood collection and laboratory analysis
Blood samples were collected via venepuncture of the jugular or coccygeal vein and
artery, into 7.5 ml EDTA and heparin-containing vacutainers (Becton Dickinson, BD
Vacutainer, USA). Samples were stored in a passive cool box with ice blocks (<
4˚C), before direct transport to the laboratory. In the laboratory, blood was
processed as detailed in section 2.5. Standard haematology panels were carried out
by the University of Glasgow’s Veterinary Diagnostic Services (VDS), using the
ADVIA 20.120 Haematology System (Siemens) as detailed in section 2.5.3.
5.3.16.1 RNA extraction from EDTA blood
RNA was extracted from the EDTA blood for future use using Qiazol Lysis Reagent
(Qiagen, Ref. 79306) and the miRNeasy kit (Qiagen), as detailed in section 2.6.2.
Statistical analysis
Data were analysed using R (RCore Team, 2016). Data were normality tested using
Shapiro-Wilkes test and Q-Q plots and histograms to visualise normality. Variables
which were considered not normal following testing were natural-log transformed
and retested. All variables were considered to approximate a normal distribution
following log transformation. Overall effect of time-point as a factor (D-28, D-30 and
D-35 combined), species and the time-point/ species interaction term were identified
using a one-way analysis of variance with time-point and species as fixed effects in
R (RCore team, 2016), with a significance of p < 0.05. For each parameter, mean,
median and standard deviation was also calculated for all cattle and all sheep across
all time-points and at each individual time-point. Additionally, paired t-tests were
used to identify the statistical significance of the change in variables between time-
points A and B and time-points B and C, where change in the value was considered
significant if it were significantly different to 0.
156
Data from a 48 h period at each time-point (basal, diet change, 1 week post diet
change) were summarised for each animal to provide hourly mean pH values for
each 24 h period at D-28, D-30 and D-35. Minimum and maximum pH values were
recorded for each time-point and time spent below commonly used normal
thresholds was calculated for each animal.
Histological scores created for each sample using the scoring system detailed in
section 3.3.7 were analysed using R (RCore Team, 2016). For numeric variables,
Shapiro-Wilkes normality testing was carried out. Non-normal parameters were log
transformed and retested; all being considered normal following transformation.
Paired t-tests were used to identify significant changes in scores between time-
points. Mean, median and SD was calculated for all cattle and all sheep across all
time-points and at each individual time-point for each variable. Categorical data
were presented in tables with no attempt to determine the significance of
frequencies in each category because the expected numbers of observations in
each cell were low.
16S rRNA outputs were analysed using Qiime and LefSe. Qiime is used to analyse,
process and plot 16S data (Caporaso et al., 2010). LefSe (Segata et al., 2011) was
used to build a Linear Discriminant Analysis (LDA) models for samples, where
relative difference in abundance of differing phyla between groups was analysed
and created “biomarker” lists. Biomarkers, as designated by LefSe, refer to “specific
organisms, clades, operational taxonomic units, or pathways whose relative
abundances differ between 2 or more groups of samples” (Segata et al., 2011). Bar
charts and cladograms were generated of the biomarkers. Phylogenetic diversity
(PD) was looked at for all animals, and examined the differences in bacterial species
present in each sample, using a Newick format phylogenetic tree. Larger PD values
can be inferred as corresponding to greater expected diversity (Vellend, 2010). PD
is defined as the minimum total length (number of nodes) of all the phylogenetic
branches required to span a given set of differences in bacterial species on the
phylogenetic tree (Vellend, 2010). PD was examined for 5,000 reads/sample 10
times. UniFrac (EMPeror (Vazquez-Baeza, 2013)) plots were used to determine
whether communities in a sample were significantly different from other samples
and to compare communities simultaneously using clustering and ordination
techniques (Turner et al., 2012).

157

158
Results
Diet and weights
The amount of leftover feed recorded for each animal at the morning and afternoon
feeds over the course of the challenge week is shown in table 5-2. No cattle left any
feed at any point in the trial. All sheep refused the majority of their feed throughout
the trial, with sheep FS6 showing the largest refusal from the outset.
Table 5-2: Feed residues at AM and PM feedings, for both cattle and sheep over the challenge period and percentage of ration refused at each feed for each sheep. Cattle were fed 1500 g and sheep were fed 750 g at each feed (AM and PM).
Pre-surgery weights of cattle were unknown, surgery having been carried out years
prior to the commencement of this trial. Weights taken pre-surgery for sheep and
throughout the trial for both species are detailed in table 5-3. In cattle, weight
changed significantly only between D-28 and D-35 (t=-2.58, p <0.05). In sheep,
weight changed significantly only between pre-surgery and D-28 (t =-3.6, p <0.05).
Thurs Fri Sat Sun Mon Tues Wed
AM PM AM PM AM PM AM PM AM PM AM PM AM
FS2 363 280 326 379 444 721 715 610 607 565 589 660 724
% refused 48.4 37.3 43.4 50.5 59.2 96 95.3 81.3 80.9 75.3 78.5 88 96.5
FS4 0 416 730 691 722 709 523 380 698 473 506 601 730
% refused 55.4 97.3 92.1 96.2 94.5 69.7 50.6 93 63 67.5 80.1 97.3
FS5 0 0 0 720 728 730 730 729 730 711 711 684 724
% refused 96 97 97.6 97.6 99.8 97.6 94.8 94.8 91.2 96.5
FS6 671 683 701 728 720 680 705 664 719 696 696 698 707
% refused 89.5 90.8 93.4 97 96 90.6 94 88.5 95.9 92.8 92.8 93.1 94.3
FC1 0 0 0 0 0 0 0 0 0 0 0 0 0
FC2 0 0 0 0 0 0 0 0 0 0 0 0 0
FC3 0 0 0 0 0 0 0 0 0 0 0 0 0
FC4 0 0 0 0 0 0 0 0 0 0 0 0 0
FC5 0 0 0 0 0 0 0 0 0 0 0 0 0
FC6 0 0 0 0 0 0 0 0 0 0 0 0 0

159
Table 5-3: Animal weights (kg) pre surgery and across the whole trial for all individuals for both species. Weight was measured pre-surgery for sheep, at two points during the basal diet and on the first (A) and last sampling date (C).
Animal ID Eartag Pre-Surgery 27/07/2015 10/08/2015 12/08/2015
(A) 19/08/2015
(C)
Cow FC1 765 466 462
Cow FC2 776 538 532
Cow FC3 809 584 574
Cow FC4 826 624 618
Cow FC5 978 540 518
Cow FC6 994 500 500
Sheep FS2 337 66 64 61 61.5
Sheep FS4 482 56 56 50 54
Sheep FS5 310 60 55 53 54.5
Sheep FS6 321 83 79 68 69
Reticuloruminal pH
From the beginning and throughout the study, it was apparent that the boluses and
the bolus relaying system were inefficient and often failed. Final bolus data and
corresponding hand held readings were sent to Well Cow™ to allow them to classify
the remaining boluses as functioning or not. Three boluses were classified as
definite failures by Well Cow™; FC4 failed 23/6/15, FC5 failed immediately and FS2
failed 13/8/15. According to checks by Well Cow™ (checking the drift in data, range
observed and repetition of results), the remaining data was considered acceptable
and a true reflection of the reticuloruminal pH at that time. Reticuloruminal pH was
significantly different between time-points and between species, and was
significantly different between individual animals (p <0.001), shown in figure 5-2.
Sheep showed a wider range of pH values at D-30 in comparison with cattle and
consistently had a lower mean pH across the trial.

160
Figure 5-2: Reticuloruminal pH at each time-point: basal (D-28), 1 day post challenge (D-30) and 1 week post challenge (D35) for each species. Reticuloruminal pH was statistically significantly different between time-points, species and individual animals (p < 0.001).
Effect of hour of day on reticuloruminal pH was significant for cattle (p <0.001), but
was not significant in sheep. Change between time-points was significant for both
species and both species followed the same pattern. Figure 5-3 shows that hourly
reticuloruminal pH did not vary greatly between D-28 and D-30 in cattle (figures 5-
3A and 5-3B). However, despite the change being small in absolute terms (average
-0.08 units), the pH decreased significantly between D-28 and D-30 in cattle (t=-
9.43, p <0.0001) and increased significantly between D-30 and D-35 (t = 24.3474,
p <0.0001). In sheep, a larger, significant reduction was noted in pH between D-28
and D-30 (t=-10.89, p <0.0001) and again a larger increase was noted at between
D-30 and D-35 (t = 17.4354, p <0.0001).
Cow Sheep Cow Sheep Cow Sheep
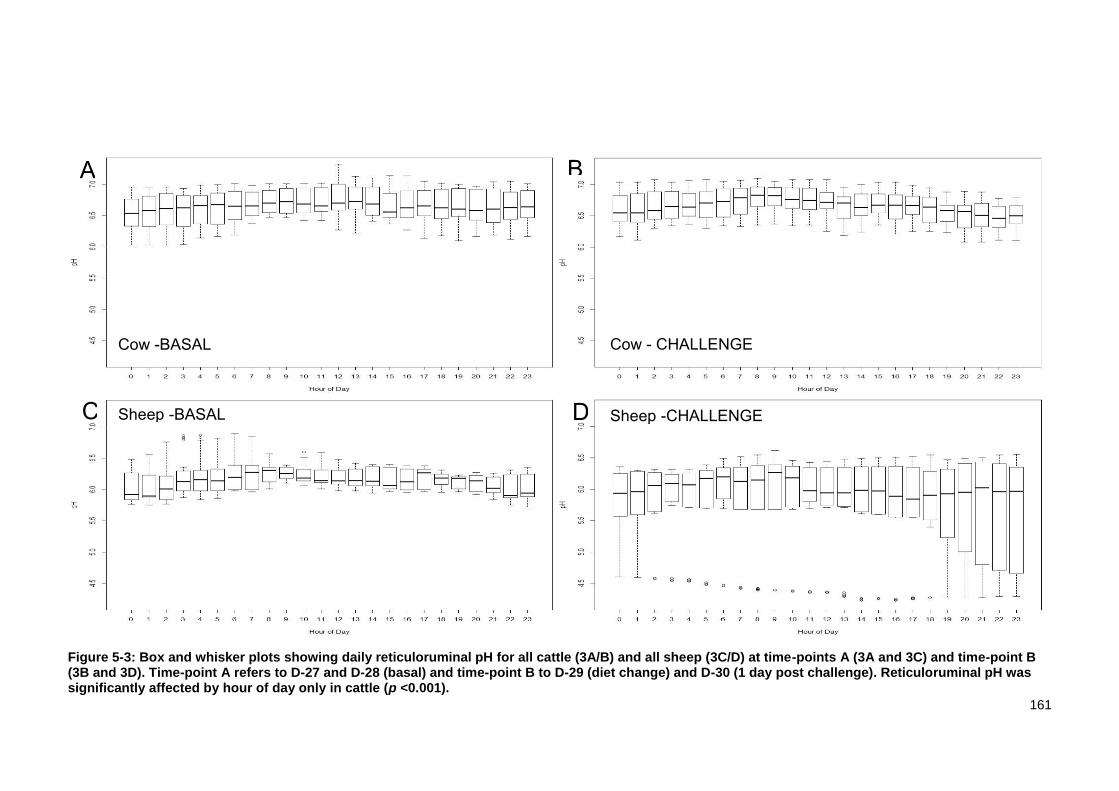
161
Figure 5-3: Box and whisker plots showing daily reticuloruminal pH for all cattle (3A/B) and all sheep (3C/D) at time-points A (3A and 3C) and time-point B (3B and 3D). Time-point A refers to D-27 and D-28 (basal) and time-point B to D-29 (diet change) and D-30 (1 day post challenge). Reticuloruminal pH was significantly affected by hour of day only in cattle (p <0.001).
A B
C D
Cow -BASAL Cow - CHALLENGE
Sheep -BASAL Sheep -CHALLENGE
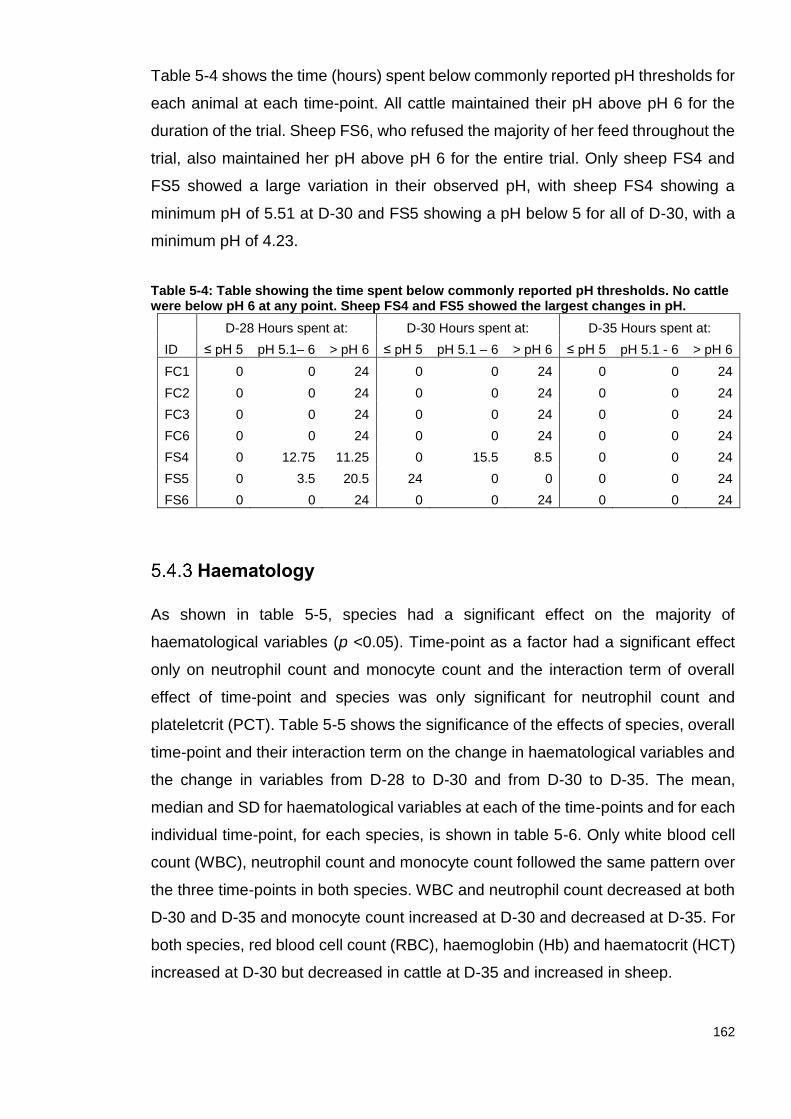
162
Table 5-4 shows the time (hours) spent below commonly reported pH thresholds for
each animal at each time-point. All cattle maintained their pH above pH 6 for the
duration of the trial. Sheep FS6, who refused the majority of her feed throughout the
trial, also maintained her pH above pH 6 for the entire trial. Only sheep FS4 and
FS5 showed a large variation in their observed pH, with sheep FS4 showing a
minimum pH of 5.51 at D-30 and FS5 showing a pH below 5 for all of D-30, with a
minimum pH of 4.23.
Table 5-4: Table showing the time spent below commonly reported pH thresholds. No cattle were below pH 6 at any point. Sheep FS4 and FS5 showed the largest changes in pH.
ID
D-28 Hours spent at: D-30 Hours spent at: D-35 Hours spent at:
≤ pH 5 pH 5.1– 6 > pH 6 ≤ pH 5 pH 5.1 – 6 > pH 6 ≤ pH 5 pH 5.1 - 6 > pH 6
FC1 0 0 24 0 0 24 0 0 24
FC2 0 0 24 0 0 24 0 0 24
FC3 0 0 24 0 0 24 0 0 24
FC6 0 0 24 0 0 24 0 0 24
FS4 0 12.75 11.25 0 15.5 8.5 0 0 24
FS5 0 3.5 20.5 24 0 0 0 0 24
FS6 0 0 24 0 0 24 0 0 24
Haematology
As shown in table 5-5, species had a significant effect on the majority of
haematological variables (p <0.05). Time-point as a factor had a significant effect
only on neutrophil count and monocyte count and the interaction term of overall
effect of time-point and species was only significant for neutrophil count and
plateletcrit (PCT). Table 5-5 shows the significance of the effects of species, overall
time-point and their interaction term on the change in haematological variables and
the change in variables from D-28 to D-30 and from D-30 to D-35. The mean,
median and SD for haematological variables at each of the time-points and for each
individual time-point, for each species, is shown in table 5-6. Only white blood cell
count (WBC), neutrophil count and monocyte count followed the same pattern over
the three time-points in both species. WBC and neutrophil count decreased at both
D-30 and D-35 and monocyte count increased at D-30 and decreased at D-35. For
both species, red blood cell count (RBC), haemoglobin (Hb) and haematocrit (HCT)
increased at D-30 but decreased in cattle at D-35 and increased in sheep.

163
Table 5-5: The effect of time-point, species and their interaction term on haematological parameters across all time-points (one way ANOVA with time-point and species as fixed effects) and the significance of the change between D-38 and D-30 and between D-28 and D-35 (t-test, mu = 0). The p-values are shown as calculated, except where values were below 0.0001.
Significance (p-value)
T-Test significance (p-value)
Variable Time-point Species T-P*Species Species
D-28 and D-30
D-30 and D-35
RBC (x10E12/l) 0.133 <0.0001 0.382 Cow 0.02 0.04
Sheep 0.57 0.2
Hb (g/dl) 0.109 0.189 0.455 Cow 0.01 0.02
Sheep 0.56 0.7
Haematocrit (%) 0.144 0.073 0.409 Cow 0.02 0.03
Sheep 0.7 0.88
Mean corpuscular volume (fl) 0.992 <0.0001 0.987 Cow 0.36 0.88
Sheep 0.57 0.37
WBC (x10E9/l) 0.192 0.003 0.362 Cow 0.07 0.05
Sheep 0.07 0.06
Neutrophil count (x10E9/l) 0.002 0.0004 0.019 Cow 0.01 0.01
Sheep 0.58 0.045
Lymphocyte count (x10E9/l) 0.256 0.015 0.238 Cow 0.76 0.56
Sheep 0.15 0.51
Monocyte count (x10E9/l) 0.007 0.002 0.467 Cow 0.049 0.42
Sheep 0.9 0.21
Eosinophil count (x10E9/l) 0.289 <0.0001 0.714 Cow 0.95 0.74
Sheep 0.55 0.9
Mean platelet volume (fl) 0.473 <0.0001 0.827 Cow 0.83 0.4
Sheep 0.67 0.1
Plateletcrit (%) 0.653 <0.0001 0.033 Cow 0.13 0.19
Sheep 0.07 0.33
Platelet distribution width (%) 0.272 0.543 0.779 Cow 0.7 0.04
Sheep 0.71 0.26
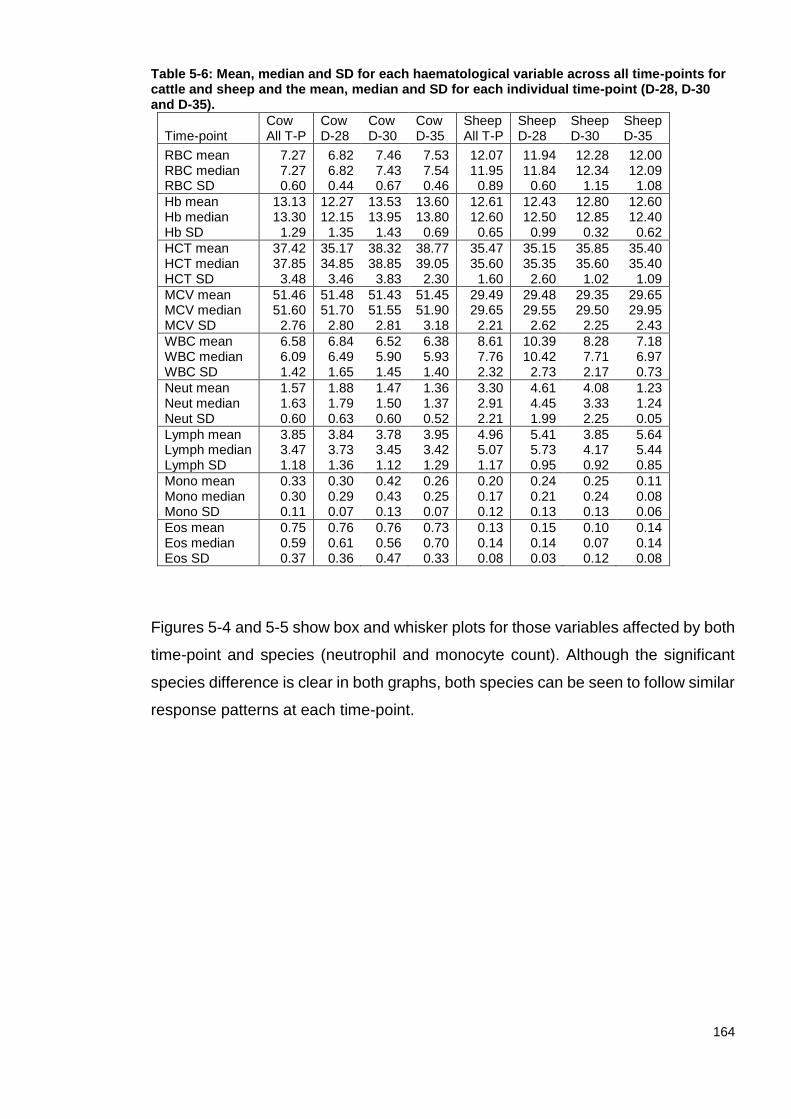
164
Table 5-6: Mean, median and SD for each haematological variable across all time-points for cattle and sheep and the mean, median and SD for each individual time-point (D-28, D-30 and D-35).
Cow Cow Cow Cow Sheep Sheep Sheep Sheep Time-point All T-P D-28 D-30 D-35 All T-P D-28 D-30 D-35
RBC mean 7.27 6.82 7.46 7.53 12.07 11.94 12.28 12.00 RBC median 7.27 6.82 7.43 7.54 11.95 11.84 12.34 12.09 RBC SD 0.60 0.44 0.67 0.46 0.89 0.60 1.15 1.08
Hb mean 13.13 12.27 13.53 13.60 12.61 12.43 12.80 12.60 Hb median 13.30 12.15 13.95 13.80 12.60 12.50 12.85 12.40 Hb SD 1.29 1.35 1.43 0.69 0.65 0.99 0.32 0.62
HCT mean 37.42 35.17 38.32 38.77 35.47 35.15 35.85 35.40 HCT median 37.85 34.85 38.85 39.05 35.60 35.35 35.60 35.40 HCT SD 3.48 3.46 3.83 2.30 1.60 2.60 1.02 1.09
MCV mean 51.46 51.48 51.43 51.45 29.49 29.48 29.35 29.65 MCV median 51.60 51.70 51.55 51.90 29.65 29.55 29.50 29.95 MCV SD 2.76 2.80 2.81 3.18 2.21 2.62 2.25 2.43
WBC mean 6.58 6.84 6.52 6.38 8.61 10.39 8.28 7.18 WBC median 6.09 6.49 5.90 5.93 7.76 10.42 7.71 6.97 WBC SD 1.42 1.65 1.45 1.40 2.32 2.73 2.17 0.73
Neut mean 1.57 1.88 1.47 1.36 3.30 4.61 4.08 1.23 Neut median 1.63 1.79 1.50 1.37 2.91 4.45 3.33 1.24 Neut SD 0.60 0.63 0.60 0.52 2.21 1.99 2.25 0.05
Lymph mean 3.85 3.84 3.78 3.95 4.96 5.41 3.85 5.64 Lymph median 3.47 3.73 3.45 3.42 5.07 5.73 4.17 5.44 Lymph SD 1.18 1.36 1.12 1.29 1.17 0.95 0.92 0.85
Mono mean 0.33 0.30 0.42 0.26 0.20 0.24 0.25 0.11 Mono median 0.30 0.29 0.43 0.25 0.17 0.21 0.24 0.08 Mono SD 0.11 0.07 0.13 0.07 0.12 0.13 0.13 0.06
Eos mean 0.75 0.76 0.76 0.73 0.13 0.15 0.10 0.14 Eos median 0.59 0.61 0.56 0.70 0.14 0.14 0.07 0.14 Eos SD 0.37 0.36 0.47 0.33 0.08 0.03 0.12 0.08
Figures 5-4 and 5-5 show box and whisker plots for those variables affected by both
time-point and species (neutrophil and monocyte count). Although the significant
species difference is clear in both graphs, both species can be seen to follow similar
response patterns at each time-point.
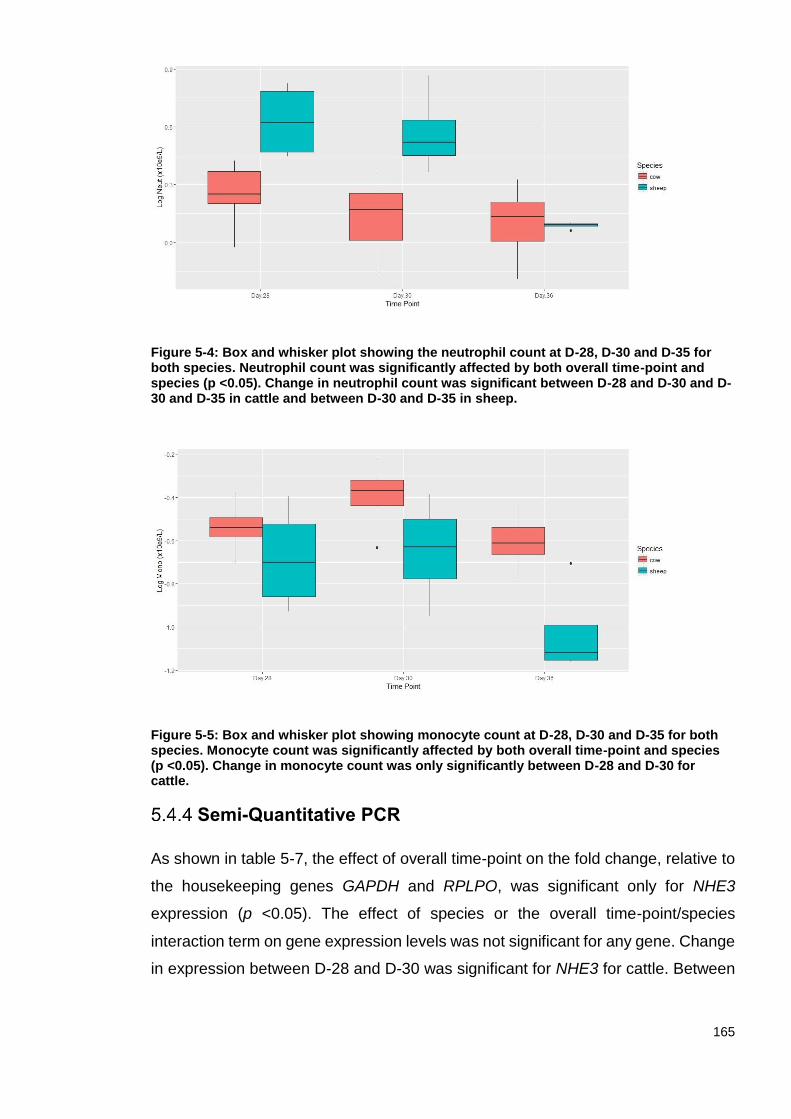
165
Figure 5-4: Box and whisker plot showing the neutrophil count at D-28, D-30 and D-35 for both species. Neutrophil count was significantly affected by both overall time-point and species (p <0.05). Change in neutrophil count was significant between D-28 and D-30 and D-30 and D-35 in cattle and between D-30 and D-35 in sheep.
Figure 5-5: Box and whisker plot showing monocyte count at D-28, D-30 and D-35 for both species. Monocyte count was significantly affected by both overall time-point and species (p <0.05). Change in monocyte count was only significantly between D-28 and D-30 for cattle.
Semi-Quantitative PCR
As shown in table 5-7, the effect of overall time-point on the fold change, relative to
the housekeeping genes GAPDH and RPLPO, was significant only for NHE3
expression (p <0.05). The effect of species or the overall time-point/species
interaction term on gene expression levels was not significant for any gene. Change
in expression between D-28 and D-30 was significant for NHE3 for cattle. Between

166
D-28 and D-35, change in expression was significant for both species for IL1β and
was significant in cattle for NHE3 expression.
Table 5-7: Table showing the effect of time-point, species and their interaction term (one way ANOVA with time-point and species as fixed effects) on gene expression levels for each of the 4 genes studied (CCL11, IL1B, NHE3, TLR4) and the significance of the change in gene expression levels between D-28 and D-30 and between D-28 and D-35 (t-test, mu = 0).
Significance T-Test significance
Variable Time-point Species T-P*Species Species
D-28 and D-30
D-28 and D-35
CCL11 fold change 0.38 0.46 0.54 Cow 0.35 0.29
Sheep 0.36 0.20
IL1B fold change 0.20 0.55 0.05 Cow 0.07 0.03
Sheep 0.07 0.02
NHE3 fold change 0.001 0.67 0.82 Cow 0.05 0.05
Sheep 0.14 0.07
TLR4 fold change 0.20 0.63 0.64 Cow 0.24 0.59
Sheep 0.22 0.10
Figures 5-6 and 5-7 show the change in the relative expression levels for each gene,
for each individual animal, between D-28 and D-30 and between D-30 and D-35
respectively. The majority of animals tended towards increase in the levels of
expression of all genes between D-28 and D-30 and tended towards decrease in
expression of all genes between D-30 and D-35.
Figure 5-6: Bar chart showing the fold change for each gene of interest between D-28 (basal
diet) and D-30 (1 day post challenge) relative to the housekeeping genes GAPDH and
RPLPO for each individual animal.
0.01
0.1
1
10
100
1000
FC1 FC2 FC3 FC4 FC5 FC6 FS2 FS4 FS5 FS6
Log
fold
ch
ange
CCL11
IL1B
NHE3
TLR4
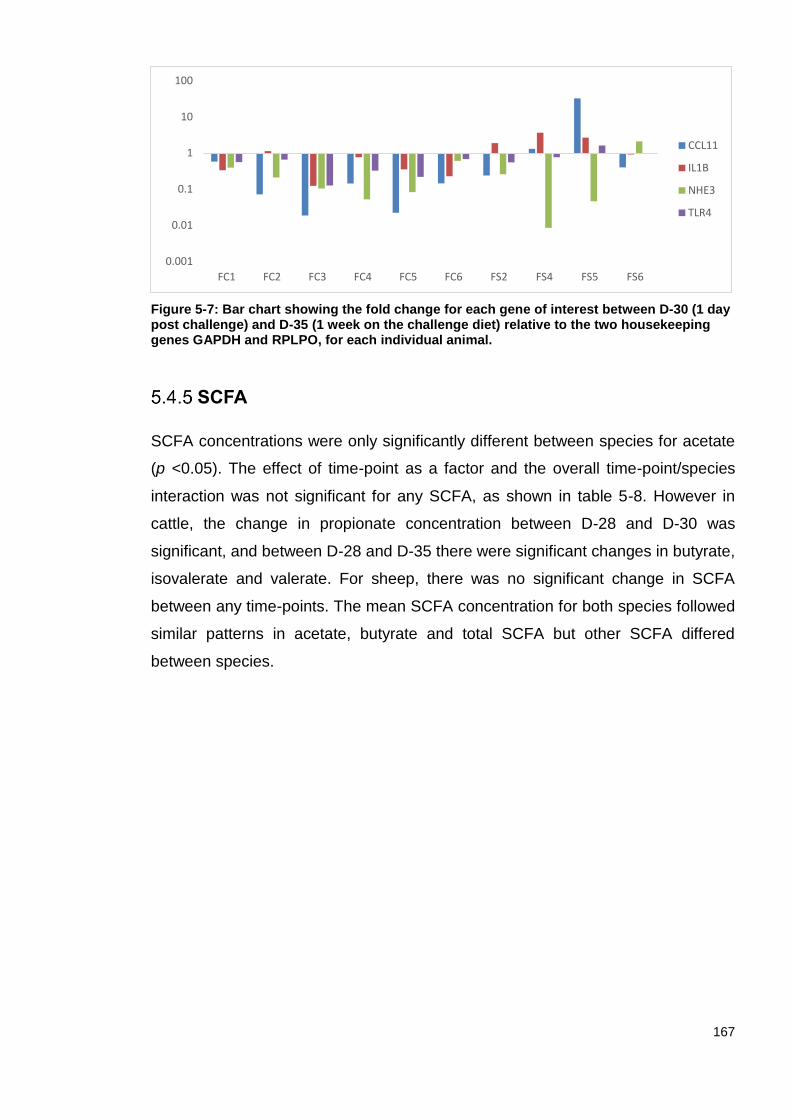
167
Figure 5-7: Bar chart showing the fold change for each gene of interest between D-30 (1 day post challenge) and D-35 (1 week on the challenge diet) relative to the two housekeeping genes GAPDH and RPLPO, for each individual animal.
SCFA
SCFA concentrations were only significantly different between species for acetate
(p <0.05). The effect of time-point as a factor and the overall time-point/species
interaction was not significant for any SCFA, as shown in table 5-8. However in
cattle, the change in propionate concentration between D-28 and D-30 was
significant, and between D-28 and D-35 there were significant changes in butyrate,
isovalerate and valerate. For sheep, there was no significant change in SCFA
between any time-points. The mean SCFA concentration for both species followed
similar patterns in acetate, butyrate and total SCFA but other SCFA differed
between species.
0.001
0.01
0.1
1
10
100
FC1 FC2 FC3 FC4 FC5 FC6 FS2 FS4 FS5 FS6
CCL11
IL1B
NHE3
TLR4

168
Table 5-8: Table showing the effect of time-point, species and their interaction term on SCFA proportions across time-points (one way ANOVA with time-point and species as fixed effects) and the significance of the change in SCFA proportions between D-28 and D-30 and between D-28 and D-35 (t-test, mu = 0).
Significance T-Test significance
Variable Time-point Species
T-P* Species Species
TP-A and TP-B
TP-A and TP-C
Total SCFA (mmol/L) 0.964 0.190 0.435 Cow 0.09 0.1
Sheep 0.07 0.88
Acetate (mmol/L) 0.509 0.044 0.325 Cow 0.12 0.36
Sheep 0.1 0.56
Propionate (mmol/L) 0.398 0.689 0.199 Cow 0.005 0.23
Sheep 0.71 0.44
Isobutyrate (mmol/L) 0.366 0.877 0.164 Cow 0.9 0.15
Sheep 0.41 0.75
Butyrate (mmol/L) 0.426 0.238 0.926 Cow 0.55 0.0009
Sheep 0.22 0.26
Isovalerate (mmol/L) 0.124 0.441 0.010 Cow 0.13 0.0001
Sheep 0.43 0.45
Valerate (mmol/L) 0.294 0.265 0.340 Cow 0.67 0.0003
Sheep 0.37 0.4
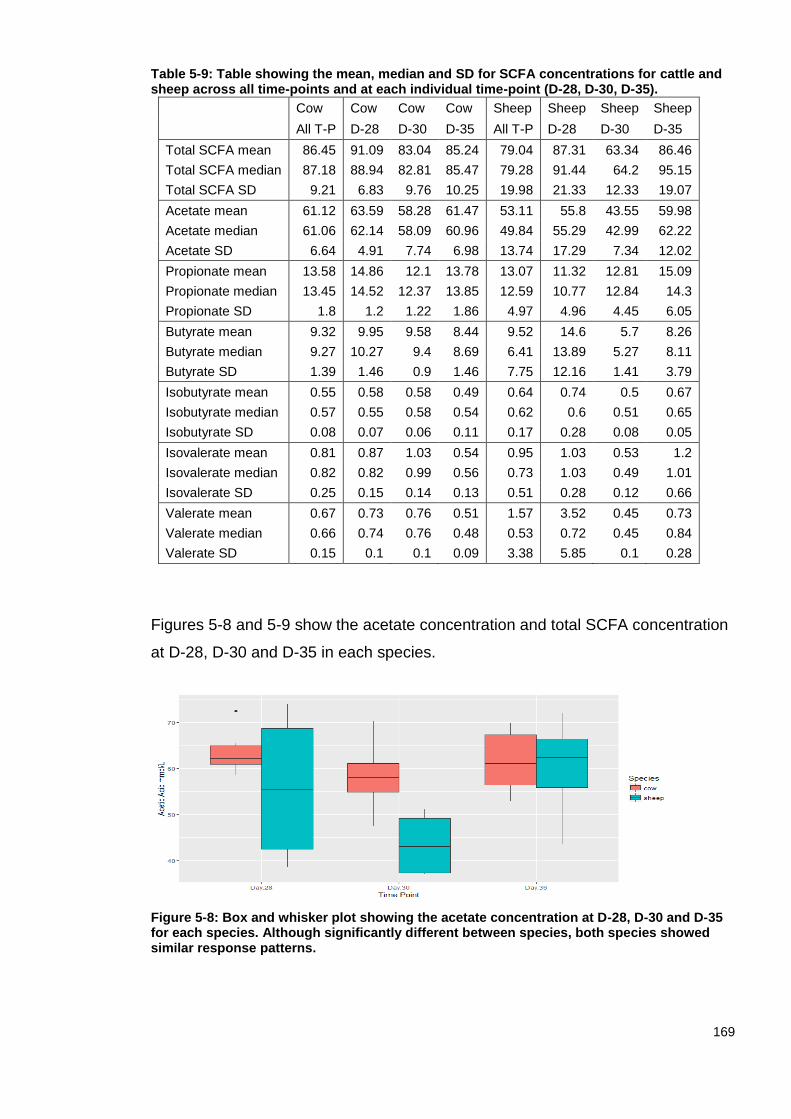
169
Table 5-9: Table showing the mean, median and SD for SCFA concentrations for cattle and sheep across all time-points and at each individual time-point (D-28, D-30, D-35).
Cow Cow Cow Cow Sheep Sheep Sheep Sheep
All T-P D-28 D-30 D-35 All T-P D-28 D-30 D-35
Total SCFA mean 86.45 91.09 83.04 85.24 79.04 87.31 63.34 86.46
Total SCFA median 87.18 88.94 82.81 85.47 79.28 91.44 64.2 95.15
Total SCFA SD 9.21 6.83 9.76 10.25 19.98 21.33 12.33 19.07
Acetate mean 61.12 63.59 58.28 61.47 53.11 55.8 43.55 59.98
Acetate median 61.06 62.14 58.09 60.96 49.84 55.29 42.99 62.22
Acetate SD 6.64 4.91 7.74 6.98 13.74 17.29 7.34 12.02
Propionate mean 13.58 14.86 12.1 13.78 13.07 11.32 12.81 15.09
Propionate median 13.45 14.52 12.37 13.85 12.59 10.77 12.84 14.3
Propionate SD 1.8 1.2 1.22 1.86 4.97 4.96 4.45 6.05
Butyrate mean 9.32 9.95 9.58 8.44 9.52 14.6 5.7 8.26
Butyrate median 9.27 10.27 9.4 8.69 6.41 13.89 5.27 8.11
Butyrate SD 1.39 1.46 0.9 1.46 7.75 12.16 1.41 3.79
Isobutyrate mean 0.55 0.58 0.58 0.49 0.64 0.74 0.5 0.67
Isobutyrate median 0.57 0.55 0.58 0.54 0.62 0.6 0.51 0.65
Isobutyrate SD 0.08 0.07 0.06 0.11 0.17 0.28 0.08 0.05
Isovalerate mean 0.81 0.87 1.03 0.54 0.95 1.03 0.53 1.2
Isovalerate median 0.82 0.82 0.99 0.56 0.73 1.03 0.49 1.01
Isovalerate SD 0.25 0.15 0.14 0.13 0.51 0.28 0.12 0.66
Valerate mean 0.67 0.73 0.76 0.51 1.57 3.52 0.45 0.73
Valerate median 0.66 0.74 0.76 0.48 0.53 0.72 0.45 0.84
Valerate SD 0.15 0.1 0.1 0.09 3.38 5.85 0.1 0.28
Figures 5-8 and 5-9 show the acetate concentration and total SCFA concentration
at D-28, D-30 and D-35 in each species.
Figure 5-8: Box and whisker plot showing the acetate concentration at D-28, D-30 and D-35 for each species. Although significantly different between species, both species showed similar response patterns.

170
Figure 5-9: Box and whisker plot showing the total SCFA concentration at D-28, D-30 and D-35 for each species. Change was not significant between species or overall time-point but both species showed similar responses, tending to decrease at D-30 and increase at D-35.
Histamine and lipopolysaccharide (LPS)
Reticuloruminal fluid (RF) histamine concentration was significantly affected by
overall time-point and species (p <0.05) but not their interaction term, as shown in
table 5-10. Plasma histamine was not significantly affected by overall time-point in
cattle but could not be analysed in sheep using the Abnova kit. The kit uses
antibodies (Ab) which are raised in goats and resulted in non-specific binding. The
sheep plasma bound to nonspecific sites with the goat Ab and disrupted the ELISA.
To attempt to overcome this, a pooled plasma sample was tested alongside mouse
IgG or a phosphate buffered saline/ bovine serum albumin mix (PBS/BSA) to try to
block the non-specific binding sites. However, this was unsuccessful and there were
too many missing and erroneous values to present the data. Ruminal fluid LPS was
significantly different between species (p <0.05) but was not affected by time-point
or the time-point/species interaction term. As shown in table 5-11, in both species
the mean RF histamine increased at D-30 then decreased at D-35 (as did plasma
histamine in cattle).

171
Table 5-10: Table showing the significance of the effect of time-point, species and their interaction on reticuloruminal fluid and plasma histamine concentration and reticuloruminal LPS concentration (one way ANOVA with time-point and species as fixed effects), for both species (plasma histamine only for cattle), across all time-points and the significance of the change between D-28 and D-30 and between D-28 and D-35 (t-test, mu = 0).
Significance T-Test significance
Variable Time-point Species T-P*Species Species D-28 and D-30
D-28 and D-35
RF Histamine (ng/ml) 0.005 0.001 0.438 Cow 0.004 0.078
Sheep 0.217 0.832
Plasma Histamine (ng/ml) 0.775 Cow 0.151 0.451
Sheep
RF LPS (ug/ml) 0.204 0.023 0.335 Cow 0.969 0.092
Sheep 0.760 0.240
Table 5-11: Table showing the mean, median and SD for reticuloruminal fluid and plasma histamine and reticuloruminal LPS for cattle and sheep across all time-points and at each individual time-point (D-28, D-30 and D-35). Plasma histamine could not be determined in sheep.
Cow Cow Cow Cow Sheep Sheep Sheep Sheep
All T-P D-28 D-30 D-35 All T-P D-28 D-30 D-35
RF Histamine mean 2.03 1.83 2.27 2 2.52 2.33 2.94 2.28
RF Histamine median 2.05 1.82 2.29 2.03 2.38 2.33 2.78 2.23
RF Histamine SD 0.27 0.26 0.16 0.19 0.53 0.19 0.72 0.35
Plasma Hist. mean 0.04 0.04 0.02 0.08
Plasma Hist. median 0.03 0.04 0.01 0.04
Plasma Hist. SD 0.68 0.42 0.43 1.08
RF LPS mean 14018 17639 18227 4622.4 60121 91583 79244 9536
RF LPS median 6833.8 13474 5849 5062.8 14418 52033 78207 11615
RF LPS SD 20265 12874 31964 1325.2 80478 114735 72422 6773.9
16S ribosomal RNA sequencing
The results of the phylogenetic whole tree diversity (PD) are shown in figure 5-10.
Results are shown for each animal at D-28 and D-30 (where D0 refers to D-28 and
D2 to D-30) up to 5,000 reads. The results for the majority of animals were clustered
together and did not show a huge range in PD at each time-point, but D-30 (D-2)
results in sheep tended to be lower than in cattle. Table 5-12 shows the values for
rarefaction measure (PD) for each animal at D-28 and D-30 for 5,000 reads. All
animals showed a decrease in PD at D-30, except FC4, which showed a slight
increase. The majority of sheep showed a larger decrease in comparison to the
cattle, with the exception of sheep FS6 who showed a small change in PD.
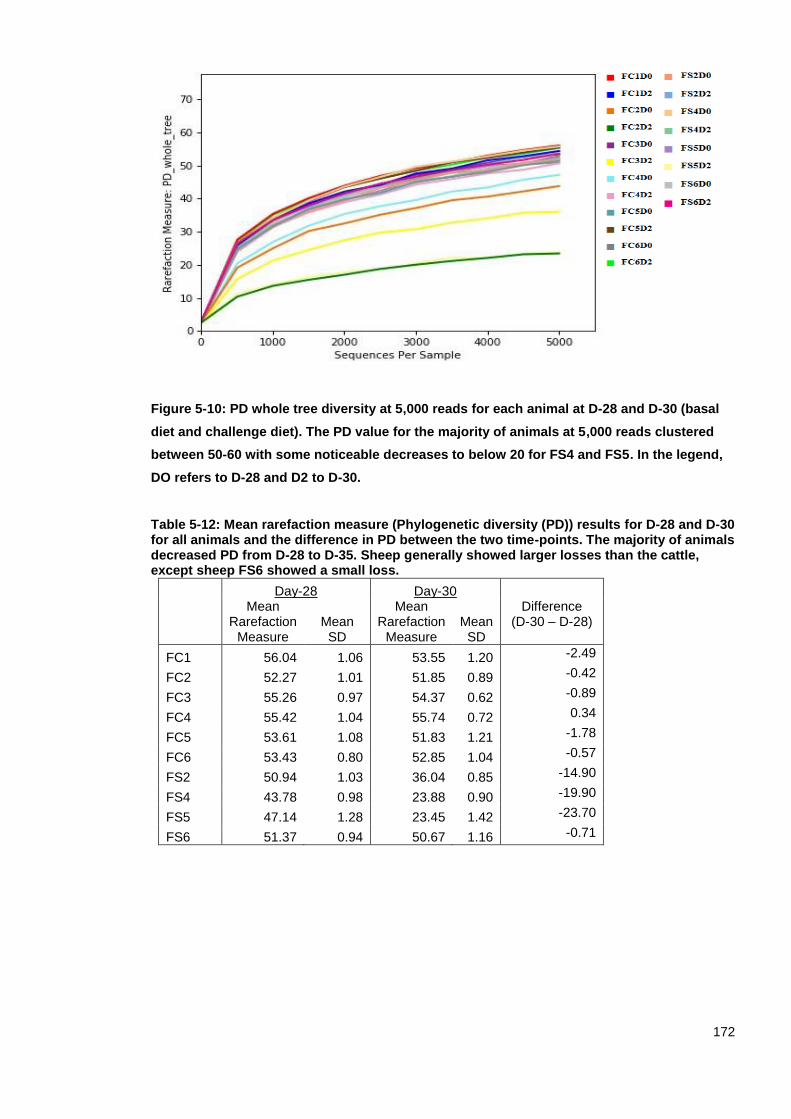
172
Figure 5-10: PD whole tree diversity at 5,000 reads for each animal at D-28 and D-30 (basal
diet and challenge diet). The PD value for the majority of animals at 5,000 reads clustered
between 50-60 with some noticeable decreases to below 20 for FS4 and FS5. In the legend,
DO refers to D-28 and D2 to D-30.
Table 5-12: Mean rarefaction measure (Phylogenetic diversity (PD)) results for D-28 and D-30 for all animals and the difference in PD between the two time-points. The majority of animals decreased PD from D-28 to D-35. Sheep generally showed larger losses than the cattle, except sheep FS6 showed a small loss.
Day-28 Day-30
Mean Rarefaction
Measure Mean SD
Mean Rarefaction
Measure Mean SD
Difference (D-30 – D-28)
FC1 56.04 1.06 53.55 1.20 -2.49
FC2 52.27 1.01 51.85 0.89 -0.42
FC3 55.26 0.97 54.37 0.62 -0.89
FC4 55.42 1.04 55.74 0.72 0.34
FC5 53.61 1.08 51.83 1.21 -1.78
FC6 53.43 0.80 52.85 1.04 -0.57
FS2 50.94 1.03 36.04 0.85 -14.90
FS4 43.78 0.98 23.88 0.90 -19.90
FS5 47.14 1.28 23.45 1.42 -23.70
FS6 51.37 0.94 50.67 1.16 -0.71
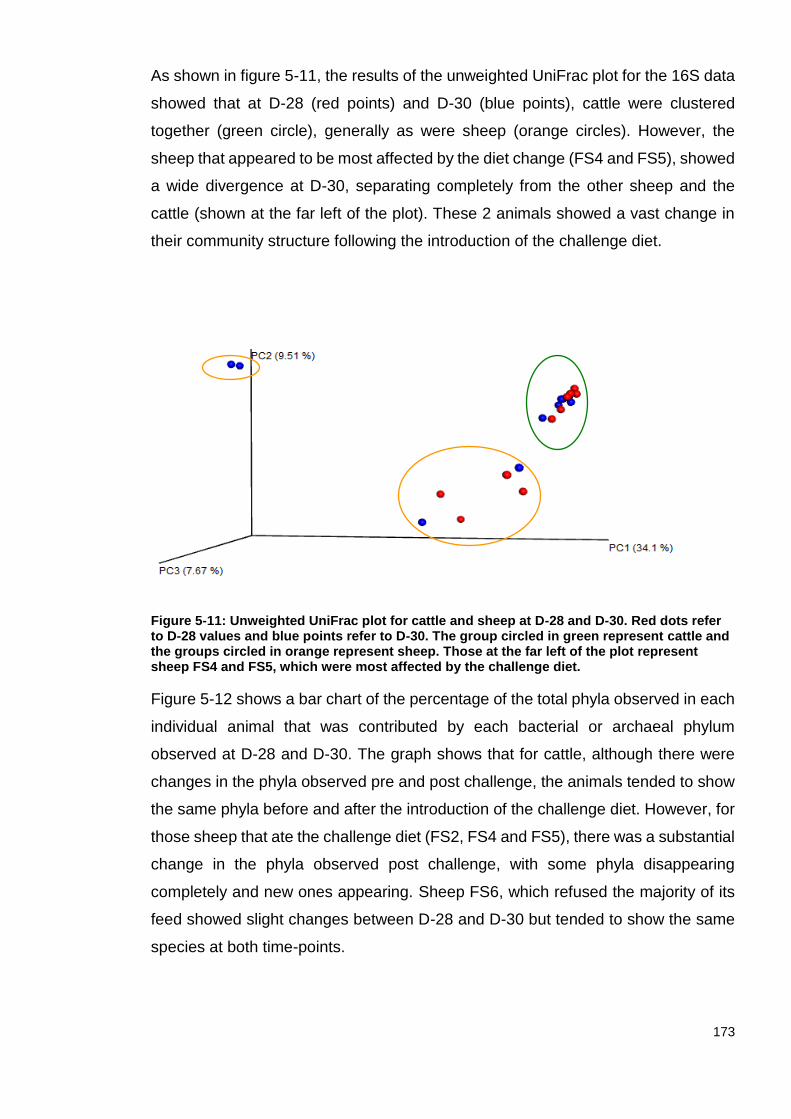
173
As shown in figure 5-11, the results of the unweighted UniFrac plot for the 16S data
showed that at D-28 (red points) and D-30 (blue points), cattle were clustered
together (green circle), generally as were sheep (orange circles). However, the
sheep that appeared to be most affected by the diet change (FS4 and FS5), showed
a wide divergence at D-30, separating completely from the other sheep and the
cattle (shown at the far left of the plot). These 2 animals showed a vast change in
their community structure following the introduction of the challenge diet.
Figure 5-11: Unweighted UniFrac plot for cattle and sheep at D-28 and D-30. Red dots refer to D-28 values and blue points refer to D-30. The group circled in green represent cattle and the groups circled in orange represent sheep. Those at the far left of the plot represent sheep FS4 and FS5, which were most affected by the challenge diet.
Figure 5-12 shows a bar chart of the percentage of the total phyla observed in each
individual animal that was contributed by each bacterial or archaeal phylum
observed at D-28 and D-30. The graph shows that for cattle, although there were
changes in the phyla observed pre and post challenge, the animals tended to show
the same phyla before and after the introduction of the challenge diet. However, for
those sheep that ate the challenge diet (FS2, FS4 and FS5), there was a substantial
change in the phyla observed post challenge, with some phyla disappearing
completely and new ones appearing. Sheep FS6, which refused the majority of its
feed showed slight changes between D-28 and D-30 but tended to show the same
species at both time-points.

174
Figure 5-12: Stacked bar plot showing those phyla observed at D-28 and D-30, for each individual animal and the percentage of the total phyla represented by each for each individual bacteria or archaea present as created in Qiime.
0%
10%
20%
30%
40%
50%
60%
70%
80%
90%
100%
Pe
rce
nta
ge o
f to
tal p
hyl
a o
bse
rve
d
Thermi
WS6
WPS-2
Verrucomicrobia
Tenericutes
TM7
Synergistetes
Spirochaetes
SR1
Proteobacteria
Plantomyctes
Lentisphaerae
LD1
Gemmatimonadetes
GN02
Fusobacteria
Firmicutes
Fibrobacteres
FBP
Elusimicrobia
Cyanobacteria
Chloroflexi
Bacteroidetes
BR1
Armatimonadetes
Actinobacteria
Acidobacteria
Euryarchaeota
Other
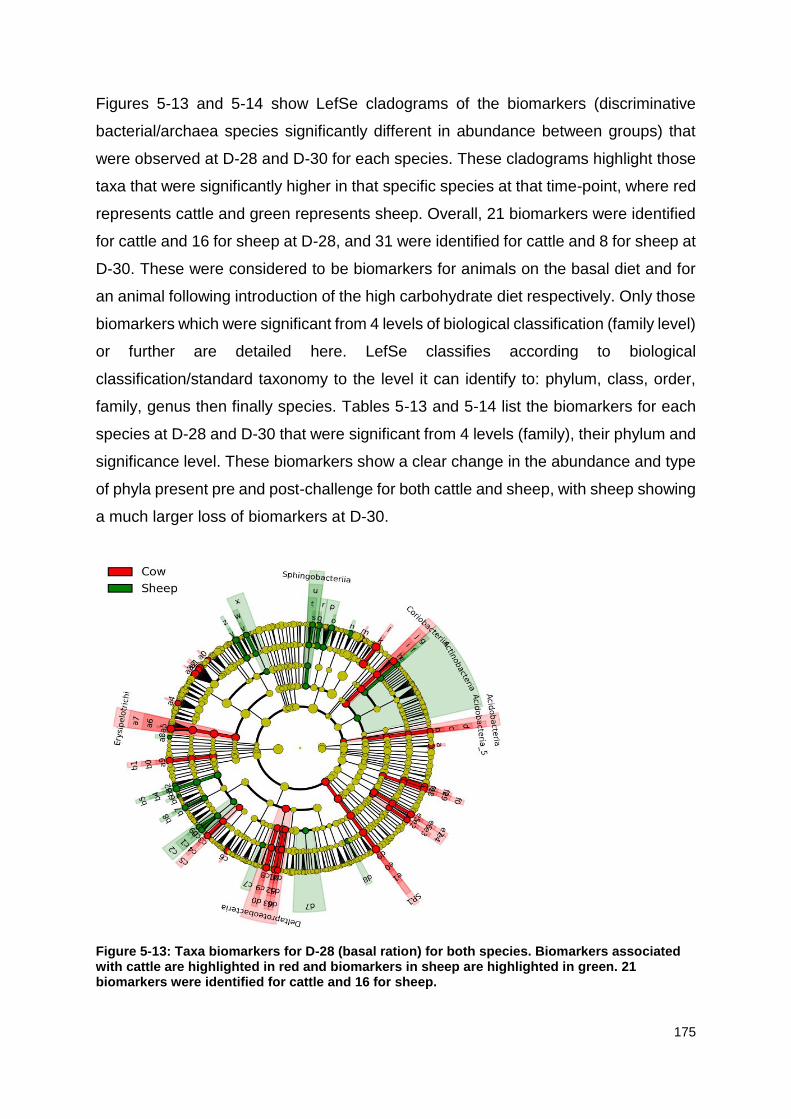
175
Figures 5-13 and 5-14 show LefSe cladograms of the biomarkers (discriminative
bacterial/archaea species significantly different in abundance between groups) that
were observed at D-28 and D-30 for each species. These cladograms highlight those
taxa that were significantly higher in that specific species at that time-point, where red
represents cattle and green represents sheep. Overall, 21 biomarkers were identified
for cattle and 16 for sheep at D-28, and 31 were identified for cattle and 8 for sheep at
D-30. These were considered to be biomarkers for animals on the basal diet and for
an animal following introduction of the high carbohydrate diet respectively. Only those
biomarkers which were significant from 4 levels of biological classification (family level)
or further are detailed here. LefSe classifies according to biological
classification/standard taxonomy to the level it can identify to: phylum, class, order,
family, genus then finally species. Tables 5-13 and 5-14 list the biomarkers for each
species at D-28 and D-30 that were significant from 4 levels (family), their phylum and
significance level. These biomarkers show a clear change in the abundance and type
of phyla present pre and post-challenge for both cattle and sheep, with sheep showing
a much larger loss of biomarkers at D-30.
Figure 5-13: Taxa biomarkers for D-28 (basal ration) for both species. Biomarkers associated with cattle are highlighted in red and biomarkers in sheep are highlighted in green. 21 biomarkers were identified for cattle and 16 for sheep.

176
Figure 5-14: Taxa biomarkers for D-30 (challenge diet) for both species. Biomarkers associated with cattle are highlighted in red and biomarkers in sheep are highlighted in green. 31 biomarkers were identified for cattle and 8 for sheep.
Table 5-13: Table showing the biomarkers identified at D-28 for both species. Phylum and significance level1 are detailed. Those taxa that are listed as “unknown name” were recognised via Greengenes in LefSe but did not have an associated name in the database.
Time-point A
Species Phylum Significance Level
Cow Actinobacteria Family – Coriobacteriaceae
Cow Acidobacteria Genus - unknown name
Cow SR1 Genus - unknown name
Cow Proteobacteria Genus- Various
Cow Firmicutes Genus- RFN20
Sheep Bacteroidetes Family – Sphingobacteriaceae
Sheep Actinobacteria Family – Bifidobacteriaceae
1. Significance level refers to the most specific taxonomic biological classification level that the phylum could be identified down to by
the Greengenes Database in LefSe.
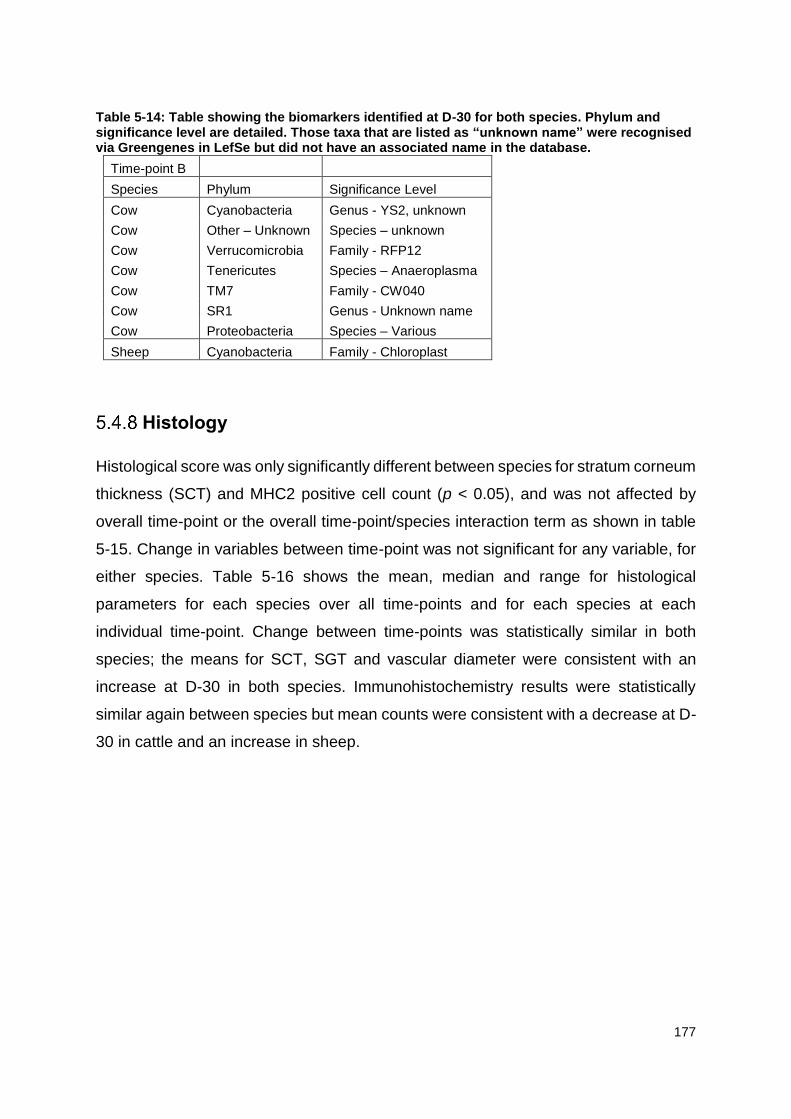
177
Table 5-14: Table showing the biomarkers identified at D-30 for both species. Phylum and significance level are detailed. Those taxa that are listed as “unknown name” were recognised via Greengenes in LefSe but did not have an associated name in the database.
Time-point B
Species Phylum Significance Level
Cow Cyanobacteria Genus - YS2, unknown
Cow Other – Unknown Species – unknown
Cow Verrucomicrobia Family - RFP12
Cow Tenericutes Species – Anaeroplasma
Cow TM7 Family - CW040
Cow SR1 Genus - Unknown name
Cow Proteobacteria Species – Various
Sheep Cyanobacteria Family - Chloroplast
Histology
Histological score was only significantly different between species for stratum corneum
thickness (SCT) and MHC2 positive cell count (p < 0.05), and was not affected by
overall time-point or the overall time-point/species interaction term as shown in table
5-15. Change in variables between time-point was not significant for any variable, for
either species. Table 5-16 shows the mean, median and range for histological
parameters for each species over all time-points and for each species at each
individual time-point. Change between time-points was statistically similar in both
species; the means for SCT, SGT and vascular diameter were consistent with an
increase at D-30 in both species. Immunohistochemistry results were statistically
similar again between species but mean counts were consistent with a decrease at D-
30 in cattle and an increase in sheep.

178
Table 5-15: Table showing the significance of overall time-point, species and their interaction term on histological parameters (GLM) and the significance of the change in values for histological parameters between D-28 and D-30 and D-28 and D-35 (t-test, mu = 0).
Significance T-Test significance
Variable Time-point Species
T-P*Species Species
TPA and TPB
TPA and TPC
SCT 0.62 0.01 0.67 Cow 0.05 0.53
Sheep 0.19 0.48
SGT 0.80 0.17 0.52 Cow 0.87 0.57
Sheep 0.34 0.31
VASCD 0.06 0.13 0.23 Cow 0.14 0.05
Sheep 0.13 0.12
CD3 0.90 0.30 0.66 Cow 0.62 0.83
Sheep 0.13 0.90
MHCII 0.26 0.001 0.26 Cow 0.11 0.11
Sheep 0.73 0.78
Table 5-16: Table showing the mean, median and SD for histological parameters for cattle and sheep across all time-points, and at each individual time-point (D28, D-30 and D-35).
Cow Cow Cow Cow Sheep Sheep Sheep Sheep
All T-P D-28 D-30 D-35 All T-P D-28 D-30 D-35
SCT mean 3.24 3.24 3.45 3.05 8.85 5.06 15.63 5.87
SCT median 3.13 3.13 3.31 2.93 5.96 4.72 14.89 5.47
SCT SD 0.57 0.78 0.56 1.21 7.94 1.24 12.32 2.56
SGT mean 35.32 34.68 35.04 36.25 40.88 38.70 46.90 37.05
SGT median 34.20 32.77 35.38 35.35 36.30 33.45 45.48 36.74
SGT SD 5.71 7.35 6.30 14.35 12.55 13.56 16.65 9.72
VASCD mean 15.48 11.22 18.42 16.79 20.43 13.62 21.24 26.42
VASCD median 13.09 12.23 14.99 16.86 17.96 14.38 20.46 24.01
VASCD SD 7.21 2.30 11.50 7.29 8.59 4.45 7.49 10.43
CD3 mean 57.72 59.00 53.33 60.83 72.75 64.75 85.75 67.75
CD3 median 60.00 58.50 53.50 64.50 74.00 63.00 89.00 70.50
CD3 SD 13.54 16.99 12.56 26.00 19.94 26.61 16.09 16.70
MHCII mean 63.78 77.00 57.33 57.00 28.00 24.25 31.75 28.00
MHCII median 61.50 82.00 60.00 48.50 23.00 19.50 31.00 25.50
MHCII SD 17.37 17.39 12.36 26.98 15.84 21.23 20.82 9.06
Figures 5-15 and 5-16 show the significant difference between species in the
changes observed in SCT and MHC2 across time-points. SCT showed a wide range

179
of values in sheep at D-30 in comparison to cattle.
Figure 5-15: Box and whisker plot showing average stratum corneum thickness at D-28, D-30
and D-35 for each species. Difference between species was significant.
Figure 5-16: Box and whisker plot showing the average MHC2 positive count at D-28, D-30 and D-35 for each species. Difference between species was significant.
For categorical variables, the sample numbers were not compatible with effective Chi-
squared testing. Tables 5-17 and 5-18 show the count for each categorical score for
each of the categorical variables as a proportion of the total, for all cattle and all sheep
across all time-points, and the count for each score for each species at each time-
point. Stratum corneum integrity scores (SCINT) appeared to be lower in cattle than
sheep and sheep showed no microabscesses in any samples.
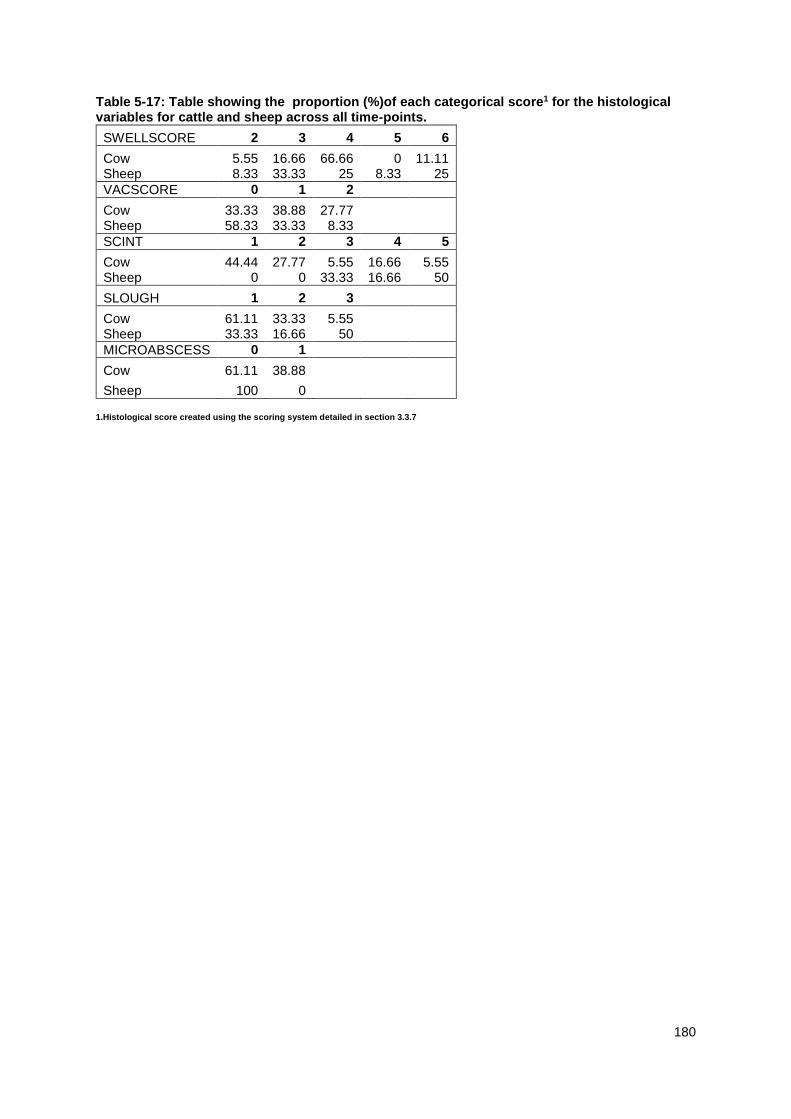
180
Table 5-17: Table showing the proportion (%)of each categorical score1 for the histological variables for cattle and sheep across all time-points.
SWELLSCORE 2 3 4 5 6
Cow 5.55 16.66 66.66 0 11.11 Sheep 8.33 33.33 25 8.33 25
VACSCORE 0 1 2
Cow 33.33 38.88 27.77 Sheep 58.33 33.33 8.33
SCINT 1 2 3 4 5
Cow 44.44 27.77 5.55 16.66 5.55 Sheep 0 0 33.33 16.66 50
SLOUGH 1 2 3
Cow 61.11 33.33 5.55 Sheep 33.33 16.66 50
MICROABSCESS 0 1
Cow 61.11 38.88
Sheep 100 0
1.Histological score created using the scoring system detailed in section 3.3.7

181
Table 5-18: Table showing the proportion (%) of each categorical score1 for the histological variables for each species for each sampling day.
SWELLSCORE 2 3 4 5 6
Cow D-28 0 16.66 66.66 0 16.66 Cow D-30 0 16.66 66.66 0 16.66 Cow D-35 16.66 16.66 66.66 0 0 Sheep D-28 0 50 25 0 25 Sheep D-30 25 25 25 0 25 Sheep D-35 0 25 25 25 25
VACSCORE 0 1 2
Cow D-28 33.33 33.33 33.33 Cow D-30 50 0 50 Cow D-35 16.66 83.33 0 Sheep D-28 50 50 0
Sheep D-30 75 25 0 Sheep D-35 50 25 25
SCINT 1 2 3 4 5
Cow D-28 33.33 50 0 0 16.66 Cow D-30 66.66 16.66 16.66 0 0 Cow D-35 33.33 16.66 0 50 0 Sheep D-28 0 0 0 25 75 Sheep D-30 0 0 25 0 75 Sheep D-35 0 0 75 25 0
SLOUGH 1 2 3
Cow D-28 50 50 0 Cow D-30 66.66 16.66 16.66 Cow D-35 66.66 33.33 0
Sheep D-28 25 25 50 Sheep D-30 0 25 75 Sheep D-35 75 0 25
MICROABSCESS 0 1
Cow D-28 83.33 16.66 Cow D-30 50 50 Cow D-35 50 50 Sheep D-28 100 0 Sheep D-30 100 0 Sheep D-35 100 0
1 Histological score as scored using the scoring system detailed in section 3.3.7
182
Discussion
The main objectives of this study were to determine the extent to which sheep and
cattle varied in their responses to a challenge diet high in rapidly fermentable
carbohydrates and thus, to what extent sheep should be used as a model for dietary
manipulation in cattle, and to provide baseline data on the comparative 16S
microbiome of sheep and cattle.
The challenge diet was formulated using an allometric scaling technique that
considered the surface area and rumen capacity of sheep and cattle, resulting in a 5-
fold increase in barley proportion for cattle and a 10-fold increase for sheep. Gut
capacity is a constant proportion of body weight in mammalian herbivores (Clauss et
al., 2007, Weckerly, 2010) and the isometric scalar of gut capacity, in relation to the
allometric scalar of metabolic rate, has been shown to explain differences in digestive
efficiency among various herbivore species (Han et al., 2015). Larger species have
greater gut capacity, a higher feed intake, and should be expected to retain digesta
for longer in the reticulorumen for fermentation (Clauss et al., 2007). From the overall
reaction to the diet, feed refusals, ruminal content appearance/smell and clinical
observations, sheep appeared to be considerably more affected in the challenge
period in comparison to the cattle. Immediately post challenge (D-30), sheep FS6
showed noticeable changes in the appearance of her rumen contents, which persisted
throughout the challenge week and she refused the majority of her ration from the
beginning of the challenge week. As a result of the very high continued refusal of food
over the challenge week, changes in parameters in sheep FS6 could not be attributed
to a result of the challenge diet. Initially it was proposed that from the acute acidosis-
type reaction and immediate refusal observed in sheep FS6 to the first day of the
challenge ration, that she was possibly accidentally double fed her grain ration.
However, as FS6 did not show decreased pH, it appears another factor was affecting
her. There was no significant effect on any results by excluding FS6 from analysis and
therefore she was left in for the analyses. Although sheep FS6 was the only sheep
who showed such a marked and swift change in her rumen content appearance and
an immediate refusal of the diet, all sheep refused a large majority of their challenge
ration throughout the challenge week. In comparison, no cattle refused feed at any
point throughout the challenge week and there were no obvious clinical symptoms of

183
any ill effects of the challenge diet in the cattle. . This clear difference in the refusal
rate of the sheep and cattle in response to the challenge diet could reflect a species
difference, or more likely could reflect an inaccuracy in the scaling calculations of the
diets, leading to a greater challenge for the sheep in comparison to the cattle. The
feed refusal observed in sheep is an expected possible consequence of voluntary
feeding in challenge studies versus involuntary feeding. As the animals in this trial
were all fistulated, it would have been possible to carry out an involuntary feeding
challenge where grain was introduced directly into the rumen via the fistula or leftover
feed was introduced directly, as is common practise in many studies (Keunen et al.,
2002, Chiquette, 2009, Dionissopoulos et al., 2012). However, involuntary feeding
does not allow direct comparison of results to results observed on farm and eliminates
the adaptive mechanisms of saliva production from chewing the ration. To allow a
direct comparison between scientific studies and on-farm practice, the trial needs to
reflect those practices observed on farm as closely as possible.
Reticuloruminal pH was significantly different between time-points and species and
differed significantly among individuals. Sheep showed a much wider range in
reticuloruminal pH at D-30 in comparison to cattle and consistently had a lower mean
pH across the trial. Only sheep showed a pH below 6 at any point in the trial, with
increased hours spent below pH 6 at D-30 and two sheep showing minimum values
of pH 5.1 and pH 4.23. Both of these minimum pH observations in the sheep would be
considered to be acidotic and have SARA by standard definitions in the literature (<
pH5.5 (Garrett et al., 1999), < pH5.6 (Cooper et al., 1999, Gozho et al., 2005),
< pH6 (Plaizier, 2004)), but the pH minimum values observed in cattle would not.
Although cattle did not show substantial changes in pH across the trial, both species
significantly decreased pH between D-28 and D-30 and both increased significantly
between D-30 and D-35. This suggests an initial effect of the challenge diet in both
species at D-30, though more severe in sheep, and a compensatory effect raising the
pH at D-35. This pattern, although more pronounced in sheep, followed the pattern
reported in numerous SARA challenge studies, such as Steele et al (2011). This
previous study reported an initial reduction, followed by a gradual increase when dairy
cattle were suddenly changed to a diet high in rapidly fermentable carbohydrates. As
pH is strongly linked with SCFA proportions and absorptions, the severity of this pH
decrease and following increase, could be expected to follow the changes observed
184
in SCFA proportions and changes in microbial communities and diversity (Penner et
al., 2009b).
The concentration of SCFA in the reticulorumen is a function of SCFA production from
carbohydrate fermentation and the removal of SCFA from the rumen via absorption
through the rumen wall or passage through to the omasum in the liquid phase (Peters
et al., 1990). As the proportion of rapidly fermentable carbohydrates in the diet
increases, so too does the production of SCFA (from the fermentation of these
carbohydrates) and the corresponding rate of absorption of SCFA through the rumen
wall. Therefore, high SCFA concentrations in the reticulorumen can arise as a result
of high production of SCFA, low rate of removal of SCFA or any combination of these
which results in accumulation. Only the change in propionate and butyrate was
significant in cattle between D-28 and D-30 and D-28 and D-35 respectively, both
decreasing across each time-point. The reduction in propionate between D-28 and D-
30 was initially unexpected from the literature (Plaizier et al., 2008, Dijkstra et al., 2012)
but was consistent with the observations in the study described in chapter 4, as well
as being consistent with the findings at post-mortem in animals on high and low
concentrate beef finishing diets described in chapter 3. However, it is hypothesised
that the decreased propionate noted in this trial in cattle between D-28 and D-30
occurred as a result of rapid adaptation to high SCFA concentration and increased
rate of absorption of SCFA via the rumen wall. Any reduction in SCFA after the
challenge would be consistent with the significant increase in the relative expression
of NHE3 in the rumen epithelium after the introduction of the challenge diet. NHE3
relative expression tended to increase in all animals between D-28 and D-30, with the
exception of FS6, which did not follow similar response patterns to any other animal.
As discussed in chapter 3, increased absorption of SCFA is thought to occur via
increasing the surface area of the rumen epithelium which in turn leads to an increase
in the activity and therefore relative expression, of ion exchangers such as NHE3
(O’Shea et al., 2016). Although not a significant change, the mean total SCFA
observed for each species showed a decrease between each time-point, as observed
in chapters 3 and 4 as concentrate in the diet increased.
LPS is a component of the outer membrane of gram-negative rumen bacteria,
released during bacterial lysis occurring as a result of decreased reticuloruminal pH
185
(Gozho et al., 2007). LPS has been shown to migrate from the rumen into circulation
as a result of failure of the rumen epithelial tight junctions, due to decreased
reticuloruminal pH, where it is capable of eliciting a host immune response (Plaizier et
al., 2012). The release of LPS is associated with grain induced SARA and has been
shown not to occur as a result of SARA induced with other carbohydrate sources such
as alfalfa hay pellets (Khafipour et al., 2009, Li et al., 2012b). LPS concentrations
observed in this trial were significantly higher in sheep than cattle across the whole
trial but did not vary significantly between time-points for either species despite the
significant pH decreases noted in both species. LPS results have been shown to be
extremely varied between individuals in previous studies, such as those in chapter 3
and 4, so this variation could reflect true individual variation in animals. The wide
variation between species and individual animals suggests that LPS concentration
may not be a suitable variable for quantifying the effect of challenge diets. The LPS
concentrations in this study did not reflect the large pH drop noted in sheep at D-30
as expected.
As with reticuloruminal LPS, reticuloruminal fluid histamine is also of ruminal bacterial
origin and is produced as a result of decarboxylation of histidine by ruminal bacteria
(Wicki and Schatzmann, 1977). Histamine is commonly measured in SARA/acidosis
studies due to the proposed relationship between ruminal acidosis and bovine laminitis
and the possible causative effect of histamine in the development of bovine laminitis
(Nocek, 1997) as a result of decreased reticuloruminal pH (Dain et al., 1955, van der
Horst, 1961, Irwin et al., 1979). Additionally, histamine producing bacteria have been
shown to be present in high numbers in grain fed animals but were undetectable or
present in low concentrations in forage fed animals (Garner et al., 2002). In this study,
reticuloruminal fluid histamine level was significantly affected by time-point, but the
increase was only significant between D-28 and D-30 for cattle, and was significantly
different between species, with sheep showing a higher mean concentration over all
time-points. The mean reticuloruminal fluid histamine concentration for both species
followed the same pattern, increasing between D-28 and D-30 and decreasing
between D-30 and D-35. Plasma histamine was only analysed in cattle and was not
significantly different between any time-points.

186
Overall, it was expected that given the severity of their pH and appetite responses,
sheep would show significantly higher concentrations of LPS in comparison to cattle.
However, the lack of increase noted in LPS in sheep at D-30 could reflect the fact that
LPS concentrations are dependent on the types of bacteria present in the rumen to
begin with; it is possible that gram-negative bacteria were lower in sheep in
comparison to cattle at this point as a result of the diet change.
The results for both species for reticuloruminal pH, SCFA and histamine were broadly
consistent with each other. However, the results from the 16S sequencing showed a
larger variation between the 2 species, particularly at D-30, following the dietary
challenge. 16S ribosomal RNA (rRNA) sequencing is a commonly used and well-
established method for studying phylogeny and taxonomy of samples from complex
microbiomes, used to identify and compare bacteria present within a given sample.
Unlike PCR-based approaches, next-generation sequencing (NGS) allows for a
culture free method, which allows for analysis of the total microbial community in a
sample (Illumina, 2016).
The 16S results were consistent with initial observations that sheep were more
affected by the introduction of the challenge diet than cattle. The introduction of the
challenge diet resulted in a larger loss of diversity in the ruminal microbiome in sheep
than in cattle. Previous studies have shown that there is a core microbiome present in
ruminants, regardless of host species (Henderson et al., 2015). In this study, the 2
main bacterial phyla present at both time-points, in both species, were Firmicutes and
Bacteroidetes, consistent with the idea of a core microbiome. Beyond this similarity,
substantial differences were observed in the phyla present in the two species, shown
clearly in phyla taxa summaries. In cattle, there was variation between animals but the
variation was not large. In sheep, as well as large pre and post-challenge variation,
each animal showed more variation over time than each of the cows. UniFrac plots
showed that cattle and sheep, despite changes in their overall pre and post-challenge
microbiome, were relatively closely grouped before and after challenge. The 2 sheep
which showed the lowest pH also showed a wide divergence between pre and post-
challenge UniFrac grouping, again suggesting that these animals were affected very
strongly by the dietary change and therefore that their rumen environment was very
different to the rest of the animals.

187
LefSe biomarkers were as expected at D-28. In cattle at D-28, 5 biomarkers were
identified from the phyla Actinobacteria, Acidobacteria, SR1, Proteobacteria and
Firmicutes. The biomarkers observed in cattle at D-28 were as expected and many
were common phyla previously associated with cattle fed a range of diets including
pasture and TMR fed cattle (de Menezes et al., 2011) and high forage and high starch
(Thoetkiattikul et al., 2013) and so were not surprising biomarkers at D-28. Other
biomarkers observed such as Proteobacteria have been shown to be present in cattle
from pre-weaning (Malmuthuge et al., 2014), in goats on a high hay diet (Liu et al.,
2015) and are commonly found in adult cattle on a range of diets, but tended to be
found in higher percentages in high or moderately high forage diets in comparison to
high grain (Petri et al., 2014). The only biomarker at D-28 which was unexpected was
phylum Firmicutes, genus RFN20. RFN20 has been shown to be higher in dairy heifers
fed a high grain diet (De Nardi et al., 2016) and in cattle fed a higher proportion of
grain in comparison to forage diets (Pitta et al., 2014). A bacterial genus present at D-
28, which shows a relationship with high grain, was unexpected, as the other
biomarkers for cattle were associated with a higher forage diet. The presence of a
genus associated with higher grain levels could perhaps mean that the cattle were fed
a higher grain percentage prior to the beginning of the basal diet than expected and
their rumen environment was still suitable for high grain associated bacteria.
At D-28 in sheep, 2 phyla were identified as biomarkers, Bacteroidetes and
Actinobacteria. The presence of these biomarkers in sheep at D-28 was expected, as
they have been shown in previous studies to be the dominant phyla in sheep fed on a
maintenance, basal diet and have been shown to be present in higher proportions in
animals fed a diet higher in forage (grass silage) (Dryden et al., 1962), fitting with the
D-28 diet.
At D-30 in cattle, 7 phyla were considered as biomarkers. Many of the phyla
considered as biomarkers have previously been shown to increase in cattle fed on a
mixed straw and concentrate diet (Zhao et al., 2015) and are common in the rumen
microbiome (Ametaj et al., 2010, Li et al., 2012a). For example, Verrucomicrobia and
Anaeroplasma have been shown to significantly increase in goats fed diets with
increased concentrate proportions (Shen et al., 2016) and have been shown to
increase during a period of high grain feeding in cattle, intended to induce SARA (Jami

188
et al., 2013) fitting with the challenge diet fed. One of the biomarkers observed in cattle
at D-30, Anaeroplasma, has been shown to decrease in cattle fed a high concentrate
(70%) diet intended to induce acidosis (De Nardi et al., 2016) and are known to have
a poor tolerance for low ruminal pH. Their presence suggests that SARA was not
induced in the cattle, or more specifically that their pH did not reach extreme levels –
fitting with the pH traces observed (Loor et al., 2016). Other biomarkers noted at D-30
in cattle have been shown to increase in cattle fed a diet of grain and alfalfa hay plus
histidine (Golder et al., 2014), have been shown to be present in dairy cattle fed a 70%
concentrate diet (Jami et al., 2014) and have been shown to be higher in cows after
an initial short SARA challenge diet in comparison to a longer period on a diet intended
to induce SARA (Wetzels et al., 2016), fitting with the short period of time cattle were
exposed to the challenge diet during this study.
In sheep, at D-30 only 1 phylum was significantly higher in sheep and considered as
a biomarker. Phylum Cyanobacteria was significant down to the family Chloroplast and
order Streptophyta. Sequences recovered from the family Chloroplast originate from
plant cells and so Streptophyta present in the family Chloroplast are present either
due to consumption of forage (Kim et al., 2014) or are present due to colonisation of
barley prior to ingestion. As the barley and the straw bedding was not sterilised prior
to the trial, any unexpected bacteria which appeared in the 16S results may have
occurred from the barley or surroundings. Without sequencing both the barley and
swabs from the environment this cannot be confirmed. However, the fact that this was
the only phylum significantly higher in sheep at D-30 suggests that the loss of diversity
seen in sheep as a result of the diet change was so extreme that their microbiome
levels were vastly depleted in comparison to cattle. Overall, 16S results for both
species showed a negative effect of the challenge diet which was far more severe in
sheep but the grouping of the species in the UniFrac plots suggest that overall the
core microbiome and responses were similar between species.
An increase in the expression of inflammation-related genes in the ruminal epithelium
has previously been shown in cattle fed a diet high in rapidly fermentable
carbohydrates, specifically those diets high in grain (Zhang et al., 2016). Grain induced
SARA has been shown to increase levels of acute phase proteins, such as haptoglobin
and serum amyloid A (SAA), as studied in chapter 4, indicating a systemic
189
inflammatory response in cattle (Gozho et al., 2007). This systemic inflammatory
response is thought to partially occur as a result of the previously mentioned
translocation of LPS and histamine, due to disruption of the rumen epithelial barrier
function and increased permeability of the rumen epithelium due to decreased
reticuloruminal pH, though the mechanisms are not clear (Emmanuel et al., 2007,
Plaizier et al., 2008, Klevenhusen et al., 2013). As described by Zhang et al, following
disruption of the rumen epithelial barrier, lymphoid tissue associated with the rumen
epithelium, including innate lymphoid cells and mast cells (Kurashima et al., 2013)
respond by triggering local inflammation of the rumen epithelium and increasing
cytokine production (Mani et al., 2012, Kurashima et al., 2013). This previously
mentioned study by Zhang et al investigated the effects a high concentrate diet and
low concentrate diet on the expression of inflammatory related genes in the rumen
epithelium. Those genes studied included interleukin and C-C motif cytokines, as
studied in this current trial. Zhang et al found that in cattle fed a high concentrate diet,
expression of inflammation related genes was up-regulated, indicating local
inflammation in the rumen epithelium and a corresponding immune response (Zhang
et al., 2016). Additionally, the expression of interleukins was shown to increase with
increased LPS and lowered pH suggesting the combination of these two factors is
important in the bovine rumen immune response (Zhang et al., 2016). This increased
expression of inflammation related genes has been associated with decreased feed
intake and a decrease average daily body weight gain in cattle, particularly in those
animals with increased expression of IL1β (Hagg et al., 2010).
In this study, CCL11, IL1β, NHE3 and TLR4 were studied further. As previously
mentioned, levels of expression of C-C motif cytokines and interleukins such as
CCL11 and IL1β, have been shown to increase as a result of dietary induced
inflammation in the rumen. CC11 is a member of the C-C class of chemokines
expressed predominantly by T cells and monocytes, which are associated with chronic
inflammation that occurs over a period of weeks or years (White et al., 2013). IL1B is
a pro-inflammatory cytokine that plays a role in acute and chronic inflammation, has
been associated with pain and autoimmune conditions and aids in antibody production
by acting as a growth factor for B cell proliferation (Ren and Torres, 2009). NHE3,
although not involved in an immune/inflammatory response was investigated due to
its previously mentioned positive relationship with increased SCFA absorption.
190
Increased absorption of SCFA is thought to be achieved through increasing the
epithelial surface, increasing the surface area for SCFA absorption that subsequently
leads to an increase in the expression of ion exchangers such as NHE transporters
(Graham and Simmons, 2004;Henderson et al., 2015; O’Shea et al., 2016). It is known
that toll-like receptor 4 (TLR4) can recognise by-products of bacterial fermentation,
such as LPS, and stimulates the host circulatory and rumen epithelial immune
response, as well as promoting the proliferation of epithelial cells and barrier function
of intestinal epithelium (Abreu, 2010). TLR4 can recognise LPS due to its high
specificity for the lipid-A portion of LPS ( Park and Lee, 2013). Dysregulation of this
process can cause chronic inflammatory responses and epithelial barrier dysfunction
(Abreu, 2010). Therefore, increased TLR4 expression indicates not only initiation of
innate responses via LPS but may aid in protecting the rumen epithelium by increasing
epithelial proliferation, which in turn could lead to an increase in NHE3 expression.
In the present study, between D-28 and D-30, only the increase in NHE3 was
significant for cattle and the change in IL1β tended toward a significant increase in
both species. Between D-30 and D-35, expression levels were significantly different
for IL1β in both species, decreasing and NHE3 decreased in cattle and NHE3 tended
towards a significant decrease in sheep. Sheep FS6, which refused the largest
proportion of the challenge ration from the beginning of the trial, showed the smallest
changes in gene expression of all animals studied. Overall, the response in gene
expression levels for both species were broadly similar and tended to follow the same
patterns expected from the literature, showing a pro-inflammatory effect of the
challenge diet, increasing initially and then decreasing after a longer period exposed
to the diet.
Histological scoring of rumen papillae biopsy, using the scoring system created for
chapter 3, showed significant differences between species only for average stratum
corneum thickness (SCT) and MHC2 count. No histological parameters were
significantly different between time-points and no other parameters were affected by
species or the overall time-point/species interaction term. There is no previous work
detailing comparative histology of sheep and cattle maintained on the same diet to
allow comparison, but this present study found that the mean score for all continuous
histological parameters was higher in sheep than in cattle, except for MHC2 count.

191
However, no change in MHC2 was significant so this was not investigated further. This
higher mean in sheep could reflect the more severe response observed in sheep, as
increased SCT, SGT and vascular diameter have been associated with a grain fed
diet in cattle and lambs (Hinders and Owen, 1965, Steele et al., 2012). Although not
significant, it was noted that the mean score for the majority of histological parameters
in both species increased at D-30 and decreased at D-35, suggesting a slight, but
rapid histological change in the rumen of both species as a result of dietary
manipulation. As the samples collected from the ruminal biopsy contained only
papillae samples, it was not possible to carry out the full range of scoring on the
samples collected in this study. If the full rumen wall had been collected and a wider
range of histological parameters scored, there may have been a more significant
change in variables between time-points. For the categorical histological variables, the
main difference between the 2 species was a higher stratum corneum integrity score
in sheep and a lack of microabscess in sheep. A higher SC integrity score reflects
poorer SC integrity with the majority of papillae in the sample showing SC vacuolation
and interruption to the SC. This higher score in sheep was noted in samples from D-
28 and so could not be attributed to the challenge diet alone and may simply be part
of the normal appearance of the sheep rumen. Microabscesses, although found only
to be present in cattle, were not thought to be of major importance. Little is known
about the presence or absence of microabscess and they were suggested in a study
into reindeer rumen pathology to arise due to forage scratching the rumen epithelium
and allowing bacterial entry (Josefsen et al., 1997). The histological results suggest
that overall, as the majority of parameters did not vary significantly between species,
the histological response of the rumen epithelium is likely to be comparable between
species. However, as sheep had a higher mean score for the majority of parameters,
it may not be possible to directly compare scores, rather the pattern observed.
Histological scoring of both species using the full rumen wall – to allow full use of the
scoring system - and a larger sample set would allow a better understanding of
whether the histological responses were comparable between species.
Of the haematological variables studied, the majority were significantly affected by
species. In cattle, the majority of variables were significantly different between D-28
and D-30 and D-30 and D-35. In sheep only neutrophil and PDW were significant
between D-30 and D-35. Surprisingly, despite sheep showing more clinical symptoms
192
and a bigger decrease in pH, cattle showed a more pronounced haematological
response. However, the mean values for all variables tended to follow the same
patterns. The fact that so many variables were significantly different between species
was expected, as it is well established that the normal range for parameters varies
between cattle and sheep (Jackson and Cockcroft, 2007). Therefore, the significance
of the change in each variable between time-points according to the t-test was
compared, rather than the value for each variable itself.
RBC count and haemoglobin (Hb) increased significantly in cattle from D-28 to D-30
then increased again from D-30 to D-35. In sheep, the mean for both RBC and Hb
followed a similar pattern between D-28 and D-30 but not D-30 and D-35 but change
was not significant. An increase in RBC and Hb was previously noted in the trial
detailed in chapter 4 after the introduction of a challenge diet. It is hypothesised that
the increase in both RBC count and Hb arises due to increased osmotic pressure in
the rumen. An increase in osmolarity would cause water to move from the circulation
into the rumen, resulting in a higher RBC count and Hb level in the blood. Increased
ruminal osmotic pressure as a result of increased concentrate feeding has been noted
previously (Bennink et al., 1978). This would also account for the statistically significant
increase in haematocrit (Hct) in cattle between D-28 and D-30 and between D-30 and
D-35 and the tendency in sheep for the mean Hct to be increased and D-30. Increased
RBC, Hb and HCT has been shown previously in heifers induced with SARA
(Marchesini et al., 2013), suggesting that the diet was challenging both species. Mean
cell volume (MCV) did not change greatly for either species at any time-point, which
was expected, as it should not be affected by increased osmotic pressure in the rumen.
The mean overall white blood cell (WBC), neutrophil, lymphocyte, monocyte and
eosinophil counts followed the same patterns in both species at both D-30 and D-35.
However, change was only significant in cattle between D-28 and D-30 for neutrophil
and monocyte count and between D30 and D-35 for WBC and neutrophil count. For
sheep, change was significant only between D-30 and D-35 for neutrophil count. Both
species showed a decrease in neutrophil count between time-points.
Overall, despite the significant species difference, the majority of haematological
results showed similar response patterns in both species at D-30 and D-35, again

193
suggesting that sheep could be used as a model for cattle if the overall response were
compared as opposed to the specific haematological response value.
Of the majority of variables studied in this trial, cattle and sheep showed similar
response patterns to the challenge diet, and results were broadly consistent with
previous SARA studies in cattle and sheep. A similarity in the response in both species
was observed despite the fact that clinical symptoms of SARA were observed only in
sheep and only sheep were considered acidotic by standard literature definitions of
pH thresholds.
Overall it seems reasonable to conclude from this trial that sheep are a suitable model
for further bovine nutrition studies. Both species showed similar responses in the
majority of parameters investigated in response to a diet intended to induce acidosis,
with the exception of 16S sequencing. If further testing was carried out to investigate
the effect of an increased challenge in cattle or a decreased challenge in sheep, the
clustering of the majority of animals in the 16S plots suggest that the 16S results could
be comparable. The apparent divergence in the severity of the response to the
challenge diet observed in this trial between cattle and sheep highlights the need for
accurate dosing in sheep. The allometric scaling approach used in this trial to
determine the challenge dosage may be inferior to dosing on a simple bodyweight
basis. Future studies to determine the correspondence between challenges for cattle
and sheep would be useful and allow a greater understanding of the use of sheep as
a model for future bovine nutrition studies.
General Discussion
SARA is widely reported globally in animals from a range of management systems,
fed on rations high in rapidly fermentable carbohydrates (Titgemeyer & Naaraja 2006;
Kleen et al., 2009; Kleen & Cannizzo, 2012), and estimates of the financial impact of
SARA are consistently high (Enemark, 2008). Occurrence of the condition varies with
region, but has been suggested in a review by Kleen and Cannizzo (2012) to be up to
40% in the USA (Garrett et al., 1997). SARA has been shown to be associated with
numerous ill effects, leading to increased culling rates and consequential financial

194
losses (Plaizier et al., 2008), lower production efficiency (Abdela, 2016) and lower
welfare (Enemark, 2008).
The main objectives of the work presented in this thesis were to:
Examine the range of responses in commonly studied traits to diets expected to
induce ruminal acidosis. The variables investigated included haematological and
biochemical variables, positive acute phase proteins, expression of genes
associated with inflammation, reticuloruminal pH, reticuloruminal histamine,
reticuloruminal LPS, reticuloruminal SCFA and production parameters.
Assess the ability of new direct fed microbial agents (DFM) for controlling the
effects of ruminal acidosis in cattle
Identify the extent to which sheep might legitimately be used as a model organism
for cattle in nutrition studies
Define a phenotype that is a strong indicator of resistance to ruminal acidosis for
use in future studies
In chapter 3, the on-farm and post-mortem observations associated with ruminal
acidosis in beef and dairy cattle were investigated. This enabled the creation of a
scoring system for bovine rumen epithelium, shown in this thesis to be capable of
differentiating between animals from different management groups from their
histological score. The recent literature on the normal histological appearance of the
bovine or ovine rumen epithelium, without dietary manipulation, is quite limited
(Dobson, 1956, Graham and Simmons, 200). Often, histological investigations into the
rumen epithelium use small sample sizes and focus on the acute response to a diet
high in rapidly fermentable carbohydrates, not on the normal appearance associated
with long-term adaptation to any given type of diet (Steele, 2009; Steele, 2011; Steele,
2012; Liu, 2013). The scoring system created in this chapter allows for future
investigations into the long term effects of dietary inputs and the adaptive ability of the
rumen with long term exposure to a diet, in comparison to the acute effects of dietary
manipulation that are often studied. It is likely that variation in the ability of the rumen
epithelium to adapt and increase its absorptive capacity is one of the key factors
195
behind variation in susceptibility to SARA observed among animals on different farms
and on the same farm. The removal of SCFA via absorption and passage through the
rumen, together with the buffering capacity of saliva are important for maintaining the
reticuloruminal pH and those variables associated with a change in pH. Therefore,
variation in these traits is important and an animal in which the rumen epithelium
adapts quickly and efficiently is less likely to suffer from reduced pH and the associated
negative consequences.
An unexpected result of the study in chapter 3 was the overwhelming effect of farm of
origin on all variables studied. Farms that had a similar a priori risk classification based
on the major recognised criteria nonetheless showed very diverse patterns of
response in commonly studied variables. Therefore, as farm of origin has such a
strong effect on results, care is needed when assuming that farms which appear
similar superficially, would have a similar risk of animals in the herds developing
acidosis. With finishing cattle, groups are often formed from animals which originated
from many diverse farms and therefore from different neonatal and genetic
backgrounds. It is possible that with the importance of the environment in developing
the neonatal microbiome (Malmuthuge et al., 2015), microbiome variation could
explain in part the strength of the effect of farm of origin on a wide range of variables.
An animal’s ruminal microbiome has been shown to develop and be influenced by the
maternal microbiota, surroundings, diet and diet delivery and antibiotic treatment
during early life (Fanaro et al., 2003, Penders et al., 2006) – all factors which would
vary greatly among farms. The ruminal microbiome has been shown to be maintained
throughout life and microbiome profiles have been shown to revert to original levels in
cattle within 14-61 days following complete transfaunation (Weimer et al., 2010).
Therefore, with the importance of the ruminal microbiome for the overall function of
the rumen, it would be expected that the strong variation among farms and groups of
animals on 1 farm in a finishing group could partly be explained by variation in the
microbiome.
In addition to variation in the microbiome, another possible explanation for the strong
effect of farm of origin is epigenetics; biochemical modifications to DNA and to
histones (proteins that provide stability to DNA) induced by environmental stimuli,
which alter gene expression and are potentially heritable (Doherty et al., 2014). There
196
is growing evidence that prenatal nutrition and stress can have a long term effect on
progeny (Singh et al., 2010) although the relationship between epigenetic changes
and the resulting phenotype is still not clear (Skinner et al., 2010). There is evidence
to suggest that nutritional status during early development is associated with disease
risk later in life (Heijmans et al., 2008) and dietary intervention in pregnant animals
has been shown to affect their offspring (Liu et al., 2011). In pigs, variation in maternal
dietary protein intake resulted in epigenetic changes that altered transcription of the
myostatin gene (MSTN) (Liu et al., 2011). MSTN is responsible for production of
myostatin protein, which plays a key role in determining muscle mass and meat quality
(Kocamis and Killefer, 2002, Wiener et al., 2009). Offspring of pigs fed a low protein
diet had upregulated MSTN gene expression, which showed specifically at the
finishing stage and was not present at weaning (Liu et al., 2011), thus suggesting a
potential role of epigenetic regulation in the determination of carcase yield and meat
quality – particularly important in finishing beef cattle (Liu et al., 2011).
Butyrate is often added to animal feeds as it has been shown to reduce Salmonella
infection by inhibiting large intestine colonisation (Lawhon et al., 2002). However,
SCFA, including butyrate, have been shown to act as histone inhibitors (Ho and
Dashwood, 2010) and have been shown to be involved in inflammatory gene up-
regulation (Doherty et al., 2014). Transcriptomic changes have been shown to be
induced by butyrate and some are thought to be epigenetically regulated (Doherty et
al., 2014). Therefore, variation in the reticuloruminal levels of SCFA, such as butyrate,
in dams could be expected to have an effect on their offspring and could reflect part
of the strong effect of farm and variation noted among animals. Additionally
epigenetics can have an effect on the immune cell development and function in cattle,
and epigenetic changes in response to inflammation and infection are thought to have
an impact on the level of future immune responses (Doherty et al., 2014). Research
has shown that stimulation with LPS creates an increase in the expression of
epigenetic enzymes associated with immune response, and histone inhibitors have
been shown to inhibit the expression of pro-inflammatory cytokines like IL2 and IFN-γ
in response to LPS (Doherty et al., 2013). Therefore, epigenetic regulation of gene
expression could help explain variation in response to infection and differences in
disease susceptibility or severity in cattle (Doherty et al., 2013). Increased LPS is often
associated with acidosis as a result of decreased pH leading to reticuloruminal

197
bacterial lysing. In this thesis, wide ranges in LPS concentrations were noted among
animals. It stands to reason that epigenetic variation could be partly responsible for
explaining this wide range noted, reflecting the range of farms of origin noted. This
variation as a result of epigenetic factors, coupled with the variation in the ruminal
microbiome, could again account for the strong effect of farm of origin noted among
farms which superficially appeared similar.
This trial measured particle size between farms and considered it as a parameter when
assigning the a priori risk category. However, we did not measure time of feeding, style
of feeding or management of the feed bunk. All of these variables could account for
some of the strong effect of farm of origin on the measured parameters. Time of feed
delivery has been shown to affect the feeding and lying patterns of cattle (Devries and
von Keyserlingk, 2005), and the type of flooring present at a feed bunk has been
shown to affect both the time spent standing near the feed bunk and the feed intake
(Tucker et al., 2006), with cattle showing a preference for softer flooring such as
sawdust in comparison to concrete. Cleanliness and the surface of the feed bunk also
affect intake in cattle. Therefore, despite considering the composition and particle size
of the diets when considering the risk of acidosis, actual intake could have varied
greatly among farms. Considering all of these factors when looking at the effect of a
diet intended or expected to induce acidosis in cattle in future studies is important.
The second study, detailed in chapter 4, investigated the effects of a diet high in
soluble carbohydrates on variables associated with SARA in lactating dairy cattle, with
and without the use of direct fed microbials (DFM). The challenge diet induced an
inflammatory response in cattle that was associated with an increase in milk
production and markers of improved metabolic status but only weak tendencies to
reticuloruminal acidosis. The inflammatory response pattern was characterised by
elevations in monocytes, acute phase proteins and inflammatory gene expression and
has previously been observed in other studies (Li, 2006; Hernandez et al., 2014). To
a lesser extent, a slight anti-inflammatory effect of the DFM introduction was also
observed, as has been previously shown in the literature (Jensen et al., 2008; Gao,
2008) but not specifically in cattle. It seems sensible to consider that an inflammatory
type response in cattle may be a precursor to SARA, becoming evident before clinical
symptoms arise in individuals. It is possible that by early detection of inflammatory

198
markers, fermentation disorders could be prevented before clinical symptoms arise
and prior to a decrease in production. The DFM used in this study had little or no effect
on most of the changes in response to the challenge diet. Some increased the number
of observations noted below pH 6 and caused a significant increase in mean pH but
these changes were very small numerically. The group fed the commercially available
DFM showed the lowest number of instances of pH below 6 in comparison to the novel
DFM. The proportion of treatment consumed in each group suggested that the
palatability and volume of DFM should be considered, as both types of yeast DFM
were refused more than the bacterial DFM, which were a smaller volume. The changes
observed also tended to suggest a slight anti-inflammatory effect following the
introduction of the DFM. However, this was not as marked as the inflammatory
response that followed the introduction of the challenge diet. As the rumen was not
challenged to the extent that was intended in this trial and no animals showed
symptoms of SARA, it was not possible to fully investigate the ability of the DFM to
control the effects of reticuloruminal acidosis or SARA. It appears that all the DFM
were beneficial some way, increasing mean pH or showing a slight anti-inflammatory
effect but they did not alter pH or other studied variables vastly and the established
commercially available DFM was the most successful at altering the rumen
environment. While the cost of the initial inclusion of DFM in the diet may be prohibitive
for some farms, the possible returns via increased health and production are thought
to outweigh this initial cost (Kalebich and Cardoso, 2018). Despite the results in this
trial not showing a large effect of the DFM, the literature has shown a positive
relationship with health and production and the feeding of DFM over the last few
decades. For example, addition of DFM to the ration has shown increased growth rate
(Dawson, 1990 ; Lehloenya et al., 2008), improved milk production (Dawson, 1990 ;
Lehloenya et al., 2008), greater production efficiency (Dawson, 1990; Isik et al., 2004;
Jouany, 2006; Oetzel et al., 2007 ; Lehloenya et al., 2008), increased average daily
gain and efficiency in feedlot cattle (Krehbiel et al., 2003 ; Guillen, 2009), improved
health (Krehbiel et al., 2003 ; Guillen, 2009), improved immunity (Krehbiel et al., 2003 ;
Guillen, 2009), performance in young calves (Krehbiel et al., 2003; Guillen, 2009 ;
Novak et al., 2012), decreased potential for ruminal acidosis (Krehbiel et al., 2003 ;
Guillen, 2009), and the potential to decrease the effect of endotoxins (Eckel and
Ametaj, 2006). Variation in the results of DFM may include proper dosage, lactation
stage, variation in strains of DFM, and animal stress conditions (Seo et al., 2010). In

199
this trial as all animals were dosed in the same manner, lactation stage was equally
split between groups and animals were maintained in the same conditions, it is unclear
why the DFM did not have a larger impact. It may be possible that with a larger dietary
challenge, a more significant effect of the introduction of DFM would have become
apparent between the control group and those fed DFM.
The final study in this thesis, detailed in chapter 5, aimed to compare the responses
of cattle and sheep to the rapid introduction of a diet high in soluble carbohydrates.
This study suggested that sheep are likely to be suitable for use as a model for cattle
in future studies. The patterns of response were similar between species, although the
greater effect size suggested that sheep were more strongly challenged than the cattle.
To the best of our knowledge, there are no published reports of a direct comparative
response in sheep and cattle to the same diet intended to induce ruminal acidosis or
SARA in both species, although there have been independent studies into
SARA/acidosis in both species. There have been 3 reports of side by side
comparisons in cattle and sheep in dietary studies, but none in which there was an
attempt to induce SARA. The first study looked at the use of sheep as a model to
predict the relative intakes of silages by dairy cattle and found the mean intakes of
silages by cows were 2.25 times those of the sheep, and it was concluded that sheep
were not a useful model system to predict the intakes of a range of grass silages of
similar chop length by dairy cows (Cushahan, 1994). The second study looked at the
comparative digestion in sheep and cattle fed different forage to concentrate ratios
and found that at high intake, digestion values in the cows were less than those in the
sheep for all diets (Colucci et al, 1989) – as has previously been shown in larger
ruminants where digesta is expected to be retained in the rumen for longer in larger
ruminants in comparison to smaller ones (Clauss et al., 2007). From this variation in
the digestive physiology, the group concluded that sheep could not be used as a model.
However, if this variation of digestion rate was taken into consideration via allometric
scaling of diets, it is possible that the model would work – as noted in this present trial.
The final study in the literature followed on from the previously discussed trial,
investigating the digesta kinetics of the previous trial. Colluci et al (1990) found that
passage values of particulate and liquid markers were faster at higher intakes in both
species and no substantial differences were found in particulate passage values
between sheep and cattle. They found that liquid passage rates were higher in cows

200
than in sheep for all diets and suggested that although care should be undertaken
when comparing results, the variation does not preclude the use of sheep as a model
for future cattle studies (Colucci, 1990). The baseline comparative 16S data was the
trait that varied most between species, suggesting that the challenge diet was too
harsh for sheep, with sheep showing vast losses of biomarker species following the
introduction of the challenge diet. Despite variation in the 16S results post challenge,
the majority of animals of both species showed similar results and were consistent
with previous work that suggested a core microbiome was present in all ruminant
species (Henderson, 2015). As described, 16S results were also consistent with the
species observed in previous studies in forage and grain fed animals.
In all studies, results for the majority of commonly investigated traits such as
reticuloruminal pH, reticuloruminal LPS concentrations and histamine concentrations
followed patterns previously described in the literature – tending to increase with
increased levels of rapidly fermentable carbohydrates. In contrast, one of the
consistently observed results across all trials in this thesis – significantly decreased
reticuloruminal SCFA concentrations with the introduction of a challenge diet –
conflicted with the commonly reported finding that increased levels of SCFA occur with
increased levels of concentrate feeding (Nordlund and Garret, 1994). It is considered
likely that the reason for decreased levels of SCFA noted in all 3 trials in this thesis is
as a result of increased levels of absorption through the ruminal wall and increased
passage of SCFA through from the rumen. A possible reason for decreased SCFA in
the trials observed in this thesis could be increased water intake. As this was not
measured, it is not possible to confirm. However, it is unlikely and as the finishing cattle
in chapter 3 would have water limited prior to slaughter, it would be expected that if
water intake were causing the decreased SCFA concentrations observed, it would not
have been noted in this group. Further studies looking at absorption and movement of
SCFA through the rumen using 14C labelled acetate, propionate and butyrate would
allow a greater understanding of whether increased absorption or another mechanism
could be responsible for the lower SCFA levels noted in these trials. 14C labelling of
SCFA has been used previously in in vitro studies to investigate movement of SCFA
using Ussing chambers (Sehested et al, 1999) – if it had been possible to extract
ruminal wall from the fistulated animals and test this hypothesis in vitro or to use
labelled SCFA in live animals it may have been possible to confirm increased
201
absorption as the mechanism responsible for the decreased SCFA levels observed in
this thesis.
In conclusion, the feeding of a diet high in rapidly fermentable carbohydrates suggests
that there is a systemic inflammatory response prior to any clinical symptoms
commonly associated with SARA in cattle. This inflammatory response is
characterised by elevations in monocytes, acute phase proteins and inflammatory
gene expression and has previously been observed in other studies (Li, 2006;
Hernandez et al., 2014). The effect of farm of origin was far stronger than initially
expected in this study and suggests that when considering the effect of a diet on the
ruminal function and overall animal health, it is necessary to consider the presentation
of feed, time of feed and possible genetic and microbiome factors, as well as
commonly studied variables such as percentage of concentrate and particle size.
Finally, the work suggests that it should be possible to use sheep as a model for future
cattle nutrition and acidosis studies if the variation in the rate of digesta and liquid
passage through the rumen is considered through allometric scaling.
This work looked to identify a possible phenotype for indication of resistance to
acidosis. It is possible, with further investigation, that the level of inflammatory
response observed in individual animals prior to clinical symptoms could be used as
a phenotype for indication of acidosis resistance. It is likely that animals with lower
inflammatory responses to a diet high in rapidly fermentable carbohydrates are less
likely to develop negative consequences associated with such a diet in comparison to
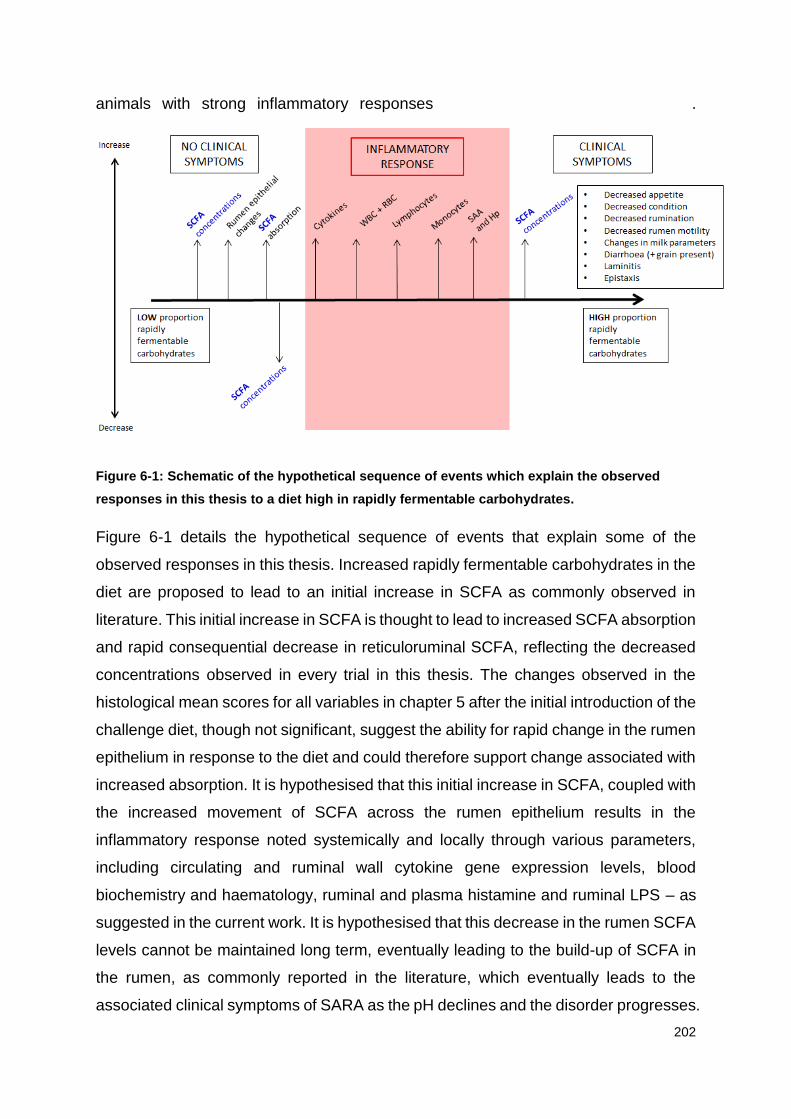
202
animals with strong inflammatory responses .
Figure 6-1: Schematic of the hypothetical sequence of events which explain the observed
responses in this thesis to a diet high in rapidly fermentable carbohydrates.
Figure 6-1 details the hypothetical sequence of events that explain some of the
observed responses in this thesis. Increased rapidly fermentable carbohydrates in the
diet are proposed to lead to an initial increase in SCFA as commonly observed in
literature. This initial increase in SCFA is thought to lead to increased SCFA absorption
and rapid consequential decrease in reticuloruminal SCFA, reflecting the decreased
concentrations observed in every trial in this thesis. The changes observed in the
histological mean scores for all variables in chapter 5 after the initial introduction of the
challenge diet, though not significant, suggest the ability for rapid change in the rumen
epithelium in response to the diet and could therefore support change associated with
increased absorption. It is hypothesised that this initial increase in SCFA, coupled with
the increased movement of SCFA across the rumen epithelium results in the
inflammatory response noted systemically and locally through various parameters,
including circulating and ruminal wall cytokine gene expression levels, blood
biochemistry and haematology, ruminal and plasma histamine and ruminal LPS – as
suggested in the current work. It is hypothesised that this decrease in the rumen SCFA
levels cannot be maintained long term, eventually leading to the build-up of SCFA in
the rumen, as commonly reported in the literature, which eventually leads to the
associated clinical symptoms of SARA as the pH declines and the disorder progresses.

203
Animals which show a lower inflammatory response during this critical period (red
section) or which can maintain decreased SCFA levels in the rumen for longer are
more likely to be resistant to the ill effects of SARA and thus less likely to suffer from
any negative consequences or show any clinical symptoms. With further investigations,
it may be possible to confirm this hypothesis and allow for the use of this low
inflammatory phenotype to be actively selected for through breeding. It is also possible
that the novel scoring system created could be used to further investigate cattle with
rapid changes in their rumen histology in response to high carbohydrate diets, in
conjunction with the inflammatory parameters, to attempt to find the level of
inflammatory response noted in animals showing a rapid/large histological response.
If the combination of these mechanisms led to the creation of this low inflammatory
phenotype that could be selected for, animals could be bred to reduce the incidence/
negative effects of SARA – increasing welfare and decreasing financial losses to
farmers globally.

204
References
AAFJES, J. H. 1967. Carbonic Anhydrase in the Wall of the Forestomachs of Cows. British Veterinary Journal, 123, 252-256.
ABDELA, N. 2016. Sub-acute Ruminal Acidosis (SARA) and its Consequence in Dairy Cattle: A Review of Past and Recent Research at Global Prospective. Achievements in the Life Sciences, 10, 187-196.
ABREU, M. T. 2010. Toll-like receptor signalling in the intestinal epithelium: how bacterial recognition shapes intestinal function. Nature Reviews Immunology, 10, 131-144.
ADAMIS, Z. & WILLIAMS, R. B. 2005. Bentonite, Kaolin and Selected Clay Minerals In: 231, E. H. C. (ed.). Geneva, Switzerland: World Health Organisation.
ALLEN, M., VOELKER, J. & OBA, M. Physically Effective Fiber and Regulation of Ruminal pH: More Than Just Chewing1. Four-State Dairy Nutrition and Management Conference, 2009. 70.
ALLEN, M. S. 1996. Physical constraints on voluntary intake of forages by ruminants. Journal of Animal Science, 74, 3063-75.
ALLEN, M. S. 1997. Relationship between fermentation acid production in the rumen and the requirement for physically effective fiber. Journal of Dairy Science, 80, 1447-1462.
ALLEN, M. S. 2000. Effects of Diet on Short-Term Regulation of Feed Intake by Lactating Dairy Cattle. Journal of Dairy Science, 83, 1598-1624.
ALZAHAL, O., STEELE, M. A., VALDES, E. V. & MCBRIDE, B. W. 2009. Technical note: The use of a telemetric system to continuously monitor ruminal temperature and to predict ruminal pH in cattle. Journal of Dairy Science, 92, 5697-5701.
AMBRIS-VILCHIS, V., JESSOP, N.S., FAWCETT, R.H., SHAW, D.J., MACRAE, A.I., 2015, Comparison of rumination activity measured using rumination collars against direct visual observations and analysis of video recordings of dairy cows in commercial farm environments, Journal of Dairy Science, 98 (3): 1750-1758
AMETAJ, B. N., ZEBELI, Q., SALEEM, F., PSYCHOGIOS, N., LEWIS, M. J. & DUNN, S. M. 2010. Metabolomics reveals unhealthy alterations in rumen metabolism with increased proportion of cereal grain in the diet of dairy cows. Metabolomics, 6.
ASARI, M., OSHIGE, H., WAKUI, S., FUKAYA, K. & KANO, Y. 1985. Histological development of bovine abomasum. Annals of Anatomy, 159, 1-11.
ASCHENBACH, J. R., BILK, S., TADESSE, G., STUMPFF, F. & GABEL, G. 2009. Bicarbonate-dependent and bicarbonate-independent mechanisms contribute to nondiffusive uptake of acetate in the ruminal epithelium of sheep. American Journal of Physiological Gastrointestinal Liver Physiolgy, 296, G1098-107.
ASCHENBACH, J. R. & GABEL, G. 2000. Effect and absorption of histamine in sheep rumen: significance of acidotic epithelial damage. Journal of Animal Science, 78, 464-70.
ASCHENBACH, J. R., OSWALD, R. & GÄBEL, G. 2000. Transport, catabolism and release of histamine in the ruminal epithelium of sheep. Pflügers Archives, 440, 171-178.
ASCHENBACH, J. R., PENNER, G. B., STUMPFF, F. & GABEL, G. 2011. RUMINANT NUTRITION SYMPOSIUM: Role of fermentation acid absorption in the regulation of ruminal pH. Journal of Animal Science, 89, 1092-1107.
ASH, R. W. 1961. Acid secretion by the abomasum and its relation to the flow of food material in the sheep. Journal of Physiology 156, 93-111.
BACH, A., IGLESIAS, C. & DEVANT, M. 2007. Daily rumen pH pattern of loose-housed dairy cattle as affected by feeding pattern and live yeast supplementation. Animal Feed Science and Technology, 136, 146-153.
BACKUS, R. C., COLVIN, H. W. & DEPETERS, E. J. 1993. The effect of elevation of intrarumen pressure by nitrogen insufflation on eructation in cattle (bos taurus). Comparative Biochemistry and Physiology 106a, 731-738.
BAUMONT, R. & DESWYSEN, A. G. 1991. [Mixing and propulsion of the contents of the reticulo-rumen]. Reproductive Nutritional Development, 31, 335-59.
205
BEAUCHEMIN, K. Ruminal Acidosis in Dairy Cows: Balancing Physically Effective Fiber with Starch Availability. Florida Ruminant Nutrition Symposium, 2007 Gainesville, FL.
BEAUCHEMIN, K. A. 1991. Effects of dietary neutral detergent fiber concentration and alfalfa hay quality on chewing, rumen function, and milk production of dairy cows. Journal of Dairy Science, 74, 3140-51.
BEAUCHEMIN, K. A., YANG, W. Z. & RODE, L. M. 2003. Effects of Particle Size of Alfalfa-Based Dairy Cow Diets on Chewing Activity, Ruminal Fermentation, and Milk Production1. Journal of Dairy Science, 86, 630-643.
BEHARKA, A. A., NAGARAJA, T. G., MORRILL, J. L., KENNEDY, G. A. & KLEMM, R. D. 1998. Effects of Form of the Diet on Anatomical, Microbial, and Fermentative Development of the Rumen of Neonatal Calves1. Journal of Dairy Science, 81, 1946-1955.
BENNINK, M. R., TYLER, T. R., WARD, G. M. & JOHNSON, D. E. 1978. Ionic milieu of bovine and ovine rumen as affected by diet. Journal of Dairy Science, 61, 315-23.
BEWLEY, J. M., EINSTEIN, M. E., GROTT, M. W. & SCHUTZ, M. M. 2008. Comparison of reticular and rectal core body temperatures in lactating dairy cows. Journal of Dairy Science, 91, 4661-72.
BHAGWAT, A. M., DE BAETS, B., STEEN, A., VLAEMINCK, B. & FIEVEZ, V. 2012. Prediction of ruminal volatile fatty acid proportions of lactating dairy cows based on milk odd- and branched-chain fatty acid profiles: New models, better predictions. Journal of Dairy Science, 95, 3926-3937.
BONDZIO, A., GABLER, C., BADEWIEN-RENTZSCH, B., SCHULZE, P., MARTENS, H. & EINSPANIER, R. 2011. Identification of differentially expressed proteins in ruminal epithelium in response to a concentrate-supplemented diet. Am J Physiol Gastrointest Liver Physiol, 301, G260-8.
BOYNE, A. W., EADIE, J. M. & RAITT, K. 1957. The Development and Testing of a Method of Counting Rumen Ciliate Protozoa. Journal of General Microbiology, 17, 414-123.
BRAG, S. & HANSEN, H. J. 1994. Treatment of ruminal indigestion according to popular belief in Sweden. Rev Sci Tech, 13, 529-35.
BRAMLEY, E., LEAN, I. J., FULKERSON, W. J., STEVENSON, M. A., RABIEE, A. R. & COSTA, N. D. 2008. The Definition of Acidosis in Dairy Herds Predominantly Fed on Pasture and Concentrates<sup>1</sup>. Journal of Dairy Science, 91, 308-321.
BRAUN, U. & GÖTZ, M. 1994. Ultrasonography of the reticulum in cows. American journal of veterinary research, 55, 325-332.
BRAUN, U. & JACQUAT, D. 2011. Ultrasonography of the reticulum in 30 healthy Saanen goats. Acta Vet Scand, 53, 19.
BRENT, B. E. 1976. Relationship of Acidosis to Other Feedlot Ailments. Journal of Animal Science, 43, 930-935.
BRYANT, M. P. 1959. BACTERIAL SPECIES OF THE RUMEN. Bacteriological Reviews, 23, 125-153.
BRYANT, M. P., SMALL, N., BOUMA, C. & ROBINSON, I. 1958. Studies on the Composition of the Ruminal Flora and Fauna of Young Calves. Journal of Dairy Science, 41, 1747-1767.
BUDRAS, K., HABEL, R. E., WUNSCH, A. & BUDA, S. 2003. Bovine Anatomy, An Illustrated Text, Hanover, Germany, Schliterscje GmbH & Co. .
BUK, S. J. 1984. Simultaneous demonstration of connective tissue elastica and fibrin by a combined Verhoeff's elastic-Martius-scarlet-blue trichrome stain. Biotechnic and Histochemistry, 59, 1-5.
BUSCH, J., HARRIS, G. H., COUP, M. R. & CORDES, D. O. 2011. Acute ruminal indigestion, alkalosis and death of cattle grazing kikuyu. New Zealand Veterinary Journal, 17, 182-183.
BUTLER, S. T., PELTON, S. H. & BUTLER, W. R. 2006. Energy balance, metabolic status, and the first postpartum ovarian follicle wave in cows administered propylene glycol. Journal of Dairy Science, 89, 2938-51.

206
CALABRO, S., PICCOLO, V., CUTRIGNELLI, M. I., TUDISCO, R. & INFASCELLI, F. 2012. Rumen Activity Evaluated with the In Vitro Gas Production Technique In: JENKINS, O. P. (ed.) Advances in Zoology Research. Hauppage, New York: Nova Science Publishers
CALSAMIGLIA, S., BLANCH, M., FERRET, A. & MOYA, D. 2012. Is subacute ruminal acidosis a pH related problem? Causes and tools for its control. Animal Feed Science and Technology, 172, 42-50.
CAMPLING, R. C. 1991. Processing cereal grains for cattle - a review Livestock Production Science, 28, 223-234.
CAPORASO, J.G., BITTINGER, K., BUSHMAN, F.D., DESANTIS, T.Z., ANDERSEN, G.L., KNIGHT, R., 2010, PyNAST: a flexible tool for aligning sequences to a template alignment, Bioinformatics, 26: 266-267CHAUCHEYRAS, F., FONTY, G., BERTIN, G., SALMON, J. M. & GOUET, P. 1996. Effects of a strain of Saccharomyces cerevisiae (Levucell SC1), a microbial additive for ruminants, on lactate metabolism in vitro. Canandian Journal of Microbiology, 42, 927-33.
CHEN, Y., OBA, M. & GUAN, L. L. 2012. Variation of bacterial communities and expression of Toll-like receptor genes in the rumen of steers differing in susceptibility to subacute ruminal acidosis. Veterinary Microbiology, 159, 451-459.
CHEN, Y. C., CHEN, W. T., LIU, J. C., TSAI, L. C. & CHENG, H. L. 2014. A highly active beta-glucanase from a new strain of rumen fungus Orpinomyces sp.Y102 exhibits cellobiohydrolase and cellotriohydrolase activities. Bioresource Technology, 170, 513-21.
CHENG, K.-J. & MCALLISTER, T. 1997. The Rumen Microbial Ecosystem, London, Blackie Academic & Professional
CHIQUETTE, J. 2009. Evaluation of the protective effect of probiotics fed to dairy cows during a subacute ruminal acidosis challenge. Animal Feed Science and Technology, 153, 278-291.
CHRISTIE, W. W. 2014. Lipid Metabolism in Ruminant Animals, Elsevier Science. CLAUSS, M., SCHWARM, A., ORTMANN, S., STREICH, W. J. & HUMMEL, J. 2007. A case
of non-scaling in mammalian physiology? Body size, digestive capacity, food intake, and ingesta passage in mammalian herbivores. Comparative Biochemistry Physiology Part A Molecular and Integrative Physioogyl, 148, 249-65.
COCKCROFT, P. D. 2015. Bovine Medicine, Oxford, John Wiley & Sons COLUCCI P.E., MACLEOD G.K, GROVUM W.L, CAHILL L.W., MCMILLAN I. 1989.
Comparative digestion in sheep and cattle fed diffferent forage to concentrate ratios at high and low intakes. Journal of Dairy Science. 72 (7): 1774—84
COLUCCI P.E., MACLEOD G.K., GROVUM W.L., MCMILLAN I., BARNEY D.J., 1990. Digesta kinetics in sheep and cattle fed diets with different forage to concentrate rations at high and low intakes. Journal of Dairy Science. 73 (8): 2143-2156
CONSTABLE, P. D., HINCHCLIFF, K. W., DONE, S. H. & GRUENBERG, W. 2017. Diseases of the Alimentary Tract–Ruminant In: HINCHCLIFF, K. W., DONE, S. H. & GRÜNBERG, W. (eds.) Veterinary Medicine (Eleventh Edition). W.B. Saunders.
CONSTABLE, P. D., ST JEAN, G., HULL, B. L., RINGS, D. M. & HOFFSIS, G. F. 1991. Prognostic value of surgical and postoperative findings in cattle with abomasal volvulus. Journal of the American Veterinary Medicine Association, 199, 892-8.
COOK, W. O., RICHARD, J. L., OSWEILER, G. D. & TRAMPEL, D. W. 1986. Clinical and pathologic changes in acute bovine aflatoxicosis: rumen motility and tissue and fluid concentrations of aflatoxins B1 and M1. American Journal of Veterinary Research, 47, 1817-25.
COOPER, R. J., KLOPFENSTEIN, T. J., STOCK, R. A., MILTON, C. T., HEROLD, D. W. & PARROTT, J. C. 1999. Effects of imposed feed intake variation on acidosis and performance of finishing steers. Journal of Animal Science, 77, 1093-9.
CORNELL UNIVERSITY , C. O. V. 2013. BHB [Online]. Available: http://www.eclinpath.com/chemistry/energy-metabolism/%CE%B2-hydroxybutyrate/ [Accessed 01/08/17 2017].
207
CUSHNAHAN A., GORDON F.J., FERRIS C.P.W., CHESNUTTT D.M.B., MAYNE C.S. 1994. The use of sheep as a model to predict the relative intakes of silages by dairy cattle. Animal Science. 59 (3): 415-420CULL, C. A., RENTER, D. G., BELLO, N. M., IVES, S. E. & BABCOCK, A. H. 2015. Performance and carcass characteristics of commercial feedlot cattle from a study of vaccine and direct-fed microbial effects on Escherichia col O157:H7 fecal shedding. Journal of Animal Science, 93, 3144-51.
DAIN, J. A., NEAL, A. L. & DOUGHERTY, R. W. 1955. The Occurrence of Histamine and Tyramine in Rumen Ingesta of Experimentally Over-Fed Sheep. Journal of Animal Science, 14, 930-935.
DANN, H. M., DRACKLEY, J. K., MCCOY, G. C., HUTJENS, M. F. & GARRETT, J. E. 2000. Effects of Yeast Culture (Saccharomyces cerevisiae) on Prepartum Intake and Postpartum Intake and Milk Production of Jersey Cows1. Journal of Dairy Science, 83, 123-127.
DANSCHER, A. M., LI, S., ANDERSEN, P. H., KHAFIPOUR, E., KRISTENSEN, N. B. & PLAIZIER, J. C. 2015. Indicators of induced subacute ruminal acidosis (SARA) in Danish Holstein cows. Acta Veterinaria Scandinavica, 57, 39.
DAWSON K.A. 1990. Designing the yeast culture of tomorrow – mode of action of yeast culture for ruminants and non ruminants. Biotechnology in the Feed Industry: Proceedings from Alltechs 6th Annual Symposium. Lexington Kentucky. Alltech Publications, Nicholasville, Kentucky, p59DE MENEZES, A. B., LEWIS, E., O'DONOVAN, M., O'NEILL, B. F., CLIPSON, N. & DOYLE, E. M. 2011. Microbiome analysis of dairy cows fed pasture or total mixed ration diets. FEMS Microbiology Ecology, 78, 256-265.
DE NARDI, R., MARCHESINI, G., LI, S., KHAFIPOUR, E., PLAIZIER, K. J. C., GIANESELLA, M., RICCI, R., ANDRIGHETTO, I. & SEGATO, S. 2016. Metagenomic analysis of rumen microbial population in dairy heifers fed a high grain diet supplemented with dicarboxylic acids or polyphenols. BMC Veterinary Research, 12, 29.
DEHKORDI, A. J. & DEHKORDI, Z. K. 2011. Occurrence of metabolic alkalosis in rumen lactic acidosis: A review article. Comparative Clinical Pathology, 20, 1-3.
DEHORITY, B. A. 1978. Specificity of Rumen Ciliate Protozoa in Cattle and Sheep*. Journal of Eukaryotic Microbiology, 25, 509-513.
DEHORITY, B. A. 2002. Gastrointestinal Tracts of Herbivores, Particularly the Ruminant: Anatomy, Physiology and Microbial Digestion of Plants. Journal of Applied Animal Research, 21, 145-160.
DENWOOD, M. J., KLEEN, J. L., JENSEN, D. B. & JONSSON, N. N. 2018. Describing temporal variation in reticuloruminal pH using continuous monitoring data. Journal of Dairy Science, 101, 233-245.
DEPETERS, E. J. & GEORGE, L. W. 2014. Rumen transfaunation. Immunology Letters, 162, 69-76.
DESANTIS, T.Z., HUGENHOLTZ, P., LARSEN, N., ROJAS, M., BRODIE E.L., KELLER, K., HUBER, T., DALEVI, D., HU, P., ANDERSEN, G.L., 2006, Greengenes, a Chimera-Checked 16S rRNA Gene Database and Workbench Compatible with ARB, Applied Environmental Biology, 72 (7);5069-5072
DEVRIES, T. J. & VON KEYSERLINGK, M. A. 2005. Time of feed delivery affects the feeding and lying patterns of dairy cows. Journal of Dairy Science, 88, 625-31.
DIJKSTRA, J., BOER, H., VAN BRUCHEM, J., BRUINING, M. & TAMMINGA, S. 1992. Absorption of volatile fatty acids from the rumen of lactating dairy cows as influenced by volatile fatty acid concentration, pH and rumen liquid volume. British Journal of Nutrition, 69, 385-396.
DIJKSTRA, J., ELLIS, J. L., KEBREAB, E., STRATHE, A. B., LÓPEZ, S., FRANCE, J. & BANNINK, A. 2012. Ruminal pH regulation and nutritional consequences of low pH. Animal Feed Science and Technology, 172, 22-33.

208
DINNO, A., 2014, Gently Clarifying the Application of Horn’s Parallel Analysis to Principal Component Analysis Versus Factor Analysis, unpublished manuscript, available at http://archives.pdx.edu/ds/psu/10527
DIONISSOPOULOS, L., STEELE, M. A., ALZAHAL, O., PLAIZIER, J. C. & MCBRIDE, B. W. 2012. A characterization of inflammatory and structural markers within the rumen epithelium during grain-induced ruminal acidosis in lactating dairy cattle. American Journal of Animal and Veterinary Science, 7 (3), 141-148
DIRKSEN, G., LIEBICH, H. G., BROSI, G., HAGEMEISTER, H. & MAYER, E. 1984. [Morphology of the rumen mucosa and fatty acid absorption in cattle--important factors for health and production]. Zentralbl Veterinarmed A, 31, 414-30.
DITTER, B., URBASCHEK, R. & URBASCHEK, B. 1983. Ability of various adsorbents to bind endotoxins in vitro and to prevent orally induced endotoxemia in mice. Gastroenterology, 84, 1547-52.
DOBSON, A. 1984. Blood flow and absorption from the rumen. Quartery Journal of Experimental Physiology, 69, 599-606.
DOBSON, M. J., BROWN, W. C., DOBSON, A. & PHILLIPSON, A. T. 1956. A histological study of the organization of the rumen epithelium of sheep. Quarterly Journal of Experimental Physiology, 41, 247-53.
DOEPEL, L., LAPIERRE, H. & KENNELLY, J. J. 2002. Peripartum performance and metabolism of dairy cows in response to prepartum energy and protein intake. Journal of Dairy Science, 85, 2315-34.
DOHERTY, R., FARRELLY, C. O. & MEADE, K. G. 2014. Comparative epigenetics: relevance to the regulation of production and health traits in cattle. Animal Genetics, 45, 3-14.
DOHERTY, R., O'FARRELLY, C. & MEADE, K. G. 2013. Epigenetic regulation of the innate immune response to LPS in bovine peripheral blood mononuclear cells (PBMC). Veterinary Immunology and Immunopathology, 154, 102-10.
DONG, H., WANG, S., JIA, Y., NI, Y., ZHANG, Y., ZHUANG, S., SHEN, X. & ZHAO, R. 2013. Long-term effects of subacute ruminal acidosis (SARA) on milk quality and hepatic gene expression in lactating goats fed a high-concentrate diet. PLoS One, 8, e82850.
DRYDEN, L. P., HARTMAN, A. M., BRYANT, M. P., ROBINSON, I. M. & MOORE, L. A. 1962. Production of Vitamin B12 and Vitamin B12 Analogues by Pure Cultures of Ruminal Bacteria. Nature, 195, 201-202.
DUFFIELD, T., PLAIZIER, J. C., FAIRFIELD, A., BAGG, R., VESSIE, G., DICK, P., WILSON, J., ARAMINI, J. & MCBRIDE, B. 2004. Comparison of techniques for measurement of rumen pH in lactating dairy cows. Journal of Dairy Science, 87, 59-66.
DUNCAN, D. L. 1953. The effects of vagotomy and splanchnotomy on gastric motility in the sheep. The Journal of Physiology, 119, 157-169.
DUNCAN, S. H., LOUIS, P., THOMSON, J. M. & FLINT, H. J. 2009. The role of pH in determining the species composition of the human colonic microbiota. Environmental Microbiology, 11, 2112-2122.
DUNN, B. H., EMERICK, R. J. & EMBRY, L. B. 1979. Sodium Bentonite and Sodium Bicarbonate in High-Concentrate Diets for Lambs and Steers1,2. Journal of Animal Science, 48, 764-769.
ECKERSALL, P. D., YOUNG, F. J., NOLAN, A. M., KNIGHT, C. H., MCCOMB, C., WATERSTON, M. M., HOGARTH, C. J., SCOTT, E. M. & FITZPATRICK, J. L. 2006. Acute phase proteins in bovine milk in an experimental model of Staphylococcus aureus subclinical mastitis. Journal of Dairy Science, 89, 1488-501.
ECKERSALL, P.D., DUTHIE, S., SHAHABEDDIN, S., MOFFAT D., HORADOGA, N., DOYLE, S., PARTON, S., BENNET, D., FITZPATRICK, J., 1999, An Automated Biochemical Assay for Haptoglobin: Prevention of Interference from Albumin, Comparative Haematology International, 9: 117-124

209
ECKEL E.F., AMETAJ B.N. 2006. Invited review: role of bacterial endotoxins in etiopathogenesis of periparturient diseases of transition dairy cows. Journal of Dairy Science. 99: 1-24
ECKLES, C. H. & WILLIAMS, V. M. 1925. Yeast as a Supplementary Feed for Lactating Cows. Journal of Dairy Science, 8, 89-93.
EDGAR, R.C., 2010, Search and clustering orders of magnitude faster than BLAST, Bioinformatics, 26(19):2460-2461
EGERT, A. M., KLOTZ, J. L., MCLEOD, K. R. & HARMON, D. L. 2014. Development of a methodology to measure the effect of ergot alkaloids on forestomach motility using real-time wireless telemetry. Frontiers in Chemistry, 2, 90.
EMMANUEL, D. G., DUNN, S. M. & AMETAJ, B. N. 2008. Feeding high proportions of barley grain stimulates an inflammatory response in dairy cows. Journal of Dairy Science, 91, 606-14.
EMMANUEL, D. G., MADSEN, K. L., CHURCHILL, T. A., DUNN, S. M. & AMETAJ, B. N. 2007. Acidosis and lipopolysaccharide from Escherichia coli B:055 cause hyperpermeability of rumen and colon tissues. Journal of Dairy Science, 90, 5552-7.
ENEMARK, J. M., JORGENSEN, R. J. & ENEMARK, P. S. 2002. Rumen Acidosis with a Special Emphasis on Diagnostic Aspects of Subclinical Rumen Acidosis: A Review. Veterinarija IR Zootechnika, 20.
ENEMARK, J. M., JORGENSEN, R. J. & KRISTENSEN, N. B. 2004. An evaluation of parameters for the detection of subclinical rumen acidosis in dairy herds. Veterinary Research Communications, 28, 687-709.
ENEMARK, J. M., PETERS, G. & JORGENSEN, R. J. 2003. Continuous monitoring of rumen pH - a case study with cattle. Journal of Veterinary Medicine A: Physiology Patholology and Clinical Medicine, 50, 62-6.
ENEMARK, J. M. D. 2008. The monitoring, prevention and treatment of sub-acute ruminal acidosis (SARA): A review. The Veterinary Journal, 176, 32-43.
ERDMAN, R. A. 1988. Dietary Buffering Requirements of the Lactating Dairy-Cow - a Review. Journal of Dairy Science, 71, 3246-3266.
EURELL, J. A. & FRAPPIER, B. L., DVM 2013. Dellmann's Textbook of Veterinary Histology, Wiley.
EWASCHUK, J. B., NAYLOR, J. M. & ZELLO, G. A. 2005. d-Lactate in Human and Ruminant Metabolism. The Journal of Nutrition, 135, 1619-1625.
FANARO, S., CHIERICI, R., GUERRINI, P. & VIGI, V. 2003. Intestinal microflora in early infancy: composition and development. Acta Paediatrica Suplementaryl, 91, 48-55.
FERNANDO, S. C., PURVIS, H. T., NAJAR, F. Z., SUKHARNIKOV, L. O., KREHBIEL, C. R., NAGARAJA, T. G., ROE, B. A. & DESILVA, U. 2010. Rumen Microbial Population Dynamics during Adaptation to a High-Grain Diet. Applied and Environmental Microbiology, 76, 7482-7490.
FIRKINS, J. L. & YU, Z. 2004. Characterisation and quantification of the microbial populations in the rumen. In: SEJRSEN, K., HVELPLUND, T. & NIELSEN, M. O. (eds.) Ruminant physiology: Digestion, metabolism and impact of nutrition on gene expression, immunology and stress Netherlands: Wageningen Academic Publishers.
FIVEFALKA. 2017. Home n' Dry [Online]. England. 2017]. FLUHARTY, F. L. & MCCLURE, K. E. 1997. Effects of dietary energy intake and protein
concentration on performance and visceral organ mass in lambs. Journal of Animal Science, 75, 604-10.
FONTY, G., GOUET, P., JOUANY, J.-P. & SENAUD, J. 1987. Establishment of the Microflora and Anaerobic Fungi in the Rumen of Lambs. Microbiology, 133, 1835-1843.
FRANDSON, R., WILKE, W. & FAILS, A. 2003. Anatomy and Physiology of Farm Animals, Wiley.
FREDIN, S. M., FERRARETTO, L. F., AKINS, M. S., HOFFMAN, P. C. & SHAVER, R. D. 2014. Fecal starch as an indicator of total-tract starch digestibility by lactating dairy cows. Journal of Dairy Science, 97, 1862-71.
210
GÄBEL, G. & ASCHENBACH, J. 2006. Ruminal SCFA absorption: channelling acids without harm. Ruminant physiology: digestion, metabolism and impact of nutrition on gene expression, immunology and stress (ed. K Sejrsen, T Hvelplund and MO Nielsen), 173-195.
GÄBEL, G. & ASCHENBACH, J. 2007. SCFA, protons and ruminal epithelium: The good, the bad, the barrier. Production Diseases in Farm Animals. M. Fürll, ed. Universität Leipzig, Leipzig, Germany, 291.
GÄBEL, P., BESTMANN, M. & MARTENS, H. 1991. Influences of Diet, Short-Chain Fatty Acids, Lactate and Chloride on Bicarbonate Movement across the Reticulo-Rumen Wall of Sheep. Journal of Veterinary Medicine Series A, 38, 523-529.
GALFI, P., NEOGRADY, S., KUTAS, F. & VERESEGYHAZY, T. 1983. Keratinization of cultured ruminal epithelial cells treated with butyrate and lactate. Zentralbl Veterinarmed A, 30, 775-81.
GAO J., ZHANG H.J., YU S.H., WU S.G, YOON I., QUIGLEY J., GAO Y.P, QI G.H. 2008. Effects of Yeast Culture in Broiler Diets on Performance and Immunomodulatory Functions. Poultry Science. 87: 1377-1384
GARNER, M. R., FLINT, J. F. & RUSSELL, J. B. 2002. Allisonella histaminiformans gen. nov., sp. nov. A novel bacterium that produces histamine, utilizes histidine as its sole energy source, and could play a role in bovine and equine laminitis. Systems in Applied Microbiology, 25, 498-506.
GARRETT, E. F. 1996. Subacute rumen acidosis. Large Animal Veterinarian 51, 6-10. GARRETT, E. F., PEREIRA, M. N., NORDLUND, K. V., ARMENTANO, L. E., GOODGER,
W. J. & OETZEL, G. R. 1999. Diagnostic Methods for the Detection of Subacute Ruminal Acidosis in Dairy Cows. Journal of Dairy Science, 82, 1170-1178.
GARRY, F. 2002. Indigestion in Ruminanta. Large Animal Internal Medicine St Louis and Baltimore Mosby Elsevier
GARRY, F. & MCCONNEL, C. 2009. Indigestion in Ruminants. In: SMITH, B. (ed.) Large Animal Internal Medicine. St Louis, Missouri: Mosby Elsevier
GILL, M., SIDDONS, R. C., BEEVER, D. E. & ROWE, J. B. 1984. Lactate Metabolism in the Rumen of Silage-Fed Sheep. Journal of Animal Science 64, 169-170.
GOLDER, H. M., DENMAN, S. E., MCSWEENEY, C., CELI, P. & LEAN, I. J. 2014. Ruminal bacterial community shifts in grain-, sugar-, and histidine-challenged dairy heifers. Journal of Dairy Science, 97, 5131-50.
GONZÁLEZ, L. A., BISHOP-HURLEY, G. J., HANDCOCK, R. N. & CROSSMAN, C. 2015. Behavioral classification of data from collars containing motion sensors in grazing cattle. Computers and Electronics in Agriculture, 110, 91-102.
GOZHO, G. N., KRAUSE, D. O. & PLAIZIER, J. C. 2007. Ruminal lipopolysaccharide concentration and inflammatory response during grain-induced subacute ruminal acidosis in dairy cows. Journal of Dairy Science, 90, 856-66.
GOZHO, G. N., PLAIZIER, J. C., KRAUSE, D. O., KENNEDY, A. D. & WITTENBERG, K. M. 2005. Subacute ruminal acidosis induces ruminal lipopolysaccharide endotoxin release and triggers an inflammatory response. Journal of Dairy Science, 88, 1399-403.
GRAHAM, C. & SIMMONS, N. L. 2004. Functional organization of the bovine rumen epithelium. American Journal of Physiology-Regulatory Integrative and Comparative Physiology, 288, R173-R181.
GRAHN, N., OLOFSSON, M., ELLNEBO-SVEDLUND, K., MONSTEIN, H. J. & JONASSON, J. 2003. Identification of mixed bacterial DNA contamination in broad-range PCR amplification of 16S rDNA V1 and V3 variable regions by pyrosequencing of cloned amplicons. FEMS Microbiology Letters, 219.
GRANT, R. J. & ALBRIGHT, J. L. 1995. Feeding behavior and management factors during the transition period in dairy cattle. Journal of animal science, 73, 2791-2803.
GRANT, R. J., COLENBRANDER, V. F. & MERTENS, D. R. 1990. Milk Fat Depression in Dairy Cows: Role of Particle Size of Alfalfa Hay. Journal of Dairy Science, 73, 1823-1833.

211
GREENOUGH, P. R. & VERMUNT, J. J. 1991. Evaluation of subclinical laminitis in a dairy herd and observations on associated nutritional and management factors. The Veterinary record, 128, 11-17.
GUEDES, C. M., GONÇALVES, D., RODRIGUES, M. A. M. & DIAS-DA-SILVA, A. 2008. Effects of a Saccharomyces cerevisiae yeast on ruminal fermentation and fibre degradation of maize silages in cows. Animal Feed Science and Technology, 145, 27-40.
GUILLEN L.M. 2009. Determination of the Mechanism (s) by which direct fed microbials control Escherica coli O157:H7 in cattle, Oklahoma State University Press, Stillwater.
HAGG, F. M., ERASMUS, L. J., HENNING, P. H. & COERTZE, R. J. 2010. The effect of a direct fed microbial (Megasphaera elsdenii) on the productivity and health of Holstein cows. South African Journal of Animal Science, 40, 0-0.
HAN, X., YANG, Y., YAN, H., WANG, X., QU, L. & CHEN, Y. 2015. Rumen Bacterial Diversity of 80 to 110-Day-Old Goats Using 16S rRNA Sequencing. PLOS ONE, 10, e0117811.
HARBRO. 2017. Maxammon [Online]. https://www.harbro.co.uk/nutrition/innovative-products/maxammon/: Harbro. 2017].
HARMON, D. L. & RICHARDS, C. J. 1997. Considerations for gastrointestinal cannulations in ruminants. Journal of Animal Science, 75, 2248-2255.
HASHEMI, M., ZAMANI, F., VATANKHAH, M. & HOSSEN ZADEH, S. 2012. Effect of sodium bicarbonate and magnesium oxide on perfomance carcass characteristics of Lori-Bakhtiari fatting ram lambs Global Veterinaria, 8, 89-92.
HASSEN, A., JAMOUSSI, F., SAIDI, N., MABROUKI, Z. & FAKHFAKH, E. 2003. Microbial and copper adsorption by smectitic clay--an experimental study. Environmental Technologies, 24, 1117-27.
HEIJMANS, B. T., TOBI, E. W., STEIN, A. D., PUTTER, H., BLAUW, G. J., SUSSER, E. S., SLAGBOOM, P. E. & LUMEY, L. H. 2008. Persistent epigenetic differences associated with prenatal exposure to famine in humans. Proceedings of the National Academy of Sciences of the United States of America, 105, 17046-17049.
HENDERSON, G., COX, F., GANESH, S., JONKER, A., YOUNG, W. & JANSSEN, P. H. 2015. Rumen microbial community composition varies with diet and host, but a core microbiome is found across a wide geographical range. Nature Scientific Reports 5.
HERNANDEZ, J., BENEDITO, J. L., ABUELO, A. & CASTILLO, C. 2014. Ruminal acidosis in feedlot: from aetiology to prevention. Scientific World Journal, 2014, 702572.
HINDERS, R. G. & OWEN, F. G. 1965. Relation of ruminal parakeratosis development to volatile fatty acid absorption. Journal of Dairy Science, 48, 1069-73.
HO, E. & DASHWOOD, R. H. 2010. Dietary manipulation of histone structure and function. World review of nutrition and dietetics, 101, 95-102.
HOBSON, P. N. & STEWART, C. S. 1997. The Rumen Microbial Ecosystem, Springer. HOLTENIUS, K. & BJORNHAG, G. 1989. The significance of water absorption and fibre
digestion in the omasum of sheep, goats and cattle. Comparative Biochemistry and Physiology A: Comparative Physiology, 94, 105-9.
HOLZAPFEL, W. H., HABERER, P., SNEL, J., SCHILLINGER, U. & HUIS IN'T VELD, J. H. J. 1998. Overview of gut flora and probiotics. International Journal of Food Microbiology, 41, 85-101.
HUNGATE, R. E. 1950. The Anaerobic Mesophilic Cellulolytic Bacteria . Bacteriological Reviews, 14, 1-49.
HUNGATE, R. E. 1966. CHAPTER I - Introduction. The Rumen and its Microbes. Academic Press.
HUNTER, N. 2003. Scrapie and experimental BSE in sheep. British Medical Bulletin, 66, 171-183.
HUNTINGDON, G. & BRITTON, R. 1978. Effect of Dietary Lactic Acid Content and Energy Level on Rumen Lactate Metabolism in Sheep. Journal of Animal Science 47.
212
HUSVETH, F. 2011. Physiological and Reproduction Aspects of Animal Production; Metabolism of SCFA. Physiological and Reproduction Aspects of Animal Production. Hungary: University of Debrecen, University of West Hungary, Pannon University.
ISIK M., EKIMLER F., OZEN N., FIRST M.Z. 2004. Effects of using probiotics on the growth performance and health of dairy calves. Turkish Journal of Veterinary Animal Science. 28 (1): 63-69
ILLUMINA. 2016. Identify and compare bacteria from complex microbiomes or environments [Online]. http://www.illumina.com/areas-of-interest/microbiology/microbial-sequencing-methods/16s-rrna-sequencing.html. [Accessed 26/07/2016.
IRWIN, L. N., MITCHELL, G. E., JR., TUCKER, R. E. & SCHELLING, G. T. 1979. Histamine, tyramine, tryptamine and electrolytes during glucose induced lactic acidosis. Journal of Animal Science, 48, 367-74.
JACKSON, P. G. G. & COCKCROFT, P. D. 2007. Appendix 2: Laboratory Reference Values: Haematology. Clinical Examination of Farm Animals. Blackwell Science Ltd.
JAMI, E., ISRAEL, A., KOTSER, A. & MIZRAHI, I. 2013. Exploring the bovine rumen bacterial community from birth to adulthood. ISME J, 7, 1069-1079.
JAMI, E. & MIZRAHI, I. 2012. Composition and Similarity of Bovine Rumen Microbiota across Individual Animals. PLOS ONE, 7, e33306.
JAMI, E., WHITE, B. A. & MIZRAHI, I. 2014. Potential Role of the Bovine Rumen Microbiome in Modulating Milk Composition and Feed Efficiency. PLOS ONE, 9, e85423.
JENSEN GS., PATTERSON K.M., YOON I. 2008. Yeast culture has anti-inflammatory effects and specifically activates NK cells. Comparative Immunology, Microbiology and Infectious Disease, 31 (6): 487-500.
JOHNSON, L. M., HARRISON, J. H., DAVIDSON, D., MAHANNA, W. C. & SHINNERS, K. 2003. Corn silage management: effects of hybrid, chop length, and mechanical processing on digestion and energy content. Journal of Dairy Science, 86, 208-31.
JOSEFSEN, T. D., AAGNES, T. H. & MATHIESEN, S. D. 1997. Influence of diet on the occurrence of intraepithelial microabscesses and foreign bodies in the ruminal mucosa of reindeer calves (Rangifer tarandus tarandus). Zentralbl Veterinarmed A, 44, 249-57.
JOUANY J.P. 2006. Optimising rumen functions in the close-up transition period and early lactation to drive dry matter intake and energy balance in cows. Animal Reproductive Science, 96 (3): 250-264
KALEBICH C. C., CARDOSA F. C. 2017. Nutrients in Dairy and Their Implications for Health and Disease. Effects of Direct-Fed Microbials on Feed Intake, Milk Yield, Milk Composition, Feed Conversion, and Health Condition of Dairy Cows, Elsevier p110-122
KAMPHUIS, C., DELARUE, B., BURKE, C. R. & JAGO, J. 2012. Field evaluation of 2 collar-mounted activity meters for detecting cows in estrus on a large pasture-grazed dairy farm. Journal of Dairy Science, 95, 3045-3056.
KAUR, R., GARCIA, S., HORADAGODA, A. & FULKERSON, W. 2010. Evaluation of rumen probe for continuous monitoring of rumen pH, temperature and pressure.
KEUNEN, J. E., PLAIZIER, J. C., KYRIAZAKIS, L., DUFFIELD, T. F., WIDOWSKI, T. M., LINDINGER, M. I. & MCBRIDE, B. W. 2002. Effects of a Subacute Ruminal Acidosis Model on the Diet Selection of Dairy Cows. Journal of Dairy Science, 85, 3304-3313.
KHAFIPOUR, E., KRAUSE, D. O. & PLAIZIER, J. C. 2009. A grain-based subacute ruminal acidosis challenge causes translocation of lipopolysaccharide and triggers inflammation. Journal of Dairy Science, 92, 1060-70.
KIM, M., KIM, J., KUEHN, L. A., BONO, J. L., BERRY, E. D., KALCHAYANAND, N., FREETLY, H. C., BENSON, A. K. & WELLS, J. E. 2014. Investigation of bacterial diversity in the feces of cattle fed different diets1. Journal of Animal Science, 92, 683-694.
KLEEN, J. L. & CANNIZZO, C. 2012. Incidence, prevalence and impact of SARA in dairy herds. Animal Feed Science and Technology, 172, 4-8.
213
KLEEN, J. L., HOOIJER, G. A., REHAGE, J. & NOORDHUIZEN, J. P. T. M. 2003. Subacute Ruminal Acidosis (SARA): a Review. Journal of Veterinary Medicine Series A, 50, 406-414.
KLEEN, J. L., HOOIJER, G. A., REHAGE, J. & NOORDHUIZEN, J. P. T. M. 2009. Subacute ruminal acidosis in Dutch dairy herds. Veterinary Record, 164, 681-684.
KLEEN, J. L., UPGANG, L. & REHAGE, J. 2013. Prevalence and consequences of subacute ruminal acidosis in German dairy herds. Acta Vet Scand, 55, 48.
KLEVENHUSEN, F., HOLLMANN, M., PODSTATZKY-LICHTENSTEIN, L., KRAMETTER-FRÖTSCHER, R., ASCHENBACH, J. R. & ZEBELI, Q. 2013. Feeding barley grain-rich diets altered electrophysiological properties and permeability of the ruminal wall in a goat model. Journal of Dairy Science, 96.
KNAPP, B., BAKER, A. L. & PHILLIPS, R. W. 1943. Variations in the Occurrence of Bloat in the Steer Progeny of Beef Bulls. Journal of Animal Science, 2, 221-225.
KOCAMIS, H. & KILLEFER, J. 2002. Myostatin expression and possible functions in animal muscle growth. Domestic Animal Endocrinology, 23, 447-54.
KOH-TAN, H. H. C. 2015. EMSB. In: DEPT., H. (ed.). Southern General Hospital, Glasgow KOHN, R. A. & DUNLAP, T. F. 1998. Calculation of the buffering capacity of bicarbonate in
the rumen and in vitro. Journal of animal science, 76, 1702-1709. KRAUSE, D. & RUSSELL, J. B. 1996. How Many Ruminal Bacteria Are There? Journal of
Dairy Science, 79, 1467-1475. KRAUSE, K. M. & COMBS, D. K. 2003. Effects of forage particle size, forage source, and
grain fermentability on performance and ruminal pH in midlactation cows. Journal of Dairy Science, 86, 1382-97.
KRAUSE, K. M., COMBS, D. K. & BEAUCHEMIN, K. A. 2002. Effects of forage particle size and grain fermentability in midlactation cows. II. Ruminal pH and chewing activity. Journal of Dairy Science, 85, 1947-57.
KRAUSE, K. M. & OETZEL, G. R. 2005. Inducing subacute ruminal acidosis in lactating dairy cows. Journal of Dairy Science, 88, 3633-3639.
KREHBIEL, C. R., RUST, S. R., ZHANG, G. & GILLILAND, S. E. 2003. Bacterial direct-fed microbials in ruminant diets: Performance response and mode of action12. Journal of Animal Science, 81, E120-E132.
KUDVA, I. T., HATFIELD, P. G. & HOVDE, C. J. 1995. Effect of diet on the shedding of Escherichia coli O157:H7 in a sheep model. Appl Environ Microbiol, 61, 1363-70.
KUNG, L. & HESSION, A. O. 1995. Preventing in vitro lactate accumulation in ruminal fermentations by inoculation with Megasphaera elsdenii. Journal of animal science, 73, 250-256.
KURASHIMA, Y., GOTO, Y. & KIYONO, H. 2013. Mucosal innate immune cells regulate both gut homeostasis and intestinal inflammation. Eur J Immunol, 43.
LAN, R. Y., SELMI, C. & GERSHWIN, M. E. 2008. The regulatory, inflammatory, and T cell programming roles of interleukin-2 (IL-2). J Autoimmun, 31.
LANE, M. A. & JESSE, B. W. 1997. Effect of volatile fatty acid infusion on development of the rumen epithelium in neonatal sheep. Journal of Dairy Science, 80, 740-6.
LARDNER, A. 2001. The effects of extracellular pH on immune function. J Leukoc Biol, 69. LAVKER, R., CHALUPA, W. & DICKEY, J. F. 1969. An electron microscopic investigation of
rumen mucosa. J Ultrastruct Res, 28, 1-15. LAWHON, S. D., MAURER, R., SUYEMOTO, M. & ALTIER, C. 2002. Intestinal short-chain
fatty acids alter Salmonella typhimurium invasion gene expression and virulence through BarA/SirA. Mol Microbiol, 46, 1451-64.
LE RUYET, P. & TUCKER, W. B. 1992. Ruminal buffers: temporal effects on buffering capacity and pH of ruminal fluid from cows fed a high concentrate diet. Journal of Dairy Science, 75, 1069-77.
LEEK, B. F. 1983. Clinical diseases of the rumen: a physiologist's view. The Veterinary record, 113, 10-14.

214
LEHLOENYA K.V., KREHBIEL C.R., MERTZ K.J., REHBERGER T.G., SPICER L.T. 2008. Effects of propionibacteria and yeast culture fed to streers on nutrient intake and site and extent of digestion. Journal of Dairy Science. 91 (2): 653-662
LI, R. W., WU, S., BALDWIN, R. L. V. I., LI, W. & LI, C. 2012a. Perturbation Dynamics of the Rumen Microbiota in Response to Exogenous Butyrate. PLOS ONE, 7, e29392.
LI, S., KHAFIPOUR, E., KRAUSE, D. O., KROEKER, A., RODRIGUEZ-LECOMPTE, J. C., GOZHO, G. N. & PLAIZIER, J. C. 2012b. Effects of subacute ruminal acidosis challenges on fermentation and endotoxins in the rumen and hindgut of dairy cows. Journal of Dairy Science, 95, 294-303.
LIM, J. Y., YOON, J. W. & HOVDE, C. J. 2010. A Brief Overview of Escherichia coli O157:H7 and Its Plasmid O157. Journal of microbiology and biotechnology, 20, 5-14.
LIU, J.-H., BIAN, G.-R., ZHU, W.-Y. & MAO, S.-Y. 2015. High-grain feeding causes strong shifts in ruminal epithelial bacterial community and expression of Toll-like receptor genes in goats. Frontiers in Microbiology, 6, 167.
LIU, J. H., XU, T. T., LIU, Y. J., ZHU, W. Y. & MAO, S. Y. 2013. A high-grain diet causes massive disruption of ruminal epithelial tight junctions in goats. American Journal of Physiology-Regulatory Integrative and Comparative Physiology, 305, R232-R241.
LIU, X., WANG, J., LI, R., YANG, X., SUN, Q., ALBRECHT, E. & ZHAO, R. 2011. Maternal dietary protein affects transcriptional regulation of myostatin gene distinctively at weaning and finishing stages in skeletal muscle of Meishan pigs. Epigenetics, 6, 899-907.
LIVAK, K. J. & SCHMITTGEN, T. D. 2001. Analysis of relative gene expression data using real-time quantitative PCR and the 2(-Delta Delta C(T)) Method. Methods, 25, 402-8.
LLOYD, D., WILLIAMS, A. G., AMANN, R., HAYES, A. J., DURRANT, L. & RALPHS, J. R. 1996. Intracellular prokaryotes in rumen ciliate protozoa: Detection by confocal laser scanning microscopy after in situ hybridization with fluorescent 16S rRNA probes. European Journal of Protistology, 32, 523-531.
LOERCH, S. C. & FLUHARTY, F. L. 1999. Physiological changes and digestive capabilities of newly received feedlot cattle. Journal of Animal Science, 77, 1113-9.
LONCKE, C., ORTIGUES-MARTY, I., VERNET, J., LAPIERRE, H., SAUVANT, D. & NOZIERE, P. 2009. Empirical prediction of net portal appearance of volatile fatty acids, glucose, and their secondary metabolites (beta-hydroxybutyrate, lactate) from dietary characteristics in ruminants: A meta-analysis approach. Journal of Animal Science, 87, 253-68.
LOOR, J. J., ELOLIMY, A. A. & MCCANN, J. C. 2016. Dietary impacts on rumen microbiota in beef and dairy production. Animal Frontiers, 6, 22-29.
LOOSLI, J. K. & MCDONALD, I. W. 1968. Nonprotein Nitrogen in the Nutrition of Ruminants. In: ORGANISATION, F. A. A. (ed.). Italy FAO.
LOWMAN, B. 2017. Options for harvesting cereals for beef cattle feed. In: EBLEX, A. A. H. D. B. (ed.). EBLEX.
LOZUPONE, C. & KNIGHT, R. 2005. UniFrac: a New Phylogenetic Method for Comparing Microbial Communities. Applied and Environmental Microbiology, 71, 8228-8235.
MAEKAWA, M., BEAUCHEMIN, K. A. & CHRISTENSEN, D. A. 2002. Effect of Concentrate Level and Feeding Management on Chewing Activities, Saliva Production, and Ruminal pH of Lactating Dairy Cows. Journal of Dairy Science, 85, 1165-1175.
MAGEE, H. E. 1932. Observations on Digestion in the Ruminant. Journal of Experimental Biology, 9, 409.
MALHI, M., WANG, J., GUI, H. & SHEN, Z. 2013. Ruminal butyrate infusion increased papillae size and digesta weight but did not change liquid flow rate in the rumen of goats.
MALMUTHUGE, N., GRIEBEL, P. J. & GUAN, L. L. 2014. Taxonomic Identification of Commensal Bacteria Associated with the Mucosa and Digesta throughout the Gastrointestinal Tracts of Preweaned Calves. Applied and Environmental Microbiology, 80, 2021-2028.

215
MALMUTHUGE, N., GRIEBEL, P. J. & GUAN, L. L. 2015. The Gut Microbiome and Its Potential Role in the Development and Function of Newborn Calf Gastrointestinal Tract. Frontiers in Veterinary Science, 2, 36.
MANDEBVU, P. & GALBRAITH, H. 1999. Effect of sodium bicarbonate supplementation and variation in the proportion of barley and sugar beet pulp on growth performance and rumen, blood and carcass characteristics of young entire male lambs. Animal Feed Science and Technology, 82, 37-49.
MANI, V., WEBER, T. E., BAUMGARD, L. H. & GABLER, N. K. 2012. Growth and Development Symposium: Endotoxin, inflammation, and intestinal function in livestock. Journal of Animal Science, 90.
MAO, S., HUO, W., LIU, J., ZHANG, R. & ZHU, W. 2017. In vitro effects of sodium bicarbonate buffer on rumen fermentation, levels of lipopolysaccharide and biogenic amine, and composition of rumen microbiota. Journal of the Science of Food and Agriculture, 97, 1276-1285.
MARCHESINI, G., DE NARDI, R., GIANESELLA, M., STEFANI, A.-L., MORGANTE, M., BARBERIO, A., ANDRIGHETTO, I. & SEGATO, S. 2013. Effect of induced ruminal acidosis on blood variables in heifers. BMC Veterinary Research, 9, 98-98.
MARDEN, J. P., JULIEN, C., MONTEILS, V., AUCLAIR, E., MONCOULON, R. & BAYOURTHE, C. 2008. How does live yeast differ from sodium bicarbonate to stabilize ruminal pH in high-yielding dairy cows? Journal of Dairy Science, 91, 3528-35.
MARTIN, M,. 2011, Cutadapt removes adapter sequences from high-throughput sequencing reads. EMBnet Journal, 17(1) 10-12
MASELLA, A.P., BARTRAM, A.K., TRUSZKOWSKI, J.M., BROWN, D.G., NEUFELD, J.D., 20120, PANDAseq: paired-end assembler for illumina sequences. BMC Bioinformatics , 13 (31).
MCALLISTER, T. A., BEAUCHEMIN, K. A., ALAZZEH, A. Y., BAAH, J., TEATHER, R. M. & STANFORD, K. 2011. Review: The use of direct fed microbials to mitigate pathogens and enhance production in cattle. Canadian Journal of Animal Science, 91, 193-211.
MCDOUGALL, E. I. 1948. Studies on ruminant saliva. 1. The composition and output of sheep's saliva. Biochemical Journal, 43, 99-109.
MCDONALD, P., 2012, An improved Greengenes taxonomy with explicit ranks for ecological and evolutionary analyses of bacteria and archaea. ISME Multidisciplinary Journal of Microbial Ecology, 6(3): 610–618.
MCLEAY, L. M. & SMITH, B. L. 2006. Effects of ergotamine and ergovaline on the electromyographic activity of smooth muscle of the reticulum and rumen of sheep. American Journal of Veterinary Research, 67, 707-714.
MERTENS, D. R. 1994. Regulation of Forage Intake. In: FAHEY, G. C. (ed.) Forage Quality, Evalation and Utilisation. Madison, Wisconsin: ASA, CSSA, SSSA.MERTENS, D. R. 1997. Creating a system for meeting the fiber requirements of dairy cows. Journal of Dairy Science, 80, 1463-81
METZLER-ZEBELI, B. U., HOLLMANN, M., SABITZER, S., PODSTATZKY-LICHTENSTEIN, L., KLEIN, D. & ZEBELI, Q. 2013. Epithelial response to high-grain diets involves alteration in nutrient transporters and Na+/K+-ATPase mRNA expression in rumen and colon of goats. Journal of Animal Science, 91, 4256-66.
MICHIE, C., DAVISON, C., FAURE, A., TACHTATZIS, C., ANDONOVIC, I., SOMERVILLE, L. & JONSSON, N. 2015. Measurement of rumen motility using a tri-axil gyroscopic bolus.
216
MINATO, H., OTSUKA, M., SHIRASAKA, S., ITABASHI, H. & MITSUMORI, M. 1992. Colonisation of microorganisms in the rumen of young calves. Journal of General and Applied Microbiology, 38, 447-456.
MØLLER, P. D., DIERNÆS, L., SEHESTED, J., HYLDGAARD-JENSEN, J. & SKADHAUGE, E. 1997. Absorption and Fate of l- and d-Lactic Acid in Ruminants. Comparative Biochemistry and Physiology Part A: Physiology, 118, 387-388.
MORGANTE, M., STELLETTA, C., BERZAGHI, P., GIANESELLA, M. & ANDRIGHETTO, I. 2007. Subacute rumen acidosis in lactating cows: an investigation in intensive Italian dairy herds. Journal of Animal Physiology and Animal Nutrition, 91, 226-234.
MOTTRAM, T., LOWE, J., MCGOWAN, M. & PHILLIPS, N. 2008. Technical note: A wireless telemetric method of monitoring clinical acidosis in dairy cows. Computers and Electronics in Agriculture, 64, 45-48.
MOUNT, J. A., KARROW, N. A., CASWELL, J. L., BOERMANS, H. J. & LESLIE, K. E. 2009. Assessment of bovine mammary chemokine gene expression in response to lipopolysaccharide, lipotechoic acid + peptidoglycan, and CpG oligodeoxynucleotide 2135. Can J Vet Res, 73.
MULLIGAN, F. J., CARTY, C. & DOHERTY, M. Subacute ruminal acidosis and low rumen pH in dairy cows: A nutritional perspective including causes and consequences. WG3 Workshop, 2016 University of Strathclyde, Glasgow. University College Dublin.
MULLIGAN, F. J., O’GRADY, L., RICE, D. A. & DOHERTY, M. L. 2006. A herd health approach to dairy cow nutrition and production diseases of the transition cow. Animal Reproduction Science, 96, 331-353.
NAGARAJA, T. G. & CHENGAPPA, M. M. 1998. Liver abscesses in feedlot cattle: a review. Journal of Animal Science, 76, 287-98.
NAGARAJA, T. G. & TITGEMEYER, E. C. 2007. Ruminal acidosis in beef cattle: the current microbiological and nutritional outlook. Journal of Dairy Science, 90 Suppl 1, E17-38.
NAVARRE, C. B., BAIRD, A. N. & PUGH, D. G. 2012. Diseases of the Gastrointestinal System.
NEWBOLD, C. J., WALLACE, R. J. & MCINTOSH, F. M. 1996. Mode of action of the yeast Saccharomyces cerevisiae as a feed additive for ruminants. British Journal of Nutrition, 76, 249-61.
NICKEL, R., SCHUMMER, A. & SEIFERLE, E. 2013. The Viscera of the Domestic Mammals, Berlin, Springer-Verlag.
NOCEK, J. E. 1997. Bovine acidosis: Implications on laminitis. Journal of Dairy Science, 80, 1005-1028.
NOCEK, J. E., HEALD, C. W. & POLAN, C. E. 1984. Influence of Ration Physical Form and Nitrogen Availability on Ruminal Morphology of Growing Bull Calves. Journal of Dairy Science, 67, 334-343.
NOCEK, J. E. & KAUTZ, W. P. 2006. Direct-Fed Microbial Supplementation on Ruminal Digestion, Health, and Performance of Pre- and Postpartum Dairy Cattle. Journal of Dairy Science, 89, 260-266.
NOCEK, J. E., KAUTZ, W. P., LEEDLE, J. A. & BLOCK, E. 2003. Direct-fed microbial supplementation on the performance of dairy cattle during the transition period. Journal of Dairy Science, 86, 331-5.
NOCEK, J. E., KAUTZ, W. P., LEEDLE, J. A. Z. & ALLMAN, J. G. 2002. Ruminal Supplementation of Direct-Fed Microbials on Diurnal pH Variation and In Situ Digestion in Dairy Cattle. Journal of Dairy Science, 85, 429-433.
NORDLUND, K. V. 2003. Herd-Based Diagnosis of Subacute Ruminal Acidosis. American Association of Bovine Practitioners. Columbus, OH, USA.
NORGAARD, P. 1989. The Influence of Physical Form of Ration on Chewing Activity and Rumen Motility in Lactating Cows. Acta Agriculturae Scandinavica, 39, 187-202.
NOVAK K.N., DAVIS E., WEHNES C.A., SHIELDS D.R., COALSON J.A., SMITH A.H., REHBERGER T.G. 2002. Effects of supplementation with an electrolyte containing a Bacillus-based dire-fed microbial on immune development in dairy calves, Research in Veterinary Science, 92 (3): 427-434

217
NRC 2001. Nutrient Requirements of Dairy Cattle, Washington, D.C, National Academy Press.
O'CONNOR, W. N. & VALLE, S. 1982. A Combination Verhoeffs Elastic and Masson's Trichrome Stain for Routine Histology. Stain Technology, 57, 207-210.
O’SHEA, E., WATERS, S. M., KEOGH, K., KELLY, A. K. & KENNY, D. A. 2016. Examination of the molecular control of ruminal epithelial function in response to dietary restriction and subsequent compensatory growth in cattle. Journal of Animal Science and Biotechnology, 7, 53.
OBA, M. 2015. RE: Rumen papillae biopsy from 14 lactating dairy cows without the preventive use of antibiotics Type to HASTIE, P.
OETZEL G.R., EMERY K.M., KAUTZ W.P., NOCEK J.E. 2007. Direct-fed microbial supplementation and health and performance of pre- and postpartum dairy cattle: a field trial. Journal of Dairy Science, 90 (4): 2058 – 2068
OH, M. R., HONG, H., LI, H. L., JEON, B. T., CHOI, C. H., DING, Y. L., TANG, Y. J., KIM, E. K., JANG, S. Y., SEONG, H. J. & MOON, S. H. 2016. Effects of Physically Effective Neutral Detergent Fiber Content on Intake, Digestibility, and Chewing Activity in Fattening Heifer Fed Total Mixed Ration. Asian-Australasian Journal of Animal Sciences, 29, 1719-1724.
OKINE, E. K., MATHISON, G. W., KASKE, M., KENNELLY, J. J. & CHRISTOPHERSON, R. J. 1998. Current understanding of the role of the reticulum and reticulo-omasal orifice in the control of digesta passage from the ruminoreticulum of sheep and cattle. Canadian Journal of Animal Science, 78, 15-21.
ØRSKOV, E. R. 1998. The Feeding of Ruminants: Principles and Practice, Southampton, Chalcombe Publications.
ØRSKOV, E. R., MACDEARMID, A., GRUBB, D. A. & INNES, G. M. 1981. Utilization of alkali-treated grain. 1. Alkali-treated grain in complete diets for steers and lambs. Animal Feed Science and Technology, 6, 273-283.
OWENS, F. N., SECRIST, D. S., HILL, W. J. & GILL, D. R. 1998. Acidosis in cattle: A review. Journal of Animal Science, 76, 275-286.
PATRA, R. C., LAL, S. B. & SWARUP, D. 1996. Biochemical profile of rumen liquor, blood and urine in experimental acidosis in sheep. Small Ruminant Research, 19, 177-180.
PARK, B.S, LEE, J.O., Recognition of lipopolysaccharide pattern by TLR4 complexes, 2013, Experimental and Molecular Medicine, 45 (e66)
PENDERS, J., THIJS, C., VINK, C., STELMA, F. F., SNIJDERS, B., KUMMELING, I., VAN DEN BRANDT, P. A. & STOBBERINGH, E. E. 2006. Factors influencing the composition of the intestinal microbiota in early infancy. Pediatrics, 118, 511-21.
PENDLETON, B. 1998. The regulatory environment. Direct-Fed Microbial, Enzyme and Forage Additive Compendium., Minnetonka, Minnesota, The Miller Publishing Company
PENN STATE, Pennsylvania State University, 2018 Penn State Particle Separator, Penn state particle separator instructions, available: https://extension.psu.edu/penn-state-particle-separator#section-7
PENNER, G. B., ASCHENBACH, J. R., GABEL, G., RACKWITZ, R. & OBA, M. 2009a. Epithelial capacity for apical uptake of short chain fatty acids is a key determinant for intraruminal pH and the susceptibility to subacute ruminal acidosis in sheep. J Nutr, 139, 1714-20.
PENNER, G. B. & BEAUCHEMIN, K. 2010. Variation in the Susceptibility to Ruminal Acidosis: Challenge or Opportunity? WCDS Advances in Dairy Technology 22, 173-187.
PENNER, G. B., BEAUCHEMIN, K. A. & MUTSVANGWA, T. 2006. An evaluation of the accuracy and precision of a stand-alone submersible continuous ruminal pH measurement system. Journal of Dairy Science, 89, 2132-40.
PENNER, G. B., BEAUCHEMIN, K. A. & MUTSVANGWA, T. 2007. Severity of Ruminal Acidosis in Primiparous Holstein Cows During the Periparturient Period. Journal of Dairy Science, 90, 365-375.

218
PENNER, G. B., TANIGUCHI, M., GUAN, L. L., BEAUCHEMIN, K. A. & OBA, M. 2009b. Effect of dietary forage to concentrate ratio on volatile fatty acid absorption and the expression of genes related to volatile fatty acid absorption and metabolism in ruminal tissue. Journal of Dairy Science, 92, 2767-2781.
PETERS, J. P., SHEN, R. Y., ROBINSON, J. A. & CHESTER, S. T. 1990. Disappearance and passage of propionic acid from the rumen of the beef steer. Journal of animal science, 68, 3337-3349.
PETRI, R. M., SCHWAIGER, T., PENNER, G. B., BEAUCHEMIN, K. A., FORSTER, R. J., MCKINNON, J. J. & MCALLISTER, T. A. 2014. Characterization of the Core Rumen Microbiome in Cattle during Transition from Forage to Concentrate as Well as during and after an Acidotic Challenge. PLOS ONE, 8, e83424.
PHILLIPS, T. D., LEMKE, S. L. & GRANT, P. G. 2002. Characterization of clay-based enterosorbents for the prevention of aflatoxicosis. Adv Exp Med Biol, 504, 157-71.
PITTA, D. W., PARMAR, N., PATEL, A. K., INDUGU, N., KUMAR, S., PRAJAPATHI, K. B., PATEL, A. B., REDDY, B. & JOSHI, C. 2014. Bacterial Diversity Dynamics Associated with Different Diets and Different Primer Pairs in the Rumen of Kankrej Cattle. PLOS ONE, 9, e111710.
PLAIZIER, J. C. 2004. Replacing chopped alfalfa hay with alfalfa silage in barley grain and alfalfa-based total mixed rations for lactating dairy cows. Journal of Dairy Science, 87, 2495-505.
PLAIZIER, J. C., KHAFIPOUR, E., LI, S., GOZHO, G. N. & KRAUSE, D. O. 2012. Subacute ruminal acidosis (SARA), endotoxins and health consequences. Animal Feed Science and Technology, 172, 9-21.
PLAIZIER, J. C., KRAUSE, D. O., GOZHO, G. N. & MCBRIDE, B. W. 2008. Subacute ruminal acidosis in dairy cows: The physiological causes, incidence and consequences. The Veterinary Journal, 176, 21-31.
POMEROY,B., SIPKA, A., HUSSEN, J., EGER, M., SCHUKKEN, Y., SCHUBERTH, H.J. 2017, Counts of bovine monocyte subsets prior to calving are predictive for postpartum occurrence of mastitis and metritis, Veterinary Research, 48 (13)
PRICE, M.N., DEHAL, P.S., ARKIN, A.P., 2012, FastTree 2-Approximately Maximum-
Likelihood Trees for Large Alignments, Plos One, 5(3)
PRINS, R. A., HUNGATE, R. E. & PRAST, E. R. 1972. Function of the omasum in several ruminant species. Comparative Biochemistry and Physiology Part A: Physiology, 43, 155-163.
QADIS, A. Q., GOYA, S., YATSU, M., YOSHIDA, Y.-U., ICHIJO, T. & SATO, S. 2014. Effects of a Bacteria-Based Probiotic on Subpopulations of Peripheral Leukocytes and Their Cytokine mRNA Expression in Calves. The Journal of Veterinary Medical Science, 76, 189-195.
RABELO, E., REZENDE, R. L., BERTICS, S. J. & GRUMMER, R. R. 2003. Effects of Transition Diets Varying in Dietary Energy Density on Lactation Performance and Ruminal Parameters of Dairy Cows. Journal of Dairy Science, 86, 916-925.
RADOSTITS, O. M., GAY, C. C., HINCHCLIFF, K. W. & CONSTABLE, P. D. 2007. Veterinary Medicine: a textbook of the diseases of cattle, horses, sheep, pigs and goats, Saunders Elsevier.
RAGFAR 2007. Ruminal Acidosis - understandings, prevention and treatment In: ASSOCIATION, A. V. (ed.).
RAJAN, G. H., MORRIS, C. A., CARRUTHERS, V. R., WILKINS, R. J. & WHEELER, T. T. 1996. The relative abundance of a salivary protein, bSP30, is correlated with succeptibility to bloat in cattle herds selected for high or low bloat susceptibility. Animal Genetics 27, 407-414.
REALINI, C. E., DUCKETT, S. K., BRITO, G. W., DALLA RIZZA, M. & DE MATTOS, D. 2004. Effect of pasture vs. concentrate feeding with or without antioxidants on carcass characteristics, fatty acid composition, and quality of Uruguayan beef. Meat Science, 66, 567-577.
219
REN, K. and TORRES, R., 2009, Role of interleukin-1β during pain and inflammation, Brain Research Reviews, 60(1): 57–64.
REYNOLDS, C. K., HUNTINGTON, G. B., TYRRELL, H. F. & REYNOLDS, P. J. 1988. Net metabolism of volatile fatty acids, D-beta-hydroxybutyrate, nonesterifield fatty acids, and blood gasses by portal-drained viscera and liver of lactating Holstein cows. Journal of Dairy Science, 71, 2395-405.
ROBINSON, P. Yeast products for growing and lactating dairy cattle: impacts on rumen fermentation and performance. XII Interational Meeting In Milk and Meat production in Hot Climates, 2002 University of Baja, California, Mexicali, Mexico. 12.
ROBINSON, P. H. & GARRETT, J. E. 1999. Effect of yeast culture (Saccharomyces cerevisiae) on adaptation of cows to postpartum diets and on lactational performance. Journal of animal science, 77, 988-999.
ROTH, L. & KING, J. M. 1991. Traumatic Reticulitis in Cattle: A Review of 60 Fatal Cases. Journal of Veterinary Diagnostic Investigation, 3, 52-54.
ROUSSEAU, J. P. & FALEMPIN, M. 1985. [Neural control of the motility of the reticulo-rumen]. Reproductive and Nutritional Development, 25, 763-75.
RUCKEBUSCH, Y. & TOMOV, T. 1973. The sequential contractions of the rumen associated with eructation in sheep. The Journal of Physiology, 235, 447-458.
RUEDEN, C. T.; SCHINDELIN, J. & HINER, M. C. et al. (2017), "ImageJ2: ImageJ for the next generation of scientific image data", BMC Bioinformatics 18:529.
RUSSELL, J. B. & CHOW, J. M. 1993. Another Theory for the Action of Ruminal Buffer Salts: Decreased Starch Fermentation and Propionate Production. Journal of Dairy Science, 76, 826-830.
SAKATA, T. & TAMATE, H. 1978. Rumen epithelial cell proliferation accelerated by rapid increase in intraruminal butyrate. Journal of Dairy Science, 61, 1109-13.
SALMINEN, S., ISOLAURI, E. & SALMINEN, E. 1996. Clinical uses of probiotics for stabilizing the gut mucosal barrier: successful strains and future challenges. Antonie van Leeuwenhoek, 70, 347-358.
SAMAD, A., AWAZ, K. B. & SARKATE, L. B. 1994. Diagnosis of Bovine Traumatic Reticulo-Peritonitis 1: Strength of Clinical Signs in Predicting Correct Diagnosis. Journal of Applied Animal Research, 6, 13-18.
SANDER, E. G., WARNER, R. G., HARRISON, H. N. & LOOSLI, J. K. 1959. The Stimulatory Effect of Sodium Butyrate and Sodium Propionate on the Development of Rumen Mucosa in the Young Calf. Journal of Dairy Science, 42, 1600-1605.
SARASHINA, T., ICHIJO, S., TAKAHASHI, J. & OSAME, S. 1990. Origin of abomasum gas in the cows with displaced abomasum. Nihon Juigaku Zasshi, 52, 371-8.
SATTLER, N., FECTEAU, G., LAPOINTE, J., CHOUINARD, L., BABKINE, M., DESROCHERS, A., COUTURE, Y. & DUBREULL, P. 2000. Etiology, forms and prognosis of gastrointestinal dysfunction resembling vagal indigestion occuring after surgical correction of right abomasal displacement. Canadian Veterinary Journal, 41, 777-785.
SCALA, G., CORONA, M. & MARUCCIO, L. 2011. Structural, histochemical and immunocytochemical study of the forestomach mucosa in domestic ruminants. Anatomical and Histological Embryology, 40, 47-54.
SCHALK, A. F. & AMADON, R. S. 1928. Physiology of the ruminant stomach (bovine): study of the dynamic factors, [Fargo], Agricultural Experiment Station, North Dakota Agricultural College.
SCHELCHER, F., VALARCHER, J. F. & ESPINASSE, J. 1992. Abnormal ruminal digestion in cattle with dominantly non-digestive disorders. Dtsch Tierarztl Wochenschr, 99, 175-82.
SCHLAU, N., GUAN, L. L. & OBA, M. 2012. The relationship between rumen acidosis resistance and expression of genes involved in regulation of intracellular pH and butyrate metabolism of ruminal epithelial cells in steers. Journal of Dairy Science, 95, 5866-5875.

220
SCHNORR, B. & VOLLMERHAUS, B. 1966. Das Oberflach enrelief der Pansenschleimhaut bei Rind und Ziege. Zentralblatt für Veterinärmedizin Reihe A, 14, 93-104.
SEO J.K., KIM S.W., KIM M.H., UPADHAYA S.D., KAM D.K, HA J.K.. 2010. Direct-fed microbials for ruminant animals. Asian Australasian Journal of Animal Science. 23 (12): 1657-1667SEDEREVICIUS, A. & KANTAUTAITE, J. 1993. Different forms of rumen dystonia in dairy cows. Acta Vet Scand Suppl, 89, 119-24.
SEGATA, N., IZARD, J., WALDRON, L., GEVERS, D., MIROPOLSKY, L., GARRETT, W. S. & HUTTENHOWER, C. 2011. Metagenomic biomarker discovery and explanation. Genome Biology, 12, R60.
SHARMA, V. & MCNEILL, J. H. 2009. To scale or not to scale: the principles of dose extrapolation. British Journal of Pharmacology, 157, 907-21.
SHAVER, R. D. TMR strategies for transiton feeding of diary cows. In: LINN, J., WAGNER, G. & DE STENO, P., eds. 54th Minnesota Nutrition Conference, 1993 Minnesota 163-183.
SHAVER, R. D. 1997. Nutritional Risk Factors in the Etiology of Left Displaced Abomasum in Dairy Cows: A Review1. Journal of Dairy Science, 80, 2449-2453.
SHEN, H., LU, Z., CHEN, Z., WU, Y. & SHEN, Z. 2016. Rapid Fermentable Substance Modulates Interactions between Ruminal Commensals and Toll-Like Receptors in Promotion of Immune Tolerance of Goat Rumen. Frontiers in Microbiology, 7, 1812.
SHEN, Z., SEYFERT, H.-M., LÖHRKE, B., SCHNEIDER, F., ZITNAN, R., CHUDY, A., KUHLA, S., HAMMON, H. M., BLUM, J. W., MARTENS, H., HAGEMEISTER, H. & VOIGT, J. 2004. An Energy-Rich Diet Causes Rumen Papillae Proliferation Associated with More IGF Type 1 Receptors and Increased Plasma IGF-1 Concentrations in Young Goats. The Journal of Nutrition, 134, 11-17.
SHORROCKS, B. 2016. The Giraffe: biology, ecology, evolution and behaviour USA, John Wiley & Sons
SIEVERS, A. K., KRISTENSEN, N. B., LAUE, H.-J. & WOLFFRAM, S. 2004. Development of an intraruminal device for data sampling and transmission. Journal of Animal and Feed Sciences, 13, 207-210.
SINGH, K., ERDMAN, R. A., SWANSON, K. M., MOLENAAR, A. J., MAQBOOL, N. J., WHEELER, T. T., ARIAS, J. A., QUINN-WALSH, E. C. & STELWAGEN, K. 2010. Epigenetic regulation of milk production in dairy cows. Journal of Mammary Gland Biology and Neoplasia, 15, 101-12.
SKINNER, M. K., MANIKKAM, M. & GUERRERO-BOSAGNA, C. 2010. Epigenetic transgenerational actions of environmental factors in disease etiology. Trends Endocrinolology and Metabolism, 21, 214-22.
SMITH, D. F. 1978. Right-side torsion of the abomasum in dairy cows: classification of severity and evaluation of outcome. Journal of the American Veterinary Medicine Association, 173, 108-11.
STEELE, M. A., ALZAHAL, O., HOOK, S. E., CROOM, J. & MCBRIDE, B. W. 2009. Ruminal acidosis and the rapid onset of ruminal parakeratosis in a mature dairy cow: a case report. Acta Vet Scand, 51, 39.
STEELE, M. A., CROOM, J., KAHLER, M., ALZAHAL, O., HOOK, S. E., PLAIZIER, K. & MCBRIDE, B. W. 2011a. Bovine rumen epithelium undergoes rapid structural adaptations during grain-induced subacute ruminal acidosis. American Journal of Physiology-Regulatory Integrative and Comparative Physiology, 300, R1515-R1523.
STEELE, M. A., GREENWOOD, S. L., CROOM, J. & MCBRIDE, B. W. 2012. An increase in dietary non-structural carbohydrates alters the structure and metabolism of the rumen epithelium in lambs. Canadian Journal of Animal Science, 92, 123-130.
STEELE, M. A., VANDERVOORT, G., ALZAHAL, O., HOOK, S. E., MATTHEWS, J. C. & MCBRIDE, B. W. 2011b. Rumen epithelial adaptation to high-grain diets involves the coordinated regulation of genes involved in cholesterol homeostasis. Physiological Genomics, 43, 308-16.
221
STEEN, A. 2001. Field Study of Dairy Cows with Reduced Appetite in Early Lactation: Clinical Examinations, Blood and Rumen Fluid Analyses. Acta Veterinaria Scandinavica, 42, 219-228.
STEIBEL, J. P., POLETTO, R., COUSSENS, P. M. & ROSA, G. J. 2009. A powerful and flexible linear mixed model framework for the analysis of relative quantification RT-PCR data. Genomics, 94, 146-52.
STEVENS, C. E., SELLERS, A. F. & SPURRELL, F. A. 1960. Function of the bovine omnasum in ingesta transfer. American Journal of Physiology 198, 449-455.
STEVENS, C. E. & STETTLER, B. K. 1967. Evidence for active transport of acetate across bovine rumen epithelium. American Journal of Physiology -- Legacy Content, 213, 1335.
STEVENSON, D. M. & WEIMER, P. J. 2007. Dominance of Prevotella and low abundance of classical ruminal bacterial species in the bovine rumen revealed by relative quantification real-time PCR. Appl Microbiol Biotechnol, 75, 165-74.
STOKES, M. R., VANDEMARK, L. L. & BULL, L. S. 1986. Effects of sodium bicarbonate, magnesium oxide, and a commercial buffer mixture in early lactation cows fed hay crop silage. Journal of Dairy Science, 69, 1595-603.
STUMPFF, F., GEORGI, M. I., MUNDHENK, L., RABBANI, I., FROMM, M., MARTENS, H. & GUNZEL, D. 2011. Sheep rumen and omasum primary cultures and source epithelia: barrier function aligns with expression of tight junction proteins. Journal of Experimental Biology, 214, 2871-82.
SULZBERGER, S. A., KALEBICH, C. C., MELNICHENKO, S. & CARDOSO, F. C. 2016. Effects of clay after a grain challenge on milk composition and on ruminal, blood, and fecal pH in Holstein cows. Journal of Dairy Science, 99, 8028-8040.
TAMATE, H., MCGILLIARD, A. D., JACOBSON, N. L. & GETTY, R. 1962. Effect of Various Dietaries on the Anatomical Development of the Stomach in the Calf1. Journal of Dairy Science, 45, 408-420.
TAMMINGA, S. & VAN VUUREN, A. M. 1988. Formation and utilization of end products of lignocellulose degradation in ruminants. Animal Feed Science and Technology, 21, 141-159.
THEURER, C. B. 1986. Grain processing effects on starch utilization by ruminants. Journal of Animal Science, 63, 1649-62.
THOETKIATTIKUL, H., MHUANTONG, W., LAOTHANACHAREON, T., TANGPHATSORNRUANG, S., PATTARAJINDA, V., EURWILAICHITR, L. & CHAMPREDA, V. 2013. Comparative Analysis of Microbial Profiles in Cow Rumen Fed with Different Dietary Fiber by Tagged 16S rRNA Gene Pyrosequencing. Current Microbiology, 67, 130-137.
THORLACIUS, S. O. & LODGE, G. A. 1973. Absorption of steam-volatile fatty acids from the rumen of the cow as influenced by diet, buffers and pH Canadian Journal of Animal Science, 53, 279-288.
THRALL, M. A., WIESER, G., ALLISON, R. & CAMPBELL, T. W. 2012. Veterinary Haematology and Clinical Chemistry, New Jersey, Wiley & sons.
TRCKOVA, M., MATLOVA, L. & DVORSKA, L. Kaolin, bentonite, and zeolites as feed supplements for animals: health advantages and risks. A review. Veterinarni Medicina-UZPI (Czech Republic).
TREVISI, E., AMADORI, M., RIVA, F., BERTONI, G. & BANI, P. 2014. Evaluation of innate immune responses in bovine forestomachs. Res Vet Sci, 96, 69-78.
TSIPLAKOU, E., PAPPAS, A. C., MITSIOPOULOU, C., GEORGIADOU, M., GEORGIOU, C. A. & ZERVAS, G. 2017. Evaluation of different types of calcined magnesites as feed supplement in small ruminant. Small Ruminant Research, 149, 188-195.
TUCKER, C. B., WEARY, D. M., DE PASSILLÉ, A. M., CAMPBELL, B. & RUSHEN, J. 2006. Flooring in Front of the Feed Bunk Affects Feeding Behavior and Use of Freestalls by Dairy Cows. Journal of Dairy Science, 89, 2065-2071.

222
TURNER, A. & HODGETTS, V. 1955. Buffer systems in the rumen of sheep. II. Buffering properties in relationship to composition. Australian Journal of Agricultural Research, 6, 125-144.
TURNER, L. W., UDAL, M. C., LARSON, B. T. & SHEARER, S. A. 2000. Monitoring cattle behavior and pasture use with GPS and GIS. Canadian Journal of Animal Science, 80, 405-413.
TYRANKIEWICZ, U., SKORKA, T., ORZYLOWSKA, A., JABLONSKA, M., JASINSKI, K., JASZTAL, A., BAR, A., KOSTOGRYS, R. & CHLOPICKI, S. 2016. Comprehensive MRI for the detection of subtle alterations in diastolic cardiac function in apoE/LDLR(-/-) mice with advanced atherosclerosis. NMR Biomed, 29, 833-40.
UNGAR, E. D., HENKIN, Z., GUTMAN, M., DOLEV, A., GENIZI, A. & GANSKOPP, D. 2005. Inference of Animal Activity From GPS Collar Data on Free-Ranging Cattle. Rangeland Ecology & Management, 58, 256-266.
VALLE, E. R., HENDERSON, G., JANSSEN, P. H., COX, F., ALEXANDER, T. W. & MCALLISTER, T. A. 2015. Considerations in the use of fluorescence in situ hybridization (FISH) and confocal laser scanning microscopy to characterize rumen methanogens and define their spatial distributions. Canadian Journal of Microbiology, 61, 417-28.
VAN DER HORST, C. 1961. Keto-Acids and Amines in Rumen Liquid of Cattle. VAN DYNE, G. M. & TORELL, D. T. 1964. Development and Use of the Esophageal Fistula:
A Review. Journal of Range Management, 17, 7-19. VAN SOEST, P. J. 1994. Nutritional Ecology of the Ruminant, Comstock Pub. VAZQUEZ-BAEZA, Y., PIRRUNG, M., GONZALEZ, A., KNIGHT, R., 2013, Emperor: A tool
for visualizing high-throughput microbial community data, Gigascience, 2(1):16
VELLEND, M. CORNWELL, W.K., MAGNUSON-FORD, K., MOOERS, A.O., 2010,
Measuring Phylogenetic Diversity, Biological Diversity: Frontiers in Measurement and Assessment , Editors MAGURRAN, A.E., MCGILL B.J., 193–206, Oxford University Press
VILLALBA, J. J., PROVENZA, F. D. & STOTT, R. 2009. Rumen distension and contraction influence feed preference by sheep. Journal of Animal Science, 87, 340-50.
WAGHORN, G. C. & REID, C. S. W. 1983. Rumen motility in sheep and cattle given different diets New Zealand Journal of Agricultural Research, 26, 289-295.
WANG, D. S., ZHANG, R. Y., ZHU, W. Y. & MAO, S. Y. 2013. Effects of subacute ruminal acidosis challenges on fermentation and biogenic amines in the rumen of dairy cows. Livestock Science, 155, 262-272.
WANG, Q., GARRITY, G.M., TIEDJE, J.M., COLE, J.R., 2007, Naive Bayesian classifier for rapid assignment of rRNA sequences into the new bacterial taxonomy, Applied Environmental Microbiology, 73(16): 5261-5267.
WECKERLY, F. W. 2010. Allometric scaling of rumen–reticulum capacity in white-tailed deer. Journal of Zoology, 280, 41-48.
WEIMER, P. J., DA SILVA CABRAL, L. & CACITE, F. 2015. Effects of ruminal dosing of Holstein cows with Megasphaera elsdenii on milk fat production, ruminal chemistry, and bacterial strain persistence. Journal of Dairy Science, 98, 8078-92.
WEIMER, P. J., STEVENSON, D. M., MANTOVANI, H. C. & MAN, S. L. 2010. Host specificity of the ruminal bacterial community in the dairy cow following near-total exchange of ruminal contents. Journal of Dairy Science, 93, 5902-12.
WIENER, P., WOOLLIAMS, J. A., FRANK-LAWALE, A., RYAN, M., RICHARDSON, R. I., NUTE, G. R., WOOD, J. D., HOMER, D. & WILLIAMS, J. L. 2009. The effects of a mutation in the myostatin gene on meat and carcass quality. Meat Science, 83, 127-34.
WERNER, J.J., KOREN, O., HUGENHOLTZ, P., DESANTIS, T.Z., WALTERS, W.A., CAPORASO, J.G., ANGENENT, L.T., KNIGHT, R., LEY, R.E., 2012, Impact of training sets on classification of high-throughput bacterial 16S rRNA gene surveys. ISME, 6:94-103

223
WETZELS, S. U., MANN, E., METZLER-ZEBELI, B. U., POURAZAD, P., QUMAR, M., KLEVENHUSEN, F., PINIOR, B., WAGNER, M., ZEBELI, Q. & SCHMITZ-ESSER, S. 2016. Epimural Indicator Phylotypes of Transiently-Induced Subacute Ruminal Acidosis in Dairy Cattle. Frontiers in Microbiology, 7, 274.
WHITE, G. E., IQBAL, A. J. & GREAVES, D. R. 2013. CC chemokine receptors and chronic inflammation--therapeutic opportunities and pharmacological challenges. Pharmacological Reviews, 65, 47-89.
WICKI, A. & SCHATZMANN, H. J. 1977. Histamine formation by ruminal fluid from cattle in vitro. Experientia, 33, 422-3.
WIENER, P., WOOLLIAMS, J. A., FRANK-LAWALE, A., RYAN, M., RICHARDSON, R. I., NUTE, G. R., WOOD, J. D., HOMER, D. & WILLIAMS, J. L. 2009. The effects of a mutation in the myostatin gene on meat and carcass quality. Meat Science, 83, 127-34.
WILLIAMS, P. E., TAIT, C. A., INNES, G. M. & NEWBOLD, C. J. 1991. Effects of the inclusion of yeast culture (Saccharomyces cerevisiae plus growth medium) in the diet of dairy cows on milk yield and forage degradation and fermentation patterns in the rumen of steers. Journal of Animal Science, 69, 3016-26.
WOLFFRAM, S. 1996. [Motor, digestive and secretory processes of the forestomach and the abomasum--a short review]. Schweiz Arch Tierheilkd, 138, 343-50.
XU, C., SHEN, T., YANG, W., YU, H., GAO, S. & HUANG, B. 2016. The Effect of Subacute Ruminal Acidosis of Dairy Cows on Productivity, Digestibility and Greenhouse Gas Emission.
XU, Y. & DING, Z. 2011. Physiological, biochemical and histopathological effects of fermentative acidosis in ruminant production: a minimal review. Spanish Journal of Agricultural Research, 9, 414-422.
YANG, W. Z., BEAUCHEMIN, K. A. & RODE, L. M. 2001. Effects of grain processing, forage to concentrate ratio, and forage particle size on rumen pH and digestion by dairy cows. Journal of Dairy Science, 84, 2203-16.
YOON, I. K. & STERN, M. D. 1995. Influence of direct-fed microbials on ruminal microbial fermentation and performance of ruminants - A Review. Asian-Australas Journal of Animal Science, 8, 533-555.
ZEBELI, Q., ASCHENBACH, B., TAFAJ, M., BOGUHN, J., AMETAJ, B. N. & DROCHNER, W. 2011. Invited review: Role of physically effective fiber and estimationof dietary fiber adequacy in high-producing dairy cattle. Journal of Dairy Science, 95.
ZHANG, R., ZHU, W. & MAO, S. 2016. High-concentrate feeding upregulates the expression of inflammation-related genes in the ruminal epithelium of dairy cattle. Journal of Animal Science and Biotechnology, 7, 42.
ZHAO, L., MENG, Q., REN, L., LIU, W., ZHANG, X., HUO, Y. & ZHOU, Z. 2015. Effects of Nitrate Addition on Rumen Fermentation, Bacterial Biodiversity and Abundance. Asian-Australasian Journal of Animal Sciences, 28, 1433-1441.
ZITNAN, R., KUHLA, S., SANFTLEBEN, P., BILSKA, A., SCHNEIDER, F., ZUPCANOVA, M. & VOIGT, J. 2005. Diet induced ruminal papillae development in neonatal calves not correlating with rumen butyrate Veterinarni Medicina, 50, 472-479.
224
Appendix 1
Analysis of feedstuff (Sciantec Ltd.)
Determination of neutral detergent fibre (NDF) in feedstuff was carried out by Sciantec using enzymatic gravimetry. Starch in the sample was converted to soluble sugars by use of the enzyme α-amylase after de-fatting of the sample with petroleum spirit. The residue was boiled with a neutral solution and the soluble nutrients separated from those that required microbial fermentation. The insoluble matter remaining was designated NDF. The uncertainty for the determination of NDF by Sciantec is +/- 8.6%.
Determination of Nitrogen (N2) and Crude Protein in feedstuff was carried out by Sciantec using the DUMAS method with a LECO FP528 nitrogen analyser. The sample was weighed into a nitrogen free foil parcel and placed into a furnace. It was flushed with pure oxygen to produce rapid combustion. Products of this combustion were passed through filters with a thermoelectric cooler to remove water and collected in a ballast tank to equilibrate. An aliquot of this gaseous mixture was swept through hot copper, removing oxygen and reducing NOx to N2. Next, CO2 and H2O were removed by chemical absorption and the remaining N2 was measured via thermal conductivity cell. N2 content was used to estimate protein content.
Determination of Crude Fibre in feedstuff was carried out by Sciantec using an Ankom 220 analyser. Crude fibre was defined as the organic material that remains insoluble after successive treatments with 0.1275M Sulphuric acid and 0.313M Sodium hydroxide solution. Samples were de-fatted and digested successively with the acid and alkali under controlled conditions and the remaining organic matter was recorded as crude fibre. Uncertainty for the determination of crude fibre by Sciantec is +/- 12%.
Determination of Moisture in feedstuff was carried out by Sciantec via gravimetry. The moisture content of a sample was calculated by measuring the loss of weight after heating at 103 - 105°C for 2 hours 45 minutes ± 15 minutes. Uncertainty for the determination of moisture by Sciantec is +/- 5%.
Determination of Ash (total mineral matter) in feedstuff was carried out by Sciantec using gravimetry. Ash in a sample was considered the residue remaining after a sample had been incinerated at 510°C for at least 4 hours. Uncertainty for the determination of ash by Sciantec is +/- 5.2%.
Determination of Oil/Fat in feedstuff was carried out by Sciantec using a modified Weibull acid hydrolysis method. Samples were analysed for oil A using extraction by ether and then boiling the residual meal or liquid in hydrochloric acid to release the bound fat. The resulting “digest” was filtered and washed until neutral. Fat was retained in the filter and after drying, residue was extracted with light petroleum ether via extraction tube and measured. Uncertainty for the determination of oil by Sciantec is +/- 7.6%.
Determination of Starch in feedstuff was carried out by Sciantec using polarimetry. The method contains two determinations. In the first determination, the sample was
225
treated whilst warm with dilute hydrochloric acid, clarified and filtered and the optical rotation of the solution measured by polarimetry. In the second determination, the sample was extracted with 40% denatured ethanol. After acidifying the filtrate with hydrochloric acid, clarifying and filtering, the optical rotation of the solution was measured under the same conditions as the first determination. The difference between the two readings, multiplied by a known factor, gave the starch content of the sample. Uncertainty for the determination of starch by Sciantec is +/- 7.7%.
Determination of Cellulose and Hemicellulose from NDF in feedstuff samples was carried out by Sciantec via calculation from results obtained from determinations of acid detergent fibre (ADF), acid detergent lignin (ADL) and NDF fractions.
Determination of Total Sugars in feedstuff was carried out by Sciantec using the Luff-Schoorl method. Sugars were extracted from the sample by shaking with water. The solution was clarified and sugars determined by the Luff-Schoorl method either before or after inversion. Uncertainty for the determination of sugars by Sciantec is +/- 21 %.
Determination of Water-Soluble Carbohydrates in herbage was carried out by Sciantec. The sample was shaken in water and then filtered. An aliquot of the sample was reacted with an anthrone solution while boiling. The resulting solution was measured at 625 nm on a visible spectrophotometer and the absorbance compared to a set of glucose standards treated in the same way.
Determination of Acid Detergent Lignin (ADL) was carried out by Sciantec using an Ankon 220 Analyser. Acid detergent digestion removes the hemicellulose leaving cellulose and lignin. The acid detergent removes the cell contents and other acid soluble material that would otherwise interfere with the lignin determination. Residue from the ADF determination is primarily lignin and cellulose. Cellulose was dissolved using 72% sulphuric acid. The remaining residue consists of lignin and acid-insoluble ash.
Determination of Biogenic Amines (histamine) in feedstuff was carried out by Sciantec using ion exchange chromatography. The sample was homogenised for one hour at 40˚C with 10% thicholoacetic acid solution. The pH of the resulting extract was adjusted to pH 2.2, centrifuged, and filtered. The biogenic amine content of the resulting sample solution was determined via ion exchange chromatography and post column reaction with ninhydrin reagent and photometric detection on the visible region at 750nm.
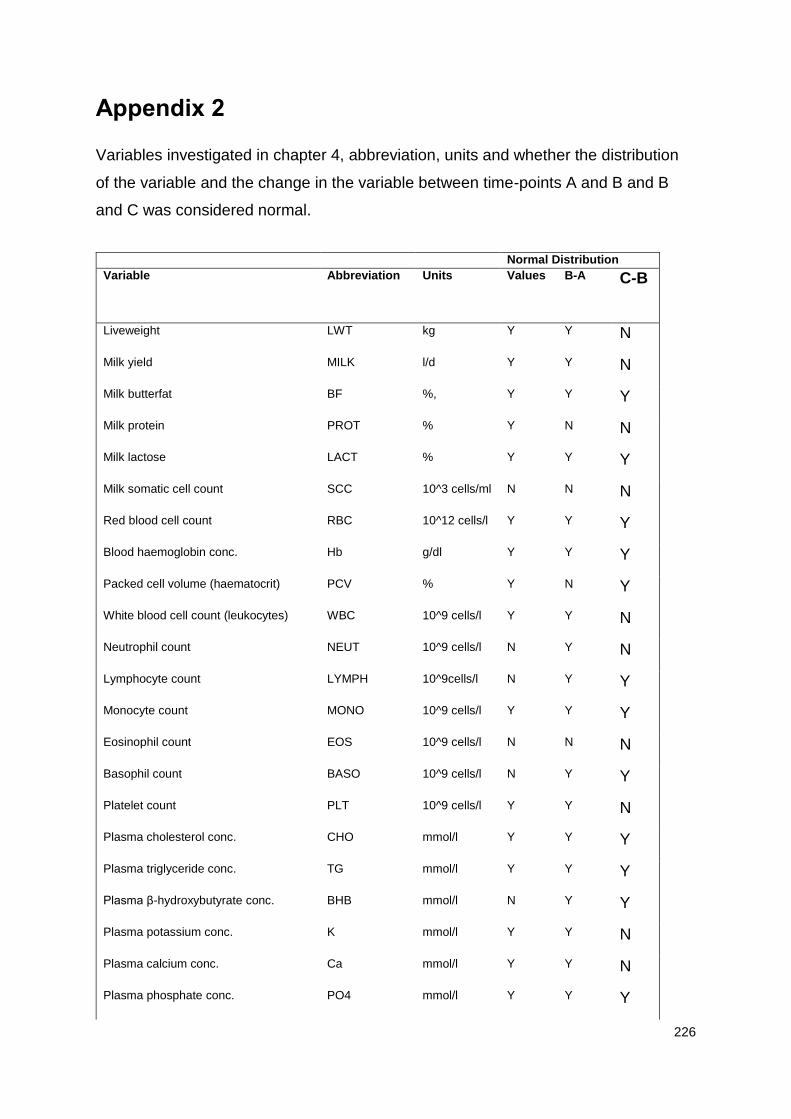
226
Appendix 2
Variables investigated in chapter 4, abbreviation, units and whether the distribution
of the variable and the change in the variable between time-points A and B and B
and C was considered normal.
Normal Distribution
Variable Abbreviation Units Values
B-A C-B
Liveweight LWT kg Y Y N
Milk yield MILK l/d Y Y N
Milk butterfat BF %, Y Y Y
Milk protein PROT % Y N N
Milk lactose LACT % Y Y Y
Milk somatic cell count SCC 10^3 cells/ml N N N
Red blood cell count RBC 10^12 cells/l Y Y Y
Blood haemoglobin conc. Hb g/dl Y Y Y
Packed cell volume (haematocrit) PCV % Y N Y
White blood cell count (leukocytes) WBC 10^9 cells/l Y Y N
Neutrophil count NEUT 10^9 cells/l N Y N
Lymphocyte count LYMPH 10^9cells/l N Y Y
Monocyte count MONO 10^9 cells/l Y Y Y
Eosinophil count EOS 10^9 cells/l N N N
Basophil count BASO 10^9 cells/l N Y Y
Platelet count PLT 10^9 cells/l Y Y N
Plasma cholesterol conc. CHO mmol/l Y Y Y
Plasma triglyceride conc. TG mmol/l Y Y Y
Plasma β-hydroxybutyrate conc. BHB mmol/l N Y Y
Plasma potassium conc. K mmol/l Y Y N
Plasma calcium conc. Ca mmol/l Y Y N
Plasma phosphate conc. PO4 mmol/l Y Y Y
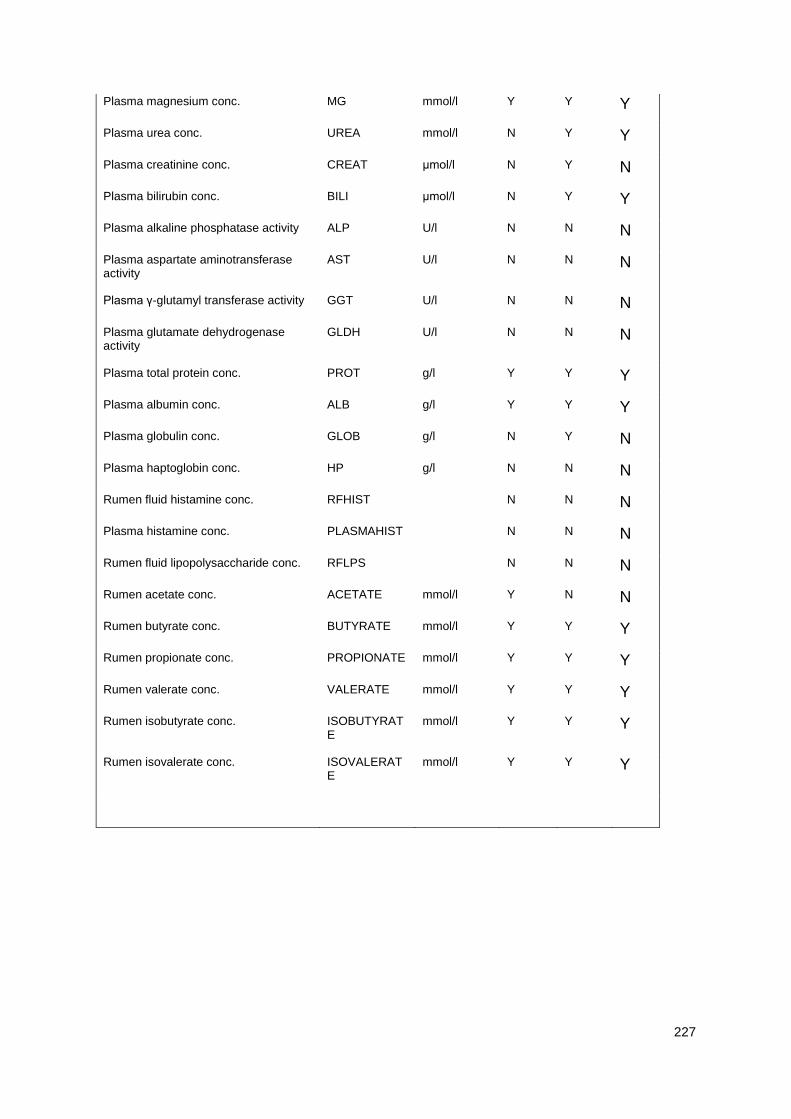
227
Plasma magnesium conc. MG mmol/l Y Y Y
Plasma urea conc. UREA mmol/l N Y Y
Plasma creatinine conc. CREAT μmol/l N Y N
Plasma bilirubin conc. BILI μmol/l N Y Y
Plasma alkaline phosphatase activity ALP U/l N N N
Plasma aspartate aminotransferase activity
AST U/l N N N
Plasma γ-glutamyl transferase activity GGT U/l N N N
Plasma glutamate dehydrogenase activity
GLDH U/l N N N
Plasma total protein conc. PROT g/l Y Y Y
Plasma albumin conc. ALB g/l Y Y Y
Plasma globulin conc. GLOB g/l N Y N
Plasma haptoglobin conc. HP g/l N N N
Rumen fluid histamine conc. RFHIST N N N
Plasma histamine conc. PLASMAHIST N N N
Rumen fluid lipopolysaccharide conc. RFLPS N N N
Rumen acetate conc. ACETATE mmol/l Y N N
Rumen butyrate conc. BUTYRATE mmol/l Y Y Y
Rumen propionate conc. PROPIONATE mmol/l Y Y Y
Rumen valerate conc. VALERATE mmol/l Y Y Y
Rumen isobutyrate conc. ISOBUTYRATE
mmol/l Y Y Y
Rumen isovalerate conc. ISOVALERATE
mmol/l Y Y Y
228
Appendix 3
Sheep Fistulation Protocol
1. Selection of animal
a. Candidates for cannulation should be healthy adults, preferably with no history of chronic conditions such as mastitis or lameness. The para-lumbar fossa must be checked for size sufficient to take the cannula. Occasionally, the last rib may project across the fossa, making cannula placement difficult, and these animals should be rejected. A template made from the cannula was used to determine this. Sheep had bloods taken for haematology and biochemistry, had their mouths checked, and were body condition scored to ensure they were physically fit enough to be chosen for surgery. This left only 4 animals from the 6 that were initially chosen.
2. Surgical preparation
a. 24 -48 hours before the operation, the left flank was clipped.
b. Solid food was withheld for 2 hours before the operation. If the rumen is full, it will obviously increase the risk of spillage of contents once the rumen is incised. However, a full rumen does more closely mimic the normal anatomy of the flank, and will assist the surgeon to position the rumen sutures more accurately. Water was not withheld.
c. The sheep were brought into the theatre individually and pre-meds given just before surgery: Diazepam (0.2-0.3mg/kg) and IV Torbugesic (0.2mg/kg). Local anaesthesia was then induced by the injection of Alfaxan (1-2mg/kg). The sheep were then intubated and maintained on Sevofluorane and oxygen. Throughout the surgery, temperature and heart rate were monitored every 15 minutes manually.
d. Once under anaesthetic, the template was placed on the site, such that the edges of the flange would just touch on the last rib and the transverse processes of the lumbar vertebrae. Permanent marker was used to mark a guide for scalpel.
e. Left side prepared for surgery using Hibi-Scrub.
f. Animal draped with a sterile cloth
g. Surgeon gowned and gloved
3. Surgical technique
a. Using a scalpel, the skin was incised along the marker line. The circle of skin was then lifted and excised with blunt scissors.
229
b. The subcutaneous fat was then cut through until the muscle layers were visible.
c. An incision was made using blunt scissors in the external oblique abdominal muscles, in the plane of the fibres, and then blunt dissection by hand was used to part the muscle to give a hole of roughly 3 inches diameter.
d. The internal oblique abdominal muscles were incised in the plane of the fibres, and blunt dissection used again to part the muscle to give a potential hole of 3 inches as above. This exposed the peritoneum.
e. In the centre of the muscle wound, the peritoneum was incised. This creates a small rush of air into the abdomen at this stage, and it is important to immediately grasp the exposed rumen wall. This was done with a pair of Allis tissue forceps. The forceps act as a landmark to identify the correct position of the rumen, before it falls away from the wound, back into the abdomen.
f. Viewing the skin wound as a clock, a 5 metric Polysorb suture (CL929 - Vetoquinol) was placed, from the skin surface to the sub-cutis at 3-o-clock. Bypassing all of the muscle layers, a deep bite was taken through the serosal surface of the rumen, picking up the rumen musculature, but not penetrating the mucosa. The suture was then taken back through the skin from sub-cutis to surface and tied on itself, taking care to leave a long end.
g. Using a continuous Lambert pattern, the rumen wall was sutured to the skin around the circumference of the skin wound, working in a clockwise direction. The object of this continuous suture was to make a water tight junction between the rumen wall and the skin, before the rumen is opened.
h. Once the continuous suture is completed, it was tied off and the rumen wall incised. Using scissors, a circle approximately matching the size of the skin wound was trimmed, being careful not to cut the continuous suture pattern.
i. Using a monofilament suture material of high strength and long half-life (Maxon 4 metric – 6769-71 - Vetoquinol), simple interrupted sutures were used to fix the rumen to the skin, each suture going through skin and full thickness of the rumen wall.
j. Once the skin was firmly sutured to the rumen wall, blue spray was used and the edge of the wound lubricated with vet lube and the cannula introduced and the inner flange everted, making sure that it lies flat against the mucosa of the rumen. Prior to this, the cannula was warmed in a bucket of very hot water for several minutes, to allow it to be flexible enough to invert and fold the inner flange for introduction. The bung was then inserted.

230
4. Post-Operative care
Fed approximately 50% rations for the first 24 hours, thereafter fed as normal.
Pain relief – Metacam (2.5ml per 100kg)
Antibiosis – Marbocyl (1ml per 50kg)
5. Recovery Recovery took place in a bedded pen in the theatre to allow observations. The sheep were allowed to come round from anaesthetic and then taken in a bike and trailer back to their pen.
Top Related