


Languages
Pages
Legal

1
Eduardo Levy Yeyati
The World Bank & Universidad Torcuato Di Tella
December, 2006
Fear of Floating or Fear of Flying:
Exchange Rate Policy in the New Millenium
Storyboard
The basics: The debate post-Bretton Woods
The tradeoff: Exchange rate regimes and the real economy
The evidence: Regimes in the 2000s
The FIT (float + inflation targeting) paradigm: natural evolution or fad?
Fear of flying: building a case for a proactive exchange rate policy
The basics
The real view (‘70s) Trade (and welfare) gains vis à vis users of the peg
currency vs. loss of the exchange rate as a shock absorber in the presence of nominal rigidities.
Pro peg Openness, propensity to trade, trade concentration
Pro float Incidence of real shocks
The basics
The political view (‘80s) Bands, “tablitas” & other soft species: Exchange rate
anchors as a “policy crutch” to compensate for the lack of monetary credibility or political power
Pro peg high inflation, weak governments
The basics
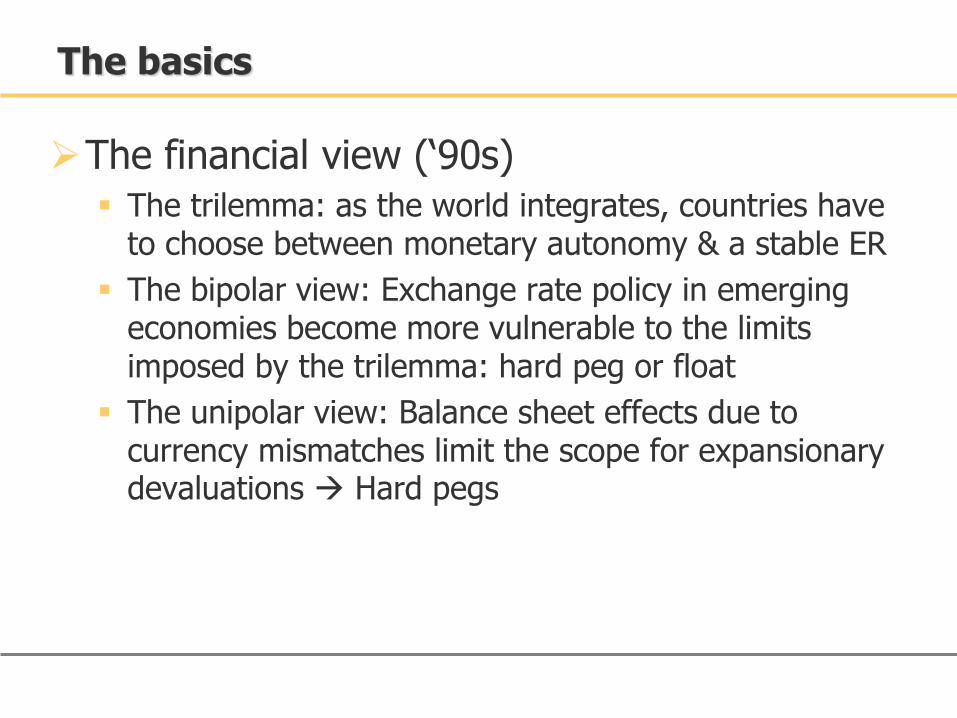
The financial view (‘90s) The trilemma: as the world integrates, countries have
to choose between monetary autonomy & a stable ER
The bipolar view: Exchange rate policy in emerging economies become more vulnerable to the limits imposed by the trilemma: hard peg or float
The unipolar view: Balance sheet effects due to currency mismatches limit the scope for expansionary devaluations Hard pegs
The tradeoff
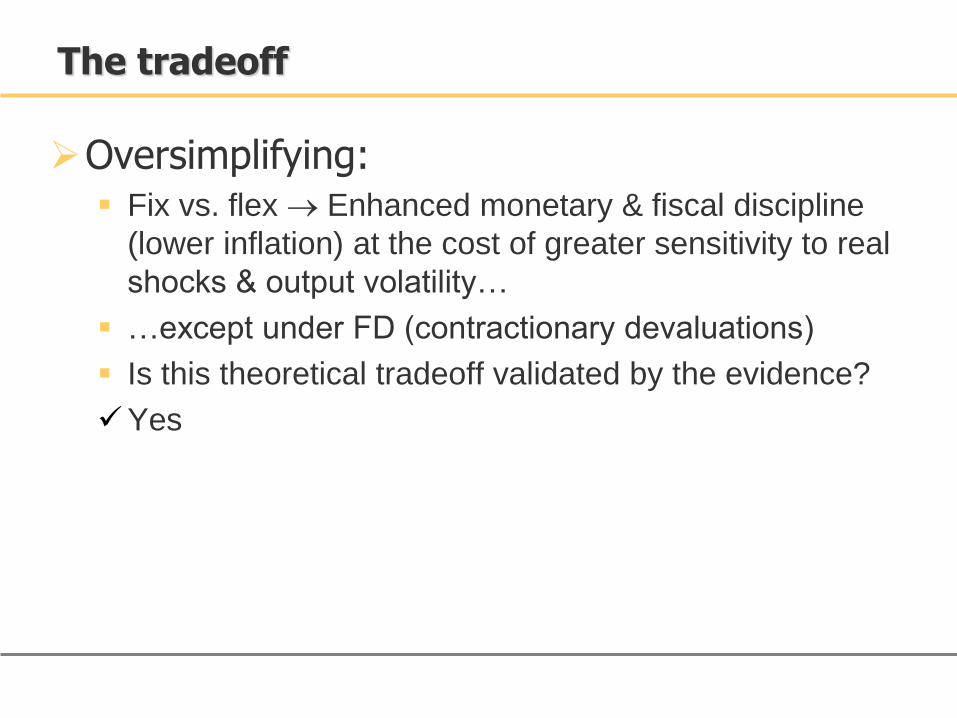
Oversimplifying: Fix vs. flex Enhanced monetary & fiscal discipline
(lower inflation) at the cost of greater sensitivity to real
shocks & output volatility…
…except under FD (contractionary devaluations)
Is this theoretical tradeoff validated by the evidence?
Yes
The tradeoff
Preliminary evaluation:
Pegs contribute to lower inflation expectations…
…at the cost of greater output volatility…
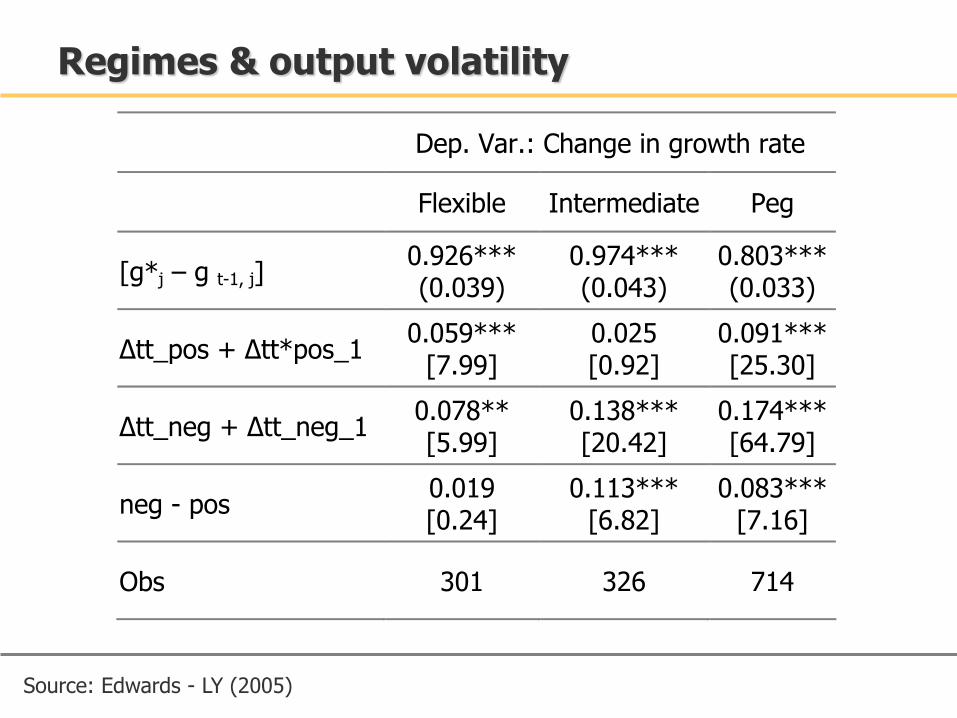
Dep. Var.: Change in growth rate
Flexible Intermediate Peg
[g*j – g t-1, j] 0.926*** (0.039)
0.974*** (0.043)
0.803*** (0.033)
Δtt_pos + Δtt*pos_1 0.059***
[7.99] 0.025 [0.92]
0.091*** [25.30]
Δtt_neg + Δtt_neg_1 0.078** [5.99]
0.138*** [20.42]
0.174*** [64.79]
neg - pos 0.019 [0.24]
0.113*** [6.82]
0.083*** [7.16]
Obs 301 326 714
Regimes & output volatility
Source: Edwards - LY (2005)
The tradeoff
Preliminary evaluation:
Pegs contribute to lower inflation expectations…
…at the cost of greater output volatility…
…and slower growth
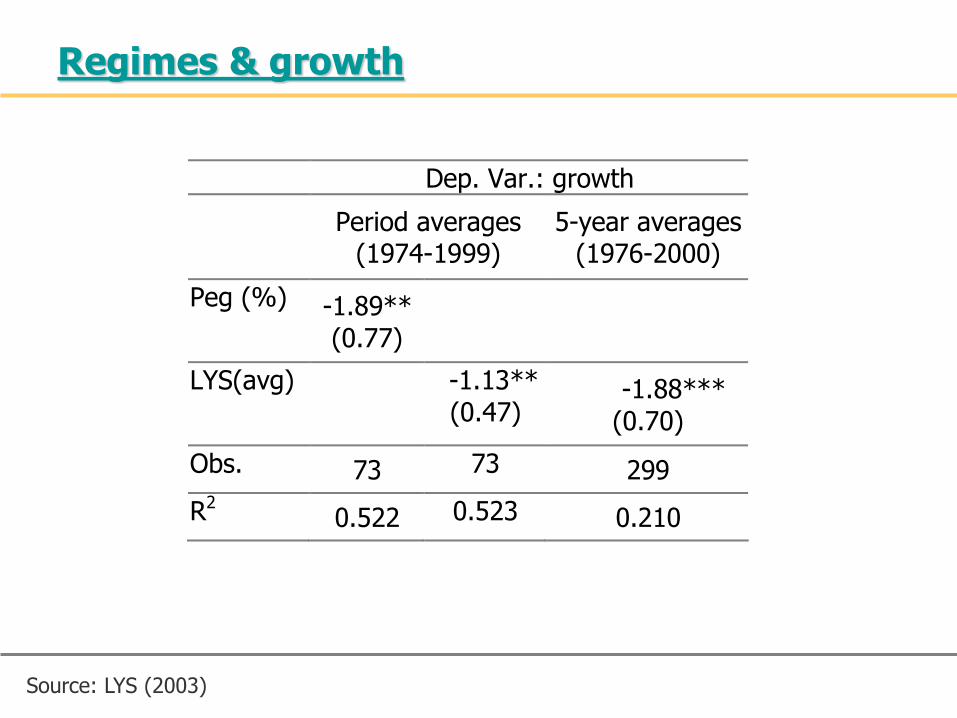
Dep. Var.: growth
Period averages
(1974-1999) 5-year averages
(1976-2000)
Peg (%) -1.89**
(0.77)
LYS(avg)
-1.13**
(0.47) -1.88***
(0.70)
Obs. 73 73 299
R2 0.522 0.523 0.210
Regimes & growth
Source: LYS (2003)
The tradeoff
Preliminary evaluation:
Pegs contribute to lower inflation expectations…
…at the cost of greater output volatility…
…and lower growth
Balance sheet effects
Subdued inflation fears Volatility concerns dominate Float
Under FD Threshold floats
The bipolar view after Argentina
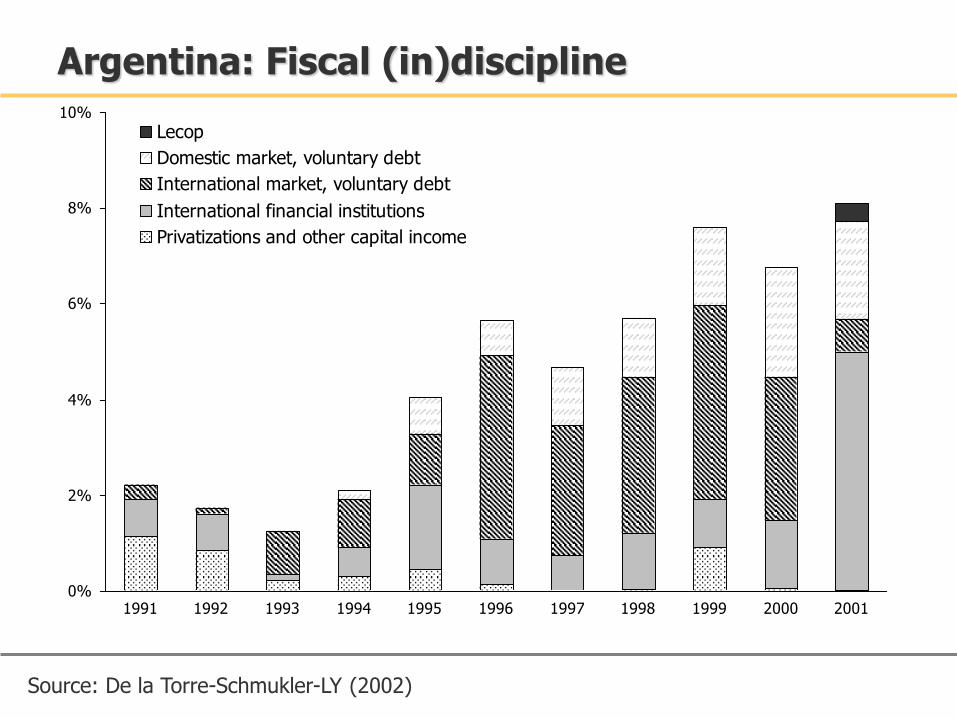
Argentina: Fiscal (in)discipline
0%
2%
4%
6%
8%
10%
1991 1992 1993 1994 1995 1996 1997 1998 1999 2000 2001
Lecop
Domestic market, voluntary debt
International market, voluntary debt
International financial institutions
Privatizations and other capital income
Source: De la Torre-Schmukler-LY (2002)
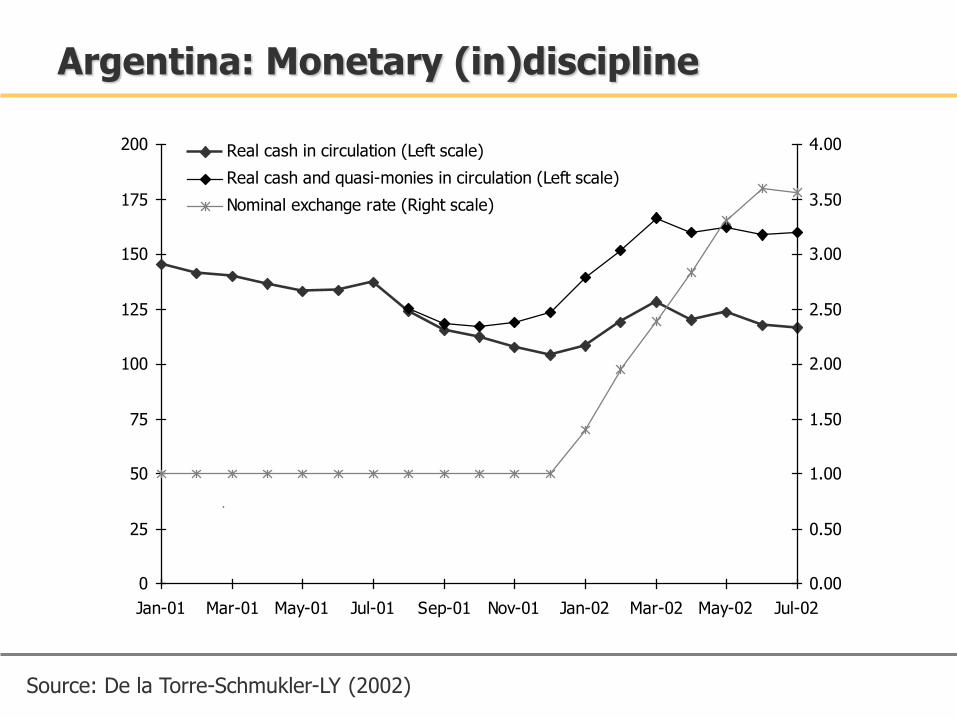
Argentina: Monetary (in)discipline
0
25
50
75
100
125
150
175
200
Jan-01 Mar-01 May-01 Jul-01 Sep-01 Nov-01 Jan-02 Mar-02 May-02 Jul-02
0.00
0.50
1.00
1.50
2.00
2.50
3.00
3.50
4.00Real cash in circulation (Left scale)
Real cash and quasi-monies in circulation (Left scale)
Nominal exchange rate (Right scale)
Source: De la Torre-Schmukler-LY (2002)
The bipolar view after Argentina
Lack of external discipline by private markets
Hard pegs do not lead to fiscal discipline
Fiscal dominance Hard pegs do not lead to
monetary discipline
Is de jure dollarization hard enough?
Where do we stand?
Pegs are passé In most cases, inefficient short-term substitute for credibility
Hard pegs failed the test in Argentina
Learning to live with BS effects The (dynamic)
scope for countercyclical exchange rate policy
The double D: Domestication and de-dollarization of
sovereign debt
A unipolar view in reverse?
• Key criterion: ER variability relative to forex intervention
• The intervention dimension is key to characterized exchange rate policy (as opposed to the evolution of exchange rates) and its consequences
Exchange rate regimes in the 2000s: Classification
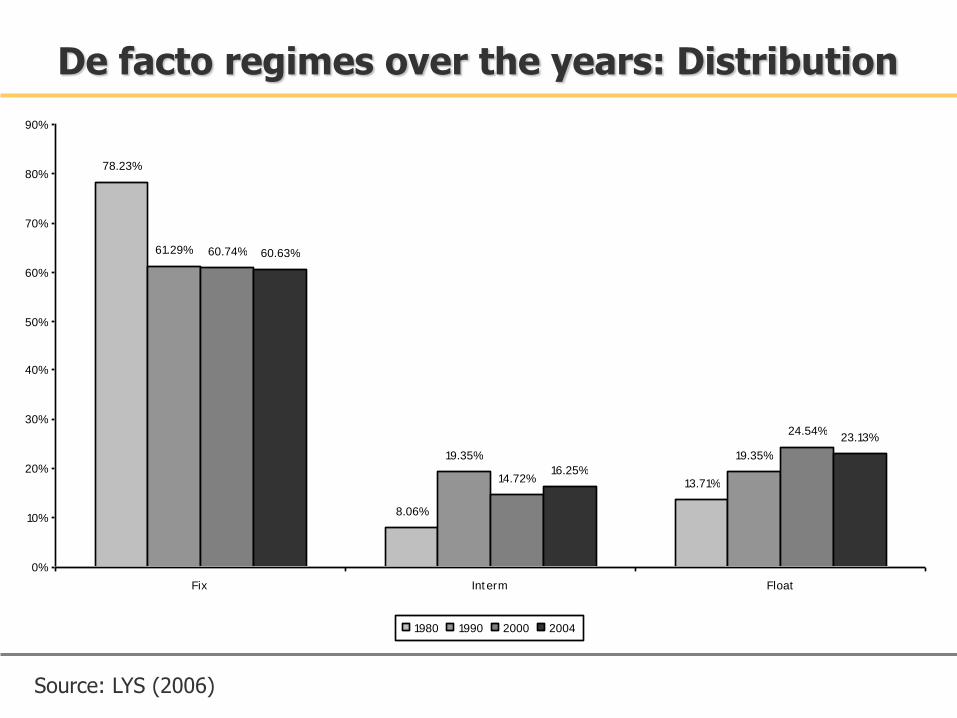
78.23%
8.06%
13.71%
61.29%
19.35% 19.35%
60.74%
14.72%
24.54%
60.63%
16.25%
23.13%
0%
10%
20%
30%
40%
50%
60%
70%
80%
90%
Fix Int erm Float
1980 1990 2000 2004
De facto regimes over the years: Distribution
Source: LYS (2006)
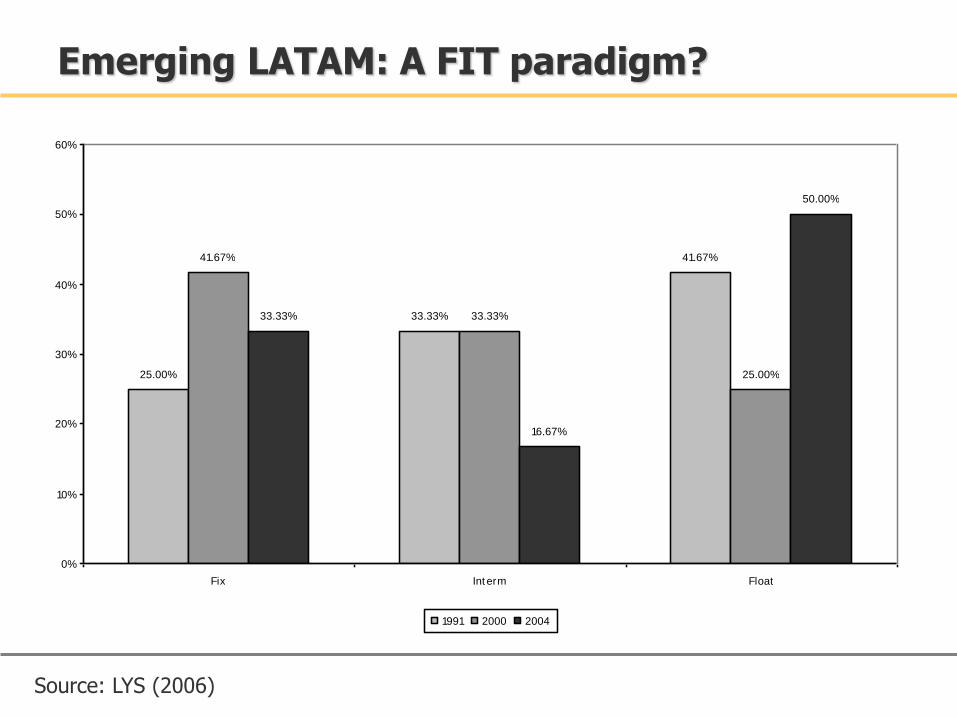
25.00%
33.33%
41.67%41.67%
33.33%
25.00%
33.33%
16.67%
50.00%
0%
10%
20%
30%
40%
50%
60%
Fix Int erm Float
1991 2000 2004
Emerging LATAM: A FIT paradigm?
Source: LYS (2006)
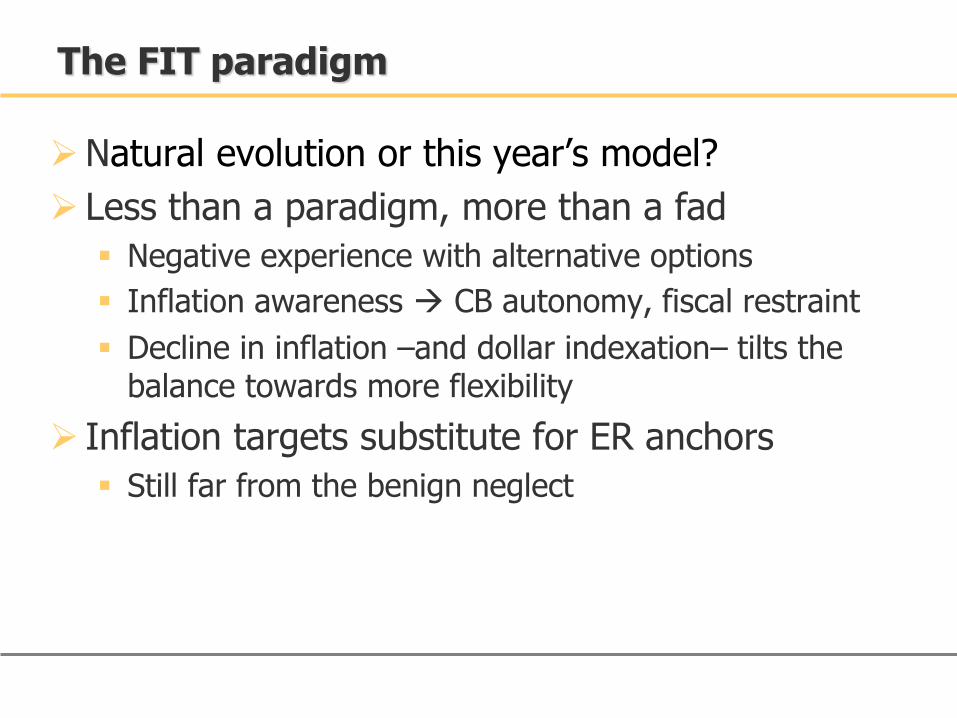
The FIT paradigm
Natural evolution or this year’s model?
Less than a paradigm, more than a fad
Negative experience with alternative options
Inflation awareness CB autonomy, fiscal restraint
Decline in inflation –and dollar indexation– tilts the balance towards more flexibility
Inflation targets substitute for ER anchors
Still far from the benign neglect
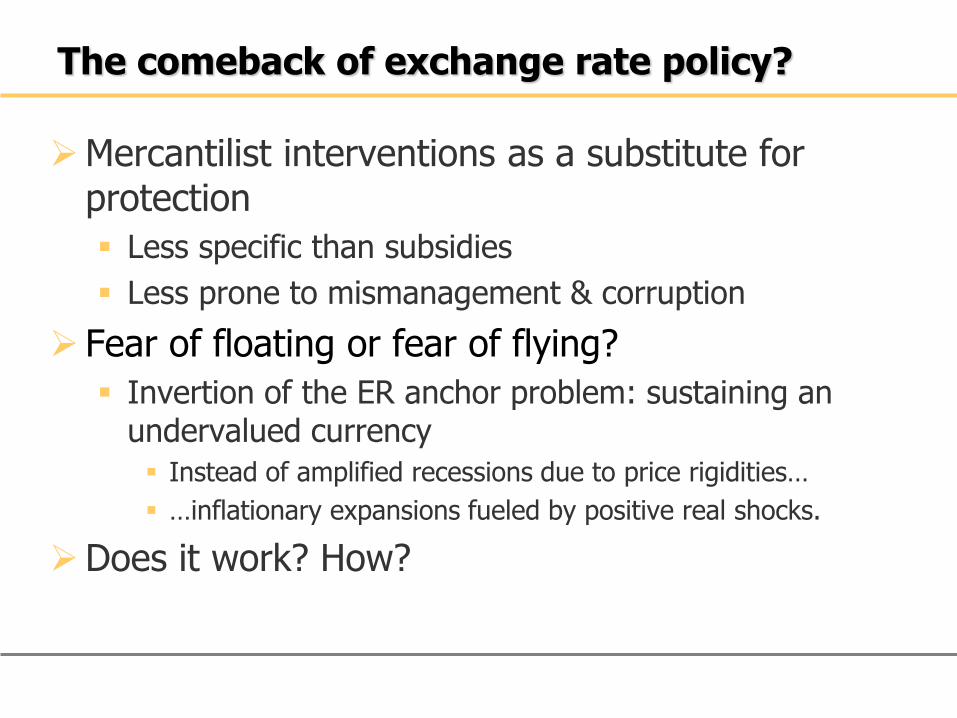
The comeback of exchange rate policy?
Mercantilist interventions as a substitute for protection
Less specific than subsidies
Less prone to mismanagement & corruption
Fear of floating or fear of flying?
Invertion of the ER anchor problem: sustaining an undervalued currency
Instead of amplified recessions due to price rigidities…
…inflationary expansions fueled by positive real shocks.
Does it work? How?
• Fear of floating’s underlying fears:
– Contractionary devaluations (due to BS effects) and currency and debt crisis propensity
– Dollar pricing, pass-through and inflation
• Fear of flying: Leaning against the appreciation wind
– Intervention to strenthen the demand for the foreign currency, to avoid/mitigate appreciation pressures
Fear of flying: A characterization
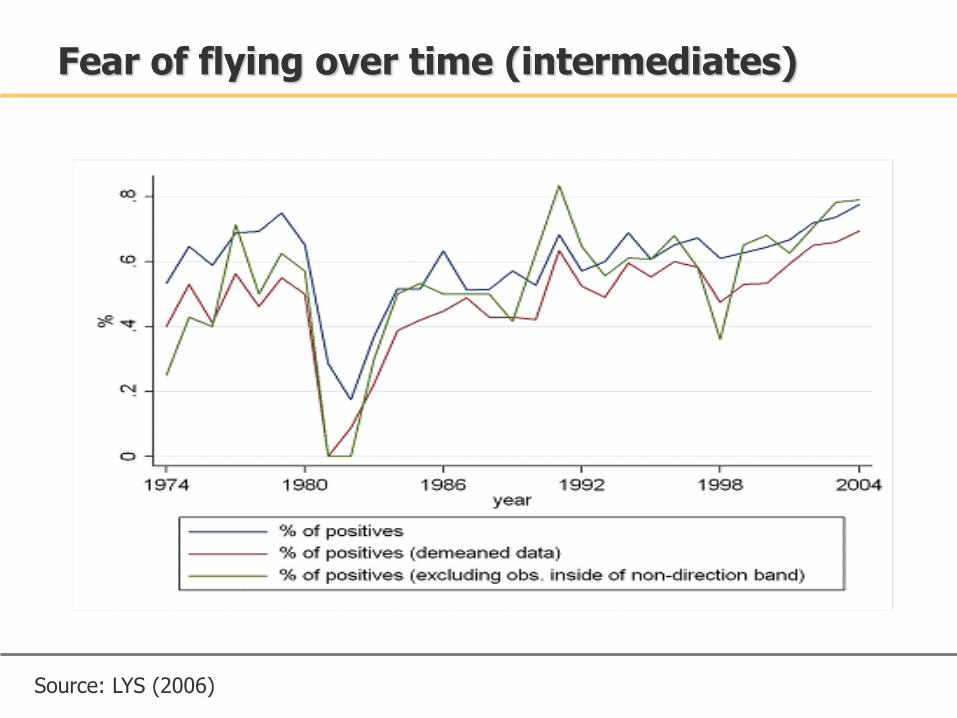
Fear of flying over time (intermediates)
Source: LYS (2006)
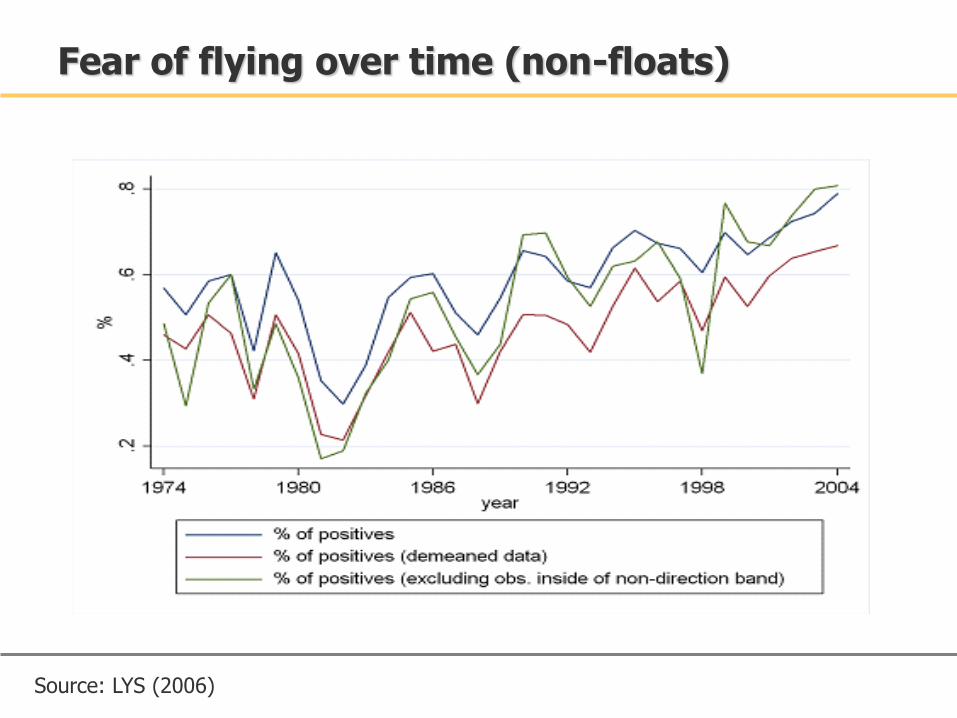
Fear of flying over time (non-floats)
Source: LYS (2006)
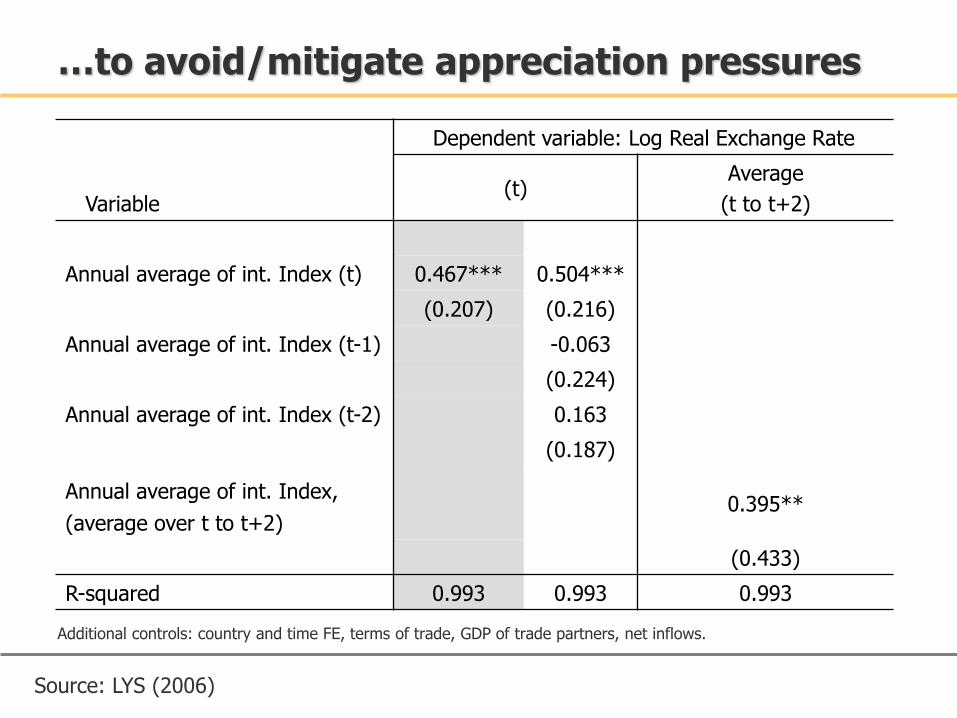
…to avoid/mitigate appreciation pressures
Additional controls: country and time FE, terms of trade, GDP of trade partners, net inflows.
Variable
Dependent variable: Log Real Exchange Rate
(t) Average
(t to t+2)
Annual average of int. Index (t) 0.467*** 0.504***
(0.207) (0.216)
Annual average of int. Index (t-1) -0.063
(0.224)
Annual average of int. Index (t-2) 0.163
(0.187)
Annual average of int. Index,
(average over t to t+2) 0.395**
(0.433)
R-squared 0.993 0.993 0.993
Source: LYS (2006)
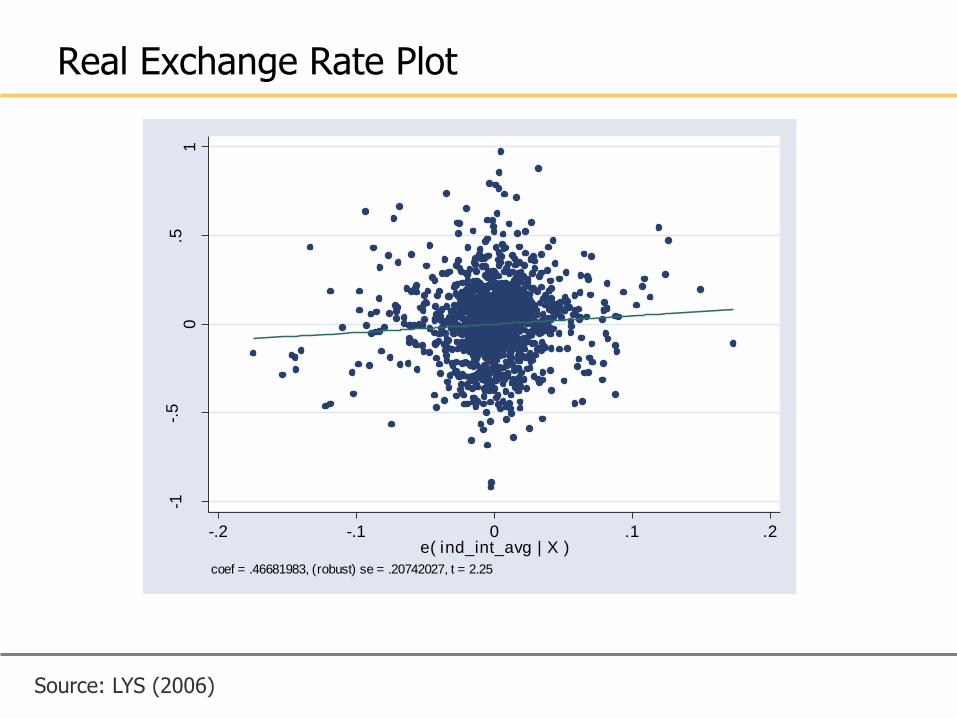
Real Exchange Rate Plot
Source: LYS (2006)
GNB
BOL
URYMDGBRA
UGA
URY
ARG
MOZ
ECU
SVN
GAB
MDG
MEX
LSO
MDG
NGA
TUR
SLE
TTO
KWT
TZA
THA
MWILKA
UGA
BRA
ZMB
MNG
URY
SEN
ZMB
NGA
NGA
IDNSVNMDGMKDDMA
CRI
SLV
HND
BGRMYS
ZWE
CMR
MUSGABPHLBHR
BRA
ARG
BRA
VEN
PRYMDGGAB
ZMB
NGA
RWA
BDI
SEN
SAUZAF
ZAF
SLEMUS
BGRZWEMEX
IDN
ECU
GAB
URY
BOL
BFA
BEN
NGA
KEN
GAB
ARM
HNDZAF
BOLTTO
SVK
SDN
VEN
HND
MWILKA
CZEHTI
MDG
KNA
HND
BRB
MKD
MYSBENDMATGO
VEN
MYS
MEX
IDN
SWZ
BRA
ZAF
HNDCOL
PER
MWI
MUS
CRI
MWI
DOM
BRA
TGO
MLI
NER
MYS
POL
SLV
MOZ
RWA
COGCZE
MWI
ZAFVEN
VCT
MOZGAB
VENPRY
HND
BGR
MYS
CRISWZTUR
MYS
DOMMLI
SYR
BDITTO
TGO
SWZ
VEN
MRTCMR
TGOPRY
VEN
URY
LKA
HND
SWZ
MKD
SLV
TGOKNA
TCD
TTO
VEN
TUN
PAKCOG
ECU
HTI
GTM
ARG
MDG
TUNIDN
NER
ARG
IDNPHL
MYS
GAB
SVKTGO
ECU
ZAF
SYR
CMR
SLV
MEX
ARM
PER
IDN
KNA
HND
PHL
KENZAF
HND
SAU
DOM
ARG
SVN
ARG
MYSGABSWZCOL
PER
RWA
TCD
COL
GNB
DMASEN
MNGSWZ
KEN
ECU
CHL
UGA
NER
PER
SEN
PAKPRY
SLV
GNB
DOM
ECUTCD
NER
PER
GTM
BRB
TUR
CHL
ARG
BRA
DMA
SEN
CZEPHL
GTM
DOM
MYSBHRMUS
LTUSEN
SVN
COLTCD
SWZ
GRD
GTM
COG
NER
BFA
HUN
PRY
IDN
ETH
PAK
RWACOL
MEX
PAKSLV
BRA
GTMPRY
SWZ
CHL
SLVKNA
HND
CRIARM
CMR
EGY
GTM
VCT
TZADOM
VCTTUNLTU
VEN
VCTDMACOG
HRVMYSPOL
PAKVCT
SEN
VEN
BFA
CZEPOL
TCD
PERPER
MUS
COG
SYR
VCT
ARG
GRD
SLE
TTOTTO
IND
VCT
GRD
BOL
HND
DMA
SDN
THA
BEN
MLI
TUNKNADMAARM
PER
UGA
GRDVENSLECZESYC
SVK
BFA
IND
VCT
SWZ
HRV
BRA
KEN
DMA
MAR
BRASDN
RWAKNA
POL
IDN
EGY
MWIPOL
CHLTHAKEN
BFA
SVK
IND
MYS
PER
SEN
EGY
IND
NER
URY
MEX
MLI
LKA
MOZ
VCT
HRV
CHLBFA
THA
RWA
BDI
TUR
NAMSYC
SEN
GABTUR
LKA
BOLMWI
PERSYR
SYCGRDCHLCRI
TURLVA
TCDLKATHA
IND
DOM
TGOLKA
GNB
KNASLVFJIGTM
MLI
TTO
ETH
SDN
SYR
BOL
SLV
NER
THA
ETH
PAK
SYCTGO
SEN
HTIPAKDOM
GRD
SVN
GTM
LVAKNAGRD
PAK
CHLKNA
CHLTUR
COL
COG
NERBRA
NGA
TTOSLVVENECUZAF
HTI
ZAF
MUS
ETH
GTM
CRI
ETH
HUN
SYR
TONDMA
VEN
SYC
INDPRY
PHL
MYS
CPV
GTM
ZAF
CHL
MEX
ARG
PAK
EGY
UGA
EGY
GNBGTMPAK
BRB
CHL
ETH
PHL
NGA
TZA
TGO
BRB
DMA
PHL
HND
SLV
MAR
PER
MWI
NAMNGA
GRDMUSBOL
IND
PRY
COG
SLV
HUNPOL
RWASWZ
CHL
BEN
BRA
CHL
HRV
MAR
IDN
ETH
LTU
KNAUGA
ECU
BFA
CRI
BFA
MAR
VCT
LKA
TCD
BEN
ETH
PAK
CZEEGY
MUSSAUSLEPRY
SYR
IDN
PRY
CRI
UGA
TZA
THA
COGBFA
RWAGRDPAK
ARG
POL
MLI
CMREGY
ETH
ETH
RWA
ETH
IND
NERINDNER
CHLTUN
KEN
GRD
MLI
MEX
CHL
COL
TUN
CHL
GRDLKAMWICOL
ETH
SLV
PAK
TUN
ECU
GAB
SYCKNA
MARRWABRB
TGO
URY
SLV
BFASYR
SYR
TTO
SYR
TZA
POLGRD
PER
EGYMUS
HTI
CRI
CPV
ARG
TUN
SEN
EGYDOM
SDN
EGY
HTI
TGO
NGA
COL
IND
NGA
FJI
TTOBGRTUNMEX
GAB
MEX
TURGNB
KWT
SWZSYCCHL
HUN
NGA
PHL
CMR
GAB
NER
TTODOM
KENLTU
PAK
GNB
VCT
COGVCTDMAKEN
KNA
CRI
BGR
UGA
KEN
BENHTI
ARG
PHL
KNATTO
DOMLTUCHLBRA
THA
BEN
IND
ZAF
MEX
DMA
MARCOGTUN
ECU
LTU
NGA
TUNBGDLVAHRVEGY
COL
COG
CMR
HTI
BOL
MWI
EGY
THA
DOM
BRBGRD
GTM
BRBCRI
ARG
MLI
SYR
ETH
KENNERSYC
PAK
IND
BGRDMA
CZEPOLHRV
NERBDI
NGA
COL
MARHTI
DOMCRIGRDDMA
PER
FJI
BFA
SVK
ARG
RWA
THARWA
SENTGO
THA
IDN
VEN
LVAMNG
GTM
DOM
SYR
GAB
DOM
INDPOL
COL
LVAECUDMA
NGA
SYRBRACPV
SWZ
LVAMNG
URY
TUNCOLSDN
MOZ
PRY
URY
IDN
ETHSLVGTM
HTI
ETH
GAB
TUR
PER
BRB
SLV
IND
PRYHUNMOZ
MLI
TUR
MLI
FJI
PRYTHA
TGO
SYR
TTOCMR
SENEGY
URY
KNA
PRYMKD
ARG
GTM
INDETH
GRD
MUS
BDIBENCRITUN
DMA
GAB
DMAPOL
GRDTTO
CMR
ECU
HTI
VCTUGA
VEN
MYS
SLV
MNG
PER
HTIBDIPAKTZAGTM
COGLKA
BOLZMB
THAMAR
BOLBRB
GAB
MLI
LKA
SWZ
SVKSEN
MDGGTM
PHLLVA
HTI
VCT
IND
HND
KEN
ARG
SLV
ETH
MAR
ETH
FJIGRD
SYC
MLI
COL
ETH
NERLKA
GRD
MLI
THABRALVA
ARG
MYS
ETHCOG
BRB
SYR
CPVSAUZWEGRDRWARWA
KWT
TCDMLIBENVCTIDN
KNA
ARM
IDN
HTI
ECUTURKEN
TON
IND
SWZ
PHL
BGR
DOM
BOL
HRV
TGO
THATGO
GTMPER
PHL
ETH
CMR
LKA
TCDTTODOMMAR
SWZ
IND
PRY
SENBOL
TGO
EGY
BEN
MOZ
URY
KNA
MEX
MUSPHLBGR
CHLSDN
IND
GRD
ARG
VCT
IDNVEN
GTM
GNB
CHL
SYR
TGO
CRICZE
ZAFLTU
LKA
PHL
SYR
CHL
COLGNB
COLTUR
HTI
PRY
LKA
BRA
EGY
BRB
BOLSYCTHACRIKEN
CMR
BDIMWIMAR
HND
ECU
MDG
NERIND
PER
RWABDI
SYRMEXECUPAK
BFA
PER
RWA
LTU
ETH
DOMKNALKA
DOM
ZAF
ARG
VEN
SLV
BOL
VEN
IDN
MNGMWI
ZAFURY
HTIHNDBGR
GNB
THACHL
IND
VEN
TUNARM
CMRTUN
BFA
NGA
MKD
URY
LKABHR
SENMDG
NER
BOL
RWA
GABMLI
MYS
SENSENNERGRD
TZAARMTGO
SLV
URY
ZAF
NGA
KNA
MDG
THA
HTI
PRY
BEN
ARMGTM
IND
URY
KNATCDBDI
CMR
TCD
SYR
MDG
THAMNG
DMA
VCT
MDG
CHL
EGY
SWZURY
COL
LTU
DOM
HRV
LKA
ARG
CHL
VCT
MEX
UGA
GAB
TGO
MNG
CRI
PAK
SLV
HTI
ARMPERPHL
PRYSWZ
KEN
TGO
PAK
BOL
COL
NAM
URY
RWA
BHRDMA
PRY
PER
SENHRV
SEN
ZAF
MDG
SYR
MUS
TTOBHR
TGOTGOTGOHND
RWA
VEN
HND
SVNPER
TZA
PHL
SEN
MYS
PHL
CRIBRBCRI
HND
BOLGTMGAB
SEN
VCT
MEX
RWAPHL
MWI
CMR
RWA
BRAIDN
ZAF
BOLDOM
BFA
IDN
NGA
SYR
PHL
IDNARM
NER
ZAFBRB
NGA
TURCMRMEX
MYS
ECUECU
BRA
NGA
BEN
RWA
BHRCOL
MKDMUSBFAMYSTHAMEXVENSLV
BOL
BOL
PAK
SWZSWZ
SEN
MEX
TUR
MLI
GRDPOL
CMR
SVK
DMA
MRT
NGA
MYS
ETHCRI
LKA
GRD
ZAF
TUR
PRY
MLI
BFABFACRITUN
TCD
UGA
TZAPAK
LKA
BRA
ZAF
TTOBRA
IDNEGY
HUN
MYS
SWZTUNDOM
MEX
COL
SAU
BRA
PER
URYVCT
PRY
HND
SWZ
KEN
GTM
NGA
ECU
COG
MYS
NER
SVNSWZ
LSO
MEX
NGA
TCD
MWI
VEN
VCTCRITHA
MOZ
MYSMKDTUR
SAU
KEN
URY
MUS
DOM
BDISYC
MDGPRY
SVN
MNGDMA
PAK
IDN
GTMHND
MWI
ZWE
TURKNASLEUGA
NGA
DMANERURY
MEX
BENMOZMOZMOZBOL
ZAF
TTO
CZE
TZA
MDGGNBMDGMYS
BOL
LKAMWIMYS
HND
SVNMDGMKD
TGO
MDG
GABSVKZAFDMA
PER
HNDECUSLE
GABLSO
TTOKNA
ZWE
TTO
URY
CZE
GAB
ARG
BRA
POL
SDNGAB
ARGCHL
URY
SLV
SLE
UGA
URY
COG
ZMB
GABSVNSEN
MWI
HND
IDN
KWT
ECU
SLV
VENBRA
MDG
MDGMUS
UGAVEN
BGR
NGA
ARG
ZMB
GNB
BRA
-1-.
50
.51
e(
ltcr
| X
)
-.2 -.1 0 .1 .2e( ind_int_avg | X )
coef = .46681983, (robust) se = .20742027, t = 2.25
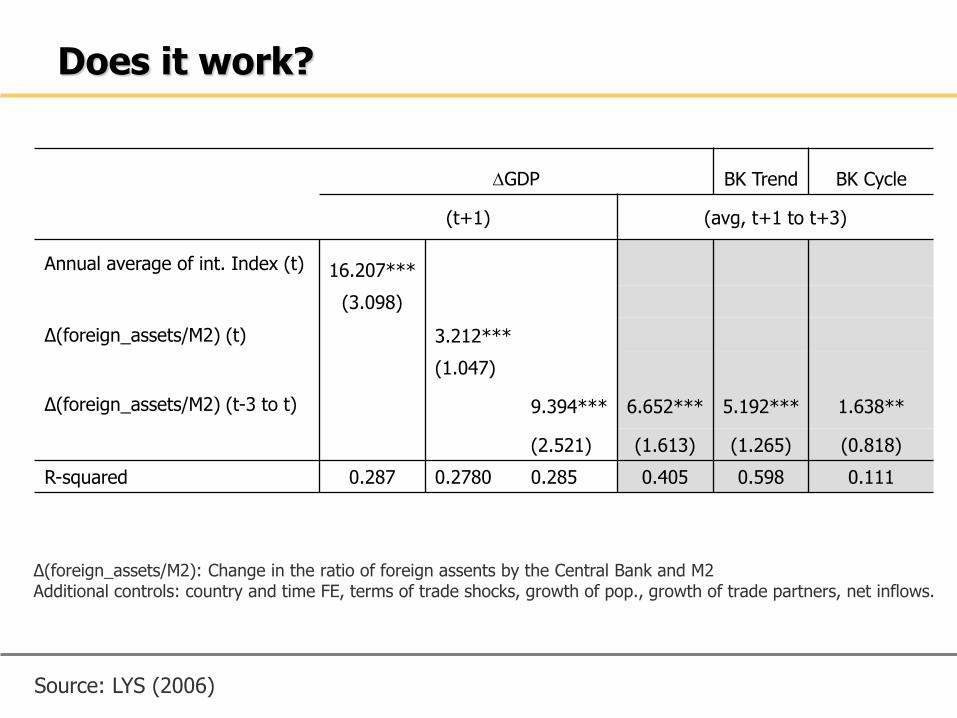
Does it work?
∆(foreign_assets/M2): Change in the ratio of foreign assents by the Central Bank and M2 Additional controls: country and time FE, terms of trade shocks, growth of pop., growth of trade partners, net inflows.
DGDP BK Trend BK Cycle
(t+1) (avg, t+1 to t+3)
Annual average of int. Index (t) 16.207***
(3.098)
∆(foreign_assets/M2) (t) 3.212***
(1.047)
∆(foreign_assets/M2) (t-3 to t) 9.394*** 6.652*** 5.192*** 1.638**
(2.521) (1.613) (1.265) (0.818)
R-squared 0.287 0.2780 0.285 0.405 0.598 0.111
Source: LYS (2006)
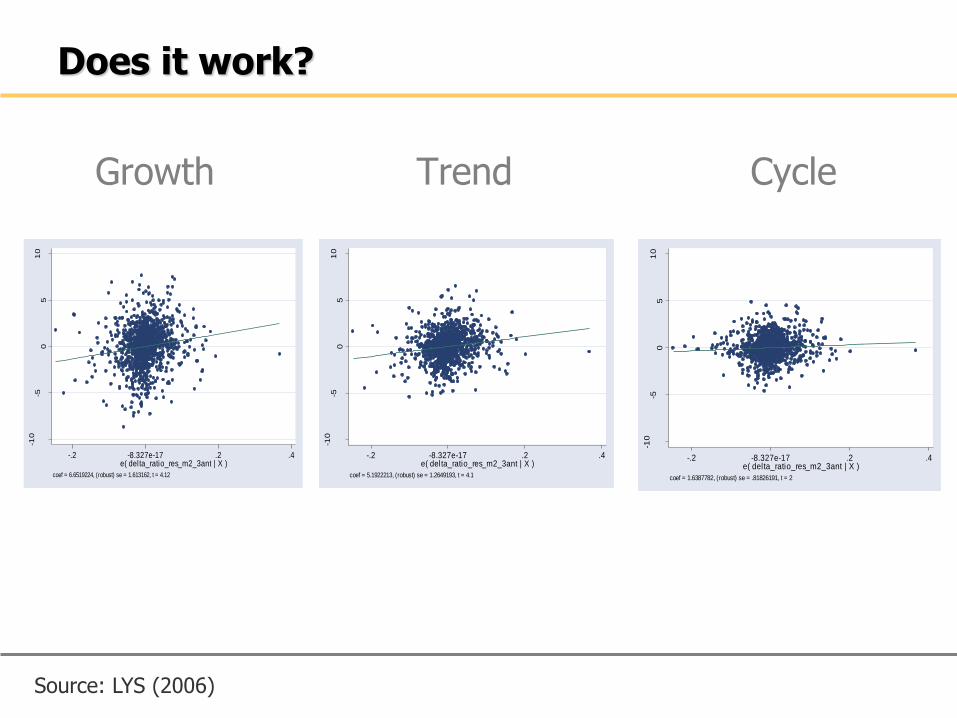
Growth Trend Cycle
Source: LYS (2006)
Does it work? -1
0-5
05
10
e(
pro
m_
de
lta
_g
dp
| X
)
-.2 -8.327e-17 .2 .4e( delta_ratio_res_m2_3ant | X )
coef = 6.6519224, (robust) se = 1.613162, t = 4.12
-10
-50
51
0
e(
pro
m_
d_
bktr
en
d_
lgd
p_
un
| X
)
-.2 -8.327e-17 .2 .4e( delta_ratio_res_m2_3ant | X )
coef = 5.1922213, (robust) se = 1.2649193, t = 4.1
-10
-50
51
0
e(
pro
m_
d_
bkcic
le_
lgd
p_
un
| X
)
-.2 -8.327e-17 .2 .4e( delta_ratio_res_m2_3ant | X )
coef = 1.6387782, (robust) se = .81826191, t = 2
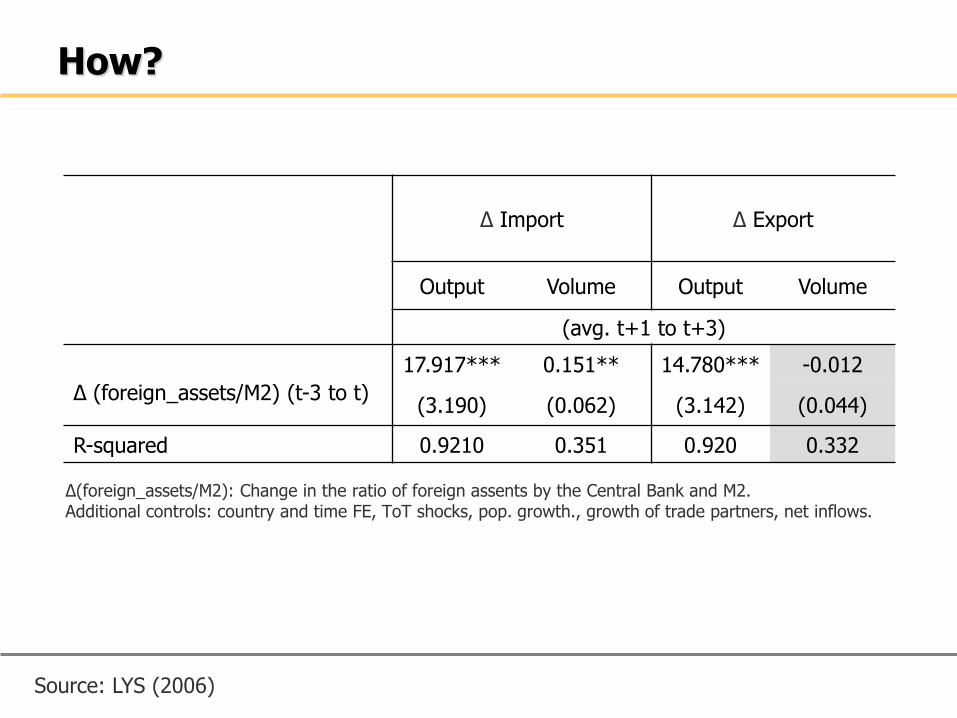
How?
∆(foreign_assets/M2): Change in the ratio of foreign assents by the Central Bank and M2. Additional controls: country and time FE, ToT shocks, pop. growth., growth of trade partners, net inflows.
∆ Import ∆ Export
Output Volume Output Volume
(avg. t+1 to t+3)
∆ (foreign_assets/M2) (t-3 to t)
17.917*** 0.151** 14.780*** -0.012
(3.190) (0.062) (3.142) (0.044)
R-squared 0.9210 0.351 0.920 0.332
Source: LYS (2006)
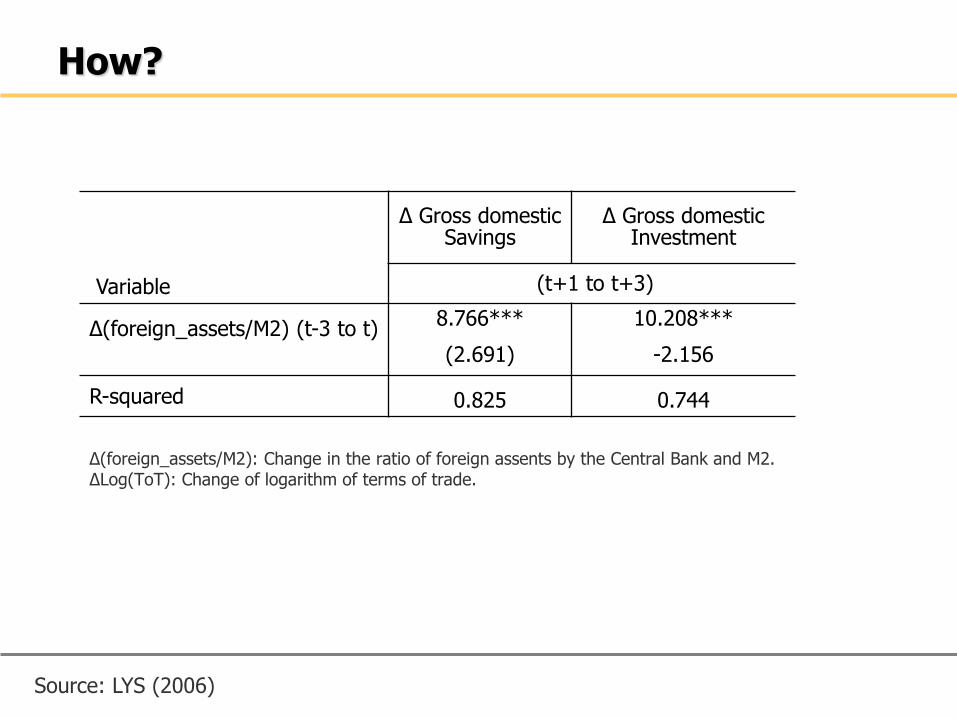
How?
∆(foreign_assets/M2): Change in the ratio of foreign assents by the Central Bank and M2. ∆Log(ToT): Change of logarithm of terms of trade.
∆ Gross domestic Savings
∆ Gross domestic Investment
Variable (t+1 to t+3)
∆(foreign_assets/M2) (t-3 to t)
8.766*** 10.208***
(2.691) -2.156
R-squared 0.825 0.744
Source: LYS (2006)
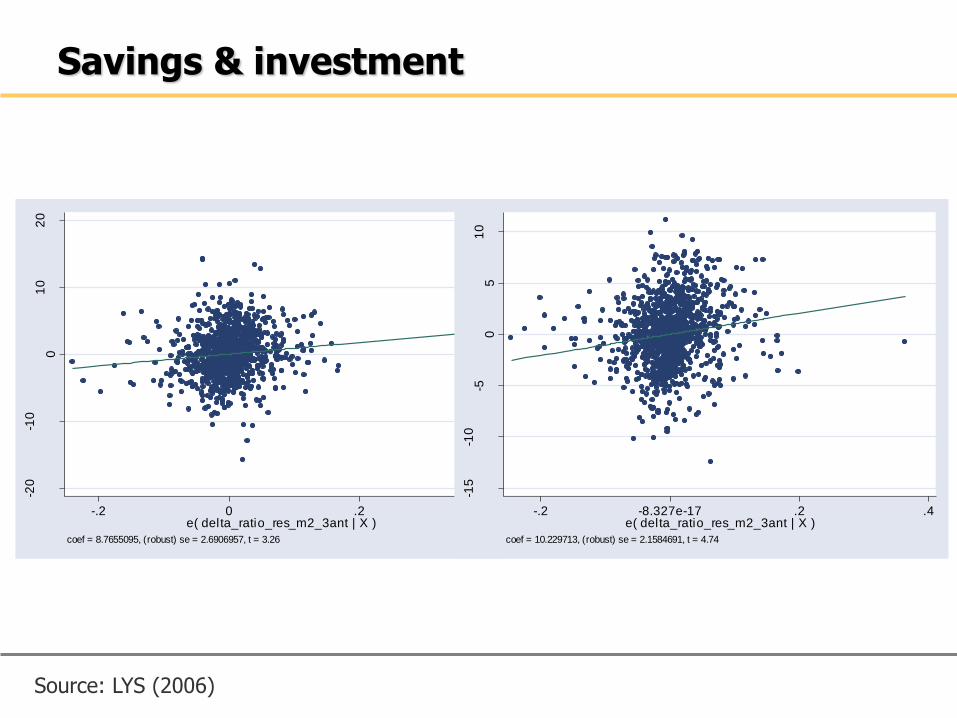
Savings & investment
Source: LYS (2006)
-20
-10
01
02
0
e(
pro
m3
_p
_g
ds |
X )
-.2 0 .2 .4e( delta_ratio_res_m2_3ant | X )
coef = 8.7655095, (robust) se = 2.6906957, t = 3.26
-15
-10
-50
51
0
e(
pro
m3
_p
_g
kf
| X
)
-.2 -8.327e-17 .2 .4e( delta_ratio_res_m2_3ant | X )
coef = 10.229713, (robust) se = 2.1584691, t = 4.74
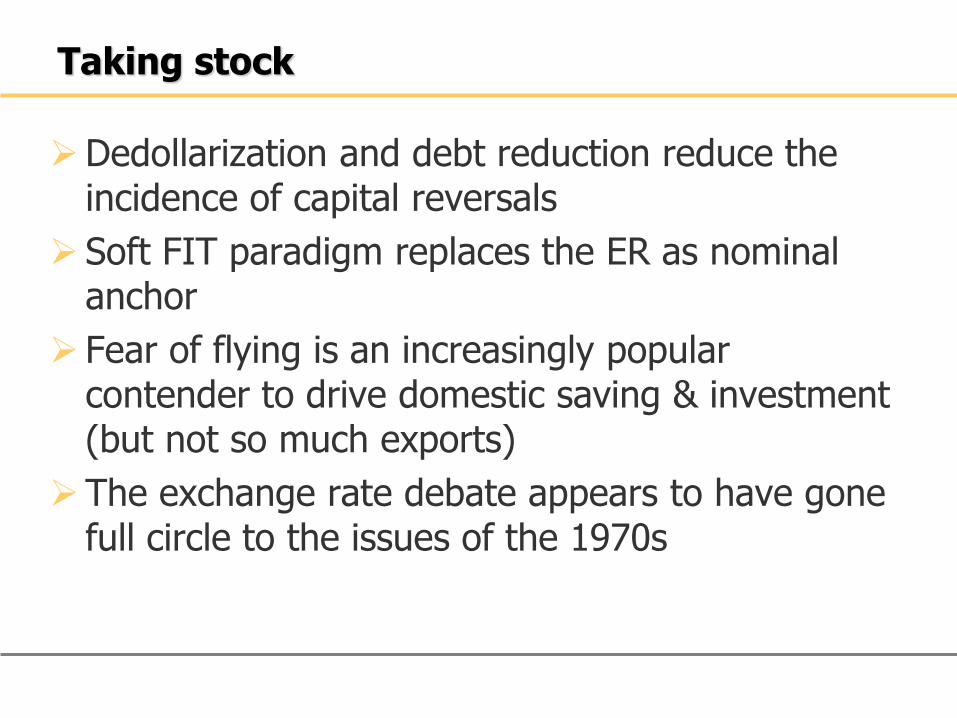
Taking stock
Dedollarization and debt reduction reduce the incidence of capital reversals
Soft FIT paradigm replaces the ER as nominal anchor
Fear of flying is an increasingly popular contender to drive domestic saving & investment (but not so much exports)
The exchange rate debate appears to have gone full circle to the issues of the 1970s

Thank you
33
Eduardo Levy Yeyati
The World Bank & Universidad Di Tella
December, 2006
Fear of Floating or Fear of Flying:
Exchange Rate Policy in the New Millenium
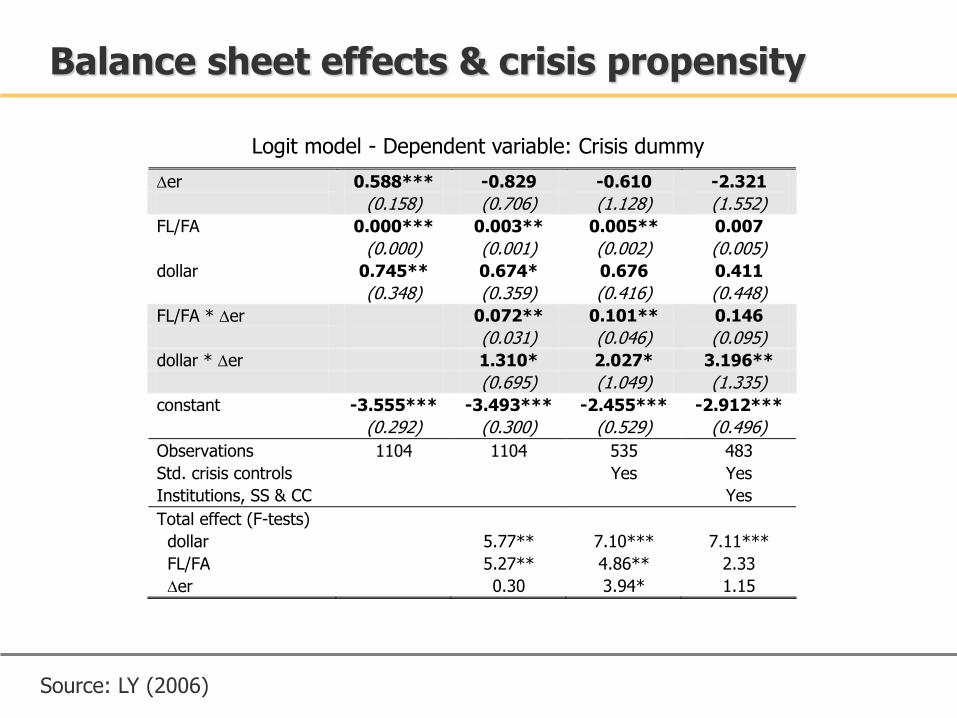
Balance sheet effects & crisis propensity
Logit model - Dependent variable: Crisis dummy
Der 0.588*** -0.829 -0.610 -2.321
(0.158) (0.706) (1.128) (1.552)
FL/FA 0.000*** 0.003** 0.005** 0.007
(0.000) (0.001) (0.002) (0.005)
dollar 0.745** 0.674* 0.676 0.411
(0.348) (0.359) (0.416) (0.448)
FL/FA * Der 0.072** 0.101** 0.146
(0.031) (0.046) (0.095)
dollar * Der 1.310* 2.027* 3.196**
(0.695) (1.049) (1.335)
constant -3.555*** -3.493*** -2.455*** -2.912***
(0.292) (0.300) (0.529) (0.496)
Observations 1104 1104 535 483
Std. crisis controls Yes Yes
Institutions, SS & CC Yes
Total effect (F-tests)
dollar 5.77** 7.10*** 7.11***
FL/FA 5.27** 4.86** 2.33
Der 0.30 3.94* 1.15
Source: LY (2006)
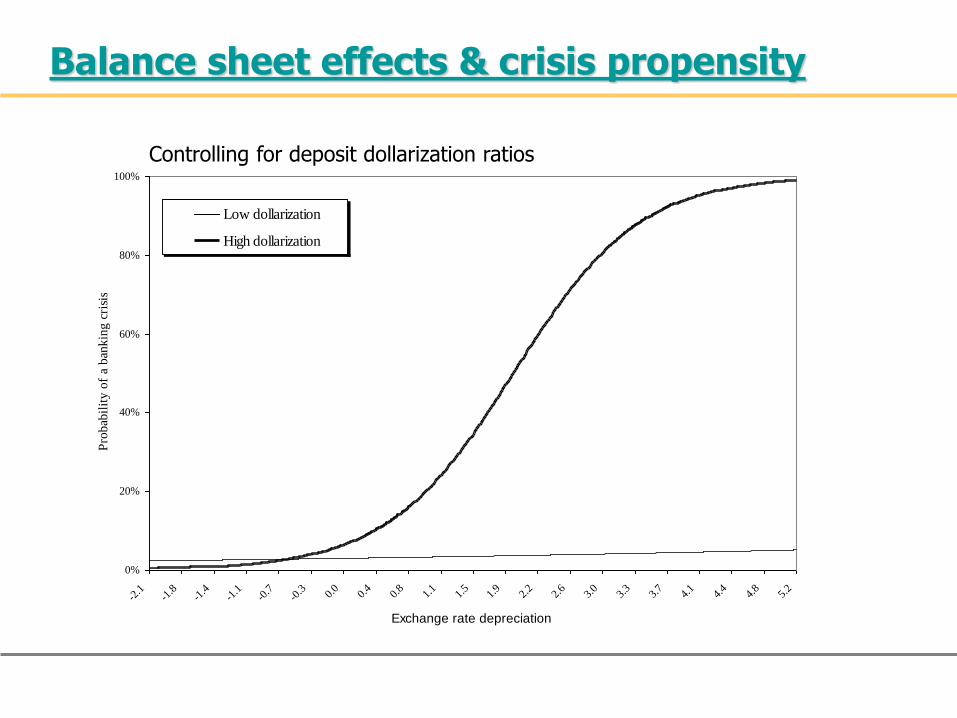
Controlling for deposit dollarization ratios
0%
20%
40%
60%
80%
100%
-2.1
-1.8
-1.4
-1.1
-0.7
-0.3 0.
00.
40.
81.
11.
51.
92.
22.
63.
03.
33.
74.
14.
44.
85.
2
Exchange rate depreciation
Pro
bab
ilit
y o
f a
ban
kin
g c
risi
s
Low dollarization
High dollarization
Balance sheet effects & crisis propensity
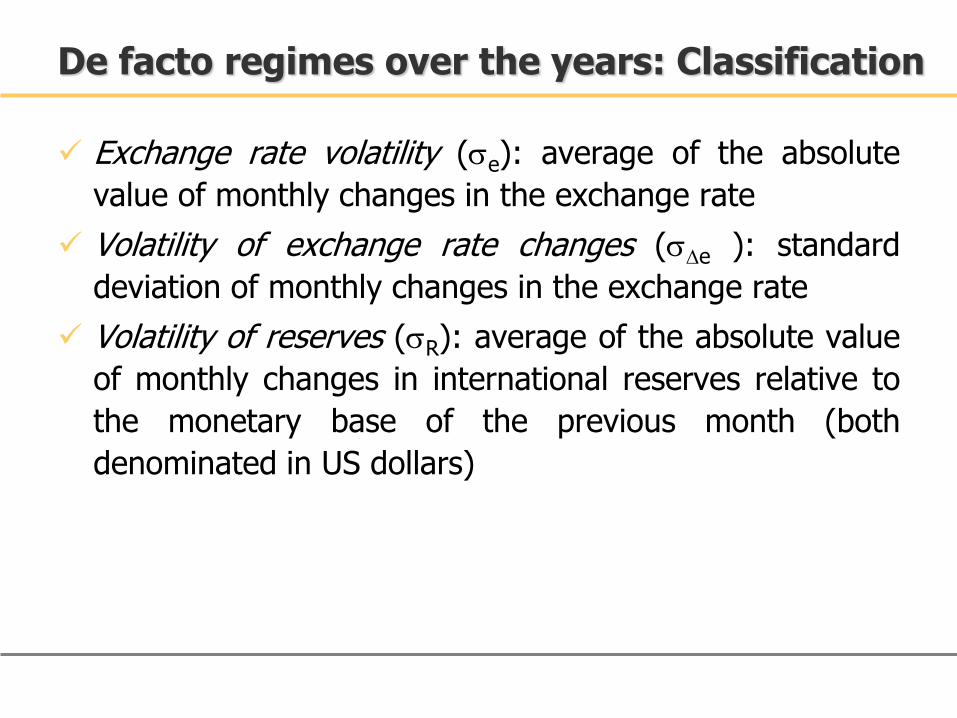
Exchange rate volatility (e): average of the absolute
value of monthly changes in the exchange rate
Volatility of exchange rate changes (De ): standard
deviation of monthly changes in the exchange rate
Volatility of reserves (R): average of the absolute value
of monthly changes in international reserves relative to
the monetary base of the previous month (both
denominated in US dollars)
De facto regimes over the years: Classification
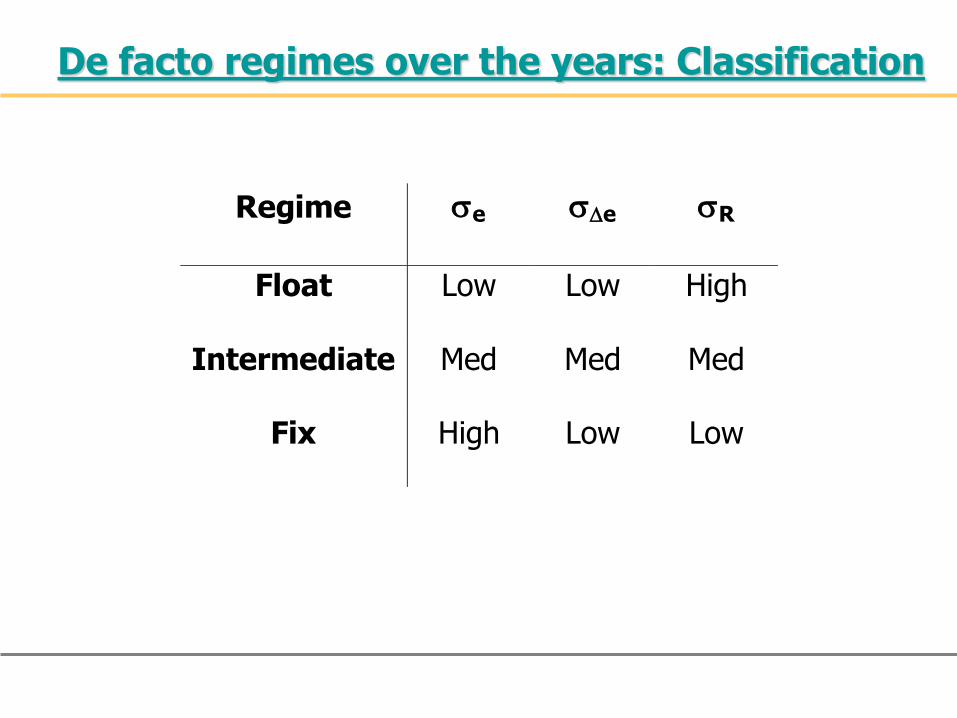
De facto regimes over the years: Classification
Regime e De R
Float Low Low High
Intermediate Med Med Med
Fix High Low Low
Top Related