


Languages
Pages
Legal

www.fairchildsemi.com
1
Fairchild Semiconductor International, Inc.
UBS Global Technology Conference
November 14, 2012
Dan Janson Vice President of Investor Relations
www.fairchildsemi.com
Notes on Forward Looking Statements and Non-GAAP Measures
• Comments in this presentation other than statements of historical fact may constitute forward looking statements and are based on Fairchild’s management’s estimates and projections and are subject to various risks and uncertainties
• These risks and uncertainties are described in the Company’s periodic reports and other filings with the Securities and Exchange Commission (see the Risk Factors section) and are available at http://sec.gov and investor.fairchildsemi.com
• Actual results may differ materially from those projected in the forward looking statements
• Some data in this presentation may include non-GAAP measures that we believe provide useful information about the operating performance of our businesses that should be considered by investors in conjunction with GAAP measures that we also provide. You can find a reconciliation of non-GAAP to comparable GAAP measures at the Investor Relations section of our web site at http://investor.fairchildsemi.com
Recent additions to our website at http://investor.fairchildsemi.com Updated Financials (through current quarter with segment revenue/gross margin breakouts)
• Quarterly Fact Sheet with current quarter highlights
• This investor presentation

www.fairchildsemi.com
• Wireless Convergence and Energy Efficiency mega-trends
• Power silicon content grows faster than end market sales – premium paid for efficiency
• Segment structure increases our apps knowledge and ability to sell solutions
• Large customers dominate these markets and align well with Fairchild’s strengths in SCM, global presence and wide product breadth
Markets That Drive Our Business
www.fairchildsemi.com 4
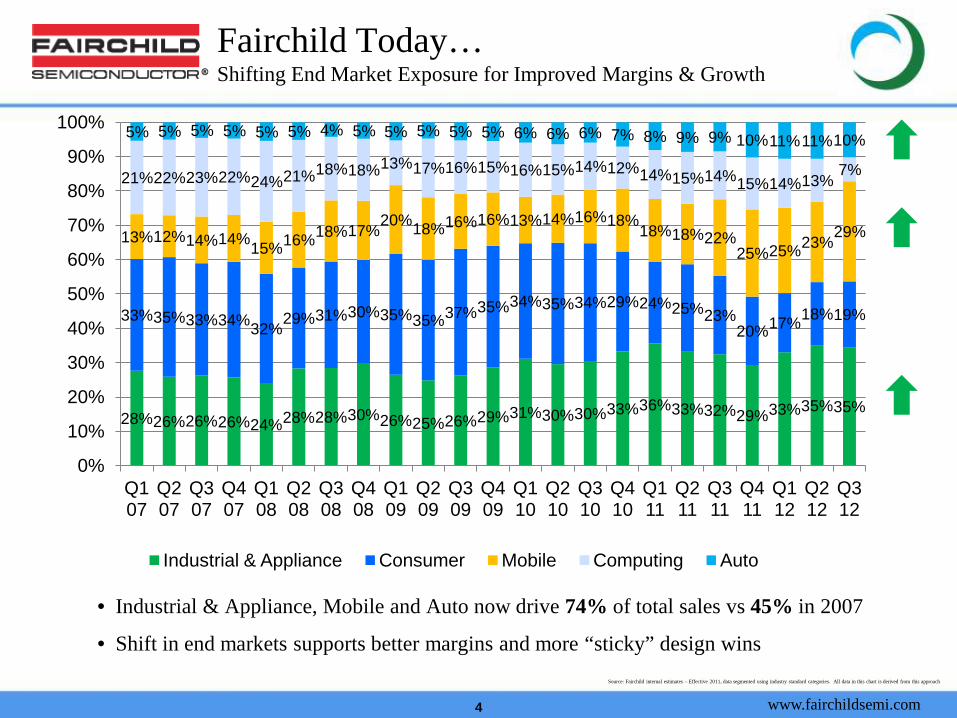
Source: Fairchild internal estimates – Effective 2011, data segmented using industry standard categories. All data in this chart is derived from this approach
• Industrial & Appliance, Mobile and Auto now drive 74% of total sales vs 45% in 2007
• Shift in end markets supports better margins and more “sticky” design wins
Fairchild Today… Shifting End Market Exposure for Improved Margins & Growth
28% 26% 26% 26% 24% 28% 28% 30% 26% 25% 26% 29% 31% 30% 30% 33% 36% 33% 32% 29% 33% 35% 35%
33% 35% 33% 34% 32% 29% 31% 30% 35% 35% 37% 35% 34% 35% 34% 29% 24% 25% 23% 20% 17% 18% 19%
13% 12% 14% 14% 15% 16% 18% 17% 20% 18% 16% 16% 13% 14% 16% 18% 18% 18% 22%
25% 25% 23% 29%
21% 22% 23% 22% 24% 21% 18% 18% 13% 17% 16% 15% 16% 15% 14% 12% 14% 15% 14% 15% 14% 13% 7%
5% 5% 5% 5% 5% 5% 4% 5% 5% 5% 5% 5% 6% 6% 6% 7% 8% 9% 9% 10% 11% 11% 10%
0%
10%
20%
30%
40%
50%
60%
70%
80%
90%
100%
Q1 07
Q2 07
Q3 07
Q4 07
Q1 08
Q2 08
Q3 08
Q4 08
Q1 09
Q2 09
Q3 09
Q4 09
Q1 10
Q2 10
Q3 10
Q4 10
Q1 11
Q2 11
Q3 11
Q4 11
Q1 12
Q2 12
Q3 12
Industrial & Appliance Consumer Mobile Computing Auto
www.fairchildsemi.com
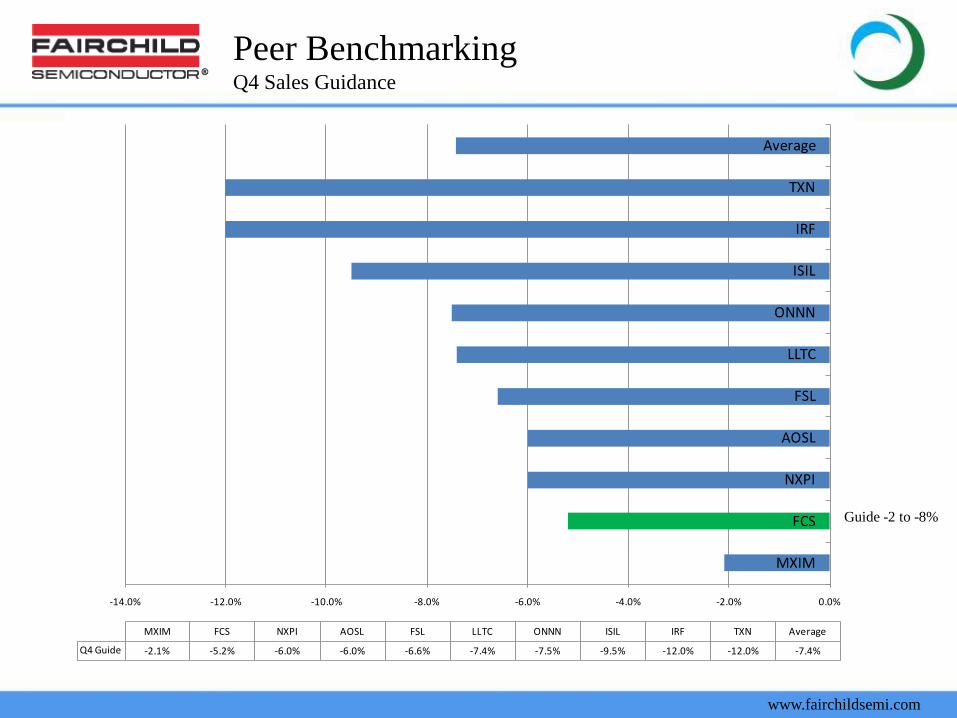
Peer Benchmarking Q4 Sales Guidance
-14.0% -12.0% -10.0% -8.0% -6.0% -4.0% -2.0% 0.0%
MXIM
FCS
NXPI
AOSL
FSL
LLTC
ONNN
ISIL
IRF
TXN
Average
MXIM FCS NXPI AOSL FSL LLTC ONNN ISIL IRF TXN Average
Q4 Guide -2.1% -5.2% -6.0% -6.0% -6.6% -7.4% -7.5% -9.5% -12.0% -12.0% -7.4%
Guide -2 to -8%
www.fairchildsemi.com
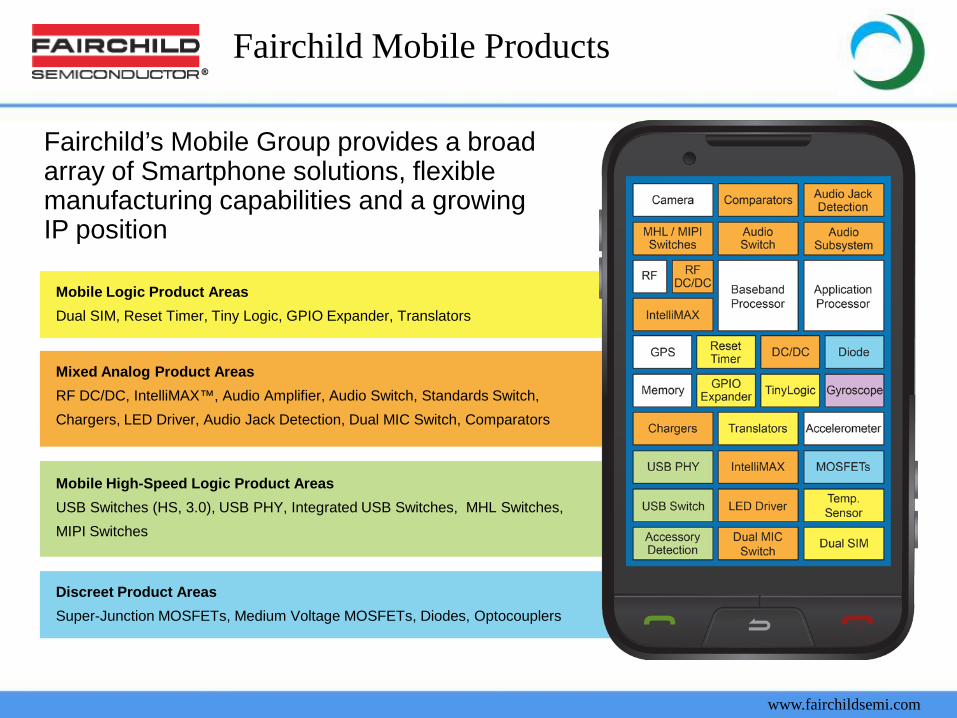
Fairchild’s Mobile Group provides a broad array of Smartphone solutions, flexible manufacturing capabilities and a growing IP position
Mobile High-Speed Logic Product Areas USB Switches (HS, 3.0), USB PHY, Integrated USB Switches, MHL Switches, MIPI Switches
Mobile Logic Product Areas Dual SIM, Reset Timer, Tiny Logic, GPIO Expander, Translators
Mixed Analog Product Areas RF DC/DC, IntelliMAX™, Audio Amplifier, Audio Switch, Standards Switch, Chargers, LED Driver, Audio Jack Detection, Dual MIC Switch, Comparators
Discreet Product Areas Super-Junction MOSFETs, Medium Voltage MOSFETs, Diodes, Optocouplers
Fairchild Mobile Products
www.fairchildsemi.com
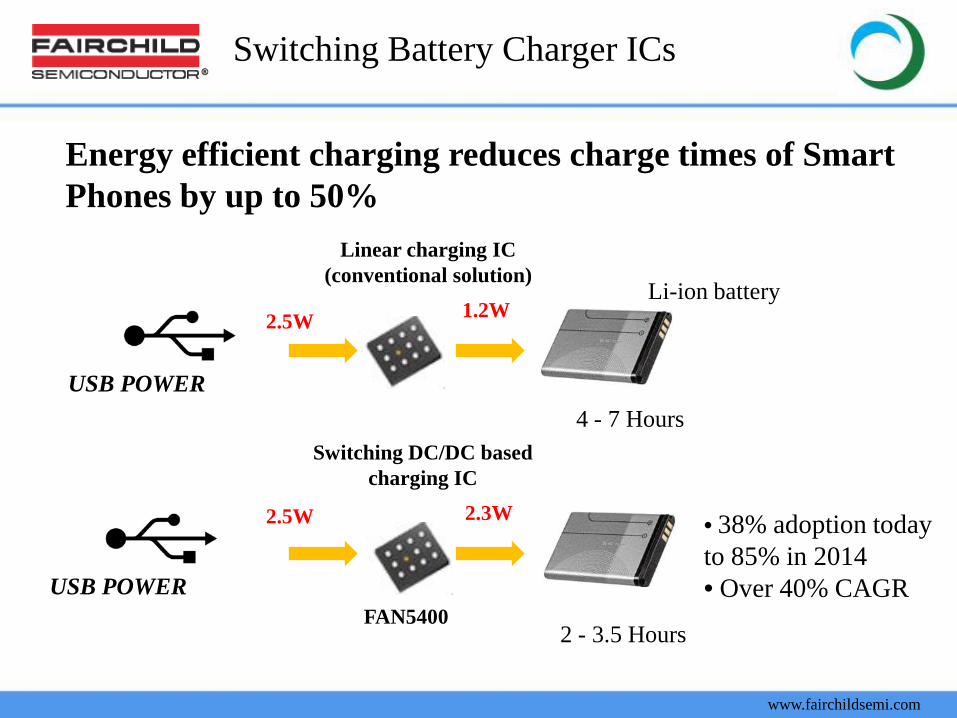
Switching Battery Charger ICs
FAN5400
2.5W
Energy efficient charging reduces charge times of Smart Phones by up to 50%
1.2W
USB POWER
2.5W 2.3W
USB POWER
Linear charging IC (conventional solution)
4 - 7 Hours
2 - 3.5 Hours
Switching DC/DC based charging IC
Li-ion battery
• 38% adoption today to 85% in 2014 • Over 40% CAGR
www.fairchildsemi.com
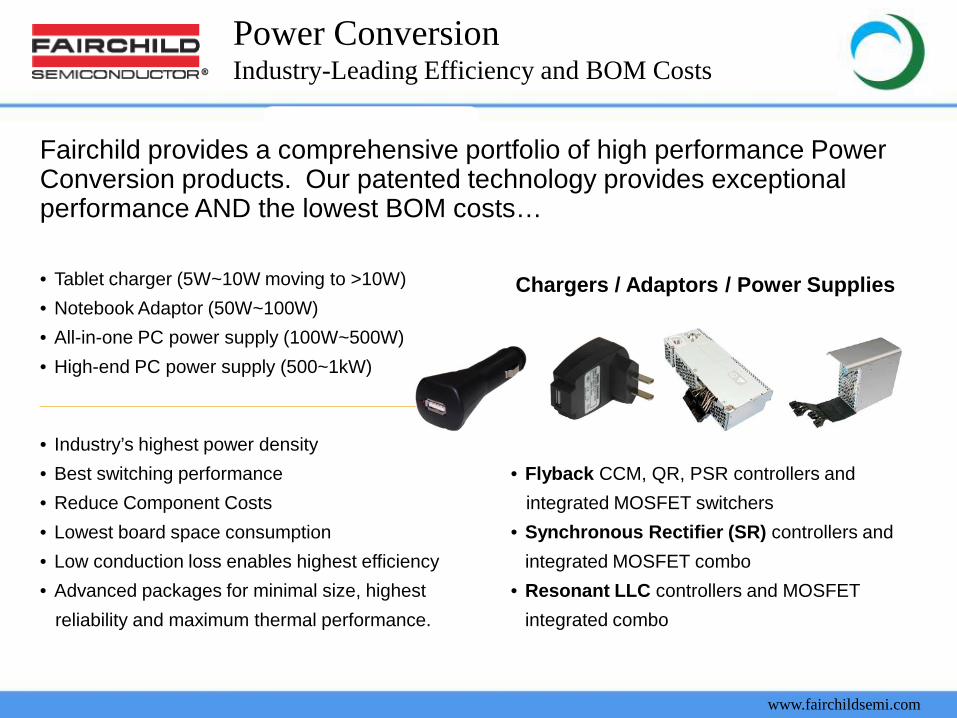
• Industry’s highest power density • Best switching performance • Reduce Component Costs • Lowest board space consumption • Low conduction loss enables highest efficiency • Advanced packages for minimal size, highest reliability and maximum thermal performance.
Chargers / Adaptors / Power Supplies • Tablet charger (5W~10W moving to >10W) • Notebook Adaptor (50W~100W) • All-in-one PC power supply (100W~500W) • High-end PC power supply (500~1kW)
• Flyback CCM, QR, PSR controllers and integrated MOSFET switchers • Synchronous Rectifier (SR) controllers and
integrated MOSFET combo • Resonant LLC controllers and MOSFET
integrated combo
Power Conversion Industry-Leading Efficiency and BOM Costs
Fairchild provides a comprehensive portfolio of high performance Power Conversion products. Our patented technology provides exceptional performance AND the lowest BOM costs…
www.fairchildsemi.com
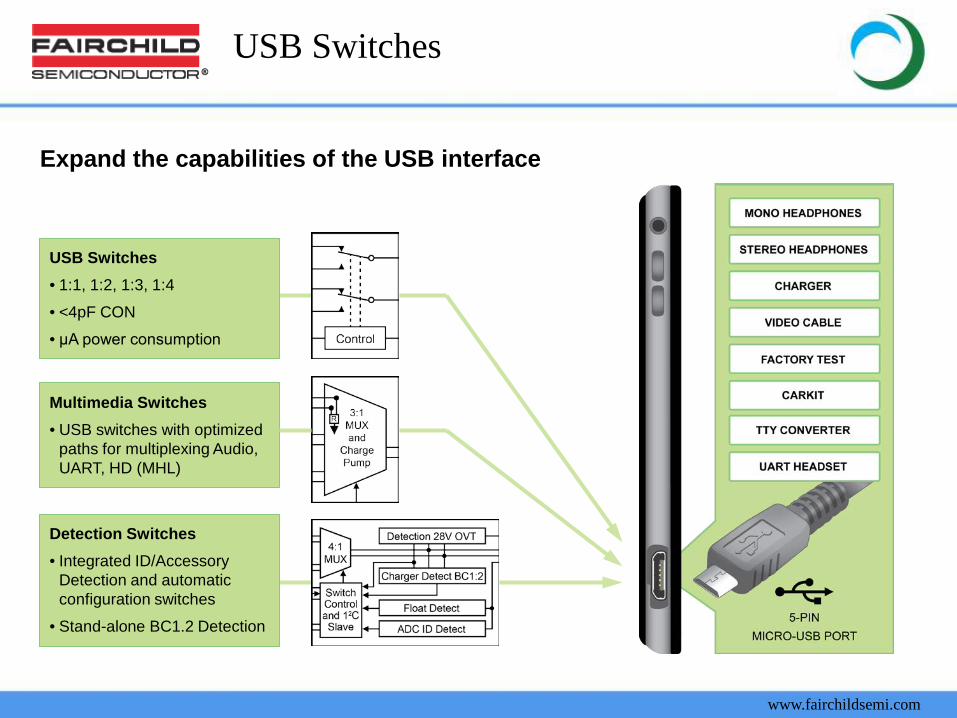
USB Switches • 1:1, 1:2, 1:3, 1:4
• <4pF CON
• μA power consumption
Multimedia Switches • USB switches with optimized
paths for multiplexing Audio, UART, HD (MHL)
Detection Switches • Integrated ID/Accessory
Detection and automatic configuration switches
• Stand-alone BC1.2 Detection
Expand the capabilities of the USB interface
USB Switches
www.fairchildsemi.com
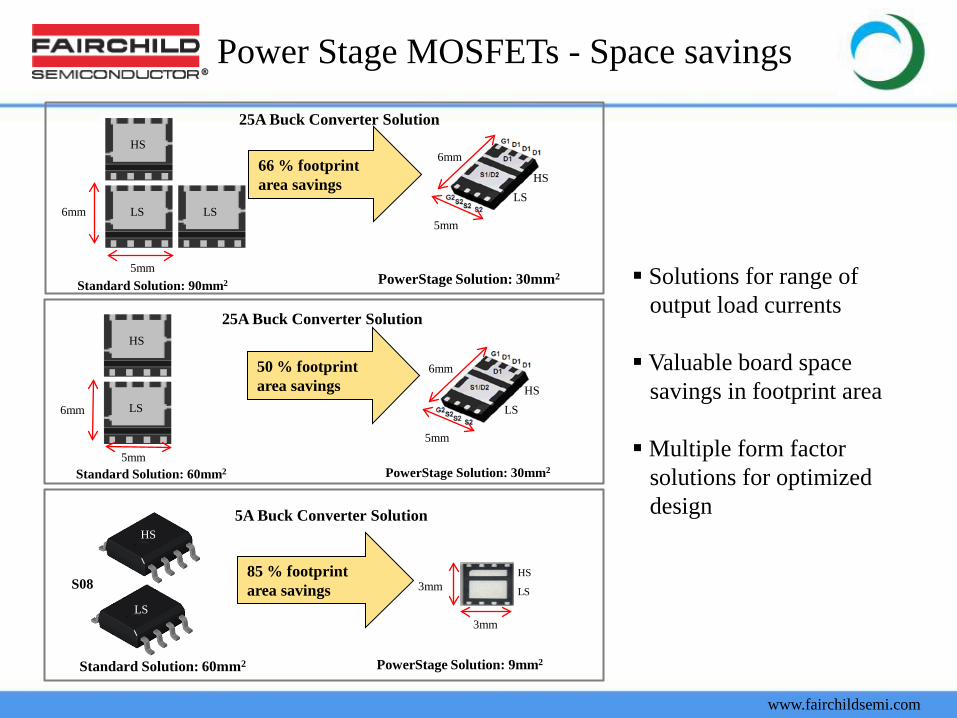
6mm
5mm
HS
LS
Standard Solution: 60mm2
50 % footprint area savings
PowerStage Solution: 30mm2
6mm
5mm
HS
LS
6mm
5mm
HS
LS
Standard Solution: 90mm2
LS
66 % footprint area savings
6mm
5mm
HS
LS
PowerStage Solution: 30mm2
S08 3mm
3mm
HS
LS
HS
LS
PowerStage Solution: 9mm2
85 % footprint area savings
Standard Solution: 60mm2
25A Buck Converter Solution
5A Buck Converter Solution
25A Buck Converter Solution
Solutions for range of output load currents Valuable board space savings in footprint area Multiple form factor solutions for optimized design
Power Stage MOSFETs - Space savings
www.fairchildsemi.com
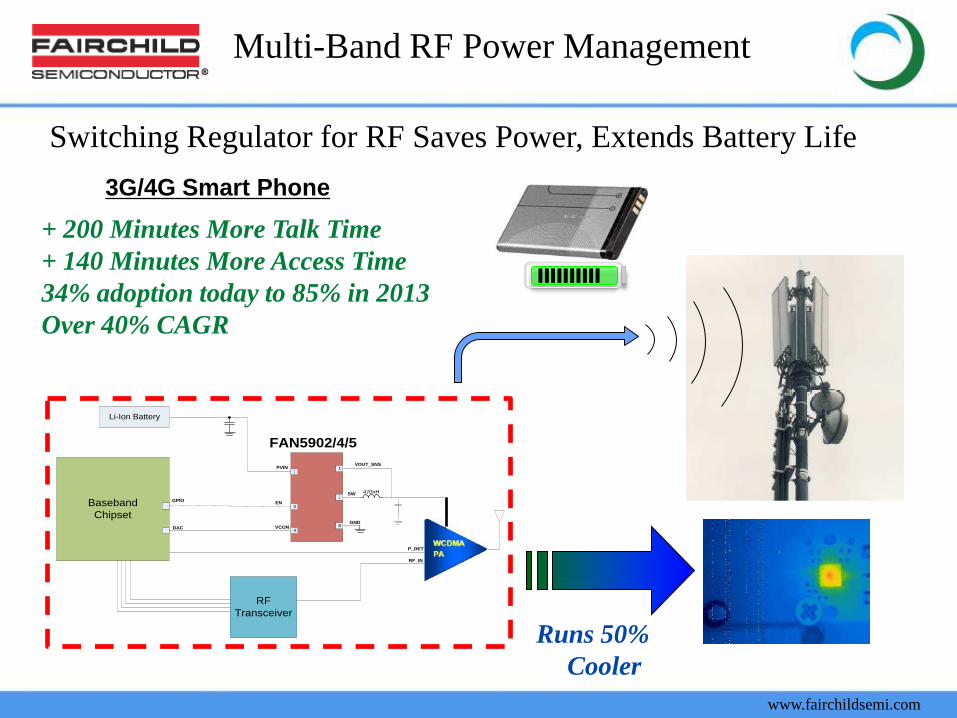
3G/4G Smart Phone
BasebandChipset
3G PA
470nH
1
10
64
Li-Ion Battery
11
RF Transceiver
VOUT_SNS
SW
GND
PVIN
EN
VCONDAC
RF_IN
P_DET
3GPIO
FAN5902/4/5
+ 200 Minutes More Talk Time + 140 Minutes More Access Time 34% adoption today to 85% in 2013 Over 40% CAGR
Runs 50% Cooler
Multi-Band RF Power Management
Switching Regulator for RF Saves Power, Extends Battery Life
www.fairchildsemi.com
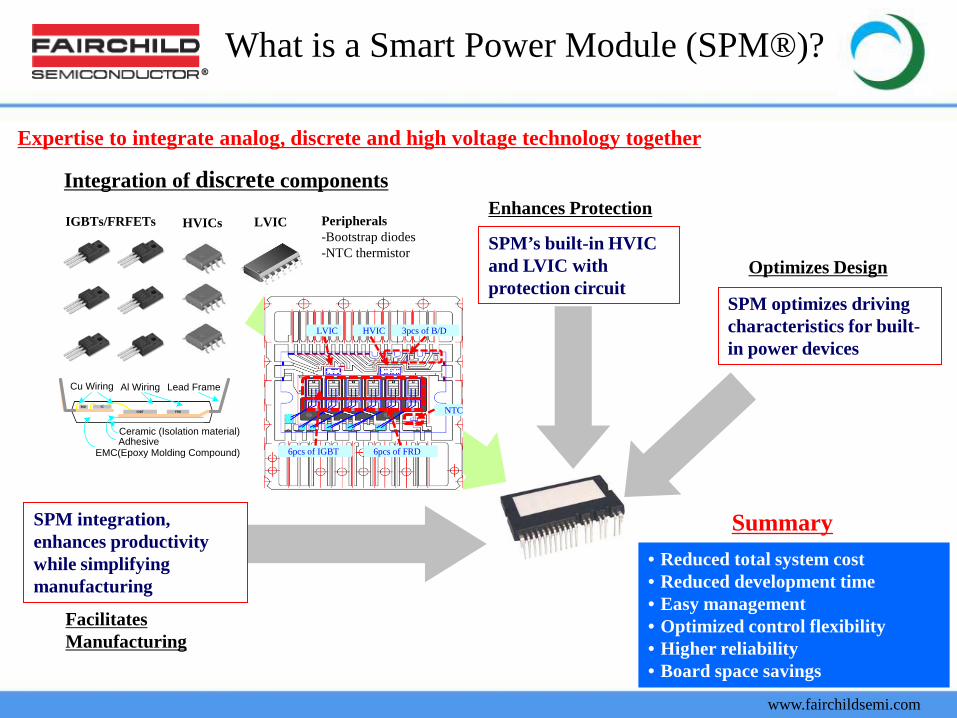
What is a Smart Power Module (SPM®)?
Expertise to integrate analog, discrete and high voltage technology together
Enhances Protection
Facilitates Manufacturing
LVIC HVICs IGBTs/FRFETs
Integration of discrete components
SPM integration, enhances productivity while simplifying manufacturing
SPM’s built-in HVIC and LVIC with protection circuit
SPM optimizes driving characteristics for built-in power devices
Optimizes Design
• Reduced total system cost • Reduced development time • Easy management • Optimized control flexibility • Higher reliability • Board space savings
Summary
LVIC HVIC
6pcs of IGBT 6pcs of FRD
NTC
3pcs of B/D
FRDIGBT
Ceramic (Isolation material)
IC
EMC(Epoxy Molding Compound)
Al WiringCu Wiring Lead Frame
Adhesive
B/D
Peripherals -Bootstrap diodes -NTC thermistor
www.fairchildsemi.com
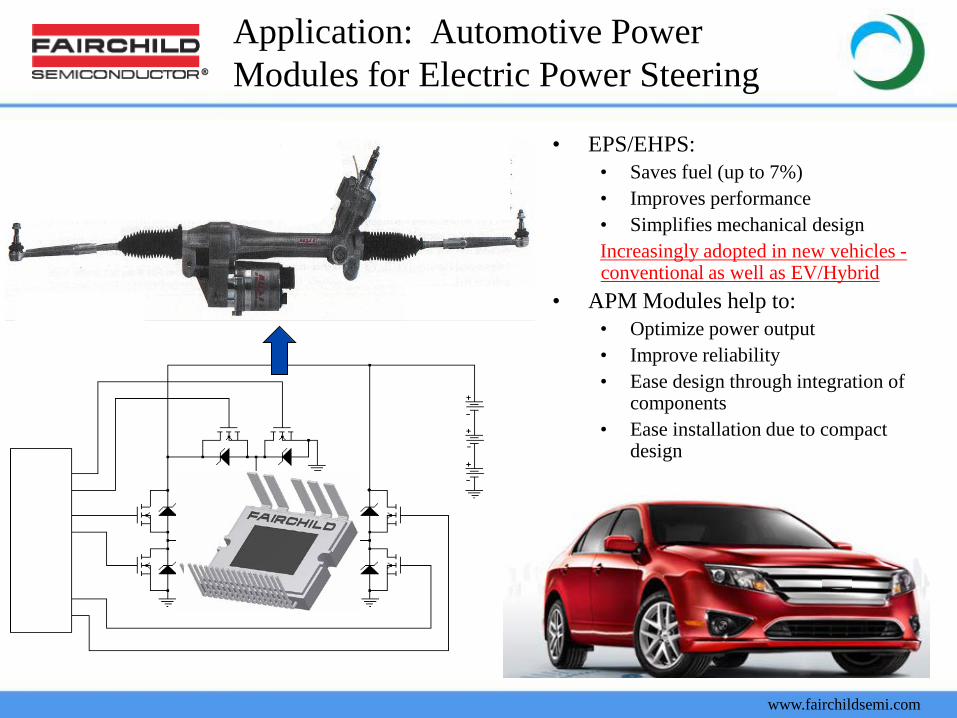
Application: Automotive Power Modules for Electric Power Steering
• EPS/EHPS: • Saves fuel (up to 7%) • Improves performance • Simplifies mechanical design Increasingly adopted in new vehicles - conventional as well as EV/Hybrid
• APM Modules help to: • Optimize power output • Improve reliability • Ease design through integration of
components • Ease installation due to compact
design
www.fairchildsemi.com
14
Finance Overview
www.fairchildsemi.com
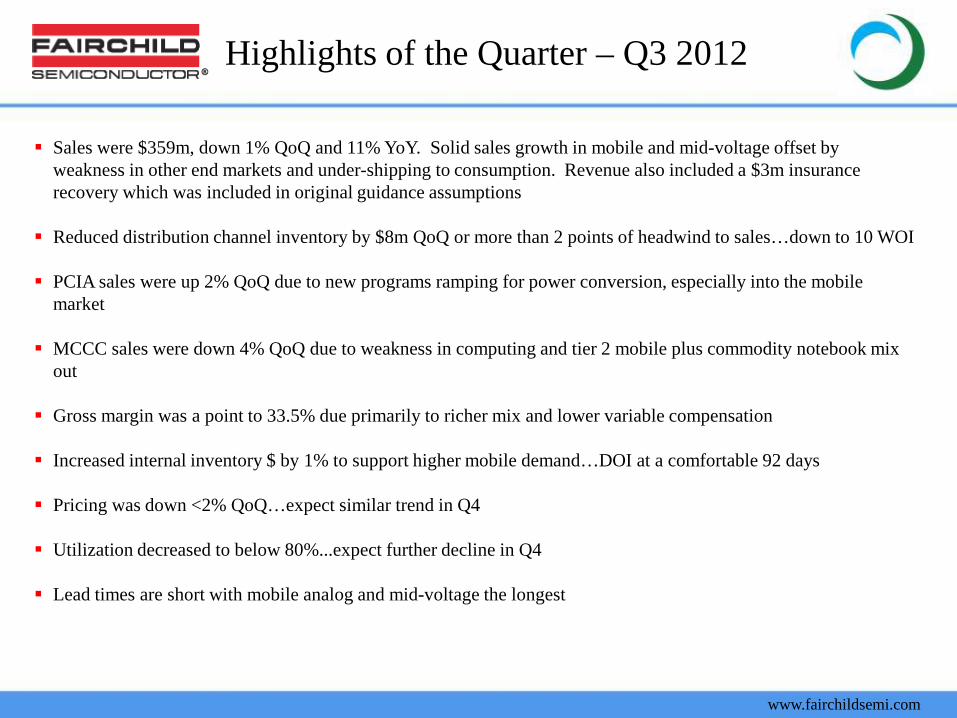
Highlights of the Quarter – Q3 2012
Sales were $359m, down 1% QoQ and 11% YoY. Solid sales growth in mobile and mid-voltage offset by weakness in other end markets and under-shipping to consumption. Revenue also included a $3m insurance recovery which was included in original guidance assumptions
Reduced distribution channel inventory by $8m QoQ or more than 2 points of headwind to sales…down to 10 WOI
PCIA sales were up 2% QoQ due to new programs ramping for power conversion, especially into the mobile market
MCCC sales were down 4% QoQ due to weakness in computing and tier 2 mobile plus commodity notebook mix out
Gross margin was a point to 33.5% due primarily to richer mix and lower variable compensation
Increased internal inventory $ by 1% to support higher mobile demand…DOI at a comfortable 92 days
Pricing was down <2% QoQ…expect similar trend in Q4
Utilization decreased to below 80%...expect further decline in Q4
Lead times are short with mobile analog and mid-voltage the longest
www.fairchildsemi.com
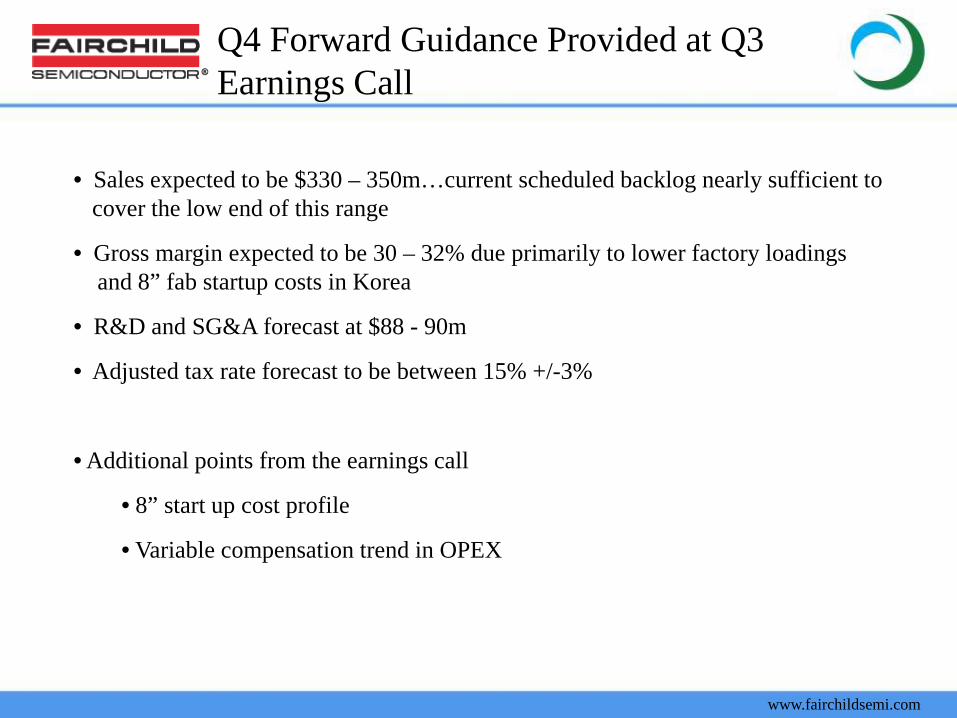
Q4 Forward Guidance Provided at Q3 Earnings Call
• Sales expected to be $330 – 350m…current scheduled backlog nearly sufficient to cover the low end of this range
• Gross margin expected to be 30 – 32% due primarily to lower factory loadings and 8” fab startup costs in Korea
• R&D and SG&A forecast at $88 - 90m
• Adjusted tax rate forecast to be between 15% +/-3%
• Additional points from the earnings call
• 8” start up cost profile
• Variable compensation trend in OPEX
www.fairchildsemi.com Company Confidential
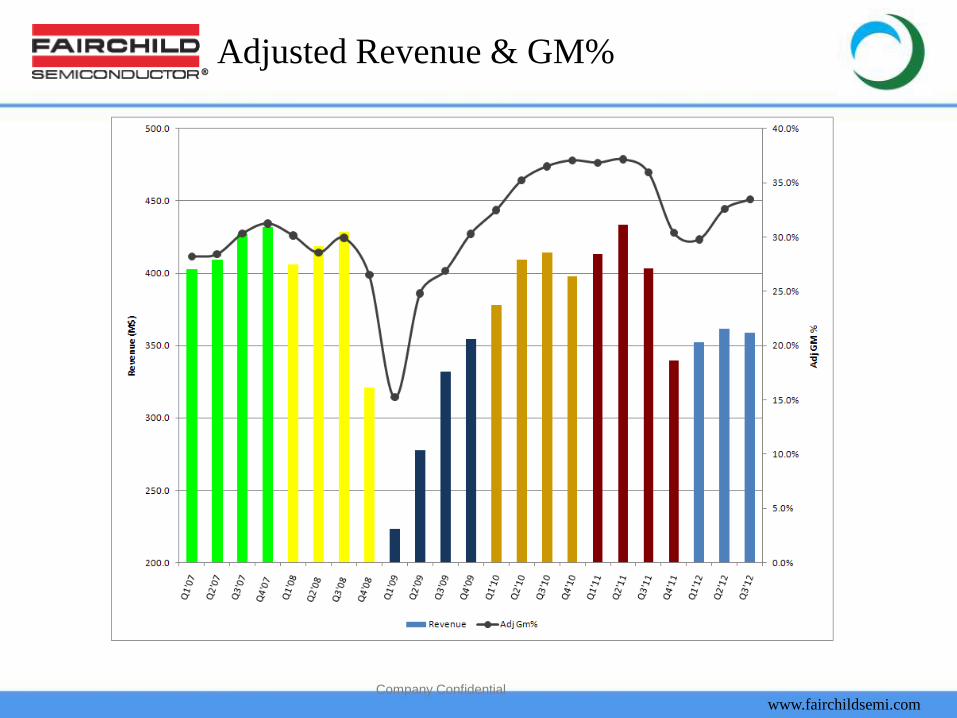
Adjusted Revenue & GM%
www.fairchildsemi.com
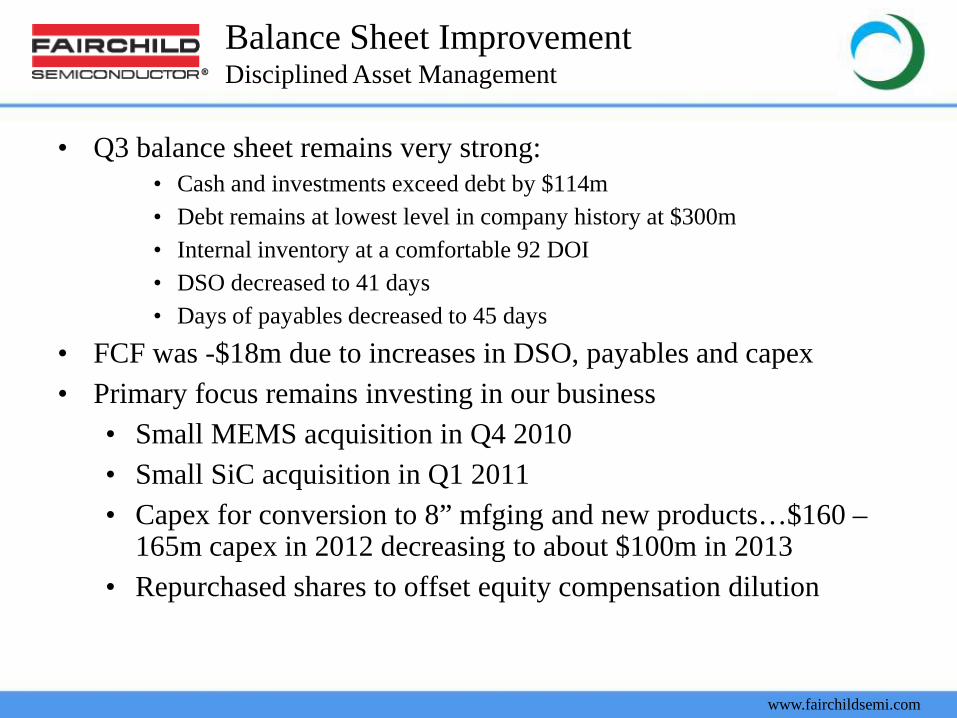
Balance Sheet Improvement Disciplined Asset Management
• Q3 balance sheet remains very strong: • Cash and investments exceed debt by $114m • Debt remains at lowest level in company history at $300m • Internal inventory at a comfortable 92 DOI • DSO decreased to 41 days • Days of payables decreased to 45 days
• FCF was -$18m due to increases in DSO, payables and capex • Primary focus remains investing in our business
• Small MEMS acquisition in Q4 2010 • Small SiC acquisition in Q1 2011 • Capex for conversion to 8” mfging and new products…$160 –
165m capex in 2012 decreasing to about $100m in 2013 • Repurchased shares to offset equity compensation dilution
www.fairchildsemi.com
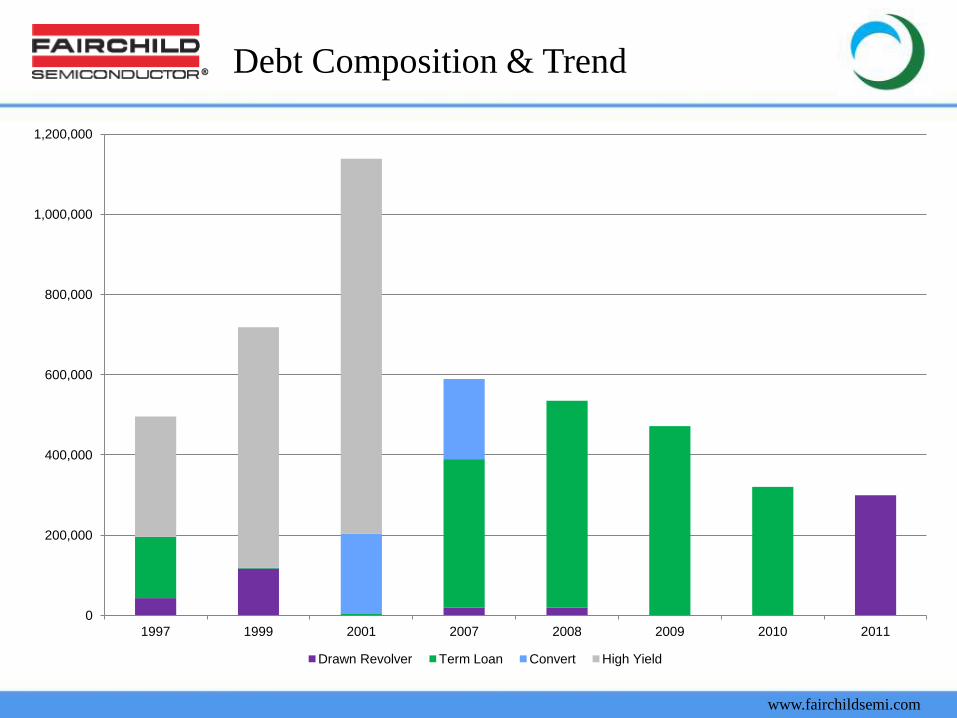
Debt Composition & Trend
0
200,000
400,000
600,000
800,000
1,000,000
1,200,000
1997 1999 2001 2007 2008 2009 2010 2011
Drawn Revolver Term Loan Convert High Yield
www.fairchildsemi.com
20
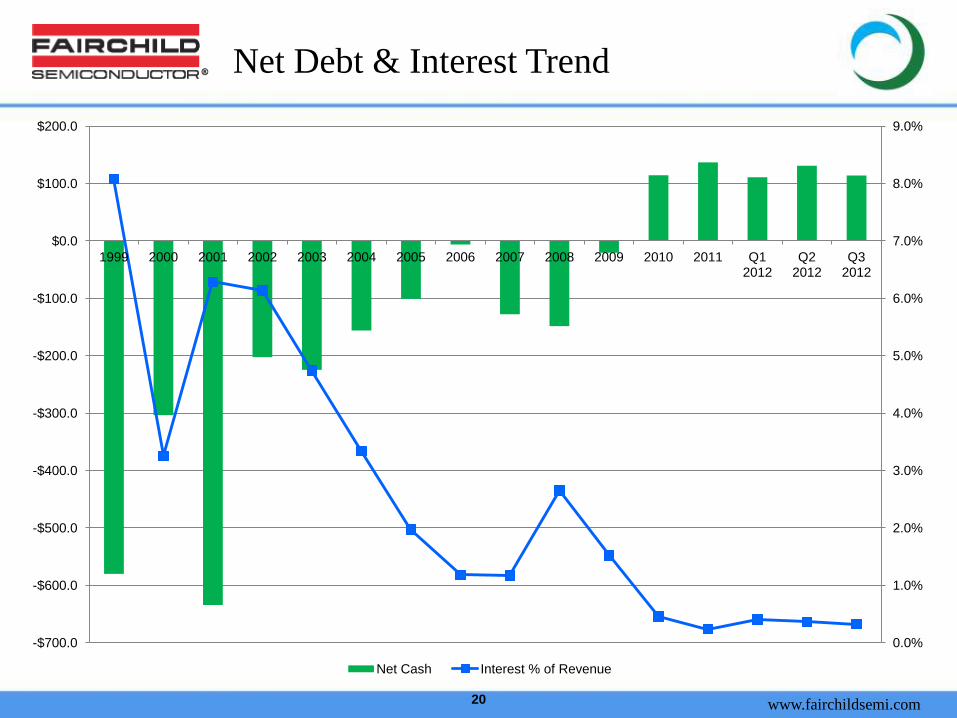
Net Debt & Interest Trend
0.0%
1.0%
2.0%
3.0%
4.0%
5.0%
6.0%
7.0%
8.0%
9.0%
-$700.0
-$600.0
-$500.0
-$400.0
-$300.0
-$200.0
-$100.0
$0.0
$100.0
$200.0
1999 2000 2001 2002 2003 2004 2005 2006 2007 2008 2009 2010 2011 Q1 2012
Q2 2012
Q3 2012
Net Cash Interest % of Revenue

www.fairchildsemi.com
21
Fairchild Semiconductor International, Inc.
UBS Global Technology Conference
November 14, 2012
Dan Janson Vice President of Investor Relations
Top Related