


Languages
Pages
Legal

Factbook Q3/9M 2016/2017 Page 1©HORNBACH Group 2016
HORNBACH Factbook3rd Quarter / 9 months 2016/2017

Factbook Q3/9M 2016/2017 Page 2©HORNBACH Group 2016
1877 Foundation
1968 1st DIY store withgarden center
1980 1st DIY megastore
1987 Going public HORNBACHHOLDING Group
1993 Going public HORNBACH-Baumarkt Subgroup
1996 Austria
1997 Netherlands
1998 Czech Republic
2001 „Zuckerhut“ Award
2002 Switzerland
2003 Sweden
2004 Slovakia
2004 Emission High Yield bond (6.125%)
2006 HORNBACH wins German„Handelspreis“
2007 Romania
2007 Lifetime Award for Otmar Hornbach
2008 Retailer of the Year in Germany
2010 Start of Multi-Channel Retailing
2013 Emission Eurobond (3.875%)
2015 Change in legal form of HORNBACHHolding AG into „KGaA“
HistoryHORNBACH Group

Factbook Q3/9M 2016/2017 Page 3©HORNBACH Group 2016
1 Number of shares: 16,000,000 / Stock market code: HBH2 Number of shares: 31,807,000 / Stock market code: HBM3 plus other subsidiary companies in Germany and abroad
cHORNBACH
Baustoff UnionGmbH3
Neustadt/Weinstraße
Not listed
HORNBACHImmobilien AG3
Bornheim
Not listed
HORNBACH Baumarkt AG³Bornheim
Listed Ordinary Shares²(ISIN DE0006084403)
76.4% 100%100%
Free FloatHORNBACH Familien
Treuhand GmbH
HORNBACHManagement AG
(General Partner)
Management
100%
HORNBACH Holding AG & Co. KGaANeustadt/Weinstraße
Listed Ordinary Shares1
(ISIN DE0006083405)
Free Float
23.6%
56.25% 43.75%
Shareholder StructureHORNBACH Group
sin
ce
Oc
tob
er
24
,2
01
5
Factbook Q3/9M 2016/2017 Page 4©HORNBACH Group 2016
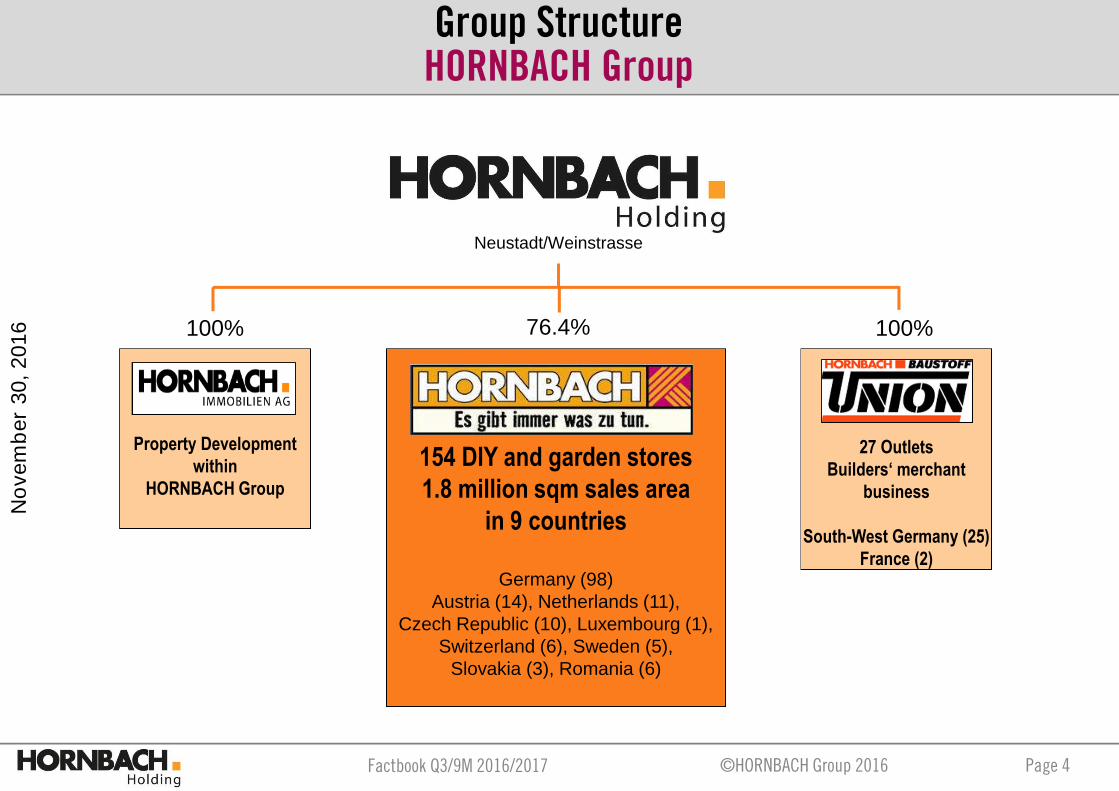
154 DIY and garden stores1.8 million sqm sales area
in 9 countries
Germany (98)Austria (14), Netherlands (11),
Czech Republic (10), Luxembourg (1),Switzerland (6), Sweden (5),
Slovakia (3), Romania (6)
100% 100%76.4%
Property Developmentwithin
HORNBACH Group
27 OutletsBuilders‘ merchant
business
South-West Germany (25)France (2)
Neustadt/Weinstrasse
Group StructureHORNBACH Group
No
ve
mb
er
30
,2
01
6
Factbook Q3/9M 2016/2017 Page 5©HORNBACH Group 2016
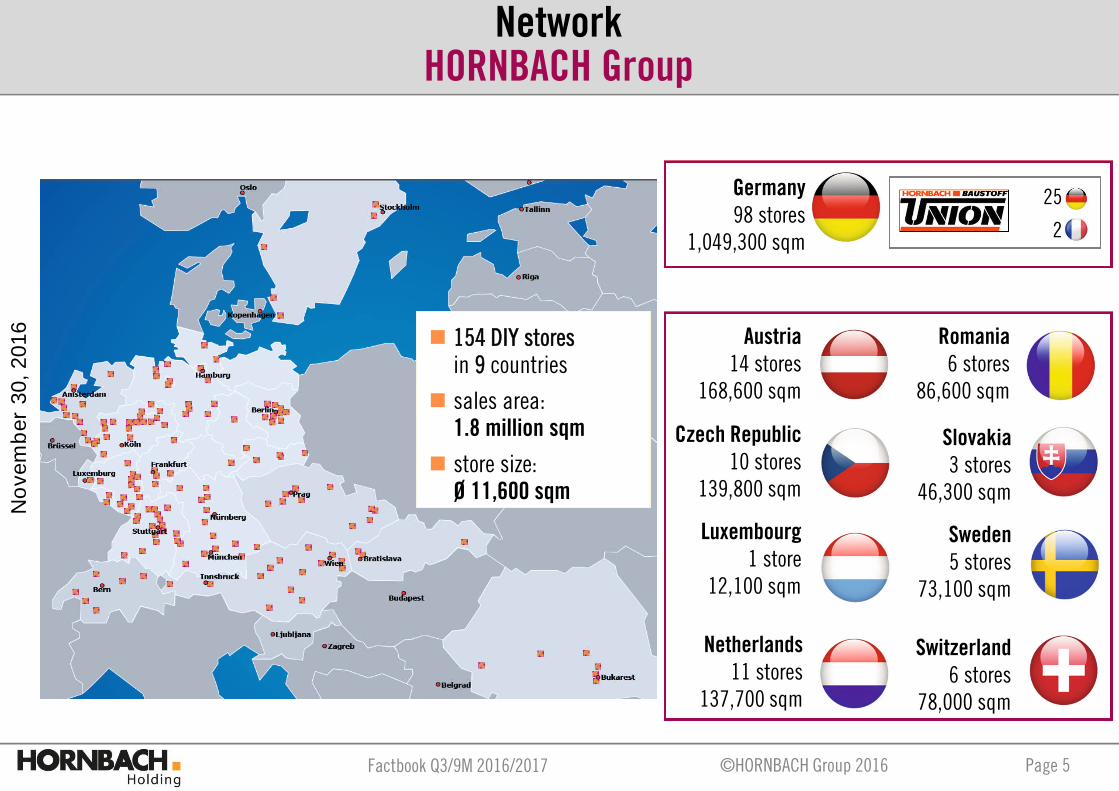
Germany98 stores
1,049,300 sqm
154 DIY storesin 9 countries
sales area:1.8 million sqm
store size:Ø 11,600 sqm
Netherlands11 stores
137,700 sqm
Luxembourg1 store
12,100 sqm
Switzerland6 stores
78,000 sqm
Austria14 stores
168,600 sqm
Sweden5 stores
73,100 sqm
Czech Republic10 stores
139,800 sqm
Slovakia3 stores
46,300 sqm
Romania6 stores
86,600 sqm
25 x
2 x
No
ve
mb
er
30
,2
01
6Network
HORNBACH Group
Factbook Q3/9M 2016/2017 Page 6©HORNBACH Group 2016
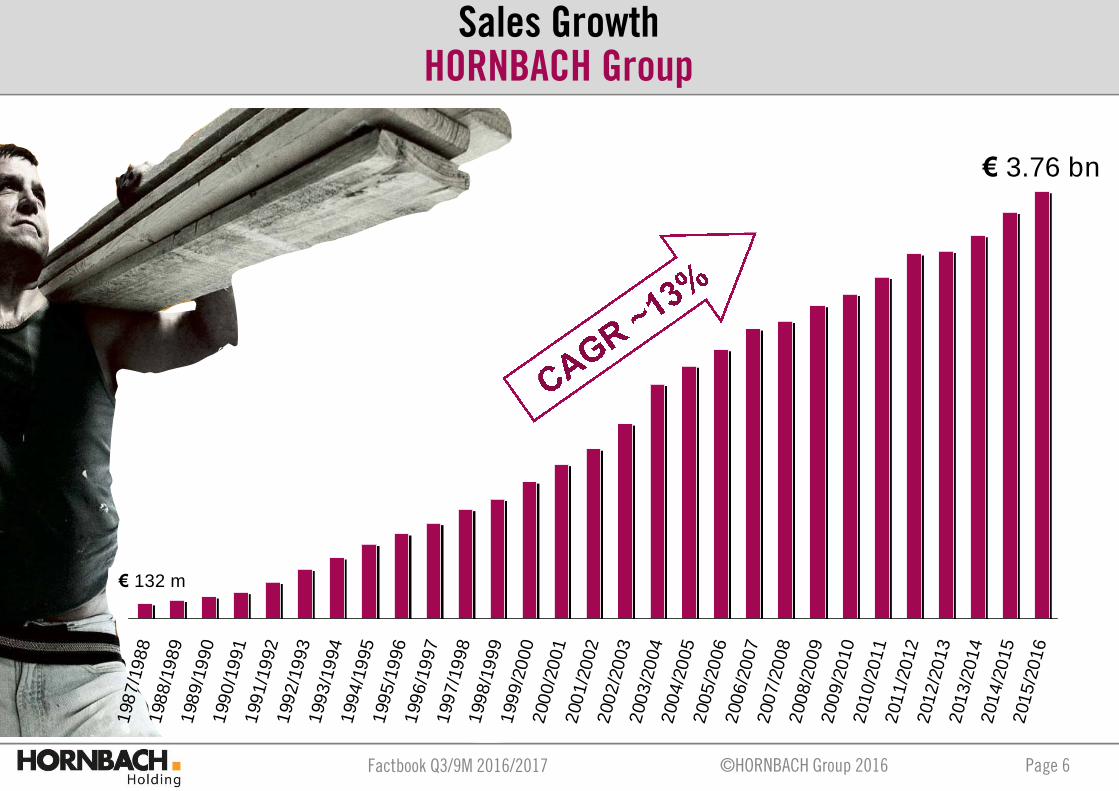
€ 3.76 bn
€ 132 m
198
7/1
988
198
8/1
989
198
9/1
990
199
0/1
991
199
1/1
992
199
2/1
993
199
3/1
994
199
4/1
995
199
5/1
996
199
6/1
997
199
7/1
998
199
8/1
999
199
9/2
000
200
0/2
001
200
1/2
002
200
2/2
003
200
3/2
004
200
4/2
005
200
5/2
006
200
6/2
007
200
7/2
008
200
8/2
009
200
9/2
010
201
0/2
011
201
1/2
012
201
2/2
013
201
3/2
014
201
4/2
015
201
5/2
016
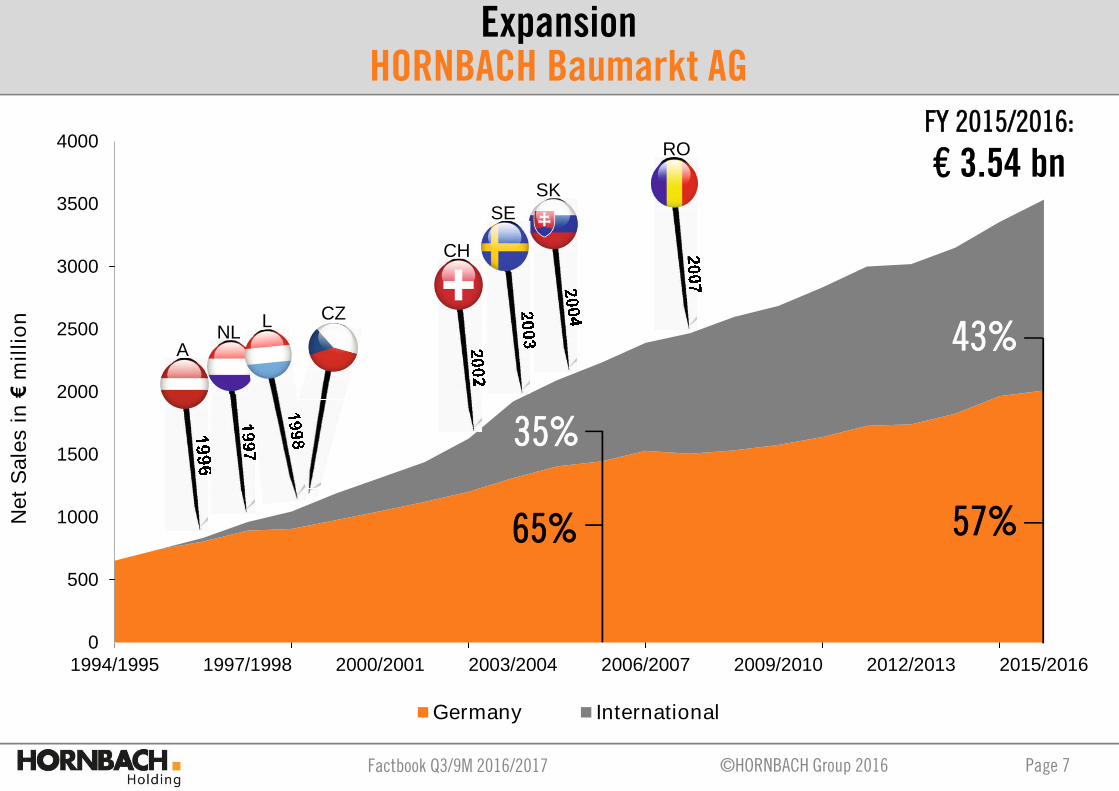
Sales GrowthHORNBACH Group
Factbook Q3/9M 2016/2017 Page 7©HORNBACH Group 2016
0
500
1000
1500
2000
2500
3000
3500
4000
1994/1995 1997/1998 2000/2001 2003/2004 2006/2007 2009/2010 2012/2013 2015/2016
Germany International
SK
ANL
CZ
CH
SE
RO
L
35%
65%
43%
57%
FY 2015/2016:
€ 3.54 bn
ExpansionHORNBACH Baumarkt AG
Ne
tS
ale
sin
€m
illi
on

Factbook Q3/9M 2016/2017 Page 8©HORNBACH Group 2016
JobmachineHORNBACH Group
6131,372
3,924
7,386
12,014
17,373
1987/1988 1995/1996 2000/2001 2005/2006 2015/2016
Factbook Q3/9M 2016/2017 Page 9©HORNBACH Group 2016
Market Position – Strategy – Growth Opportunities
Factbook Q3/9M 2016/2017 Page 10©HORNBACH Group 2016
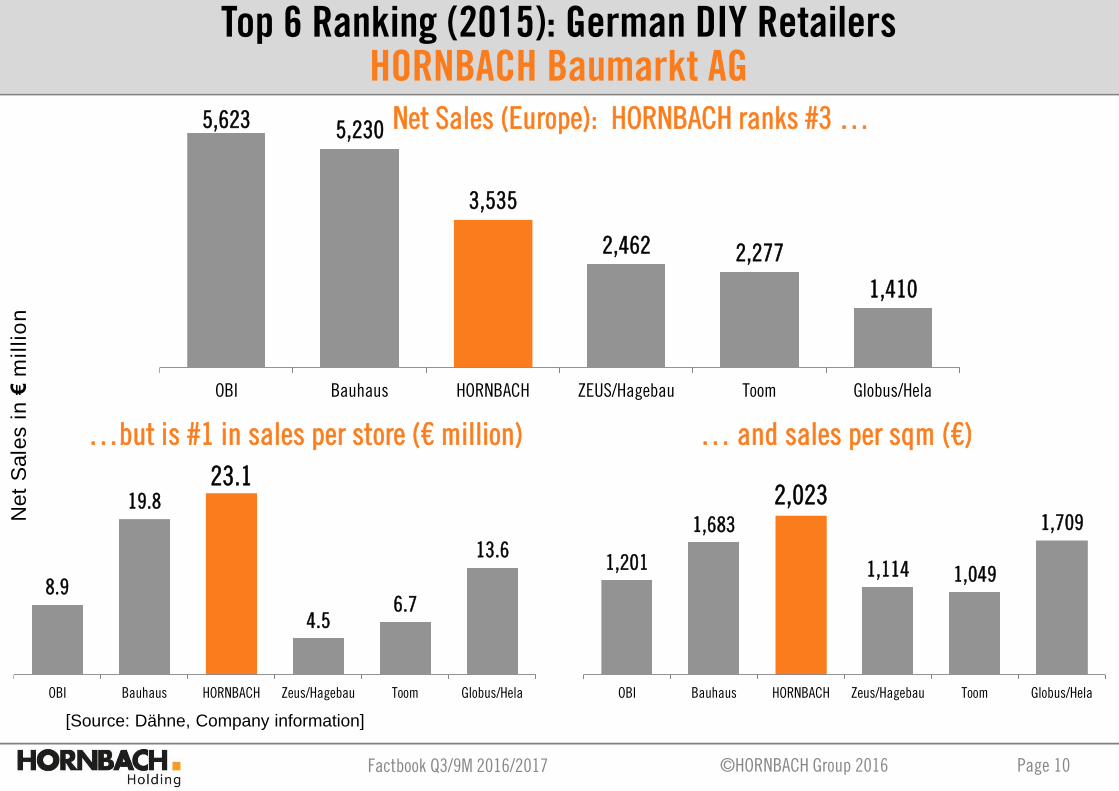
Net Sales (Europe): HORNBACH ranks #3 …
…but is #1 in sales per store (€ million) … and sales per sqm (€)
8.9
19.823.1
4.56.7
13.6
OBI Bauhaus HORNBACH Zeus/Hagebau Toom Globus/Hela
1,201
1,683
2,023
1,114 1,049
1,709
OBI Bauhaus HORNBACH Zeus/Hagebau Toom Globus/Hela
Ne
tS
ale
sin
€m
illi
on
Top 6 Ranking (2015): German DIY RetailersHORNBACH Baumarkt AG
[Source: Dähne, Company information]
5,623 5,230
3,535
2,462 2,277
1,410
OBI Bauhaus HORNBACH ZEUS/Hagebau Toom Globus/Hela
Factbook Q3/9M 2016/2017 Page 11©HORNBACH Group 2016
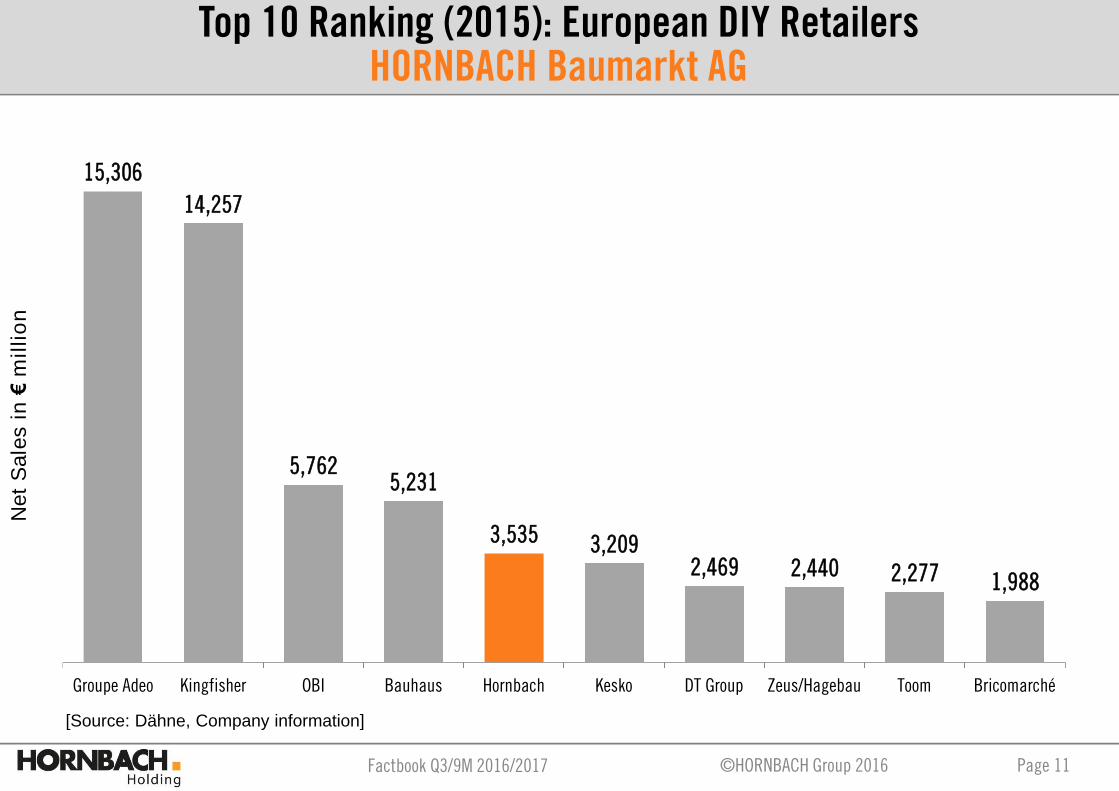
15,306
14,257
5,7625,231
3,535 3,2092,469 2,440 2,277 1,988
Groupe Adeo Kingfisher OBI Bauhaus Hornbach Kesko DT Group Zeus/Hagebau Toom Bricomarché
[Source: Dähne, Company information]
Top 10 Ranking (2015): European DIY RetailersHORNBACH Baumarkt AG
Ne
tS
ale
sin
€m
illi
on

Factbook Q3/9M 2016/2017 Page 12©HORNBACH Group 2016
0
2.000
4.000
6.000
8.000
10.000
12.000
14.000
750 1.000 1.250 1.500 1.750 2.000
avera
ge
sto
resiz
e(i
nsq
m)
Net Sales / sqm
OBI
Bauhaus
HORNBACH
Toom
Globus/Hela
Zeus/Hagebau
Eurobaustoff
EMV-Profi
Hellweg
Bubble size = total net sales (Europe)
[Source: Dähne, HORNBACH]
Megastore
Average store size, net sales and sales densities (2015):HORNBACH Baumarkt AG
Factbook Q3/9M 2016/2017 Page 13©HORNBACH Group 2016
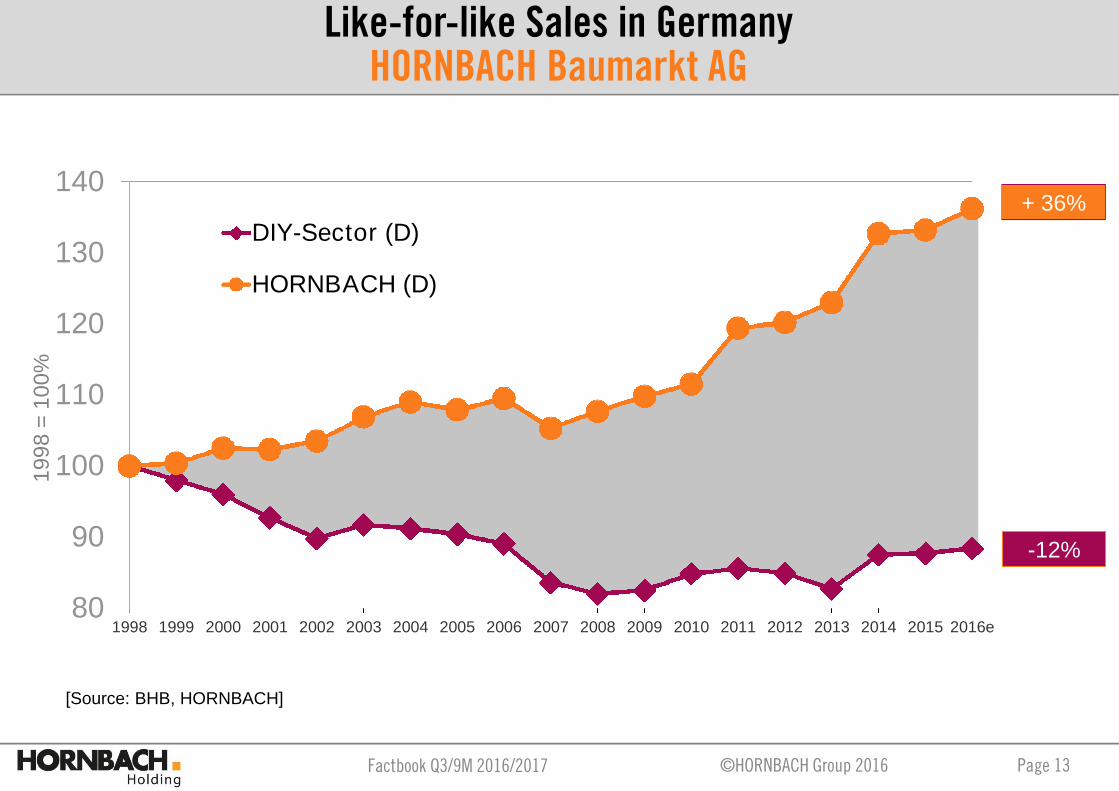
80
90
100
110
120
130
140
1998 1999 2000 2001 2002 2003 2004 2005 2006 2007 2008 2009 2010 2011 2012 2013 2014 2015 2016e
19
98
=1
00
%
DIY-Sector (D)
HORNBACH (D)
-12%
+ 36%
[Source: BHB, HORNBACH]
Like-for-like Sales in GermanyHORNBACH Baumarkt AG

Factbook Q3/9M 2016/2017 Page 14©HORNBACH Group 2016
[Source: BHB/GfK DIY-Panel (until 2013), GfK DIY-TSR (from 2014), HORNBACH]
4.9
7.1
8.5
10.0
11.0 11.1
1998 1999 2000 2001 2002 2003 2004 2005 2006 2007 2008 2009 2010 2011 2012 2013 2014 2015 2016e
Market Share (Germany)HORNBACH Baumarkt AG
in%
of
DIY
sto
res
ale
s
Factbook Q3/9M 2016/2017 Page 15©HORNBACH Group 2016
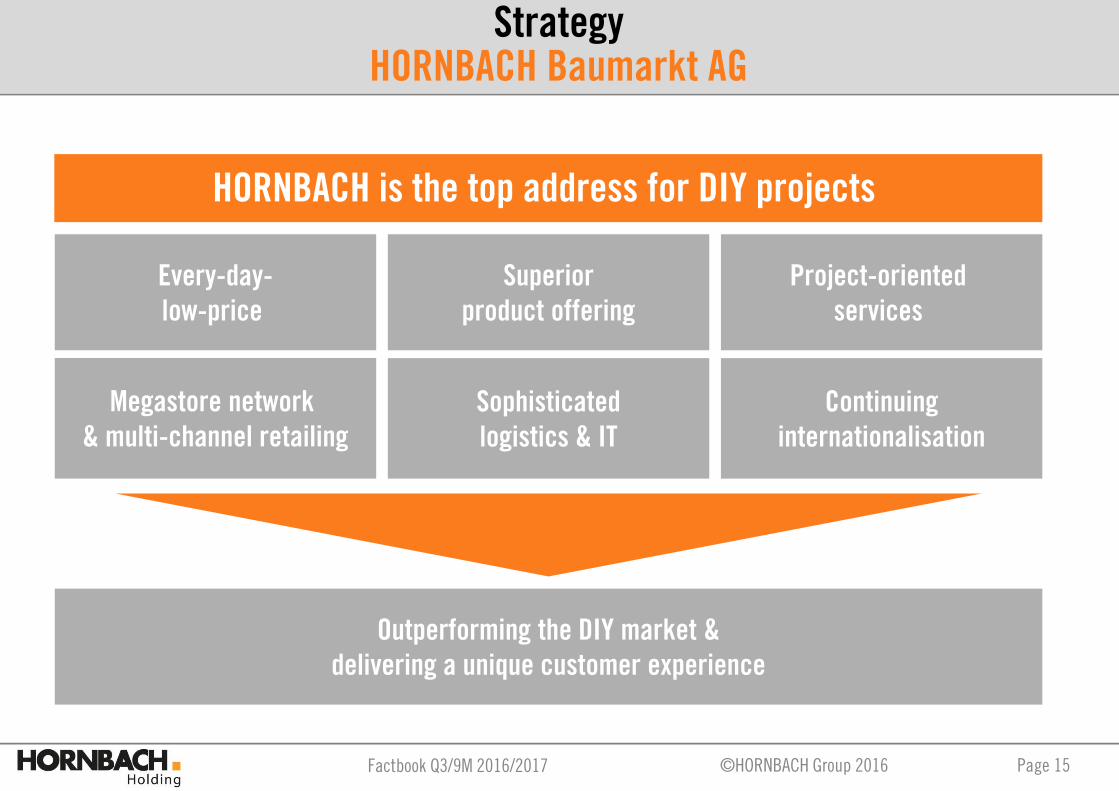
Megastore network& multi-channel retailing
Sophisticatedlogistics & IT
Continuinginternationalisation
Outperforming the DIY market &delivering a unique customer experience
Every-day-low-price
Project-orientedservices
Superiorproduct offering
HORNBACH is the top address for DIY projects
StrategyHORNBACH Baumarkt AG
Factbook Q3/9M 2016/2017 Page 16©HORNBACH Group 2016
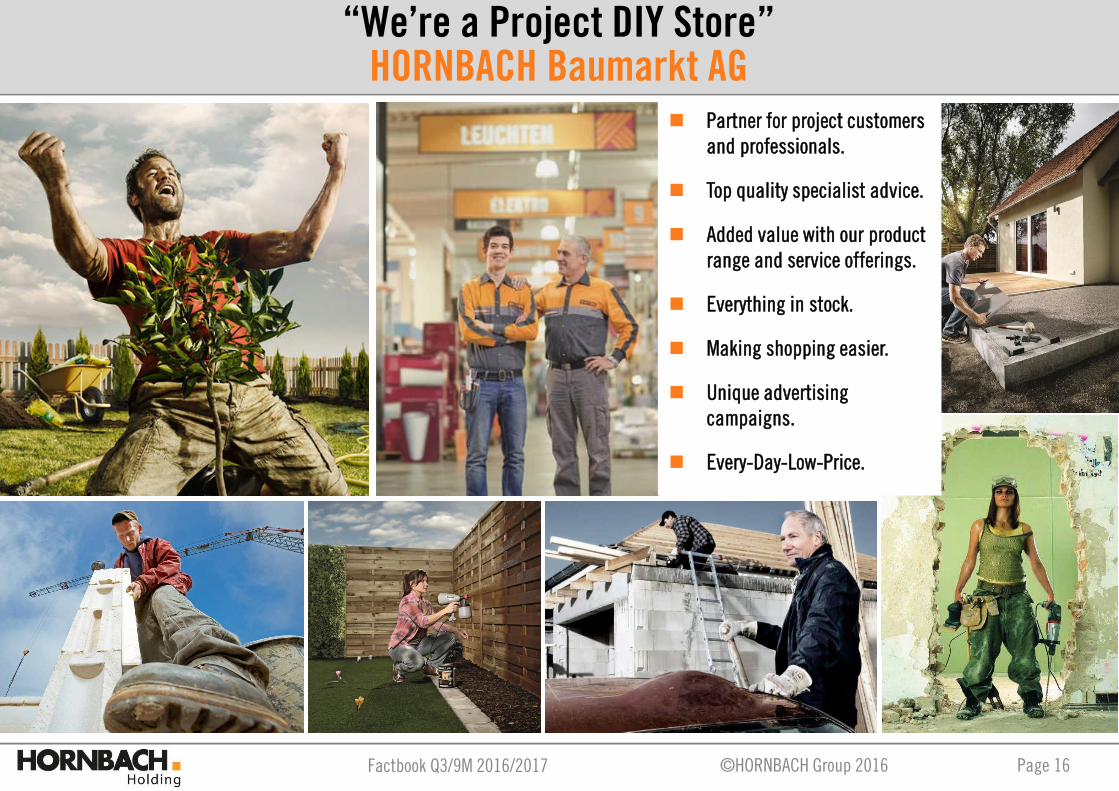
Partner for project customersand professionals.
Top quality specialist advice.
Added value with our productrange and service offerings.
Everything in stock.
Making shopping easier.
Unique advertisingcampaigns.
Every-Day-Low-Price.
“We’re a Project DIY Store”HORNBACH Baumarkt AG

Factbook Q3/9M 2016/2017 Page 17©HORNBACH Group 2016
Customers across Europe honor HORNBACH‘s conceptHORNBACH Baumarkt AG
Factbook Q3/9M 2016/2017 Page 18©HORNBACH Group 2016
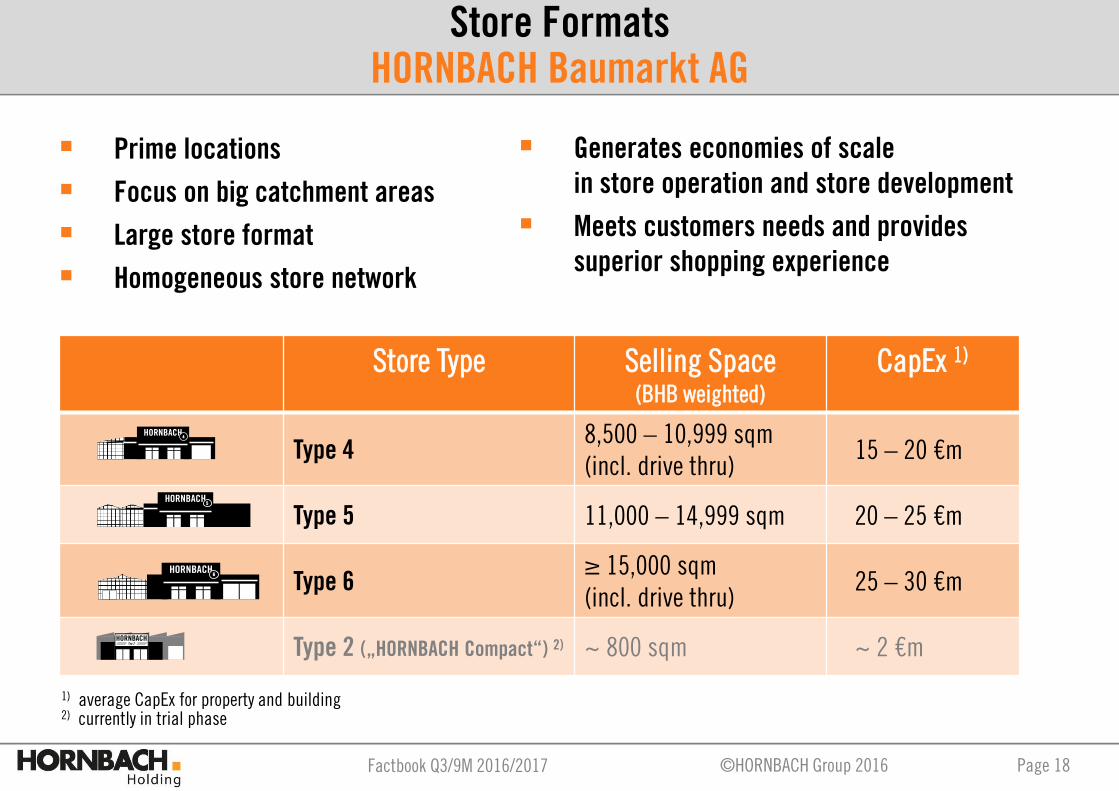
Prime locations
Focus on big catchment areas
Large store format
Homogeneous store network
Generates economies of scalein store operation and store development
Meets customers needs and providessuperior shopping experience
Store Type Selling Space(BHB weighted)
CapEx 1)
Type 48,500 – 10,999 sqm(incl. drive thru)
15 – 20 €m
Type 5 11,000 – 14,999 sqm 20 – 25 €m
Type 6≥ 15,000 sqm(incl. drive thru)
25 – 30 €m
Type 2 („HORNBACH Compact“) 2) ~ 800 sqm ~ 2 €m
1) average CapEx for property and building2) currently in trial phase
HORNBACH4
HORNBACH5
HORNBACH6
HORNBACHTyp 2
Store FormatsHORNBACH Baumarkt AG
Factbook Q3/9M 2016/2017 Page 19©HORNBACH Group 2016
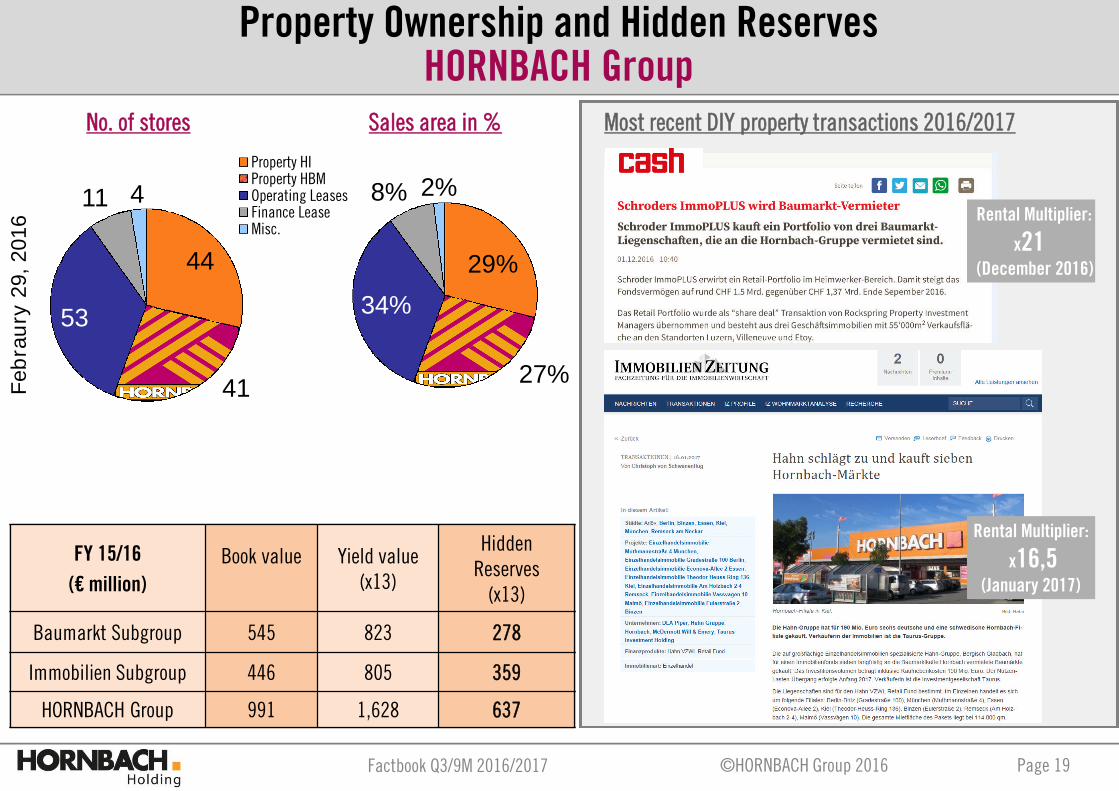
44
41
53
11 4
Property HIProperty HBMOperating LeasesFinance LeaseMisc.
FY 15/16
(€ million)
Book value Yield value(x13)
HiddenReserves
(x13)
Baumarkt Subgroup 545 823 278
Immobilien Subgroup 446 805 359
HORNBACH Group 991 1,628 637
Sales area in %No. of stores
Fe
bra
ury
29
,2
01
6Property Ownership and Hidden Reserves
HORNBACH Group
29%
27%
34%
8% 2%
Most recent DIY property transactions 2016/2017
Rental Multiplier:
x21(December 2016)
Rental Multiplier:
x16,5(January 2017)
Factbook Q3/9M 2016/2017 Page 20©HORNBACH Group 2016
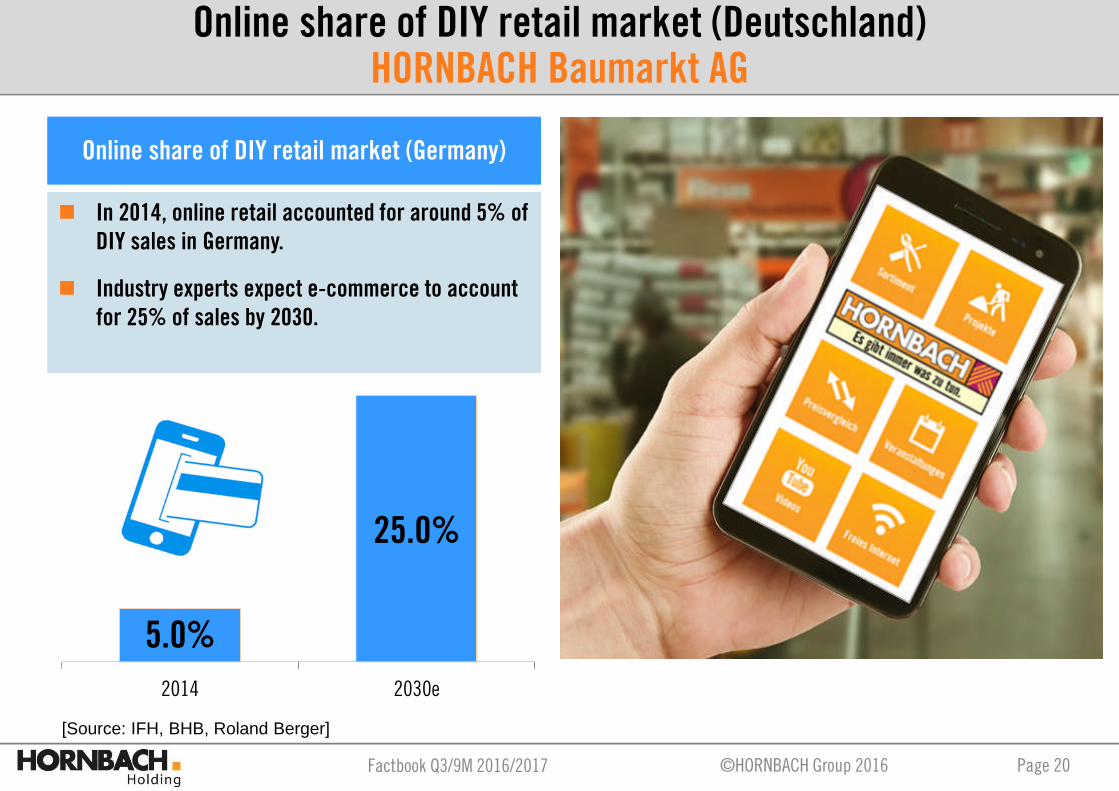
5.0%
25.0%
2014 2030e
In 2014, online retail accounted for around 5% ofDIY sales in Germany.
Industry experts expect e-commerce to accountfor 25% of sales by 2030.
Online share of DIY retail market (Germany)
[Source: IFH, BHB, Roland Berger]
Online share of DIY retail market (Deutschland)HORNBACH Baumarkt AG
Factbook Q3/9M 2016/2017 Page 21©HORNBACH Group 2016
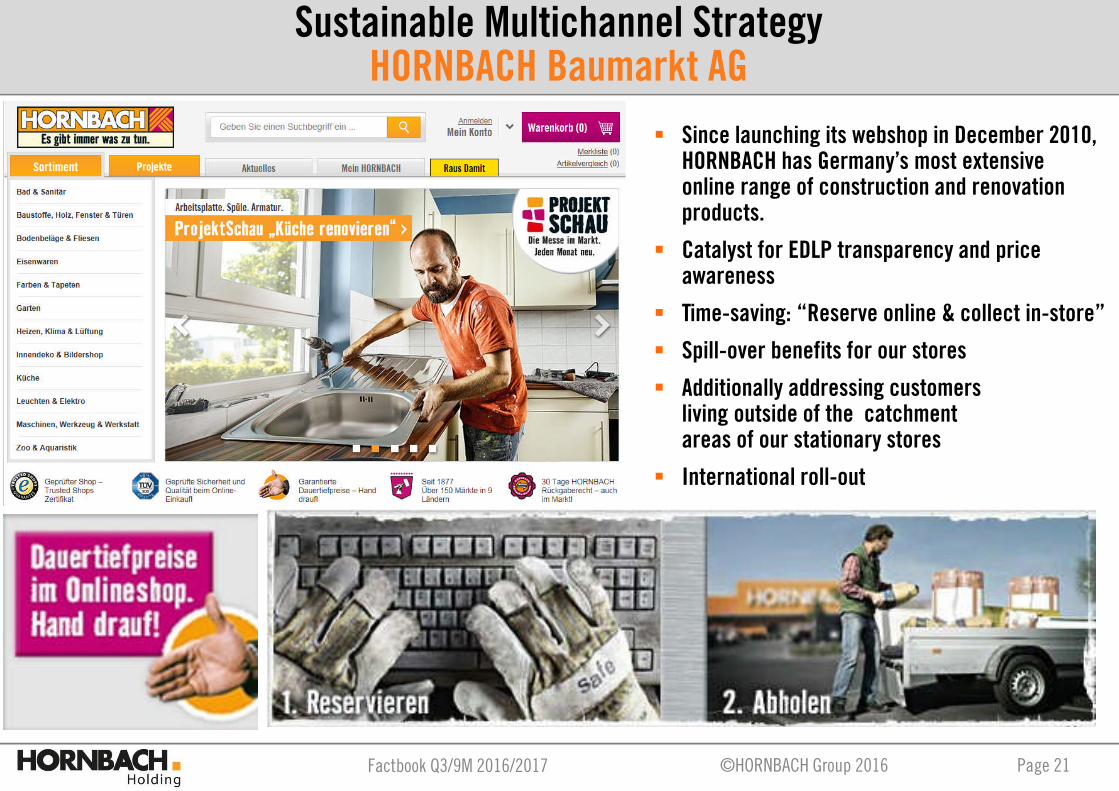
Since launching its webshop in December 2010,HORNBACH has Germany’s most extensiveonline range of construction and renovationproducts.
Catalyst for EDLP transparency and priceawareness
Time-saving: “Reserve online & collect in-store”
Spill-over benefits for our stores
Additionally addressing customersliving outside of the catchmentareas of our stationary stores
International roll-out
Sustainable Multichannel StrategyHORNBACH Baumarkt AG

Factbook Q3/9M 2016/2017 Page 22©HORNBACH Group 2016
Advantages of stationary retail Advantages of online retail
Going Live Road-MapHORNBACH Baumarkt AG
Country Start of Online Shop Number of SKUs(November 2016)
Germany December 2010 127,000
Austria January 2013 98,000
Switzerland November 2014 86,000
Netherlands March 2015 47,000
Czech Republic December 2015 23,000
Luxembourg December 2015 87,000
Romania / Slovakia / Sweden scheduled for 2017/2018

Factbook Q3/9M 2016/2017 Page 23©HORNBACH Group 2016
Elaborated Supply Chain ManagementEnsures Europe-wide Logistics (B2B)
Sophisticated merchandise managementin conjunction with our homogeneousstore network
Our logistics system combinesdirect supplies to stores andindirect deliveries via logistics centers
Enhanced import possibilities
Group-wide integrated IT andmerchandise systems
Factbook Q3/9M 2016/2017 Page 24©HORNBACH Group 2016
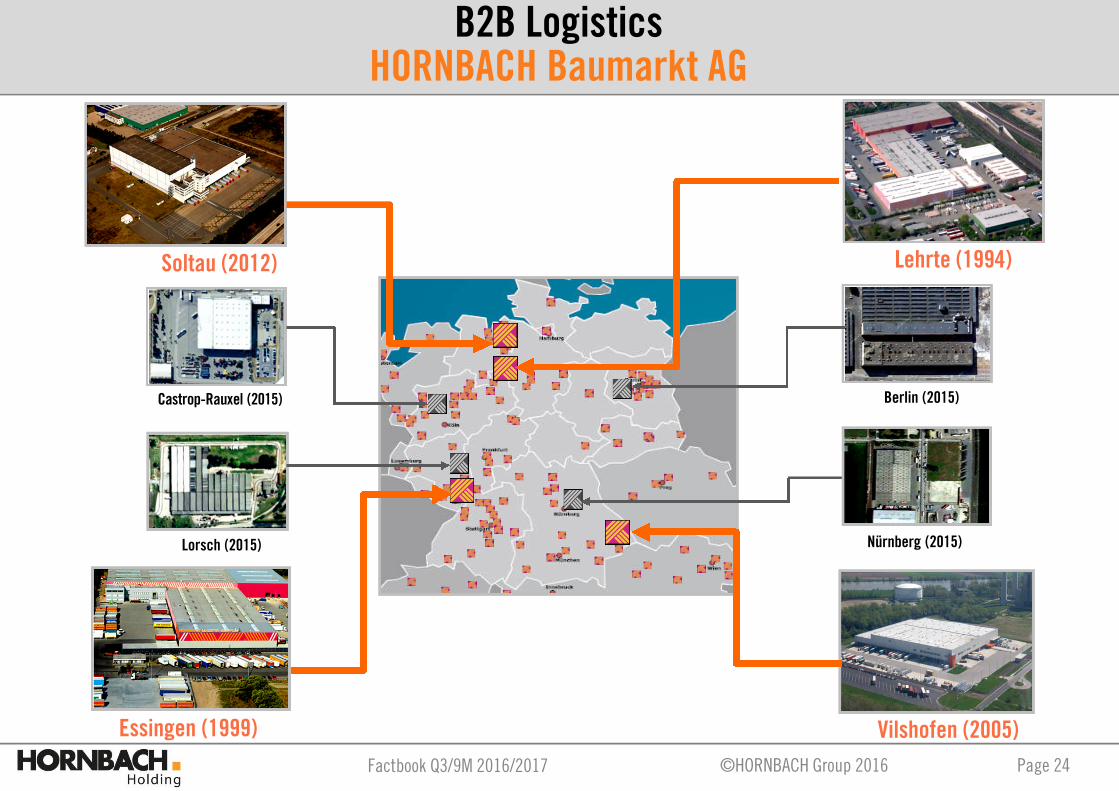
Nürnberg (2015)
Castrop-Rauxel (2015) Berlin (2015)
Soltau (2012) Lehrte (1994)
Essingen (1999)
Lorsch (2015)
Vilshofen (2005)
B2B LogisticsHORNBACH Baumarkt AG
Factbook Q3/9M 2016/2017 Page 25©HORNBACH Group 2016
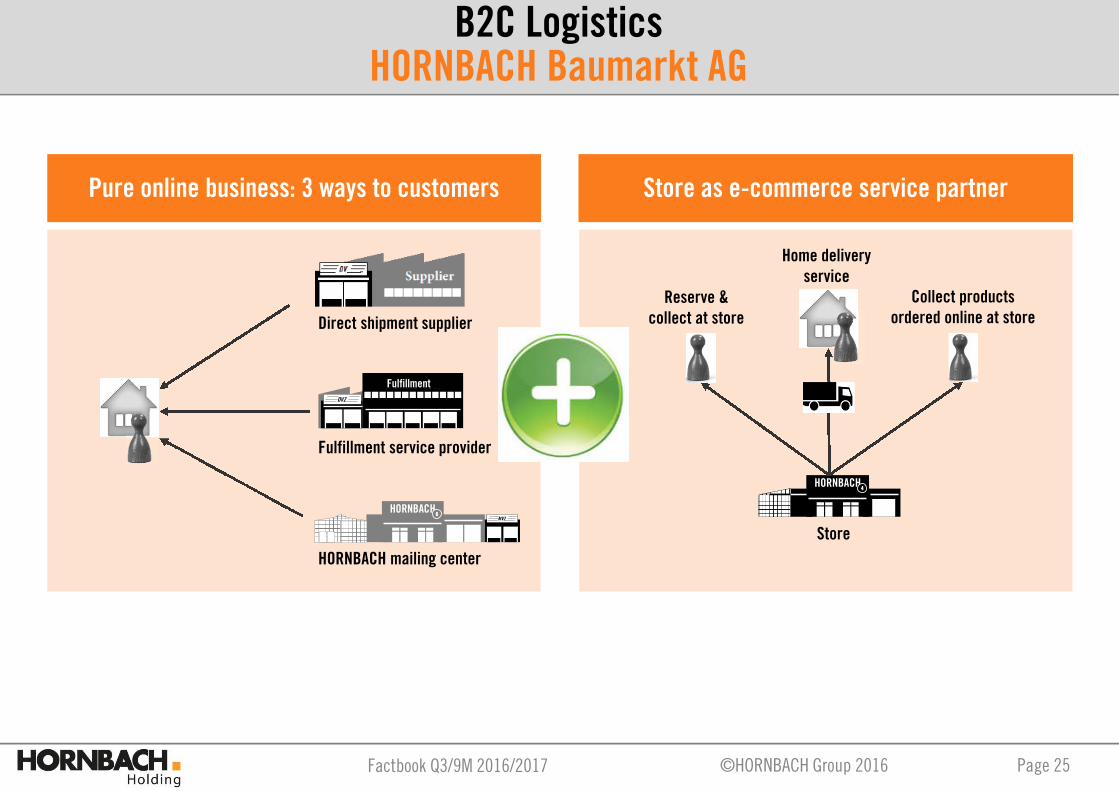
HORNBACHDVZ
Fulfillment
HORNBACH6
MVZ
Fulfillment service provider
HORNBACH mailing center
Direct shipment supplier
HORNBACH4
Store
Home deliveryservice
Reserve &collect at store
Collect productsordered online at store
Pure online business: 3 ways to customers Store as e-commerce service partner
B2C LogisticsHORNBACH Baumarkt AG
Factbook Q3/9M 2016/2017 Page 26©HORNBACH Group 2016
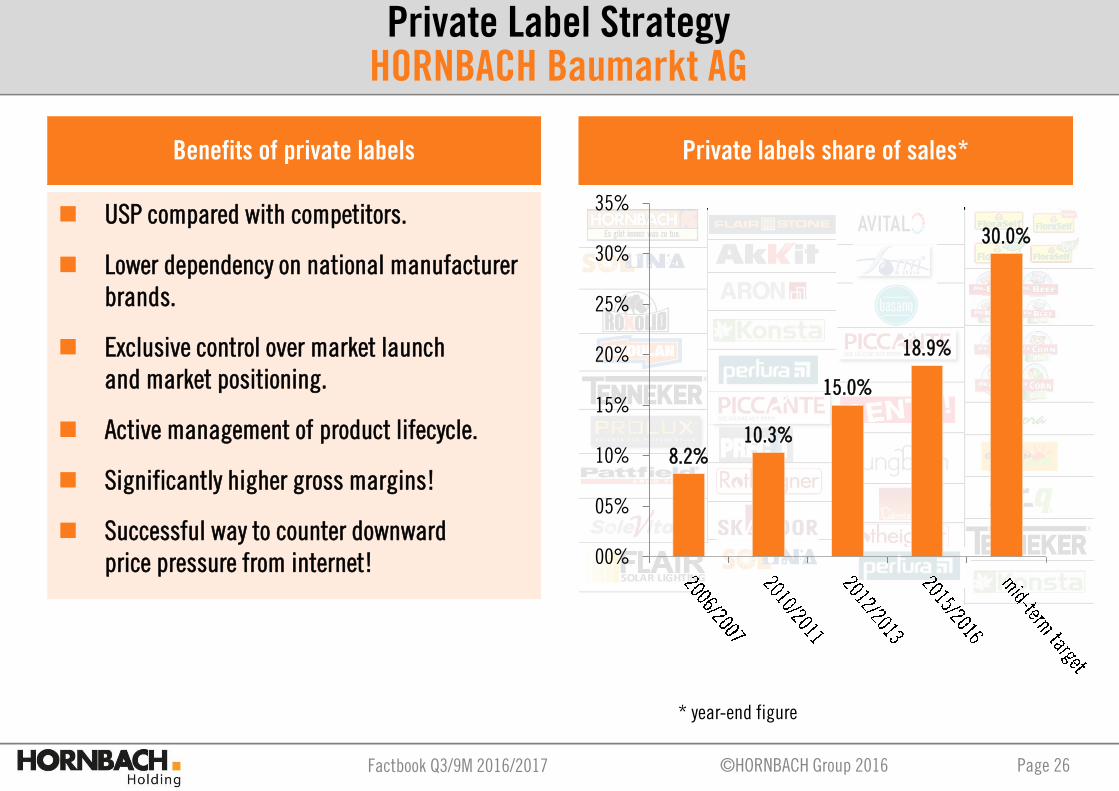
* year-end figure
USP compared with competitors.
Lower dependency on national manufacturerbrands.
Exclusive control over market launchand market positioning.
Active management of product lifecycle.
Significantly higher gross margins!
Successful way to counter downwardprice pressure from internet!
Benefits of private labels
8.2%10.3%
15.0%
18.9%
30.0%
00%
05%
10%
15%
20%
25%
30%
35%
Private labels share of sales*
Private Label StrategyHORNBACH Baumarkt AG

Factbook Q3/9M 2016/2017 Page 27©HORNBACH Group 2016
Cocooning(retreat-to-home lifestyle trend)
New target groups(„women-at-work“, Do-it-for-me, seniors)
Increasing needfor renovation
(80% of houses/flats > 20 years)
Sustainability andenergy efficiency
International expansion
Strong private labels
Multichannel retailing
•Insulation of facades•Replacement of outdated boilers•Use of rainwater•FSC timber products
Growth DriversHORNBACH Group
Factbook Q3/9M 2016/2017 Page 28©HORNBACH Group 2016
Financial Year 2015/2016
Factbook Q3/9M 2016/2017 Page 29©HORNBACH Group 2016
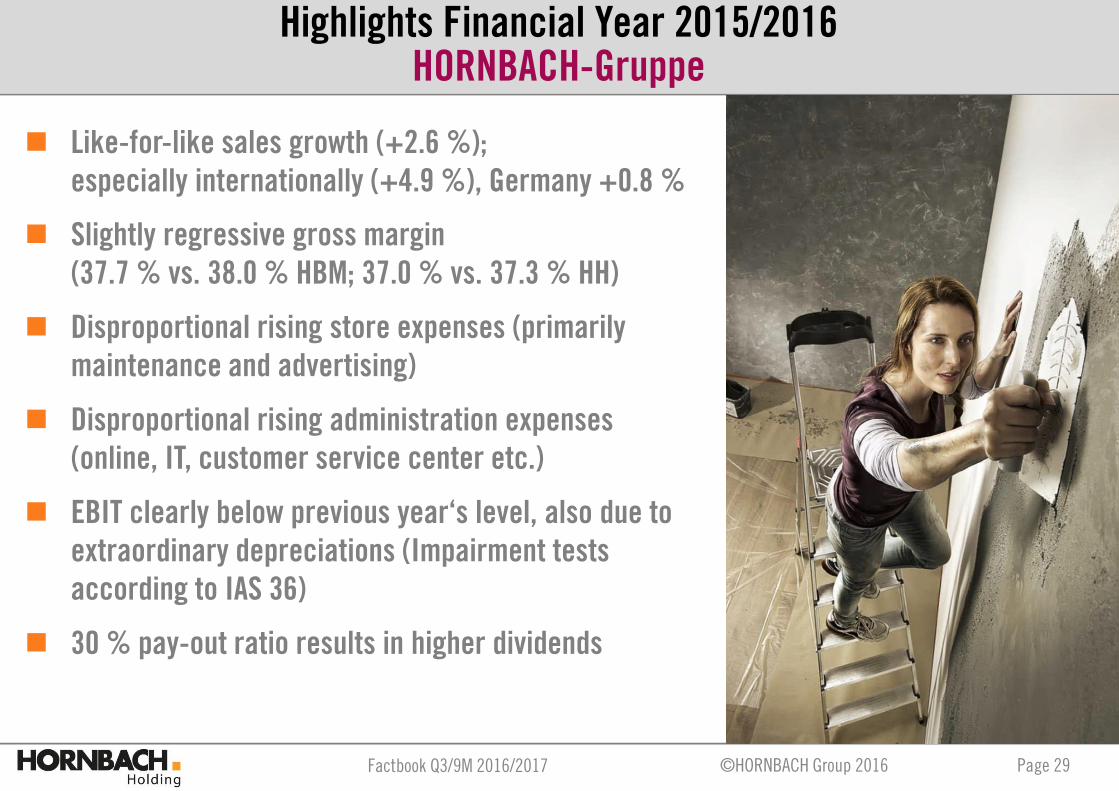
Like-for-like sales growth (+2.6 %);especially internationally (+4.9 %), Germany +0.8 %
Slightly regressive gross margin(37.7 % vs. 38.0 % HBM; 37.0 % vs. 37.3 % HH)
Disproportional rising store expenses (primarilymaintenance and advertising)
Disproportional rising administration expenses(online, IT, customer service center etc.)
EBIT clearly below previous year‘s level, also due toextraordinary depreciations (Impairment testsaccording to IAS 36)
30 % pay-out ratio results in higher dividends
Highlights Financial Year 2015/2016HORNBACH-Gruppe
Factbook Q3/9M 2016/2017 Page 30©HORNBACH Group 2016
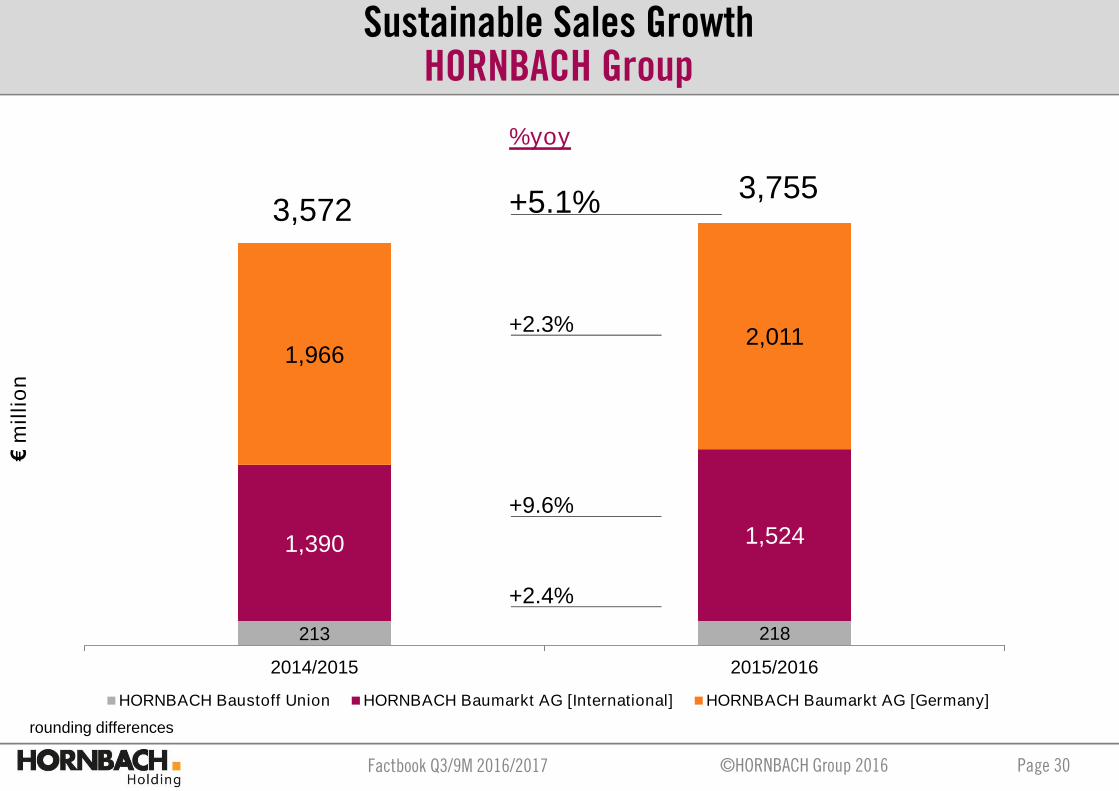
213 218
1,390 1,524
1,9662,011
2014/2015 2015/2016
HORNBACH Baustoff Union HORNBACH Baumarkt AG [International] HORNBACH Baumarkt AG [Germany]
rounding differences
%yoy
+5.1%3,5723,755
+9.6%
+2.3%
+2.4%
Sustainable Sales GrowthHORNBACH Group
€m
illi
on
Factbook Q3/9M 2016/2017 Page 31©HORNBACH Group 2016
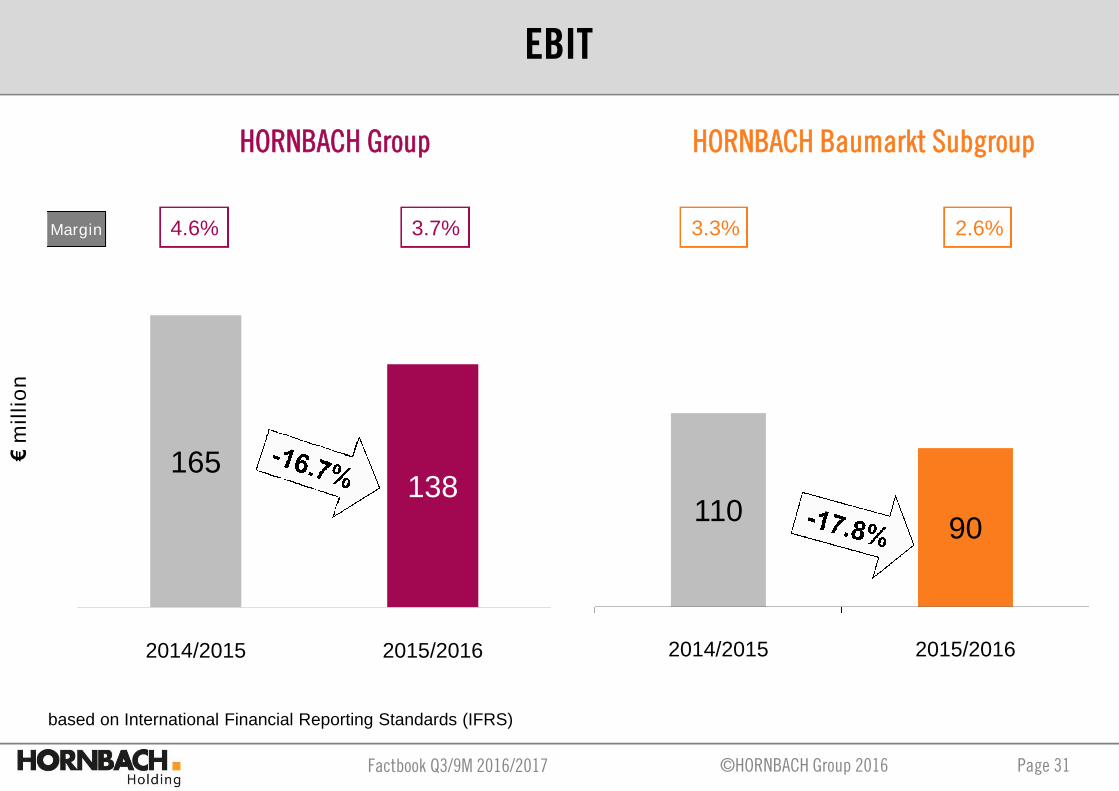
Margin 4.6% 3.3%3.7% 2.6%
HORNBACH Group HORNBACH Baumarkt Subgroup
based on International Financial Reporting Standards (IFRS)
165138
2014/2015 2015/2016
11090
2014/2015 2015/2016
EBIT€
mil
lio
n

Factbook Q3/9M 2016/2017 Page 32©HORNBACH Group 2016
Margin 3.0% 2.1%2.6% 2.0%
HORNBACH Group HORNBACH Baumarkt Subgroup
107 98
2014/2015 2015/2016
70 72
2014/2015 2015/2016
Group Net Income€
mil
lio
n
Factbook Q3/9M 2016/2017 Page 33©HORNBACH Group 2016
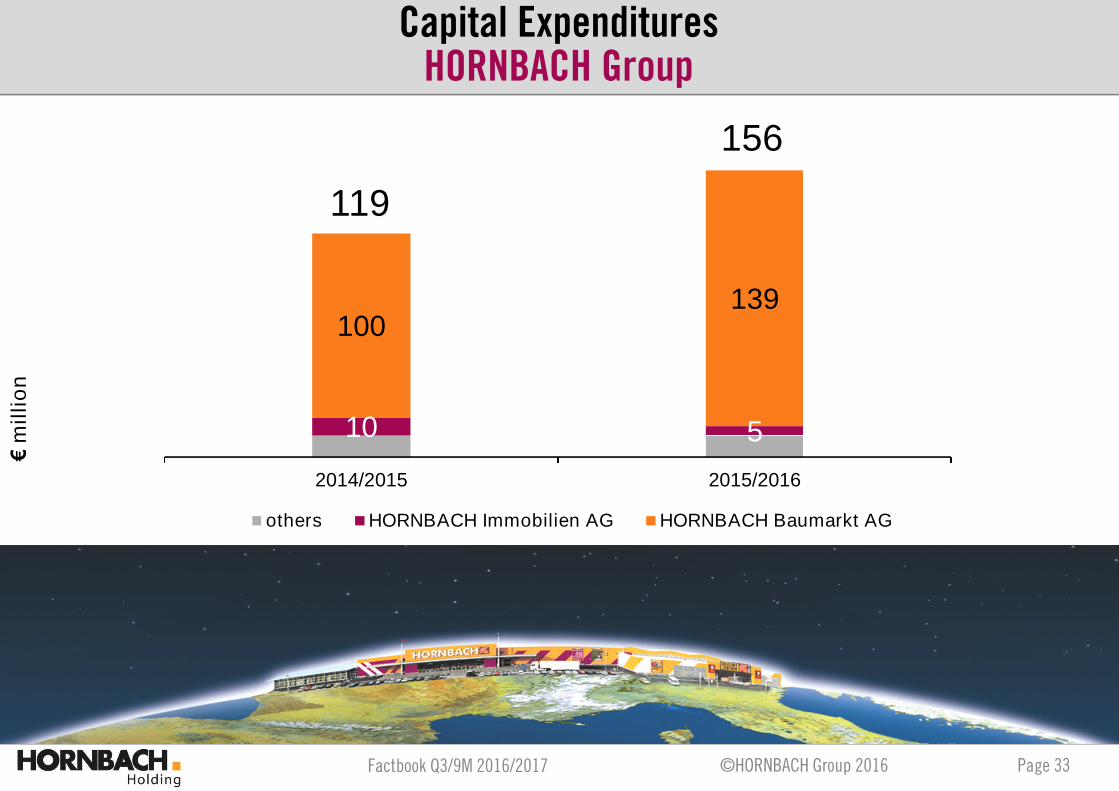
10 5
100139
2014/2015 2015/2016
others HORNBACH Immobilien AG HORNBACH Baumarkt AG
Olomouc
119
156
€m
illi
onCapital Expenditures
HORNBACH Group
Factbook Q3/9M 2016/2017 Page 34©HORNBACH Group 2016
3rd Quarter / 9 months 2016/2017

Factbook Q3/9M 2016/2017 Page 35©HORNBACH Group 2016
DIY store openings in Prag, Innsbruck, closing Mannheim -new HBU branch
Group sales up 5.9% to approx. 3.2€bn
Like-for-like sales growth (DIY) of 4.0%
Germany +2.4%
Other European countries +6.1%
Earnings figures to exceed previous year‘s level in nine-month period
Gross margin -60 bp to 36.3%
Store expense ratio decreased (-50 bp to 26.0%)
Pre-opening expenses significantly down on previous year (ratio -20 bp auf 0,1%)
Higher administration expense ratio due to ICR (+10 bp auf 4.6%)
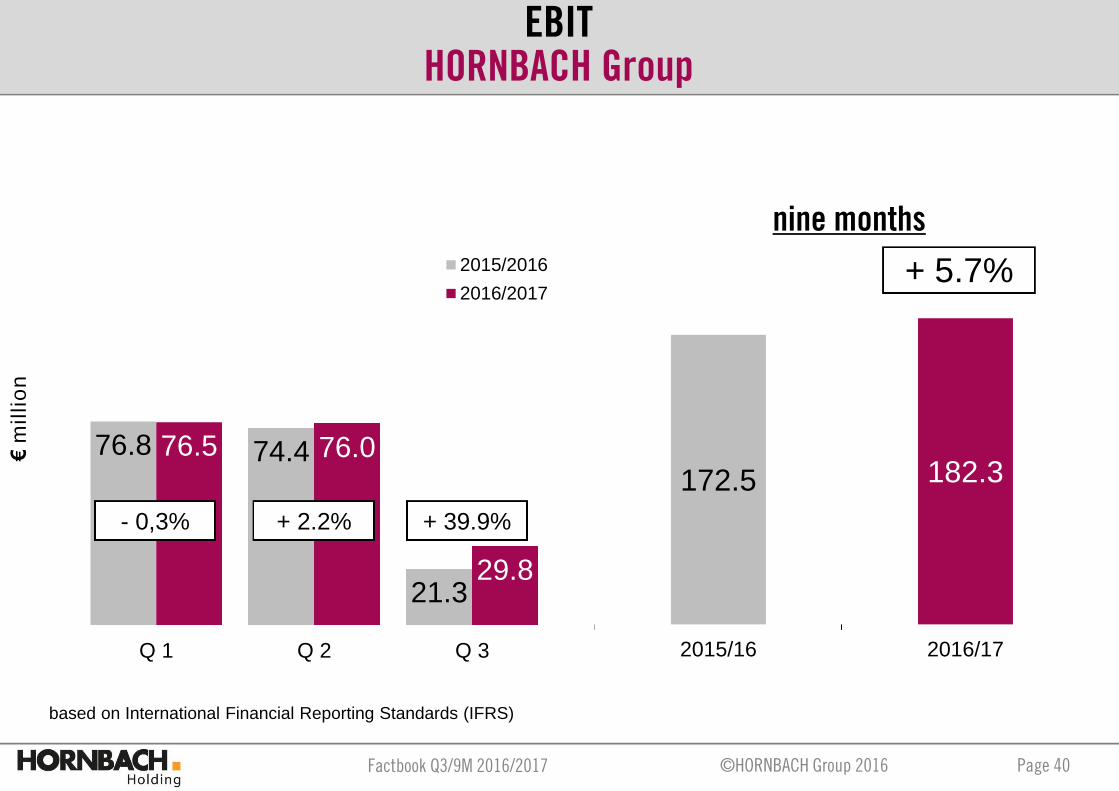
EBIT cumulatively +5.7% to 182.3 Mio.
Swap of operating leases into finance leases reflects a positive EBITeffect, but higher interest expenses
Negative currency items (YoY chg. -4.4€m)
EPS after 9M at 6,06 € (previous year: 5,94 €)
Highlights 9 months 2016/2017HORNBACH Group

Factbook Q3/9M 2016/2017 Page 36©HORNBACH Group 2016
178 180 180 182 191
1,033 1,058 1,1091,200
1,331
1,395 1,4431,561
1,5971,633
2012/13 2013/14 2014/15 2015/16 2016/17
HORNBACH Baustoff Union HORNBACH Baumarkt AG [International] HORNBACH Baumarkt AG Germany]
+10.9%
+2.3%
+5.9%
+4.6%
Growth in net sales– nine monthsHORNBACH Group
2,607 2,6822,851 2,980
3,155
[rounding differences]
€m
illi
on

Factbook Q3/9M 2016/2017 Page 37©HORNBACH Group 2016
1,052.11,002.5
925.6
1,116.1 1,070.5968.7
Q 1 Q 2 Q 3
2015/16
2016/17
995.2938.2
863.0
1,058.91,003.6
900.9
Q 1 Q 2 Q 3
56.463.9 62.2
56.866.5 67.4
Q 1 Q 2 Q 3
HORNBACH Holding Group
HORNBACH Baumarkt Subgroup HORNBACH Baustoff Union Subgroup
+ 6.8%+ 6.1% + 4.7%
+ 7.0%+ 6.4% + 4.4% + 4.1%+ 0.8% + 8.4%
Growth in Net Sales – Q1 / Q2 / Q3HORNBACH Group
€m
illi
on
Factbook Q3/9M 2016/2017 Page 38©HORNBACH Group 2016
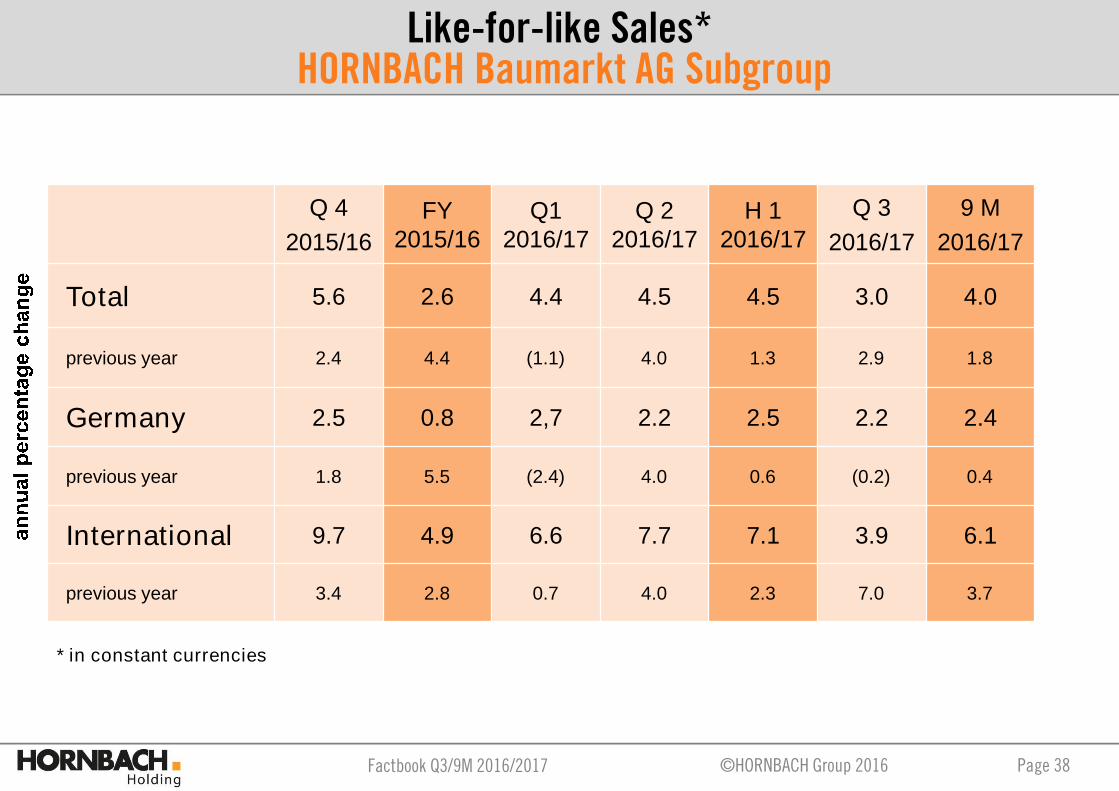
Q 4
2015/16
FY2015/16
Q12016/17
Q 22016/17
H 12016/17
Q 3
2016/17
9 M
2016/17
Total 5.6 2.6 4.4 4.5 4.5 3.0 4.0
previous year 2.4 4.4 (1.1) 4.0 1.3 2.9 1.8
Germany 2.5 0.8 2,7 2.2 2.5 2.2 2.4
previous year 1.8 5.5 (2.4) 4.0 0.6 (0.2) 0.4
International 9.7 4.9 6.6 7.7 7.1 3.9 6.1
previous year 3.4 2.8 0.7 4.0 2.3 7.0 3.7
Like-for-like Sales*HORNBACH Baumarkt AG Subgroup
* in constant currencies

Factbook Q3/9M 2016/2017 Page 39©HORNBACH Group 2016
36.5 36.4
37.236.9
36.3
37.3 37.2
37.937.6
37.0
2012/13 2013/14 2014/15 2015/16 2016/17
HORNBACH Holding Group HORNBACH Baumarkt Subgroup
Gross Margin– nine monthsHORNBACH Group
In%
of
ne
ts
ale
s
Factbook Q3/9M 2016/2017 Page 40©HORNBACH Group 2016
172.5 182.3
2015/16 2016/17
76.8 74.4
21.3
76.5 76.0
29.8
Q 1 Q 2 Q 3
2015/2016
2016/2017
nine months
+ 5.7%
- 0,3% + 2.2% + 39.9%
EBITHORNBACH Group
€m
illi
on
based on International Financial Reporting Standards (IFRS)
Factbook Q3/9M 2016/2017 Page 41©HORNBACH Group 2016
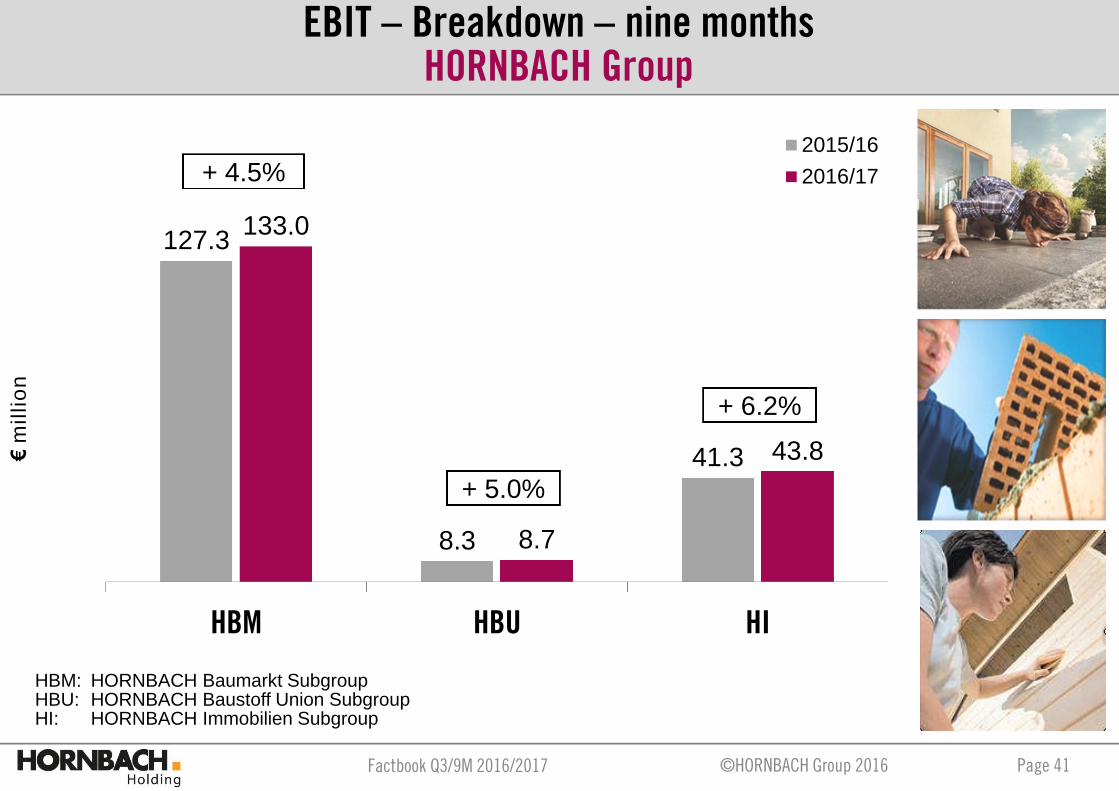
127.3
8.3
41.3
133.0
8.7
43.8
HBM HBU HI
2015/16
2016/17
+ 5.0%
+ 4.5%
+ 6.2%
EBIT – Breakdown – nine monthsHORNBACH Group
HBM: HORNBACH Baumarkt SubgroupHBU: HORNBACH Baustoff Union SubgroupHI: HORNBACH Immobilien Subgroup
€m
illi
on
Factbook Q3/9M 2016/2017 Page 42©HORNBACH Group 2016
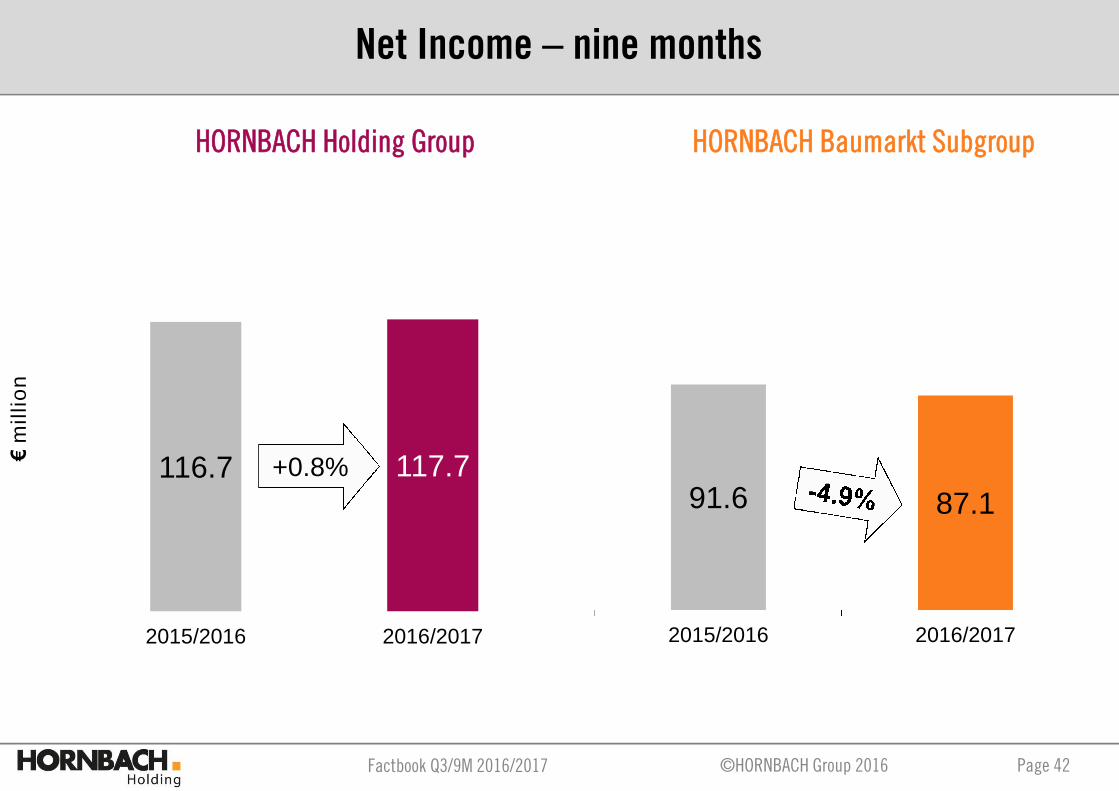
91.6 87.1
2015/2016 2016/2017
116.7 117.7
2015/2016 2016/2017
+0.8%
HORNBACH Holding Group HORNBACH Baumarkt Subgroup
Net Income – nine months€
mil
lio
n

Factbook Q3/9M 2016/2017 Page 43©HORNBACH Group 2016
5.21 5.38
6.15 5.94 6.06
2.58 2.512.90 2.88 2.74
2012/13 2013/14 2014/15 2015/16 2016/17
HORNBACH Holding Group* HORNBACH Baumarkt Subgroup
Earnings per Share – nine monthsHORNBACH Group
*until FY 2014/2015 averageearnings per share
Factbook Q3/9M 2016/2017 Page 44©HORNBACH Group 2016
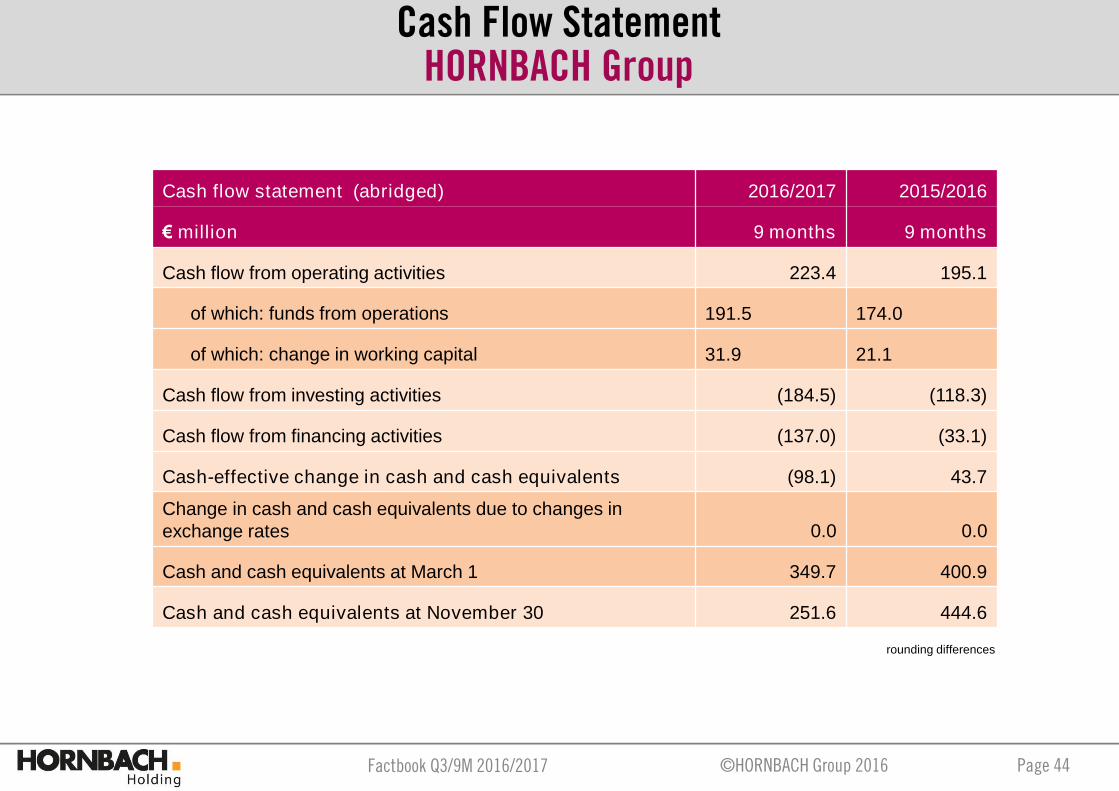
Cash flow statement (abridged) 2016/2017 2015/2016
€ million 9 months 9 months
Cash flow from operating activities 223.4 195.1
of which: funds from operations 191.5 174.0
of which: change in working capital 31.9 21.1
Cash flow from investing activities (184.5) (118.3)
Cash flow from financing activities (137.0) (33.1)
Cash-effective change in cash and cash equivalents (98.1) 43.7
Change in cash and cash equivalents due to changes inexchange rates 0.0 0.0
Cash and cash equivalents at March 1 349.7 400.9
Cash and cash equivalents at November 30 251.6 444.6
Cash Flow StatementHORNBACH Group
rounding differences
Factbook Q3/9M 2016/2017 Page 45©HORNBACH Group 2016
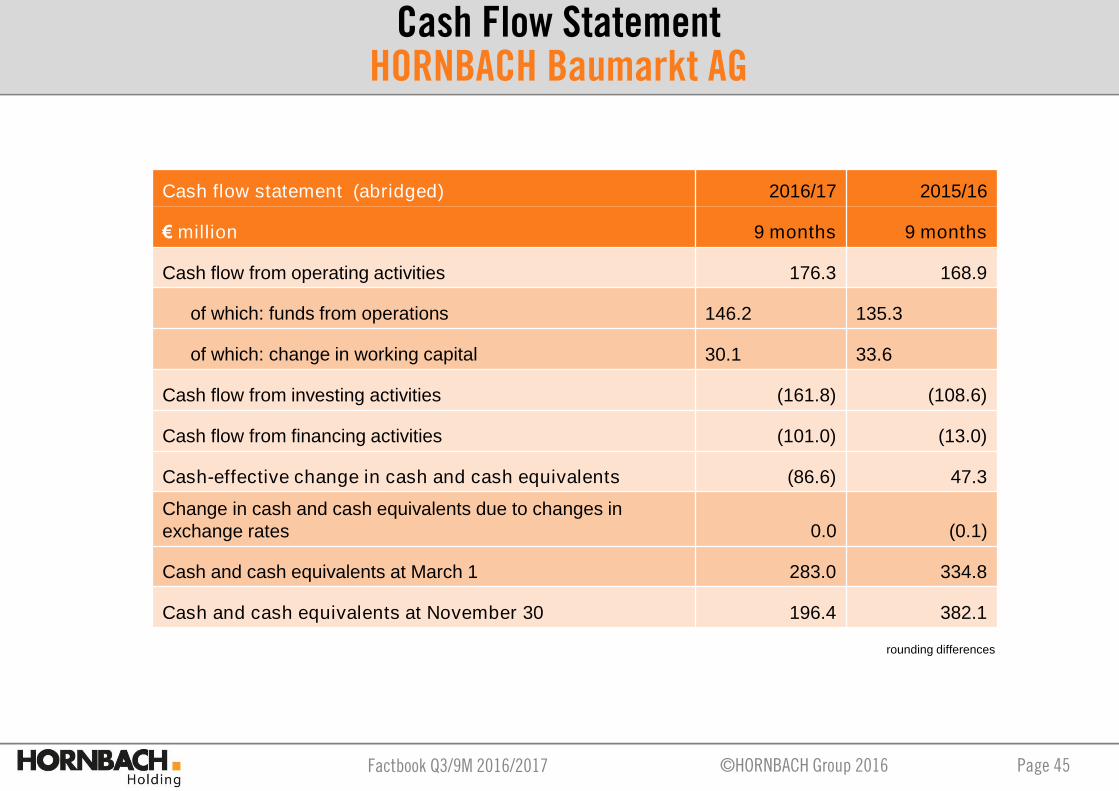
Cash flow statement (abridged) 2016/17 2015/16
€ million 9 months 9 months
Cash flow from operating activities 176.3 168.9
of which: funds from operations 146.2 135.3
of which: change in working capital 30.1 33.6
Cash flow from investing activities (161.8) (108.6)
Cash flow from financing activities (101.0) (13.0)
Cash-effective change in cash and cash equivalents (86.6) 47.3
Change in cash and cash equivalents due to changes inexchange rates 0.0 (0.1)
Cash and cash equivalents at March 1 283.0 334.8
Cash and cash equivalents at November 30 196.4 382.1
Cash Flow StatementHORNBACH Baumarkt AG
rounding differences
Factbook Q3/9M 2016/2017 Page 46©HORNBACH Group 2016
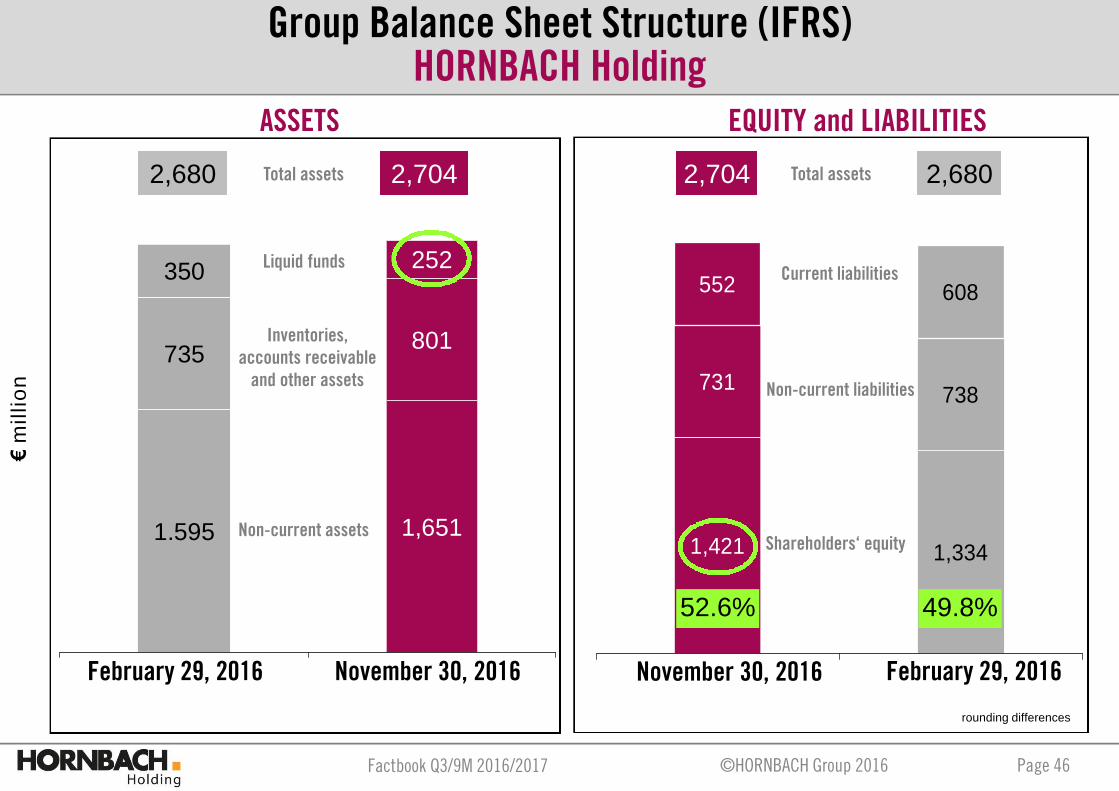
738
608
1,3341,421
731
552
49.8%
1.595
735
350
1,651
801
252
2,680 2,704
November 30, 2016 November 30, 2016
52.6%
2,6802,704
ASSETS EQUITY and LIABILITIES
February 29, 2016 February 29, 2016
Total assets
Liquid funds
Inventories,accounts receivable
and other assets
Non-current assets
Total assets
Shareholders‘ equity
Current liabilities
Non-current liabilities
Group Balance Sheet Structure (IFRS)HORNBACH Holding
€m
illi
on
rounding differences

Factbook Q3/9M 2016/2017 Page 47©HORNBACH Group 2016
494
1,041 973
507
520466
49.0%
665707
283196
1,039 1,111
1,986 2,014 1,9862,014
51.7%
ASSETS EQUITY and LIABILITIES
Total assets Total assets
Liquid funds
Inventories,accounts receivable
and other assets
Non-current assetsShareholders‘ equity
Current liabilities
Non-current liabilities
February 29, 2016 November 30, 2016 November 30, 2016 February 29, 2016
Rundungsdifferenzen
Group Balance Sheet Structure (IFRS)HORNBACH Baumarkt AG
€m
illi
on
Factbook Q3/9M 2016/2017 Page 48©HORNBACH Group 2016
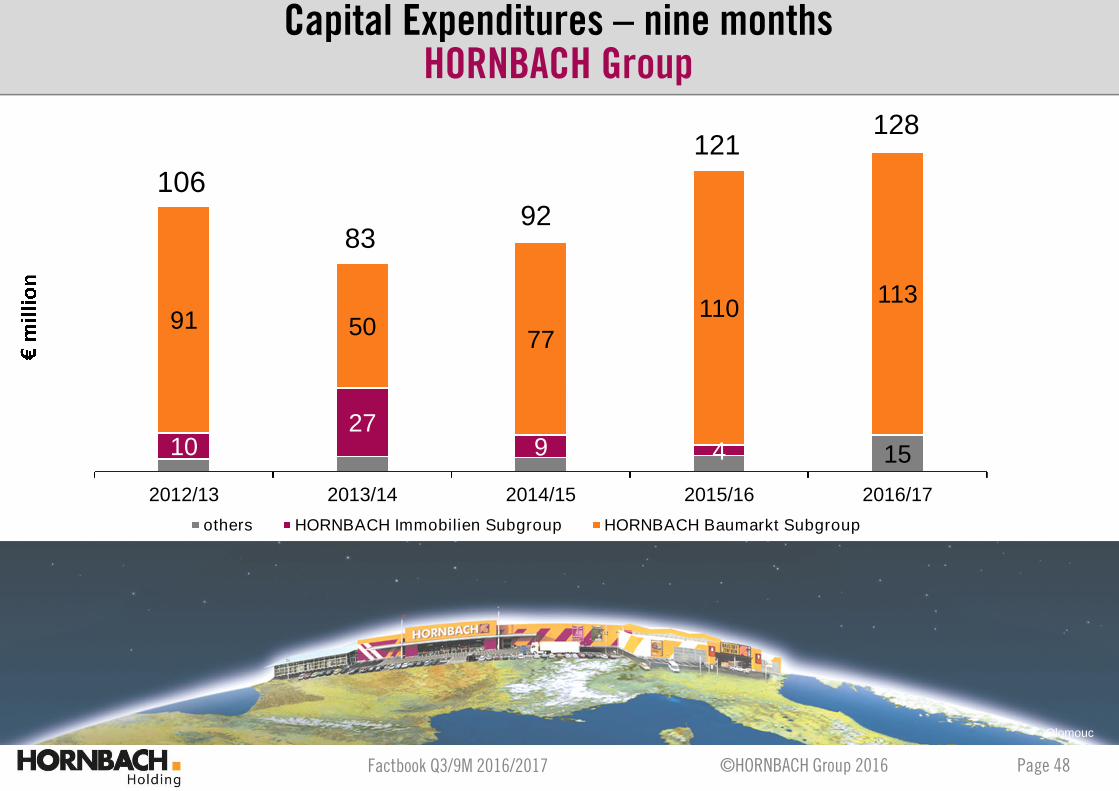
151027
9 4
91 5077
110113
2012/13 2013/14 2014/15 2015/16 2016/17
others HORNBACH Immobilien Subgroup HORNBACH Baumarkt Subgroup
Olomouc
83
121128
10692
Capital Expenditures – nine monthsHORNBACH Group

Factbook Q3/9M 2016/2017 Page 49©HORNBACH Group 2016
10,339 10,479
7,034 7,261
February 29, 2016 November 30, 2016
17,74017,373
EmployeesHORNBACH Group
InternationalGermany

Factbook Q3/9M 2016/2017 Page 50©HORNBACH Group 2016
Outlook

Factbook Q3/9M 2016/2017 Page 51©HORNBACH Group 2016
Prag-Chuchle
Amsterdam
Innsbruck
New Store Openings and Outlook 2016/2017HORNBACH Group
Prag-Chuchle
Innsbruck
Amsterdam-Sloterdijk
Mannheim-Käfertal store closed
27th outlet opened (Q2)
Sales and earnings forecastfor FY 2016/2017 unchanged:
Sales to increase in a medium single-digitpercentage range
EBIT FC:HH -> ≥ adjusted EBIT 15/16 (151€m)HBM -> ~ adjusted EBIT 15/16 (99€m)
HBM
HBU

Factbook Q3/9M 2016/2017 Page 52©HORNBACH Group 2016
DISCLAIMERThis presentation is to be read in the context of the audited financial data of the HORNBACH Holding Group and the disclosures made in the notes to the consolidatedfinancial statements contained in the annual report. It contains statements relating to the future based on assumptions and estimates made by HORNBACH’s Boardof Management. Forward-looking statements are only valid at the time at which they are made. Although we assume that the expectations reflected in these forecaststatements are realistic, the company can provide no guarantee that these expectations will turn out to be accurate. The assumptions may involve risks anduncertainties which could result in actual events differing significantly from the forecast statements. Such factors include those discussed in the “Risk Report” and“Outlook” of the annual report. We do not assume any obligation to update the forward-looking statements contained in this presentation.
March 23, 2017 Trading Statement 2016/2017
May 29, 2017 Annual Press Conference 2016/2017Publication Annual Report 2016/2017DVFA Analysts‘ Conference HORNBACH Baumarkt
June 30, 2017 Financial Update: 1st Quarter of 2017/2018
July 6, 2017 Annual General Meeting HORNBACH Baumarkt
July 7, 2017 Annual General Meeting HORNBACH Holding
September 28, 2017 Half-Year Financial Report 2017/2018DVFA Analysts‘ Conference HORNBACH Holding
December 21, 2017 Financial Update: 3rd Quarter of 2017/2018
Financial Calender 2016 – Contact – DisclaimerHORNBACH Group
Top Related