


Languages
Pages
Legal

DDPE 2701 Electrical Engineering Laboratory 2
Instrumentation Experiment 2 : Load cell & Pressure sensor
ktawi Page 1
JABATAN KEJURUTERAAN ELEKTRIK PUSAT PENGAJIAN DIPLOMA (PPD), SPACE
EXPERIMENT 2 : LOAD CELL & PRESSURE SENSOR
Programme: DDPB/E/K/P Session :
Course : ELECTRICAL ENGINEERING LABORATORY 2 Code : DDPE 2701
Topic : STRAIN GAUGE Lab:
Title : LOAD CELL & PRESSURE SENSOR Date :
Group Members
No Name ID No
1
2
3
Lab Station Group
INSTRUCTION
Warning!!!
Do not make any connection or circuit adjustment when the supply is ON. Always abide by the safety procedure
1. Follow all the experiments procedures. 2. Acquire from the lab technician for components, equipments and assistance. 3. All reports need to be submitted by the end of the lab session.
Marks
SKILL
Commitment and participation (PO8) /15 Supervisor
Operational circuit (PO2) /15
Competency (PO2) /20
REPORT
Result (PO1) /20 comment
Discussion (PO1) /20
Conclusion (PO1) /10
TOTAL /100
Sekolah Pendidikan Profesional dan Pendidikan Berterusan (SPACE) Kuala Lumpur
DDPE 2701 Electrical Engineering Laboratory 2
Instrumentation Experiment 2 : Load cell & Pressure sensor
ktawi Page 2
EXPERIMENT 2 : LOAD CELL & PRESSURE SENSOR
PART A : LOAD CELL
OBJECTIVES:
a) Study the principle of a strain gauge.
b) Study the construction of a load cell.
c) Study the characteristic of a load cell .
d) Study the transduction circuit of a load
e) Study the application of a load cell.
DISCUSSION OF FUNDAMENTALS
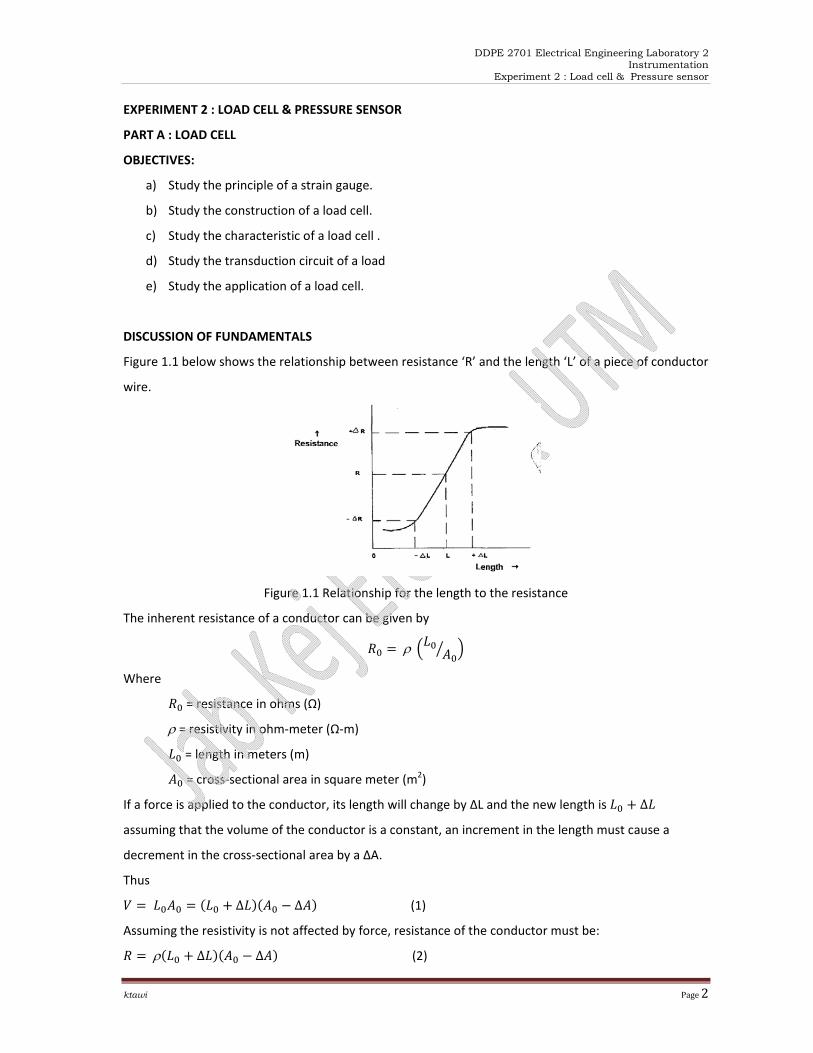
Figure 1.1 below shows the relationship between resistance ‘R’ and the length ‘L’ of a piece of conductor
wire.
Figure 1.1 Relationship for the length to the resistance
The inherent resistance of a conductor can be given by
ρ
Where
= resistance in ohms (Ω)
ρ = resistivity in ohm‐meter (Ω‐m)
= length in meters (m)
= cross‐sectional area in square meter (m2)
If a force is applied to the conductor, its length will change by ∆L and the new length is ∆
assuming that the volume of the conductor is a constant, an increment in the length must cause a
decrement in the cross‐sectional area by a ∆A.
Thus
∆ ∆ (1)
Assuming the resistivity is not affected by force, resistance of the conductor must be:
ρ ∆ ∆ (2)

DDPE 2701 Electrical Engineering Laboratory 2
Instrumentation Experiment 2 : Load cell & Pressure sensor
ktawi Page 3
From equations 1 and 2 we can obtain the new resistance as:
ρ / 1 2∆ / (3)
Hence, the resistance change is
∆ 2 ∆ (4)
Equation (4) is called "characteristic equation of a strain gauge.” The length change ∆L/L0 can be
converted to the change of resistance ∆R/R0 .
A conductor's shape and resistance is influenced by the applied external force. In other words,
magnitude of the applied force can be calculated by measuring the magnitude of resistance change.
However, temperature change is also a factor that affects the resistance. Therefore, how to compensate
the effect of the temperature change is an important consideration.
There are two types of strain gauges configurations: the "metal‐wire" strain gauge and the "metal‐foil”
strain gauge. Both types of strain gauges have the same basic characteristic. The wire gauge consists of
thin wire applied in a zigzag pattern to a dimensionally stable substrate as shown in Figure 1.2. The
strain’s direction is along the sensing axis, which is along the gauge length. The axis along the gauge
width is the transverse axis.
Figure 1.2 A general‐purpose strain gauge
The strain‐gauge bridge circuit of Figure 1.3 is commonly used for converting the resistance changes into
voltage changes. The strain gauge consists of an active gauge installed along the sensing axis and a
dummy gauge installed along the transverse axis. Both gauges have the same‐characteristics and are
exposed to the same temperature, and, by virtue of their connection into the bridge, the dummy gauge
provides temperature compensation for the active gauge.

DDPE 2701 Electrical Engineering Laboratory 2
Instrumentation Experiment 2 : Load cell & Pressure sensor
ktawi Page 4
Figure 1.3 Strain‐gauge bridge
Strain‐gauge force transducer are the most commonly used type of for a transducer, the term "load cell"
usually implies this type of transducer. Many designs exist for the measurement of compression or
tension forces or of both, and use Wheatstone bridge to detect the resistance changes and then convert
into the voltage changes. Their primary application is weight measurement. A typical design is as shown
in Figure 1.4.
(a) Two strain gauges installation (b) two strain gauges configured two bridge arms.
Figure 1.4 Load Cell Design
Figure 1.5 shows a mechanism of the load cell. Strain gauges are attached to a portion of the elastic
beam that has been milled out in an "I" shape. When a weight is applied to the beam, the strain gauge
occur the resistance change and then the bridge converts this change into the voltage in proportion to
the weight.
Figure 1.5 Load cell mechanism
DDPE 2701 Electrical Engineering Laboratory 2
Instrumentation Experiment 2 : Load cell & Pressure sensor
ktawi Page 5
DESCRIPTION OF EXPERIMENTAL CIRCUITS
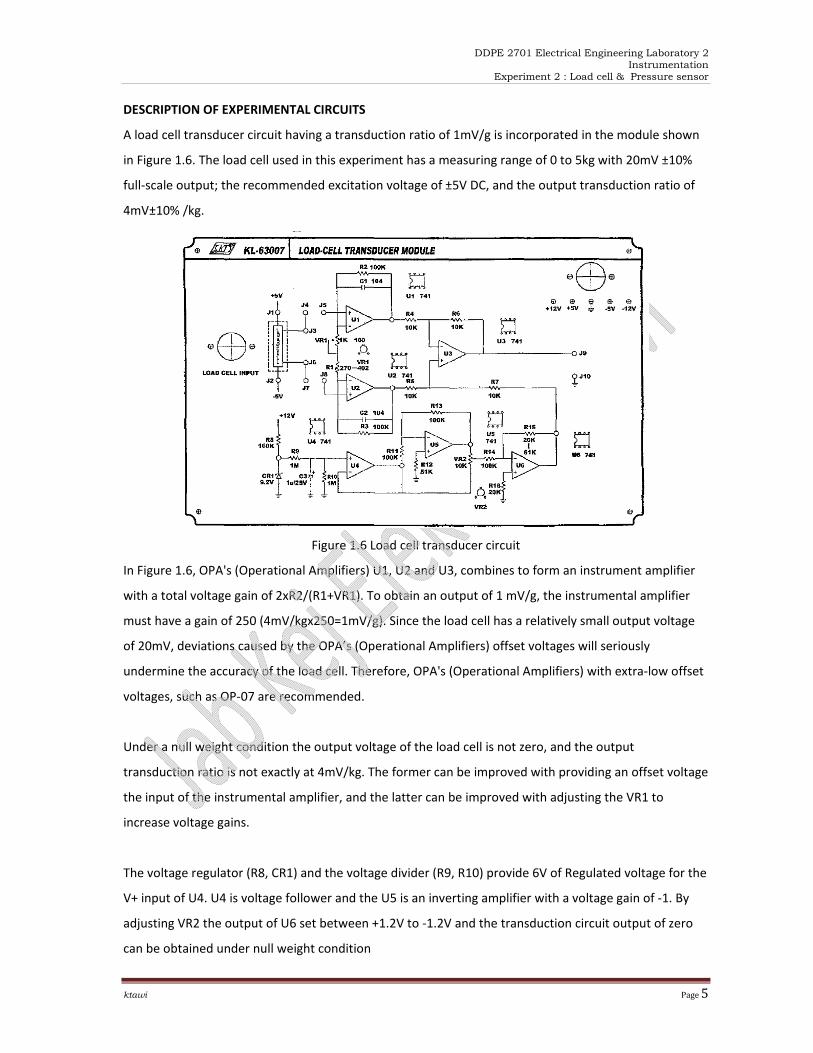
A load cell transducer circuit having a transduction ratio of 1mV/g is incorporated in the module shown
in Figure 1.6. The load cell used in this experiment has a measuring range of 0 to 5kg with 20mV ±10%
full‐scale output; the recommended excitation voltage of ±5V DC, and the output transduction ratio of
4mV±10% /kg.
Figure 1.6 Load cell transducer circuit
In Figure 1.6, OPA's (Operational Amplifiers) U1, U2 and U3, combines to form an instrument amplifier
with a total voltage gain of 2xR2/(R1+VR1). To obtain an output of 1 mV/g, the instrumental amplifier
must have a gain of 250 (4mV/kgx250=1mV/g). Since the load cell has a relatively small output voltage
of 20mV, deviations caused by the OPA’s (Operational Amplifiers) offset voltages will seriously
undermine the accuracy of the load cell. Therefore, OPA's (Operational Amplifiers) with extra‐low offset
voltages, such as OP‐07 are recommended.
Under a null weight condition the output voltage of the load cell is not zero, and the output
transduction ratio is not exactly at 4mV/kg. The former can be improved with providing an offset voltage
the input of the instrumental amplifier, and the latter can be improved with adjusting the VR1 to
increase voltage gains.
The voltage regulator (R8, CR1) and the voltage divider (R9, R10) provide 6V of Regulated voltage for the
V+ input of U4. U4 is voltage follower and the U5 is an inverting amplifier with a voltage gain of ‐1. By
adjusting VR2 the output of U6 set between +1.2V to ‐1.2V and the transduction circuit output of zero
can be obtained under null weight condition

DDPE 2701 Electrical Engineering Laboratory 2
Instrumentation Experiment 2 : Load cell & Pressure sensor
ktawi Page 6
EQUIPMENT REQUIRED
1) KL‐68003 Load Cell With Mechanism
2) KL‐63007 Load‐Cell Transducer module.
3) KL‐68008 Weight Set 5kg
4) DMM (Digital Multi Meter)
5) KL‐61001A Trainer
EXPERIMENT AND RECORD
Characteristic and transduction circuit of load cell
1) Set the Load‐Cell Transducer Module KL‐63007 on the Trainer KL‐61001A trainer.
2) Connect Load Cell leads to the load cell input socket on KL 63007.
3) Connect DMM probes between J4 and J7 for measuring the output voltage of the Load Cell.
4) Measure and record the output voltage for each weight on Table 1.1.
5) Connect J4 to J5; J7 to J8.
6) Under null weight condition, adjust the potentiometer VR2 and measure the output voltage at
J9 for VJ9 = OV.
7) Set the weight of 1 kg and adjust VR1 for Voltage at J9 = 1 V. This step set the transduction ratio
to 1V/kg.
8) Measure and record the output voltage at J9 for each weight on Table 1.2.
9) Plot the graph of voltage against weight as shown below using data from Table 1.2

DDPE 2701 Electrical Engineering Laboratory 2
Instrumentation Experiment 2 : Load cell & Pressure sensor
ktawi Page 7
TO BE COMPLETED BY STUDENTS
RESULTS
Weight (g) 100 200 300 400 500 600 700 800 900 1k 2k 3k 4k
J4‐J7 (V)
Table 1.1
Weight (g) 100 200 300 400 500 600 700 800 900 1k 2k 3k 4k
J9(V)
Table 1.2
Observe the curve from Step 9 and calculate the transduction ratio. The transduction ratio is ______
V/kg, or __________ mV/g.
DISCUSSION
1) Comment on the theoretical value and the calculated value of the transduction
2) What is the relationship between the voltage and weight
3) Why there is a need to have an offset for the Instrumentation Amplifier
4) What criteria or component of the graph yield the transduction value
5) Relate how resistance and voltage varies
Based on these hints write your own discussion and draw your own conclusion
DISCUSSION
CONCLUSION

DDPE 2701 Electrical Engineering Laboratory 2
Instrumentation Experiment 2 : Load cell & Pressure sensor
ktawi Page 8
PART B : PRESSURE SENSORS
OBJECTIVES
1. Understanding the construction of a pneumatic pressure sensor.
2. Study the operating principle of a pressure transducer.
3. Study the applications of a pressure transducer.
DESCRIPTION OF EXPERIMENTAL CIRCUITS
Pressure is a multidirectional uniform type of stress a force applying on a unit area; it is measured as
force per unit area exerted at a given point.
Vacuum ‐‐ is the complete absence of any matter in a volume or a region of space.
Absolute pressure ‐‐ is measured relative to zero pressure (a perfect vacuum). The most commonly used
unit is the psia (pound force per square inch for absolute).
Differential pressure ‐‐ is the pressure difference between two points of measurement, measured
relative to a reference pressure or a range of reference pressures. The most commonly used unit is the
psid (pound force per square inch for differential).
1 kpa (kilopascal) = 0.145 psi
Figure 2.1 shows an integrally diffused semiconductor strain‐gauge transducer, type SPX 500. The unit
consists of the basic four‐arm‐bridge sensor encapsulated in a glass‐filled nylon package. The sectional
view and physical construction are shown in Figure 2.2. The SPX 50D has a very fast response speed. In
differential pressure applications the terminal P1 is a port for high pressure input and P2 is for low
pressure input measurements, the measured pressure must be applied to the port P1.
Figure 2.1 Equivalent circuit and packages of SPD 50D.

DDPE 2701 Electrical Engineering Laboratory 2
Instrumentation Experiment 2 : Load cell & Pressure sensor
ktawi Page 9
(a) (b)
Figure 2.2 (a) sectional view; (b) physical construction
In practice, a suitable device of temperature compensation is need for the SPX transducer. For our
application transistor compensation is used.
Transistor compensation
Figure 2.3 shows a transistor compensation circuit. When Vs= 5V, the resistors should be R1=402Ω and
R2=150Ω. Another combination is Vs=6V, R1=429Ω, and R2=133Ω. Each combination can provide an
excellent compensation in temperature range from 0 to 100°C.
Figure 2.3 Transistor compensating circuit
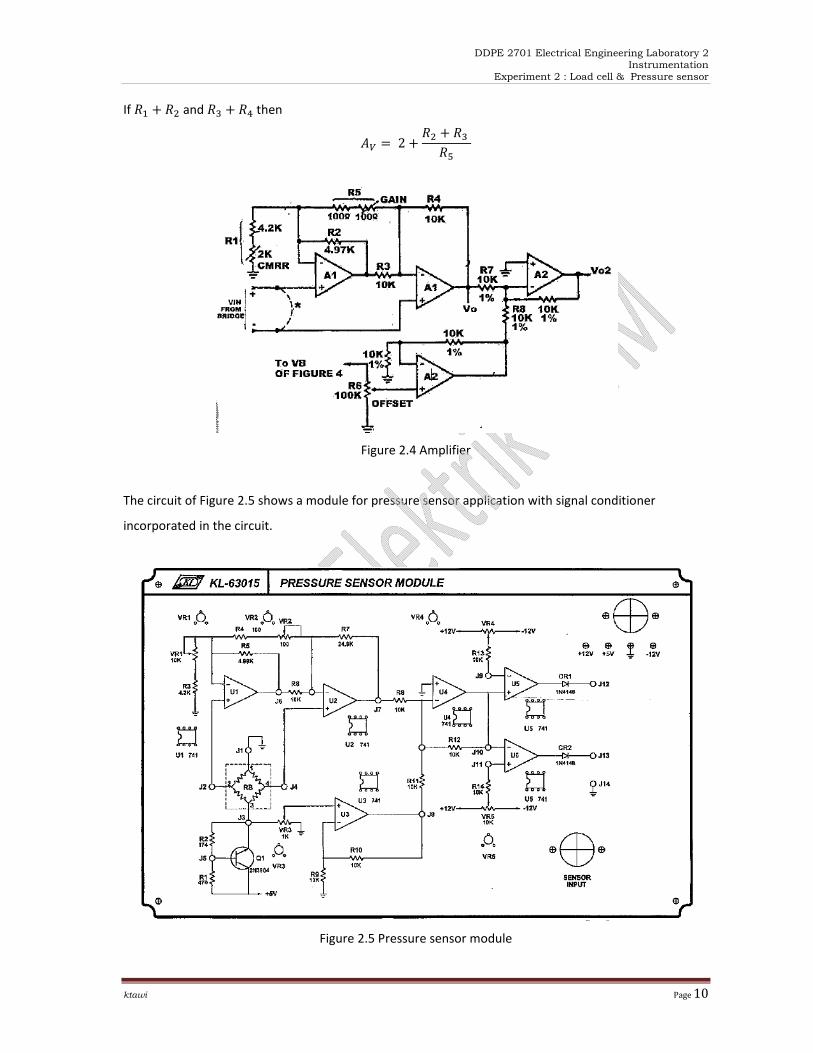
The circuit of Figure 2.4 is a suggested amplifier for the SPX, transducer. The operational amplifiers
should be precision and wide‐temperature range amplifiers, such as LT1014, LT1002, OPO7, etc. The
voltage gain Av is calculated by
1 12
DDPE 2701 Electrical Engineering Laboratory 2
Instrumentation Experiment 2 : Load cell & Pressure sensor
ktawi Page 10
If and then
2
Figure 2.4 Amplifier
The circuit of Figure 2.5 shows a module for pressure sensor application with signal conditioner
incorporated in the circuit.
Figure 2.5 Pressure sensor module

DDPE 2701 Electrical Engineering Laboratory 2
Instrumentation Experiment 2 : Load cell & Pressure sensor
ktawi Page 11
EQUIPMENT REQUIRED
1. DMM (Digital Multi Meter)
2. KL‐68002 Pressure Gauge
3. KL‐63015 Pressure Sensor Module
4. KL‐61 001A Trainer (Main unit)
EXPERIMENT AND RECORDS
1. Place the KL‐63015 Module on the KL‐6100A trainer. Connect KL‐63015 Module to DC power
supply of KL61001A trainer.
2. Place the KL‐68002 Module on the experimental table. Connect the signal wire between
Modules KL‐63015 and KL‐68002 Modules
3. Zero‐pressure input calibration. Turn on the power of the main unit (KL‐6100A) and keep the
motor stopping (do not turn ON KL‐68002). On the KL‐63015 Module, short‐circuit J2 to J4 using
a connecting lead, measure and set the voltage at J7 to zero by adjusting the VR1.
4. Using the Voltmeter measure the voltage at the J10 on KL‐63015 Module. Set the measured
value to 0V by adjusting the VR3.
5. On the KL‐63015 Module, remove the connecting lead between J2 and J4, and turn the VR2 fully
CCW (counter clock wise).
6. Using the Voltmeter, measure and record the voltage value at the J10 onKL‐63015 Module. The
measured voltage value is ___________V.
7. Turn on the power of the motor on KL‐68002 Module. Apply the pressure generated by the
motor to the P1 terminal of the pressure sensor which is located on the upper right of KL‐68002
Module. The generated pressure is proportional to the speed of the motor. According to the
needed pressure of the experiment, change the position of the motor speed switch (H‐M‐L) and
slowly adjust the position of the flow control valve that is increase in pressure by pushing the
valve to the left and decrease in pressure by pushing the valve to the right.
8. Adjust the pressure to the values given in the Table 2.1 shows on results section. Measure and
record the voltage at the J10 on KL‐63015 Module using the Voltmeter. Record the measured
voltage values in Table 2.1.
9. Apply the pressure generated by the motor to the P2 terminal of the pressure sensor and repeat
Steps 7 through 9. Record the measured voltage in Table 2.1.
10. Plot the recorded voltage values on the following graph.

DDPE 2701 Electrical Engineering Laboratory 2
Instrumentation Experiment 2 : Load cell & Pressure sensor
ktawi Page 12
11. Turn the VR2 on KL‐63015 Module fully CW.
12. Based on the pressure adjustment given in Table 2.2 repeat steps 6 through 10.
13. Draw a smooth curve through your plotted points. The completed pressure against voltage
curve should be linear and the VR2 acts as a gain adjust.
TO BE COMPLETED BY STUDENTS
RESULTS
Record voltage and pressure values with VR2 turned fully Counter Clock Wise
Pressure
Voltage
1000 mmAq 1200 mmAq 1400 mmAq 1600 mmAq 1800 mmAq
With P1
With P2
Table 2.1
Record voltage and pressure values with VR2 turned fully Clock Wise
Pressure
Voltage
1000 mmAq 1200 mmAq 1400 mmAq 1600 mmAq 1800 mmAq
With P1
With P2
Table 2.2
DDPE 2701 Electrical Engineering Laboratory 2
Instrumentation Experiment 2 : Load cell & Pressure sensor
ktawi Page 13
DISCUSSION
1) Comment on graphs observations
2) Did you get a straight line if yes or otherwise explain why
3) Why the trend for graph for P1 and P2 are opposite each other
4) Calculate the gain you should get from the formula given previously
5) Explain relationship between measured voltage with pressure
Based on these hints write your own discussion and draw your own conclusion
DISCUSSION
CONCLUSION
Top Related