


Languages
Pages
Legal

Walden UniversityScholarWorks
Walden Dissertations and Doctoral Studies Walden Dissertations and Doctoral StudiesCollection
2019
Examination of Adoption Theory on the DevOpsPractice of Continuous DeliveryAndrew John AndersonWalden University
Follow this and additional works at: https://scholarworks.waldenu.edu/dissertationsPart of the Computer Engineering Commons, and the Databases and Information Systems
Commons
This Dissertation is brought to you for free and open access by the Walden Dissertations and Doctoral Studies Collection at ScholarWorks. It has beenaccepted for inclusion in Walden Dissertations and Doctoral Studies by an authorized administrator of ScholarWorks. For more information, pleasecontact [email protected].

Walden University
College of Management and Technology
This is to certify that the doctoral dissertation by
Andrew J. Anderson
has been found to be complete and satisfactory in all respects, and that any and all revisions required by the review committee have been made.
Review Committee Dr. Jean Gordon, Committee Chairperson, Management Faculty Dr. Robert DeYoung, Committee Member, Management Faculty Dr. Raghu Korrapati, University Reviewer, Management Faculty
The Office of the Provost
Walden University 2019

Abstract
Examination of Adoption Theory on the DevOps Practice of Continuous Delivery
by
Andrew J. Anderson
MBA, Dowling University, 2006
BS, State University of New York Plattsburgh, 1995
Dissertation Submitted in Partial Fulfillment
of the Requirements for the Degree of
Doctor of Philosophy
Management
Walden University
November 2019

Abstract
Many organizations have difficulty adopting advanced software development practices.
Some software development project managers in large organizations are not aligned with
the relationship between performance expectancy, effort expectancy, social influence,
and facilitating conditions, as moderated by experience, with intent to adopt the DevOps
practice of continuous delivery. The purpose of this study was to examine the statistical
relationships between the independent variables—performance expectancy, effort
expectancy, social influence, and facilitating conditions, as moderated by experience—
and the dependent variable of behavioral intent to adopt a continuous delivery system.
Venkatesh, Morris, Davis, and Davis’s unified theory of acceptance and use of
technology provided the theoretical framework. A stepwise multiple linear regression
analysis was performed on survey data from 85 technical project managers affiliated with
LinkedIn project management groups. The analysis reflected that only performance
expectancy was significant in predicting intent to adopt continuous delivery. The findings
may contribute to social change by providing project managers with the information they
need to support organizational change, collaboration, and facilitation. The knowledge
gained may additionally help organizations develop operational efficiency, competitive
advantage, and generate higher value to their clients and society.
Examination of Adoption Theory on the DevOps Practice of Continuous Delivery
by
Andrew J. Anderson
MBA, Dowling University, 2006
BS, State University of New York Plattsburgh, 1995
Dissertation Submitted in Partial Fulfillment
of the Requirements for the Degree of
Doctor of Philosophy
Management
Walden University
November 2019

Dedication
I would like to dedicate this work to Daniela and Emma. Daniela, you have
continued to inspire me to be a better person every day. Thank you for your
understanding, encouragement, and support as you have helped me realize a lifelong
goal. Words cannot express how much I love and appreciate you.
My dearest daughter, Emma, some day you will understand the world from a
much bigger perspective, and I am sure when that day comes we will reconnect. I hope
this work proves that goals, dreams, and persistence are the essence of life. I have learned
that health, happiness, and peace comes from knowing who we are and being smart and
selective with whom we associate. My hope is that you also find health, happiness, and
peace. Until the day we meet again I will be waiting in the place where lost things go. I
love you more than words can say and miss you more with every passing day. Wǒ ài nǐ,
Daddy.

Acknowledgments
I would like to acknowledge everyone who has given me the encouragement to
pursue academic excellence. The pursuit of an advanced degree takes time, patience, and
support from others. Professors, friends, and colleagues have all cheered me along the
decade-long journey to realize my goal.
I want to thank my committee, Dr. Gordon, Dr. DeYoung, and Dr. Hazari, for
helping me keep momentum along this journey. Their feedback addressed the items that
mattered the most and they were patient in observing me learn and adapt. The path of
becoming a researcher is a personal one where a student becomes a peer. Mentors must
choose feedback carefully to be critical yet constructive. I have become a much better
researcher and writer as a result of their conscious efforts.
It takes support from many to accomplish great things. Walden Librarian Audrey
Butlett-Swenson, Walden Writing Center’s Jenny Martel, Walden Editor Angie Drennen,
Cassie Bowland, Dr. Sherman, and Dr. Storlie have been behind the scenes giving me
pointers that have helped me avoid obstacles and build confidence. I can say that without
a doubt I would not be able to achieve this goal without the Walden University Writing
Center, Library, Writing Intensive, and other academic services. When I was stuck and
losing hope, Audrey was there to give me a quick response to affirm my assumptions yet
show me a solution. Jenny could quickly glance at my work and offer ways to make me
write with more clarity. Dr. Sherman spent time with me to understand the nuances of
populations at a time when I was struggling with details. Dr. Storlie helped me align my
work in anticipation of results. Thank you all for being a part of my journey.
To my friends, Gabe, Rick, Mark, Ralph, Eric, and Tommy, thank you for
listening to me over the years as I struggled with priorities, sacrifice, and life. I am
forever indebted to you for your kindness, patience, and encouragement. I am blessed to
call you friends. Please know that I will always be there for you when you need someone.
To my colleagues, Ralph and Peter, thank you for giving the support I needed for
the last mile of this journey. The time requirements it takes to build a body of work, as
substantial as a dissertation, is immense. You allowed me to become a better version of
myself and that is one of the greatest gifts anyone can ever be afforded. Thank you both.
To my expert panel, Scott, John, and Ralph, thank you for helping me jump the
final hurdle in my proposal. It was a fantastic feeling to know that relationships I have
forged with colleagues stood the test of time. Thank you for accepting the challenge,
renewing my spirit, and giving me a boost when I needed it most.
To Tom and Vince, thank you for showing me the value of guidance, persistence,
and professionalism. Without you I would not have restarted this process. Thank you
both for giving me the strength, wisdom, and tools I needed to chase my dreams.
To the Writing Intensive gang, Jim C., Steve, Alex, Scott, Vantrice, Emmitte,
Lorraine, Khadija, Jeff, and Jim M. Thank you for your support, encouragement, and
laughter. It was truly amazing to be humble, joyous, and accepted by all of you. I am
looking forward to celebrating our prodigious achievements at graduation.

i
Table of Contents
List of Tables .......................................................................................................................v
List of Figures ................................................................................................................... vii
Chapter 1: Introduction to the Study ....................................................................................1
Background of the Study ...............................................................................................3
Lean Principles and Agile Methods ........................................................................ 4
DevOps and Continuous Practices .......................................................................... 7
Problem Statement .......................................................................................................11
Purpose of the Study ....................................................................................................12
Research Questions ......................................................................................................13
Theoretical Foundation ................................................................................................15
Nature of the Study ......................................................................................................18
Definitions....................................................................................................................19
Assumptions .................................................................................................................21
Scope and Delimitations ..............................................................................................22
Limitations ...................................................................................................................23
Significance of the Study .............................................................................................24
Significance to Practice......................................................................................... 24
Significance to Theory .......................................................................................... 25
Significance to Social Change .............................................................................. 25
Summary and Transition ..............................................................................................26

ii
Chapter 2: Literature Review .............................................................................................28
Introduction ..................................................................................................................28
Literature Search Strategy............................................................................................29
Theoretical Foundation ................................................................................................31
Assumptions .......................................................................................................... 34
Similar Applications ............................................................................................. 34
Model Selection Rationale .................................................................................... 35
Research Question Importance ............................................................................. 36
Literature Review.........................................................................................................37
Unified Theory of Acceptance and Use of Technology (UTAUT) ...................... 37
UTAUT Research in Information Technology ..................................................... 40
Project Management Research .............................................................................. 57
DevOps and Continuous Delivery Adoption History ........................................... 76
Continuous Delivery Research ............................................................................. 84
Summary and Conclusions ..........................................................................................95
Chapter 3: Research Method ..............................................................................................98
Introduction ..................................................................................................................98
Research Design and Rationale ...................................................................................98
Methodology ..............................................................................................................102
Population ........................................................................................................... 102
Sampling and Sampling Procedures ................................................................... 103

iii
Procedures for Recruitment, Participation, and Data Collection ........................ 104
Instrumentation and Operationalization of Constructs ....................................... 105
Data Analysis Plan .............................................................................................. 111
Threats to Validity .....................................................................................................114
Ethical Procedures .....................................................................................................117
Summary ....................................................................................................................117
Chapter 4: Results ............................................................................................................119
Introduction ................................................................................................................119
Data Collection ..........................................................................................................119
Baseline Descriptive Statistics ............................................................................ 121
Demographics ..................................................................................................... 122
Construct Descriptive Statistics .................................................................................127
Study Results .............................................................................................................127
Statistical Analysis of the Findings .................................................................... 127
Research Questions ............................................................................................. 128
Multiple Linear Regression Analysis.................................................................. 130
Research Assumptions ........................................................................................ 135
Correlation Analysis ........................................................................................... 139
Summary ....................................................................................................................140
Chapter 5: Conclusion......................................................................................................142
Introduction ................................................................................................................142
iv
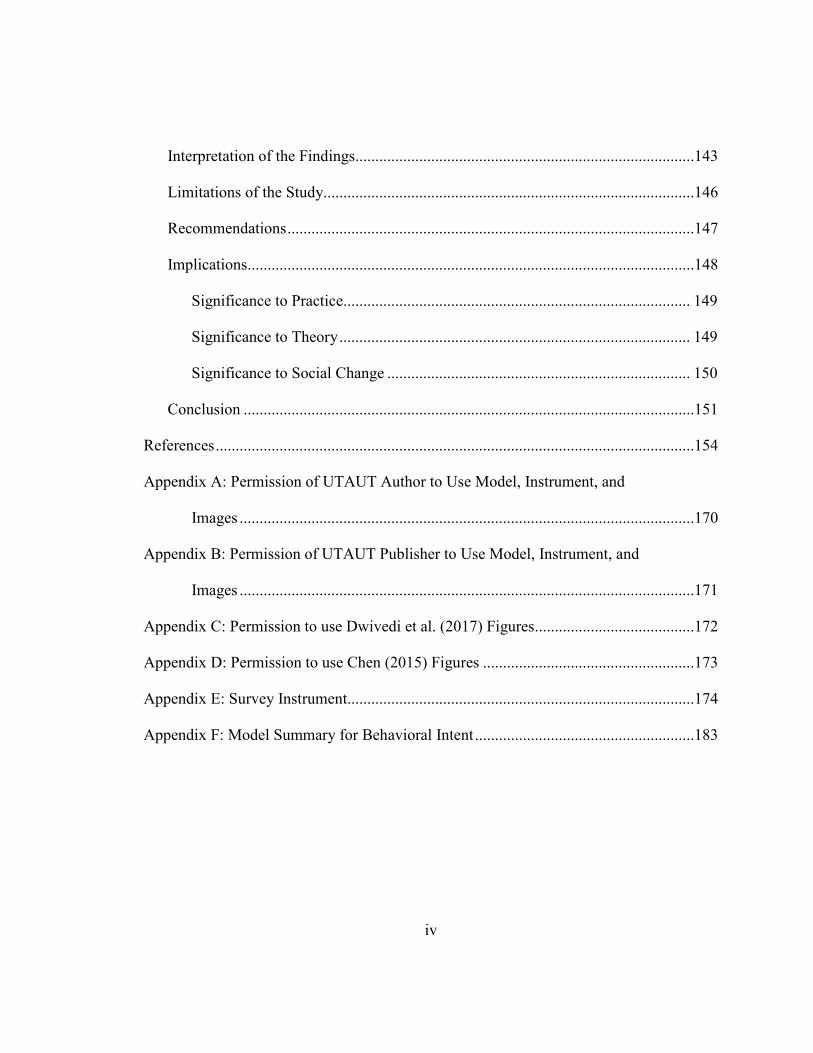
Interpretation of the Findings.....................................................................................143
Limitations of the Study.............................................................................................146
Recommendations ......................................................................................................147
Implications................................................................................................................148
Significance to Practice....................................................................................... 149
Significance to Theory ........................................................................................ 149
Significance to Social Change ............................................................................ 150
Conclusion .................................................................................................................151
References ........................................................................................................................154
Appendix A: Permission of UTAUT Author to Use Model, Instrument, and
Images ..................................................................................................................170
Appendix B: Permission of UTAUT Publisher to Use Model, Instrument, and
Images ..................................................................................................................171
Appendix C: Permission to use Dwivedi et al. (2017) Figures ........................................172
Appendix D: Permission to use Chen (2015) Figures .....................................................173
Appendix E: Survey Instrument.......................................................................................174
Appendix F: Model Summary for Behavioral Intent .......................................................183

v
List of Tables
Table 1. Group Survey Response Rates .......................................................................... 120
Table 2. Tendency and Variance of Independent and Dependent Variables .................. 122
Table 3. Frequency of Participants by Group ................................................................. 122
Table 4. Frequency of Participant Location .................................................................... 123
Table 5. Frequency of Company Industry ...................................................................... 124
Table 6. Frequency of Organization Size ....................................................................... 125
Table 7. Frequency of Revenue Size .............................................................................. 125
Table 8. Frequency of Agile Method Used ..................................................................... 125
Table 9. Frequency of Years of Experience .................................................................... 126
Table 10. Frequency of Counts of Agile Projects ........................................................... 126
Table 11. Frequency of Project Duration ........................................................................ 127
Table 12. Stepwise Multiple Linear Regression Analysis of Behavioral Intent and
Independent Variables............................................................................................. 131
Table 13. Backward Stepwise Beta Coefficients for the Behavioral Intent Equation .... 132
Table 14. Backward Stepwise Beta Coefficients for the Behavioral Intent Equation for
Six or Fewer Years of Experience .......................................................................... 133
Table 15. Backward Stepwise Beta Coefficients for the Behavioral Intent Equation for
Seven or More Years of Experience ....................................................................... 133
Table 16. Backward Stepwise Beta Coefficients for the Behavioral Intent Equation for
Six or Fewer Projects of Experience ....................................................................... 134
vi
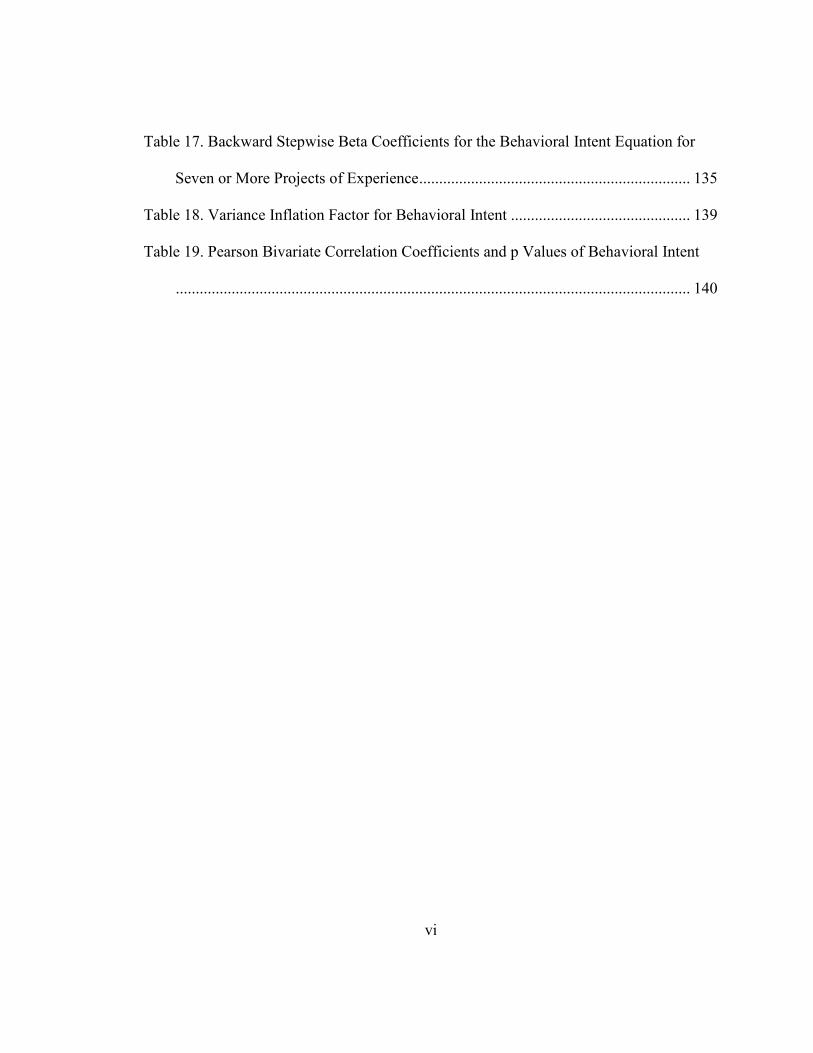
Table 17. Backward Stepwise Beta Coefficients for the Behavioral Intent Equation for
Seven or More Projects of Experience .................................................................... 135
Table 18. Variance Inflation Factor for Behavioral Intent ............................................. 139
Table 19. Pearson Bivariate Correlation Coefficients and p Values of Behavioral Intent
................................................................................................................................. 140

vii
List of Figures
Figure 1. Unified theory of acceptance and use of technology (UTAUT) ....................... 16
Figure 2. Augmented technology acceptance model ........................................................ 33
Figure 3. Continuous integration, continuous delivery, and continuous deployment
operations .................................................................................................................. 78
Figure 4. Scatterplot of regression standardized residual versus regression standardized
predicted value for behavioral intent ...................................................................... 136
Figure 5. Normal P-P plot of expected cumulative probability versus observed cumulative
probability for behavioral intent ............................................................................. 137
Figure 6. Histogram of frequency versus regression standardized residual for behavioral
intent ....................................................................................................................... 138
1
Chapter 1: Introduction to the Study
Software development organizations work for market share and improving
profitability by focusing on efficiency. For example, Internet-based application
development companies like Facebook, Amazon, and Netflix have gained competitive
advantages by responding to changes in user behavior by increasing their rate of product
release (Parnin et al., 2017). Increasing the pace of releases has allowed companies to
concentrate on automating software build, testing, and monitoring by using automatic
metric collection and telemetry to measure performance and user behavior (Rose, 2013),
which helps companies to visualize how customers use their applications and
consequently support the creation or removal of software features and artifacts inside the
products they promote or sell (Lesser & Ban, 2016). Using tools and information to
improve the efficiency of development practices has become a mandatory practice for
vendors seeking a competitive advantage in the software solution market (Parnin et al.,
2017). Older methods of developing software may not be sufficient for achieving a
competitive advantage in the marketplace (Rodríguez et al., 2018).
Traditional methods of software development, such as waterfall methodologies
and associated organizational roles and responsibilities, do not allow rapid changes and
releases to respond to customer feedback and may not support improved efficiency
(Bishop, Rowland, & Noteboom, 2018). Traditional methods of software development
involve sequential, gated methods for collecting requirements, designing, developing, and
releasing new products and features, which can take months or weeks (Bishop et al.,
2018). Gaining quick feedback from customers by shortening the time between releases

2
requires a more advanced method of development and changes to managerial
organizational roles and responsibilities to reduce the time between conception of
changes and collection of customer feedback (Subramanian, Krishnamachariar, Gupta, &
Sharman, 2018).
The reduction of cycle times to days, hours, or minutes has provided a significant
competitive advantage for organizations that have adopted continuous practices.
However, adopting and using continuous delivery is not easy (Laukkanen, Itkonen, &
Lassenius, 2017) because it requires significant social and technical changes (Laukkanen,
Paasivaara, Itkonen, & Lassenius, 2018). Social and technical challenges are managed by
project managers in agile software development teams that are responsible for the
planning and successful delivery of products to clients (Banerjee, 2016). But traditional
project management methods conflict with methods required in agile software
development (Gandomani & Nafchi, 2016). Project managers in agile software
development environments are required to shift from controlling behaviors in favor of
more facilitating methods to achieve their job responsibilities (Bishop et al., 2018).
Project managers must focus more on leadership skills such as empowerment and
encouragement as opposed to planning and controlling their team’s efforts and outcomes
(Drury-Grogan, Conboy, & Acton, 2017). Thus, changing management styles and the
introduction of continuous practices has provided project managers with new challenges.
Project manager preferences and perceptions have played a significant role in behavioral
intention to adopt continuous practices such as continuous delivery (Bishop et al., 2018),
the focus of this study.

3
This study was an examination of the perceptions of software development
project managers on the practice of continuous delivery and how these perceptions affect
behavioral intent to adopt continuous delivery. I selected project managers as the focus
for this study because they are responsible for the daily coordination and orchestration of
software development projects from inception to customer delivery (Banerjee, 2016;
Bishop et al., 2018). Project managers have the option to adopt and influence the
adoption of tools, practices, and processes they believe assisted them with planning and
delivery of software projects (Taylor, 2016). The perceptions of project managers
provided the scope necessary to view the development and operations integration
required to achieve continuous delivery practices.
Chapter 1 will include the introduction and background of this study. The
background section covers lean, agile principles, DevOps, continuous practices, project
management, and continuous delivery. Chapter 1 will also include a definition of the
problem, purpose, research questions, theoretical foundation, nature, assumptions, scope,
delimitations, limitations, and significance of this study. A summary and transition to
Chapter 2 is provided at the end of this chapter.
Background of the Study
Roles and responsibilities in software development organizations have mirrored
those associated with product manufacturing organizations (Baydoun & El-Den, 2017).
Software-intensive businesses have typically created products in a way that emulates
traditionally engineered goods (Rodríguez et al., 2018), requiring occasional maintenance
but not physically changing over time (Papadopoulos, 2015). However, software

4
solutions differ from traditionally manufactured goods because they are dynamic,
malleable, and limited only by creativity (Ghezzi, 2018). Roles and responsibilities in the
field of software development need to change to support changing customer demands on
software solutions that have increased as customers have realized they could expect more
features, functionality, and quality from their investment.
As customers have expected software products to evolve into adaptable
instruments to support competitive advantage (Lesser & Ban, 2016), enterprise software
businesses have required a better way to innovate and serve customers in a flexible and
quality-driven manner. Traditional software development methods to conceive, develop,
and deploy software require months or years to reach customers (Karvonen et al., 2017)
and are not flexible or capable of supporting improvements to quality. In traditional
software development environments, as customers have increased demands on software
capability, internal pressure has also increased as product permutations, code paths, and
bug reports have increased. Project managers, responsible for converting business inputs
into technical outputs, need a new way to please their customers by improving output
quality while reducing time, cost, and workers (Taylor, 2016)—a case of managing
uncertainty and satisfying business demands while driving technical efficiency and
quality.
Lean Principles and Agile Methods
New software development practices were conceived after the introduction of
agile methods, which are based on lean principles (Mäkinen et al., 2016). Agile methods
define the process of creating and maintaining software, asynchronously, to collect

5
requirements and feedback, design, develop, and release changes in days or hours
(Karvonen, Behutiye, Oivo, & Kuvaja, 2017). Agile software development has replaced
the sequential, gated process followed by project managers associated with traditional
software development with smaller, asynchronous, iterative cycles (Serrador & Pinto,
2015). Agile software development practices provide a way for feedback from
stakeholders, especially customers, to affect software product development at any stage
in the development cycle, which was once considered impossible (Serrador & Pinto,
2015). Agile methods promote small iterative changes, allowing frequent releases of the
software to happen whenever code changes are complete and quality is in an acceptable
state (Denning, 2015). In agile development practices, each function of the development
lifecycle operates autonomously and continuously where bottlenecks are significantly
minimized (Mäkinen et al., 2016).
Agile methods were influenced by lean principles, which refer to ways to
eliminate waste in the production process. For example, in the late 1980s, Toyota
implemented a set of waste reduction processes called the Toyota Production System to
help them gain a competitive advantage by achieving higher production and efficiency by
eliminating waste (Rodríguez et al., 2018). Reducing waste to improve production
efficiency is the focus of the lean approach (Alahyari, Gorschek, & Berntsson Svensson,
2019) ,which improves the flow of value to customers by driving down time to market
and cost of goods, creating a leaner process. Focusing on making manufacturing
techniques more efficient provides the added benefit of improving worker attitudes and
reported job satisfaction (Fitzgerald & Stol, 2017). These methods of manufacturing

6
physical goods can apply to engineering software because they share many of the same
wasteful elements uncovered by the lean approach.
Principles influenced by the lean approach were introduced to the software
engineering community when Fowler and Highsmith published the agile manifesto
(2001), a new method for developing software dynamically (Serrador & Pinto, 2015).
Organizations struggling with the uncertainty and resource constraints of traditional
software development reviewed the agile manifesto and realized lean principles could
revolutionize the software industry. Agile principles detailed in the agile manifesto
(Fowler & Highsmith, 2001) described changes in the way software is developed and
how organizations can interact with their customers to build a mutually beneficial
relationship. Agile’s purpose was defined as eliminating waste, similar to the Toyota
Production System (Rodríguez et al., 2018), by (a) favoring individual interaction over
tools and processes, (b) prioritizing software that works instead of large amounts of
documentation, (c) personal interaction with clients instead of negotiating contracts with
them, and (d) allowing constant change instead of time-intensive planning (Serrador &
Pinto, 2015). The principles of agile favor increased face-to-face interaction between all
roles in the software development lifecycle, especially customers (Serrador & Pinto,
2015). Agile’s underpinnings of facilitating discussion and suggesting direction replaced
direct command and control over the people and processes involved with software
development (Taylor, 2016; Bishop et al., 2018). Organizations adopting agile principles
have needed to adapt the project manager’s role, responsibilities, and approach to align

7
with agile principles to realize software development efficiencies in search of competitive
advantage for themselves and their customers.
One agile software development practice is DevOps, a hybrid created in 2009
from the terms development and operations (Elberzhager, Arif, Naab, Süß, & Koban,
2017). DevOps is a set of principles and guidelines that encourage the merger of
developer and operational methods and skills. Merging and managing developer and
operational skills has created new practices such as continuous integration, delivery, and
deployment. Continuous practices such as continuous integration, continuous delivery,
and continuous deployment break down organizational barriers and allow significantly
shorter time, a matter of minutes in some cases, between customer reaction and the
creation of feedback-infused changes to customers, also known as cycle time (Shahin,
Babar, & Zhu, 2017). Shortening cycle time between releases by implementing DevOps
principles can support competitive advantage in the market place, the desired effect not
achievable by managers using traditional methods of software development.
DevOps and Continuous Practices
DevOps is the embodiment of technical and social skillsets necessary to merge
development and operations functions, such as automated development and deployment,
and system monitoring needed to achieve continuous delivery (Ebert, Gallardo,
Hernantes, & Serrano, 2016). Adoption of DevOps practices such as continuous delivery
could improve cycle time 30% and decrease costs by 20% (Ebert et al., 2016), making the
software development process more efficient. Some examples of organizational elements
that impact DevOps practice adoption included departmental silos and lack of trust

8
(Leppänen et al., 2015). Additionally, organizational adoption of DevOps practices, such
as continuous integration, continuous delivery, and continuous deployment, require
organizational changes to roles and responsibilities responsible for all aspects of software
engineering and delivery (Claps et al., 2015). The roles and responsibilities of project
managers in agile software development include successful and efficient project delivery
(Taylor, 2016). Project managers can choose to adopt continuous delivery to reduce their
operational costs while achieving a higher degree of software delivery success.
After the introduction of the agile manifesto (Fowler & Highsmith, 2001),
software development organizations began experimenting with new agile software
development methods like DevOps by pushing larger volumes of updates and new
features to clients. Organizations, such as Mozilla, began seeking competitive advantage
in web-browsing software by adopting rapid releases (Karvonen et al., 2017),
continuously adjusting and redeploying their Firefox web browser product to customers.
Mozilla enabled regular updates that might consist of new features, fixes to bugs reported
only weeks before, or both, which was a departure from their yearly product release
cycles (Souza, Chavez, & Bittencourt, 2015). Mozilla used agile principles and methods
that eliminated waste by introducing continuous practices, automating and parallelizing
the steps associated with traditional software development methods that developers
execute (Shahin et al., 2017). Updating software using agile methods included similar
steps associated with traditional software development such as collection of
requirements, designing, coding, testing, and deploying (Karvonen et al., 2017; Souza,
Chavez, & Bittencourt, 2015). The agile execution of these concepts in a parallel and

9
continuous fashion was new (Subramanian et al., 2018). Other software development
organizations recognized that Mozilla was reducing cycle time by using agile methods,
practices, and tools and attempted to adopt the agile principles they employed (Denning,
2015; Laukkanen et al., 2018, Parnin et al., 2017).
One example of automating software engineering steps was characterized by
software developers requiring a way to keep the flow of code changes continuously
available for automatic integration into their product, a practice known as continuous
integration (Shahin, Zahedi, Babar, & Zhu, 2018). Continuous integration was the first
continuous practice most software development organizations implemented in adopting
agile development and competitive advantage (Shahin et al., 2018). Continuous
integration is focused on detecting changes in source code and then automatically
compiling code, testing functions and features, logging information, warning and errors,
and staging output (Balalaie, Heydarnoori, & Jamshidi, 2016). Early interpretations of
continuous integration excluded information technology (IT) operations testing and
acceptance by nondevelopers in the software development supply chain. Continuous
integration automated the process of shuttling software through various levels of
automated and manual testing to ensure quality and confidence. Completion of a
successful continuous integration cycle results in a new software artifact that could be
manually or automatically deployed to a variety of supported platforms (Balalaie et al.,
2016; Shahin et al., 2018).
To advance the software development process toward eventual release to
customers, operations staff consisting of a group of nondevelopers and the last

10
department in the software supply chain would install new versions of the developed
software to measure nonfunctional requirements such as performance, network, and
security elements (Chen, 2017). The separation of development and nondevelopment
disciplines in software-intensive businesses was viewed as a barrier that restricted further
reduction in cycle time and potentially limited competitive advantage. Organizations
soon realized that this last stage of the software development and deployment process
was an area that might also benefit from automation by applying agile principles
(Nybom, Smeds, & Porres, 2016).
Continuous delivery, a DevOps practice, was introduced to consume the output of
continuous integration and automate the steps of software developer and software
operations responsibilities for always keeping a software solution in a releasable state.
The continuous delivery practice includes testing and acceptance of continuous
integration output yielding operational readiness (Shahin et al., 2018). As continuous
practices of a software development organization have matured, an increasing number of
operational tests have been merged into continuous delivery, further blending
development and operational functions. Merging operational functionality into the
continuous delivery practice used the shift-left principle whereby functions traditionally
executed toward the end of a deployment cycle, by operations staff, move to an earlier
stage of the overall process, shifting to the left in software engineering and deployment
workflow diagrams (Fitzgerald & Stol, 2017). Shifting processes to earlier stages in the
agile software development lifecycle reduce waste by identifying and focusing only on
software build outputs that pass as many tests as possible (Fitzgerald & Stol, 2017),

11
improving the possibility of efficiency in the software development process and yielding
a more significant competitive advantage.
Project managers seeking alignment with agile principles need to improvise more
and adapt to continuous change (Taylor, 2016). Improvising means relying less on tools
and processes and increasing transparency and negotiation to affect outcomes positively.
Though project managers are aware of the benefits of agile principles, research has
indicated that adapting to agile software development practices is challenging for project
managers in enterprise software-intensive businesses (Bishop et al., 2018; Taylor, 2016).
Thus, I conducted this study on project managers’ behavior and its effects on adoption of
continuous delivery.
Problem Statement
Organizations make significant investments in advanced technology and practices
to improve the efficiency and competitive advantage that can provide increased value to
their internal and external customers (Lesser & Ban, 2016). The general problem was that
many organizations have difficulty adopting advanced software development practices
such as continuous delivery (Laukkanen et al., 2018). The specific problem was that
some software development project managers within large organizations are not aligned
with the relationship between performance expectancy, effort expectancy, social
influence, and facilitating conditions, as moderated by experience, with behavioral intent
to adopt continuous delivery.
The inability to adopt advanced software development practices restricts the
possibility of gaining market share and competitive advantage in the marketplace.
12
However, in a survey on adopting new technology, 78% of organizations were not
prepared to capitalize on emerging technology trends such as mobile device proliferation
and cloud platforms and solutions, and only 22% of organizations used advanced
practices consistently (Lesser & Ban, 2016). Additionally, 75% of software projects fail,
resulting in billions of dollars of lost capital and operational investment (Bishop et al.,
2018). Further research has shown that adopting software development advanced
practices to address emerging markets is a challenge because changes in social and
technical aspects of an organization are required (Claps et al., 2015).
Research has identified the benefits and challenges of the adoption of continuous
delivery requires more study to determine the specific organizational elements that
predict positive outcomes (Rodríguez et al., 2017). Although there are studies regarding
benefits, challenges, and maturity of continuous delivery, there have been no quantitative
studies that applied the UTAUT (Venkatesh et al., 2003) to project manager behavioral
intent to adopt continuous delivery. Additionally, there is literature associating
organizational change to continuous delivery exists, but there are few research studies on
how to help organizations adopt continuous delivery (Chen, 2015). Further, little is
known about manager preference concerning agile development methods (Bishop et al.,
2018). Therefore, I addressed behavioral intention of project managers in this study to
understand possible effects on continuous delivery adoption.
Purpose of the Study
The purpose of this quantitative, regression analysis study was to examine the
extent to which the unified theory of acceptance and use of technology (UTAUT;
13
Venkatesh et al., 2003)—with the independent variables of performance expectancy,
effort expectancy, social influence, and facilitating conditions—statistically relates to the
behavioral intent (dependent variable) to adopt continuous delivery for software
development project managers in software development organizations. The independent
variables were generally defined as the software development project manager’s
perception after comparing expectations of continuous delivery implementation and
actual continuous delivery implementation. The dependent variable, behavioral intent to
adopt, was generally defined as behavioral intent to adopt continuous delivery and was
statistically controlled in this study. A stepwise multiple linear regression analysis and
bivariate analysis were used to determine the strength and direction of independent and
dependent variable relationships.
Research Questions
The following research questions addressed the relationship between performance
expectancy, effort expectancy, social influence, and facilitating conditions (independent
variables), as moderated by experience, and behavioral intent to adopt continuous
delivery (dependent variable).
Research Question 1: What is the relationship between performance and
continuous delivery adoption?
H01: No statistically significant relationship exists between performance
expectancy and behavioral intent to adopt continuous delivery.
Ha1: A statistically significant relationship exists between performance
expectancy and behavioral intent to adopt continuous delivery.

14
Research Question 2: What is the relationship between effort expectancy and
continuous delivery adoption?
H02: No statistically significant relationship exists between effort expectancy and
behavioral intent to adopt continuous delivery.
Ha2: A statistically significant relationship exists between effort expectancy and
behavioral intent to adopt continuous delivery.
Research Question 3: What is the relationship between social influence and
continuous delivery adoption?
H03: No statistically significant relationship exists between social influence and
behavioral intent to adopt continuous delivery.
Ha3: A statistically significant relationship exists between social influence and
behavioral intent to adopt continuous delivery.
Research Question 4: What is the relationship between facilitating conditions and
continuous delivery adoption?
H04: No statistically significant relationship exists between facilitating conditions
and behavioral intent to adopt continuous delivery.
Ha4: A statistically significant relationship exists between facilitating conditions
and behavioral intent to adopt continuous delivery.
Research Question 5: How does experience moderate the relationship between
effort expectancy and behavioral intent to adopt continuous delivery?
H05: Experience has no moderating effect on the relationship between effort
expectancy and behavioral intent to adopt continuous delivery.

15
Ha5: Experience has a moderating effect on the relationship between effort
expectancy and behavioral intent to adopt continuous delivery.
Research Question 6: How does experience moderate the relationship between
social influence and behavioral intent to adopt continuous delivery?
H06: Experience has no moderating effect on the relationship between social
influence and behavioral intent to adopt continuous delivery.
Ha6: Experience has a moderating effect on the relationship between social
influence and behavioral intent to adopt continuous delivery.
Research Question 7: How does experience moderate the relationship between
facilitating conditions and behavioral intent to adopt continuous delivery?
H07: Experience has no moderating effect on the relationship between facilitating
conditions and behavioral intent to adopt continuous delivery.
Ha7: Experience has a moderating effect on the relationship between facilitating
conditions and behavioral intent to adopt continuous delivery.
Theoretical Foundation
The theoretical base for this study was Venkatesh et al.’s (2003) UTAUT (see
Figure 1) model. The UTAUT model includes performance expectancy, effort
expectancy, social influence, and facilitating conditions—as moderated by experience—
and age, gender, and voluntariness of use as factors influencing the behavioral intention
to adopt technology (Venkatesh et al., 2003). The UTAUT model is consistent with
understanding factors that affect behavioral intention to adopt technologies.

16
Figure 1. Unified theory of acceptance and use of technology (UTAUT). From “User
Acceptance of Information Technology: Toward a Unified View,” by V. Venkatesh, M.
G. Morris, G. B. Davis, and F. D. Davis, 2003, MIS Quarterly, 27(3), p. 447. Reprinted
with permission.
Venkatesh et al. (2003) created a survey for performance expectancy, effort
expectancy, social influence, facilitating conditions, and behavioral intent. In the current
study, experience, as a moderator of the relationship between effort expectancy, social
influence, and facilitating conditions, with behavioral intent to adopt continuous delivery,
were included. Use of experience as a moderator has been supported by previous research
on agile transformation (Gandomani & Nafchi, 2016). Moderators such as age, gender,
and voluntariness of use were not included in this study because there was evidence that
they have little or no effect on behavioral intent in studies related to continuous delivery
(Alotaibi, 2016; Shahin et al., 2017). Use behavior, as a dependent variable, was also not

17
included in this study because the property shared by all continuous practices was
continuous use, and continuous delivery is continuous by definition (Shahin et al., 2018).
Further, there was no need to determine actual usage once continuous delivery was
adopted (Walldén, Mäkinen, & Raisamo, 2016). The removal of use behavior required
changing the relationship of facilitating conditions, as an independent variable, to point to
behavioral intent instead.
There is evidence that modifications of the UTAUT model can be used in
different technology disciplines (Magsamen-Conrad, Upadhyaya, Joa, & Dowd, 2015).
Though facilitating conditions were not indicated as a predictor of behavioral intent in the
original UTAUT model (Venkatesh et al., 2003), facilitating conditions can be a predictor
of behavioral intent by executing a stepwise regression (Magsamen-Conrad et al., 2015).
The results of the stepwise regression indicated that facilitating conditions positively
predicted 24% of behavioral intent variance concerning mobile tablet use, indicating that
the change in relationship was valid for the purpose of this study. Use behavior, in the
original UTAUT model did not include examples of questions, so removing it does not
affect the original Cronbach alpha calculation of the model. Each survey question was
used to determine the effect of each contributing factor on the phenomenon of intent to
adopt continuous delivery that software development project managers experienced.
Multiple regression methods were used to determine which factors affect behavioral
intent to adopt continuous delivery.
18
Nature of the Study
The nature of this study was quantitative with regression analysis. The rationale
for the selection of quantitative methods was based on limited access to professional
project managers working in enterprise software-intensive companies. Quantitative
methods are scientifically objective, validate constructed theory, and are suited for a large
number of participants (Carr, 1994). Quantitative research helped validate the
relationship between the independent variables (performance expectancy, effort
expectancy, social influence, and facilitating conditions, as moderated by experience) and
the dependent variable (behavioral intention to adopt continuous delivery). Performance
expectancy is the degree to which a person perceives that using a specific system helps
them achieve higher job performance (Venkatesh et al., 2003). Effort expectancy is the
degree to which a person perceives the difficulty associated with using a specific system
(Venkatesh et al., 2003). Social influence is the degree to which a person perceives that
other important people encourage the use of a specific system (Venkatesh et al., 2003).
Facilitating conditions is the degree to which a person perceives that technical and
organizational help exists to support the use of a specific system (Venkatesh et al., 2003).
Behavioral intent to adopt continuous delivery was defined as the degree to which a
person intends to adopt continuous delivery practices.
The population for this study was a globally distributed group of English-
speaking project managers. The target population consists of 1,485,444 members in five
LinkedIn project management groups. The sample size for this study was 82 and is
described in more detail in Chapter 3. Participants included project managers working

19
with, or having worked with, continuous delivery systems in enterprise software solution
companies. Simple random sampling (de Mello, Da Silva, & Travassos, 2015), targeting
a random collection of project managers from organizations, was used to collect
responses. To determine the effects of the independent variables, as moderated by
experience, on the dependent variable, data were gathered from an online survey.
Quantitative analysis of this data, using multiple linear regression analysis (Cohen,
Cohen, West, & Aiken, 1983) and bivariate analysis, helped clarify how project
management behavior affects continuous delivery adoption and use.
Definitions
Throughout this document, I use the terms software development project manager
and project manager as well as and continuous delivery practices and continuous delivery
interchangeably. The terms continuous delivery and continuous deployment are
sometimes used synonymously in literature even though they are different disciplines
because they only differ by changing the final step of continuous deployment, manual
deployment to production, to automatic deployment to production in continuous delivery
(Chen, 2015; Chen, 2017; Laukkanen et al., 2018). In this study continuous deployment
and continuous delivery were used interchangeably where appropriate to point out
similarities and distinctions between them. Following are the operational definitions
associated with the variables identified in the hypotheses and model.
Agile software development (ASD): A contemporary software development
method that addresses uncertainty during the development cycle by removing time as a
20
factor and instead focusing on small, manageable changes that can be released iteratively
and continuously to customers (Drury-Grogan et al., 2017).
Continuous deployment: A DevOps practice that extends the continuous delivery
practice by automatically deploying new changes directly to production (Shahin et al.,
2018). Authors in the field of continuous practices often make no distinction between
continuous delivery and continuous deployment because continuous deployment only
changes deployment to production, the last step, from manual to automatic triggering.
Continuous delivery: A DevOps practice focused on keeping a software solution
in a releasable state at all time (Shahin et al., 2018). Again, authors in the field of
continuous practices often make no distinction between continuous delivery and
continuous deployment.
Continuous experimentation: A DevOps practice defined as the process of
continuously testing the value of features to organically evolve a software solution
(Lindgren & Münch, 2015).
Continuous integration: A DevOps practice whereby developers merge code into
a versioned source control repository on a daily, or more regular, frequency. Merging
new code triggers tasks that build and test using automation tools and scripts. Automating
the process of building and testing helps to ensure the consistency and reliability of the
code (Shahin et al., 2018)
Lean principles: A collection of principles that include (a) empowering the team,
(b) building integrity in, (c) seeing the whole, (d) deciding as late as possible, (e)
amplifying learning, and (f) eliminating waste (Mäkinen et al., 2016). These principles

21
traditionally applied to product manufacturing and have been extended to software
development with the introduction of agile software development.
Rapid release: The release cadence with which a software solution is released.
Rapid release indicates a software solution is released in weekly, daily, or more frequent
cycles (Karvonen et al., 2017).
Traditional release: The release rate for a software solution. Traditional release
indicates that a software solution is released in monthly or yearly cycles (Karvonen et al.,
2017).
Waterfall methodology: A software development method where each step in the
software development lifecycle (requirements gathering, design, development, testing,
localization, documentation, release) occurs in a sequential manner (Bishop et al., 2018).
Assumptions
The examination of a project manager’s behavior to adopt continuous delivery in
this study was based on several assumptions. First, the participation of all respondents
was voluntary. Second, each respondent had experience with agile software development
practices and continuous delivery. Third, the respondents answered each survey question
honestly and objectively, without influence and bias from management or other sources.
Fourth, the population of respondents was large enough to provide a statistically
significant depiction of behavioral intention to adopt continuous delivery in enterprise
agile software development organizations. The assumptions presented were essential to
provide a common understanding of the respondent’s motivations and environment.
These assumptions helped ensure the credibility and dependability of this study.

22
Scope and Delimitations
The purpose of this quantitative, regression analysis study was to test the
independent variables of the UTAUT (Venkatesh et al., 2003) with behavioral intent to
adopt continuous delivery for software development project managers in large software
development organizations. Small and medium software development organizations were
not included. Experience was included as a moderator, and age, gender, and voluntariness
were excluded moderators because of evidence suggesting that they do not have
statistically significant effects (Alotaibi, 2016; Shahin et al., 2017). Use behavior was not
included as a dependent variable because evidence suggested that it was redundant and
was a subjective self-measurement (Shahin et al., 2018; Walldén et al., 2016). The
removal of use behavior required changing the relationship of facilitating conditions, as
an independent variable, to point to behavioral intent. Facilitating conditions have
positively predicted 24% of behavioral intent variance concerning mobile tablet use
(Magsamen-Conrad et al., 2015), indicating that the change in relationship was valid for
the purpose of this study. Project managers for domains other than software development
were also excluded. Responses from project managers participating in open-source
projects may be included in the results due to the prevalence of open-source projects in
large enterprise organizations.
A survey was adapted from Venkatesh et al. (2003) to suit the purpose and
participant pool of this study. Project-specific information such as size, duration, and
location were also collected. The quantitative survey instrument utilized to collect data
from project managers may be used by other researchers studying human and technical

23
factors involved with technology adoption. The survey was distributed online to LinkedIn
project management group members over the age of 18 for 4 weeks to maximize
participation.
In addition to the survey that was used in this study, peer-reviewed literature on
continuous delivery adoption and agile project management from the past 5 years was
gathered and analyzed to help analyze the data collected and produce a conclusion.
Research in the area of agile project management as it relates to continuous delivery was
limited. However, project management in the broader spectrum of agile software
development was widely researched and provided support where necessary.
Limitations
The online survey was offered in English-only, which may prevent participation
from project managers located in specific regions. Given the globally distributed nature
of most large enterprise agile software development organizations and the communicative
aspects of a project manager’s roles and responsibilities, English-only participation was a
limitation but not a prohibitive factor. The language limitation may reduce the
generalization of survey results to some degree.
The online survey targeted enterprise software solution project managers, which
exclude project managers in small and medium businesses and open-source projects
associated with entrepreneurs and non-profit organizations. The limitation of enterprise
software solution project managers was intended to attract professional project managers
with varying levels of experience in their domain. Similar to the English-only restriction

24
of the survey, the project manager scope limitation may also reduce the generalization of
findings.
Significance of the Study
The significance of this study includes adding to the existing body of knowledge
on adopting continuous delivery as it pertains to a single organizational role, project
managers. Project managers may use the findings of this study to help them adopt
continuous delivery and further achieve improvements such as increased project
predictability, increased customer satisfaction, and improved software release reliability
and quality (Laukkanen et al., 2017), increasing project efficiency. Research has reflected
that project managers who increased project efficiency realized a 20% software
development cost savings (Ebert et al., 2016). There is also evidence that continuous
practices can affect project efficiency, so this study may provide the knowledge and
support for project managers to more effectively adopt continuous delivery to impact
project efficiency, improve profitability, and gain competitive advantage.
Significance to Practice
Organizational structure affects behavioral intention to adopt continuous delivery
(Chen, 2017; Lustenberger, 2016). It is important to create a collaborative organizational
culture in place of a traditional hierarchal structure (Chow & Cao, 2008; Stankovic,
Nikolic, Djordjevic, & Cao, 2013). After organizations have adopted continuous delivery,
they have experienced improved software quality, improved collaboration, better lines of
communication, and an increase in the number of implemented features per software
product release, among many other benefits (Riungu-Kalliosaari, Mäkinen, Lwakatare,

25
Tiihonen, & Männistö, 2016). Evidence-based information regarding how performance
expectancy, effort expectancy, social influence, and facilitating conditions, as moderated
by experience, affect behavioral intent to adopt continuous delivery holds significance to
practice, as it may improve awareness, alignment, and reduce the time and cost associated
with adopting a continuous delivery system (Chen, 2017). Studying the effects of these
factors may improve project managers’ awareness of how they influence continuous
delivery adoption efforts, which may provide greater project efficiency and increase the
competitive advantage of their companies.
Significance to Theory
The UTAUT has been implemented over 1,200 times in more than 50 different
journals and has been integrated with other models or extended more than 60 times
(Venkatesh, Thong, & Xu, 2016). Yet there are no studies that apply the theory to
behavioral intention to adopt continuous delivery. For example, Laukkanen et al. (2017)
suggested that organizational and human challenges, within the context of continuous
delivery adoption, could be analyzed with general theories of organizational change like
Venkatesh et al.’s (2003) UTAUT model. Studying the constructs of the UTAUT with
behavioral intent to adopt continuous delivery practices holds significance to theory
because it will add to the body of knowledge concerning the validity of the UTAUT
model (Venkatesh et al., 2003).
Significance to Social Change
Software solutions empower people to make social change by providing users
with tools to solve complex problems in a faster, more efficient way. Determining how

26
differences in performance expectancy, effort expectancy, social influence, and
facilitating conditions, as moderated by experience, affect behavioral intent to adopt
continuous delivery may provide software development project managers with the
information needed to promote organizational change. The knowledge has significance to
social change, as it may help organizations develop operational efficiency, effectiveness,
and generate greater value to their clients and society.
Summary and Transition
Chapter 1 introduced the background of continuous delivery and problem that
some project managers are not aligned with the relationship between performance
expectancy, effort expectancy, social influence, and facilitating conditions and behavioral
intent to adopt continuous delivery. Research on continuous delivery and project
management reflects a lack of research in agile project managers’ attitudes and behaviors
on introducing continuous delivery practices. This chapter also included the research
questions, theoretical foundation, definitions of terms, assumptions, scope, limitations,
and significance of the study.
Chapter 2 contains a literature review of peer-reviewed journal articles over the
previous 5 years to add support to the methods used to examine continuous delivery and
project management. In addition to information on continuous delivery and project
management, the literature search strategy and an explanation of the theoretical
foundation are presented. Chapter 3 presents the research design and rationale,
explanation of methods used to collect and analyze participant responses, and discussion
of validity considerations. Chapter 4 is focused on reporting of survey data results,

27
analysis of data collected, and discussion of validity. Chapter 5 includes the interpretation
of findings, limitations of the study, future research considerations, and a conclusion.

28
Chapter 2: Literature Review
Introduction
This study addressed the problem that some software development project
managers in large organizations are not aligned with the relationship between
performance expectancy, effort expectancy, social influence, and facilitating conditions,
as moderated by experience, with behavioral intent to adopt continuous delivery. The
purpose of this quantitative, regression analysis study was to examine the statistical
relationships between the independent variables from the UTAUT (performance
expectancy, effort expectancy, social influence, and facilitating conditions, as moderated
by experience) and the dependent variable (behavioral intent to adopt continuous
delivery) for software development project managers at large software development
organizations. I used the UTAUT because although it has been applied in many studies, it
has not been applied to behavioral intent to adopt continuous delivery (Venkatesh et al.,
2003). This choice was also supported by previous research indicating that traditional
technology acceptance models like the information system development acceptance
model (Hardgrave & Johnson, 2003) and the UTAUT (Venkatesh et al., 2003) could be
adapted, extended, and applied to contemporary practices such as continuous delivery
(Laukkanen et al., 2017; Masombuka & Mnkandla, 2018).
This study addressed several gaps in the knowledge regarding continuous delivery
adoption. Organizations that have adopted continuous delivery have reported benefits
such as accelerated time to market, effective feature creation, and improved efficiency
and productivity (Chen, 2015). Additionally, findings have indicated that continuous
29
delivery is beneficial to improving project efficiency and project managers have
influence over continuous delivery adoption (Banerjee, 2016; Bishop et al., 2018; Chen,
2015, 2017; Taylor, 2016; Shahin et al., 2018). Further, project efficiency has been
associated with lower cost and may lead to improved software quality (Parnin et al.,
2017), which may promote competitive advantage (Rodríguez et al., 2017). However,
challenges need to be addressed with control over continuous delivery adoption, which is
primarily management related (Chen, 2017). A review of research related to project
management and adoption of continuous delivery reflected project manager behavioral
intent to adopt continuous delivery lacked research. Thus, this study was necessary to
examine adoption of continuous delivery by software delivery teams and its effect on
project efficiency that may lead to competitive advantage.
Chapter 2 includes the literature search strategy, a discussion of the theoretical
foundations, and a comprehensive literature review. The literature review includes a
summary and synthesis of the research in the areas of the UTAUT, traditional and agile
project management, and continuous delivery from the past 5 years. Chapter 2 concludes
with a chapter summary and a transition to Chapter 3.
Literature Search Strategy
Articles selected for this literature review were related to project mangers’
behavioral intent to adopt continuous delivery within large, agile software development
organizations. The keywords searched were continuous delivery, continuous integration,
continuous deployment, agile project management, project management, agile software
development, DevOps, and adoption as well as application of Venkatesh et al.’s (2003)

30
UTAUT model in the databases ACM Digital Library, IEEE Xplore Digital Library,
Computers and Applied Sciences Complete, SpringerLink, Science Direct, EBSCO
Academic Search Premier, Google Scholar, ProQuest Dissertations & Theses Global, a
Thoreau multi-database search, and a search through peer-reviewed engineering and
project management related journals. The search included peer-reviewed journal articles,
conference proceedings, seminal literature, books, and dissertations from 2014 to 2019.
Most of the literature discovered surrounding continuous delivery adoption was
focused on qualitative case study research, which was not the design of this study. The
literature search for articles focused on the application of Venkatesh et al.’s (2003)
UTAUT model in the field of agile software development yielded more than 400 results.
However, fewer than 10 articles of the 400 were focused on continuous delivery in the
field of IT, and the UTAUT was mentioned seldom in the articles found. The lack of
quantitative, peer-reviewed articles addressing the application of UTAUT to behavioral
intent to adopt continuous delivery by project managers in large enterprise organizations
was one reason why a quantitative study on this subject was essential. During the
literature search process, it was necessary to go back further than 5 years to discover why
the number of UTAUT-related studies in the field of agile software development were
lacking. I also altered the literature search strategy to include peer-reviewed articles
related to combining UTAUT with additional independent variables and moderators such
as quality of service and education (Alotaibi, 2016), convenience from online access
(Chauhan & Jaiswal, 2016), competitive advantage (Wagaw, 2017), hindrances such as
perceived security (Alsmadi & Prybutok, 2018), and articles related to unaltered use of

31
TAM-based methods to gain further understanding of the deficiency (Davis, 1989;
Magsamen-Conrad et al., 2015; Walldén et al., 2016).
Theoretical Foundation
The theoretical base for this study was Venkatesh et al.’s (2003) UTAUT. The
UTAUT includes performance expectancy, effort expectancy, social influence, and
facilitating conditions, as moderated by experience, as factors influencing the behavioral
intent to adopt technology. The UTAUT model was consistent with understanding factors
that affect behavioral intention to adopt technologies.
Venkatesh et al. (2003) based the UTAUT model on a review and synthesis of
eight previously defined acceptance models, which include:
• Theory of reasoned action (Fishbein & Ajzen, 1975),
• TAM (Davis, 1989) and TAM2 (Venkatesh & Davis, 2000),
• Theory of planned behavior (Ajzen, 1991),
• Motivational model (Davis, Bagozzi, & Warshaw, 1992),
• Combined TAM (Davis, 1989) and theory of planned behavior (Ajzen, 1991;
Taylor & Todd, 1995),
• Model of PC utilization (Thompson, Higgins, & Howell, 1991),
• Innovation diffusion theory (Rogers, 1995) developed and introduced in 1962
and then applied to individual technology acceptance by Moore and Benbasat
(1991), and
• Social cognitive theory (Bandura 1986) as applied to computer utilization by
Compeau and Higgins (1995).

32
Venkatesh et al. (2003) executed a 6-month longitudinal study collecting information
from four different organizations at three different intervals. The UTAUT was
constructed using the four major determinants of behavioral intention and use behavior
common to the eight models analyzed, which accounted for 17 to 53% of variance found
in a user’s behavioral intent to adopt IT (Venkatesh et al., 2003). Venkatesh et al.
included four moderators: (a) age, (b) gender, (c) experience, and (d) voluntariness of
use. I applied the UTAUT to examine the behavioral intention to adopt continuous
delivery by project managers in software intensive organizations.
It was necessary to make modifications to the UTAUT used in this study.
Research indicated a decline in the use of methods derived from the technology
acceptance model (TAM; Davis, 1989) like UTAUT due to the diametric alignment of
behavioral intent and use behavior of IT (Walldén et al., 2016). For example, Turner,
Kitchenham, Brereton, Charters, and Budgen (2010) stated that behavioral intent based
on perceived usefulness and perceived ease of use did not align with actual use behavior.
Turner et al. also posited that TAM-based instruments like the UTAUT were not good
predictors of actual use behavior because these models use subjective, self-reported
measurement of use behavior without the support of objective measurement validation
(see also Walldén et al., 2016). Objective measurement includes items such as application
logs to validate actual use of IT (Turner et al., 2010). Further, because the UTAUT is a
general technology acceptance theory, the use of the model in environments where
mandatory use of technology is implicit reduces predictive strength (Evwiekpaefe &
Haruna, 2018). In the current study, although adoption of continuous delivery was not
33
mandatory, use behavior of continuous delivery is implicit because it is continuous by
nature, so it was possible that the UTAUT would not offer effective predictions.
Therefore, I made modifications to the UTAUT in this study based on suggestions in the
research (Dwivedi, Rana, Jeyaraj, Clement, & Williams, 2017; Evwiekpaefe & Haruna,
2018). Evwiekpaefe and Haruna (2018) suggested combining the UTAUT model with
other domain-specific models to improve the explanation of variances.
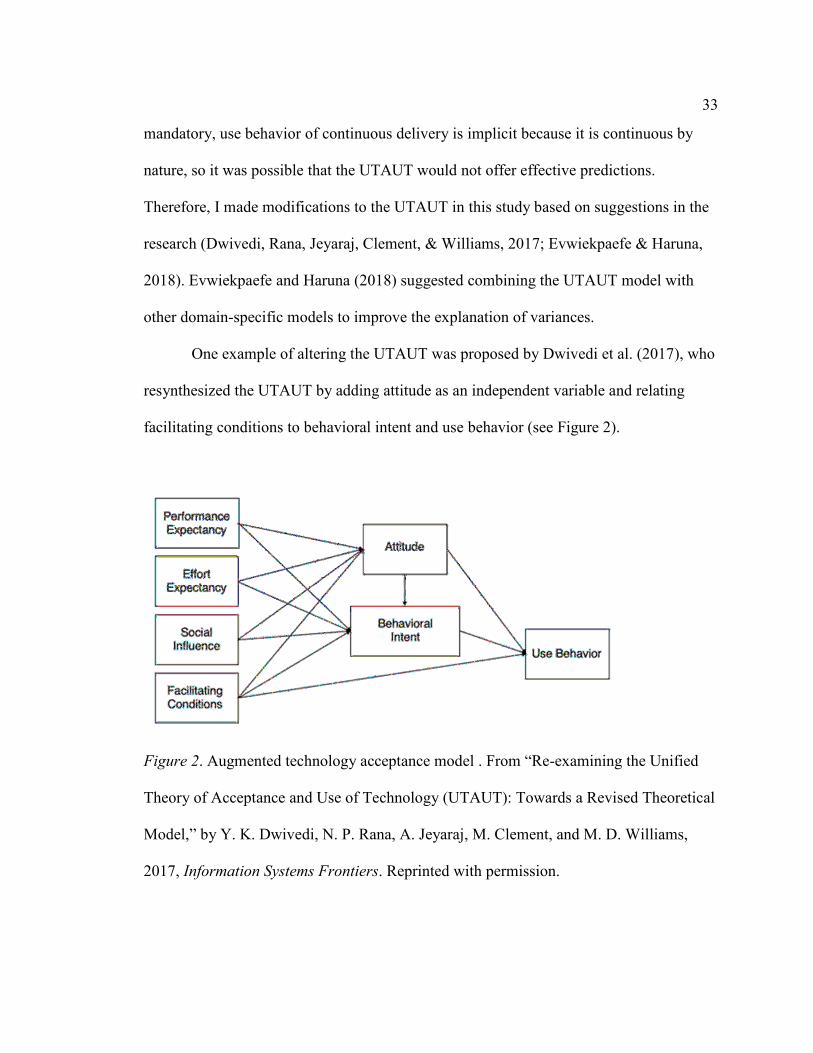
One example of altering the UTAUT was proposed by Dwivedi et al. (2017), who
resynthesized the UTAUT by adding attitude as an independent variable and relating
facilitating conditions to behavioral intent and use behavior (see Figure 2).
Figure 2. Augmented technology acceptance model . From “Re-examining the Unified
Theory of Acceptance and Use of Technology (UTAUT): Towards a Revised Theoretical
Model,” by Y. K. Dwivedi, N. P. Rana, A. Jeyaraj, M. Clement, and M. D. Williams,
2017, Information Systems Frontiers. Reprinted with permission.

34
Preceding technology acceptance models such as theory of reasoned action (Fishbein &
Ajzen, 1975) and theory of planned behavior (Ajzen, 1991) also included attitude as an
independent variable; however, suggesting relationships between facilitating conditions
and behavioral intent was a new alteration to the UTAUT. In addition to the inclusion of
attitude as a construct, Dwivedi et al. proposed other changes to the UTAUT by relating
performance expectancy, effort expectancy, social influence, and facilitating conditions,
as moderated by experience, to attitude as well as relating attitude to use behavior, which
meant that attitude and behavioral intent were similar constructs.
Assumptions
An additional assumption that was necessary in modifying the use of the UTAUT
was that actual use, also known as use behavior, specific to continuous delivery was not a
property that required objective measurement such as inspection of continuous delivery
access logs, because once adopted, continuous delivery is continuously used. The
property shared by all continuous practices was the basic continuous use required, and
continuous delivery is continuous by definition (Shahin et al., 2018). Thus, there was no
need to determine usage once continuous delivery was adopted (Walldén et al., 2016).
Use behavior, as a dependent variable, was therefore not included in this study.
Similar Applications
The research on UTAUT application to technologies created for specific
disciplines has included many examples similar to this study’s examination of project
management adoption of continuous delivery. The disciplines of mobile tablets
(Magsamen-Conrad et al., 2015), document workflow management systems (Mosweu,

35
Bwalya, & Mutshewa, 2016), and mobile technologies use in knowledge transfer by
employees (Kuciapski, 2017) contained a resurgence of nonaugmented UTAUT. The
disciplines of enterprise resource planning (ERP) software training (Chauhan & Jaiswal,
2016), homegrown ERP systems (Wagaw, 2017), and Software as a Service (Alotaibi,
2016) contained augmented UTAUT models. These studies were focused on domains
requiring continuous change and improvement to store or communicate emergent and
relevant information that are similar to continuous delivery. The Literature Review
section of this chapter includes several examples of applying modified and unmodified
UTAUT models to technology acceptance in specific domains of research.
Model Selection Rationale
The UTAUT measures human and technical factors that affect technology
adoption and use (Venkatesh et al., 2003). The UTAUT was a suitable method for
studying an enterprise software-intensive business project manager’s behavioral intent of
adopting continuous delivery because it was consistent with examining changes in
software development team structure and objectives that depend on human factors
(Amrit, Daneva, & Damian, 2014). The research indicated an interest in understanding
the technical and social drivers behind technical adoption and use in the field of software
development to support the intersection of the UTAUT and project management behavior
(Amrit et al., 2014).
Agile software development was another area of significant research in the peer-
reviewed literature that supports the purpose and selected model of this study. For
example, Fowler and Highsmith (2001) stipulated that agile software development

36
principles encourage collaboration over documentation. Subramanian et al. (2018)
expanded on Fowler and Highsmith by contending that agile software development
principles reinforce self-forming, self-managing, continuously evolving teams to
conceive, produce, and support continuous improvement of software solutions
collaboratively. There are also many obstacles that come with nonagile principles, as
organizations charged with designing systems are constrained to design systems that
emulate the communication structure of the organization, which can lead to
communication gaps in noncollaborative environments like those defined by traditional
software management methods (Conway, 1968). However, agile software development
principles encourage collaboration over documentation (Fowler & Highsmith, 2001;
Subramanian et al., 2018). Project managers in enterprise software development
businesses facilitate the human interaction within a software development team, using
systems, tools, and methods to build collaboration, trust, and culture (Kukreja, Ahuja, &
Singh, 2018). Project managers’ behavioral intent to adopt continuous delivery may
affect the adoption of a continuous delivery system, may overcome organizational
constraints, provide greater project efficiency, and support gains in competitive
advantage. Thus, I used the UTAUT as the theoretical foundation of this study.
Research Question Importance
The UTAUT includes constructs such as performance expectancy, effort
expectancy, social influence, and facilitating conditions, as moderated by experience, and
their relationship to behavioral intent to adopt technology (Venkatesh et al., 2003). The
research questions and hypotheses in this study embodied the scope required to examine
37
the effects each of the four independent variables, as moderated by experience, have on
behavioral intent to adopt technology such as continuous delivery by project managers in
enterprise software solution intensive businesses. Recent studies have indicated that the
UTAUT alone was not an accurate predictor of IT acceptance and use (Walldén et al.,
2016). Thus, I used an augmented UTAUT to answer the research questions by
examining behavioral intent to adopt continuous delivery, which will add to the body of
knowledge on the effects of technical and social factors on continuous delivery adoption.
Answering the research questions of this study may provide support to future use of the
UTAUT to examine new technologies such as continuous delivery.
Literature Review
I examined the behavioral intentions of project managers to adopt continuous
delivery using measurement of the independent variables of the UTAUT (Venkatesh et
al., 2003). The following literature review provides information regarding peer-reviewed
articles and studies related to UTAUT, continuous delivery, and traditional and agile
project management. The constructs and methodology of each reviewed study are broken
down separately and then synthesized to provide the rationale for the approach and
analysis used in this study.
Unified Theory of Acceptance and Use of Technology (UTAUT)
In 2003 Venkatesh et al. published the UTAUT. The UTAUT model (see Figure
1) uses performance expectancy, effort expectancy, social influence, and facilitating
conditions, as moderated by experience, as independent variables. The following analysis
provides information regarding the relationships between the independent and dependent
38
variables of the UTAUT. Performance expectancy, effort expectancy, facilitating
conditions, and social influence effect behavioral intention and behavioral intent and
facilitating conditions effect use behavior (Venkatesh et al., 2003). Performance
expectancy is the degree to which a person perceives that using a specific system helps
them achieve higher job performance (Venkatesh et al., 2003). Effort expectancy is the
degree to which a person perceives the difficulty associated with using a specific system
(Venkatesh et al., 2003). Social influence is the degree to which a person perceives that
other important people encourage the use of a specific system (Venkatesh et al., 2003).
Facilitating conditions is the degree to which a person perceives that technical and
organizational support exists to support the use of a specific system (Venkatesh et al.,
2003). The dependent variables, behavioral intent and use behavior, are the degree to
which a person intends to use and uses a system respectively.
UTAUT moderators. UTAUT includes four moderators: (a) gender, (b) age, (c)
experience, and (d) voluntariness of use (Venkatesh et al., 2003). The following analysis
provides more information on how the moderators interact with the independent variables
of the UTAUT model. Gender can moderate the effects of performance expectancy, effort
expectancy, and social influence as they relate to behavioral intention. An example of
how gender differences can inform the independent variables of the UTAUT model was
evidenced by young males who tend to be more interested in how technology can help
them perform in a job or at a task. Gender was not a significant influence in the body of
knowledge concerning adoption of technology and therefore was not included as a
moderator in this study.
39
Age can also moderate the effects of performance expectancy, effort expectancy,
and social influence as they relate to behavioral intention and facilitating conditions, as
moderated by experience, as it relates to use behavior (Venkatesh et al., 2003). The
influence of age on certain constructs of the UTAUT model was demonstrated by older
individuals that may be less likely to accept new technologies. Age was not included as a
moderator in this study because there are recent studies such as Alotaibi (2016) that
indicated generation gaps are not a factor in influencing behavioral intent to adopt
technology.
Experience was another factor that can moderate effort expectancy, as moderated
by experience, and social influence, as moderated by experience, as they relate to
behavioral intention and facilitating conditions, as moderated by experience, as it relates
to use behavior (Venkatesh et al., 2003). Experience was included as a moderator in this
study as evidence exists in the body of knowledge suggesting it effects predictive
strength of the UTAUT model as it relates to effort expectancy, social influence, and
facilitating conditions.
In this study use behavior was not included as a dependent variable, therefore,
facilitating conditions, as moderated by experience, was related to behavioral intent to
adopt continuous delivery. Magsamen-Conrad et al. (2015) acknowledged that
facilitating conditions was also not used as a predictor of behavioral intent in the original
UTAUT model (Venkatesh et al., 2003). Magsamen-Conrad et al. indicated facilitating
conditions positively predicted 24% of behavioral intent variance. In addition to the
findings by Magsamen-Conrad et al., evidence of experience informing certain constructs

40
of the UTAUT model was shown when experience increases, individuals are more likely
to accept new technologies.
In addition to age, gender, and experience, voluntariness of use may demonstrate
a moderating effect on social influence as it relates to behavioral intention (Venkatesh et
al., 2003). According to Venkatesh et al., when individuals are not mandated to use new
technology, they are more likely to accept it. Continuous delivery use was a requirement
of participants in this study and therefore voluntariness of use was not examined as a
moderator herein.
This study used only one of the dependent variables, behavioral intention, as it
related to the adoption of continuous delivery in large enterprises by project managers.
Use behavior was not used in this study because once adopted, continuous delivery runs
continuously, therefore it was not necessary to measure its use subjectively or
objectively. Experience, as a moderator, was also examined and analyzed for the
moderating effects on the independent variables as they affect their relationship to the
dependent variable. The following sections contain analysis and synthesis of the current,
peer-reviewed literature in the body of knowledge related to UTAUT (Venkatesh et al.,
2003), continuous delivery, and traditional and agile project management.
UTAUT Research in Information Technology
The literature review included five different studies that applied the UTAUT
model (Venkatesh et al., 2003) to specific areas of study within the technology
acceptance domain. All five studies focused on technologies used in inter-related
domains and were analyzed and synthesized in this section to gain a greater
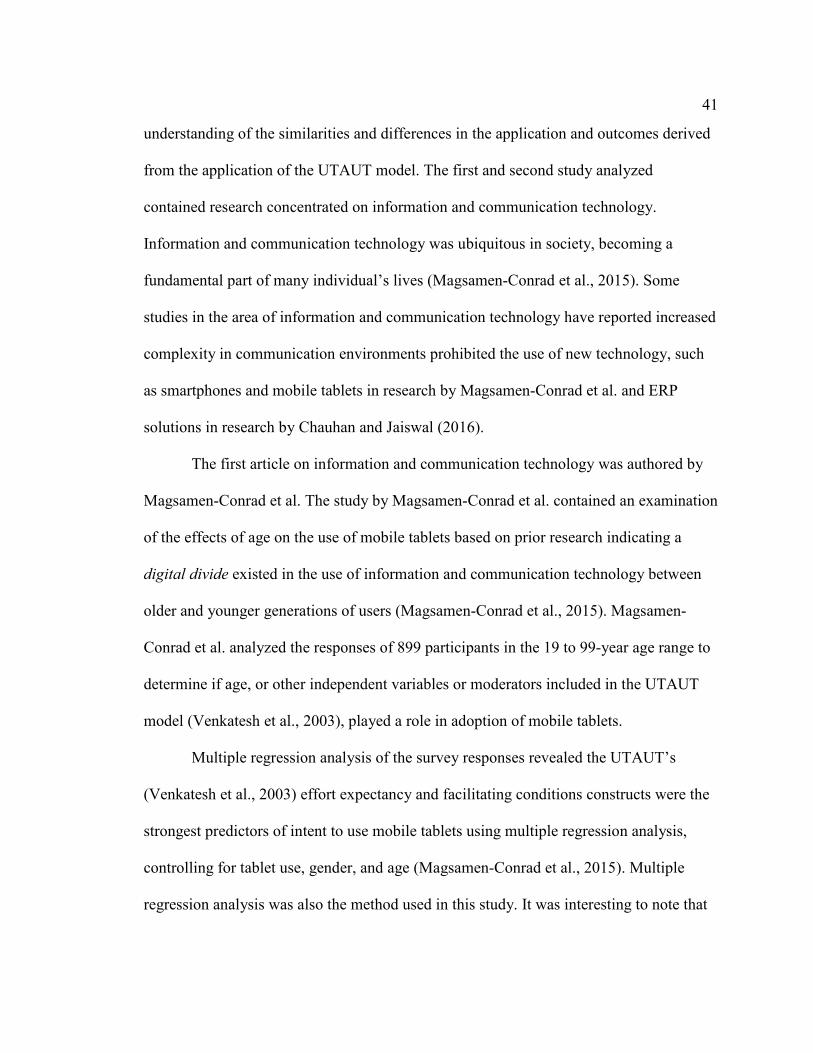
41
understanding of the similarities and differences in the application and outcomes derived
from the application of the UTAUT model. The first and second study analyzed
contained research concentrated on information and communication technology.
Information and communication technology was ubiquitous in society, becoming a
fundamental part of many individual’s lives (Magsamen-Conrad et al., 2015). Some
studies in the area of information and communication technology have reported increased
complexity in communication environments prohibited the use of new technology, such
as smartphones and mobile tablets in research by Magsamen-Conrad et al. and ERP
solutions in research by Chauhan and Jaiswal (2016).
The first article on information and communication technology was authored by
Magsamen-Conrad et al. The study by Magsamen-Conrad et al. contained an examination
of the effects of age on the use of mobile tablets based on prior research indicating a
digital divide existed in the use of information and communication technology between
older and younger generations of users (Magsamen-Conrad et al., 2015). Magsamen-
Conrad et al. analyzed the responses of 899 participants in the 19 to 99-year age range to
determine if age, or other independent variables or moderators included in the UTAUT
model (Venkatesh et al., 2003), played a role in adoption of mobile tablets.
Multiple regression analysis of the survey responses revealed the UTAUT’s
(Venkatesh et al., 2003) effort expectancy and facilitating conditions constructs were the
strongest predictors of intent to use mobile tablets using multiple regression analysis,
controlling for tablet use, gender, and age (Magsamen-Conrad et al., 2015). Multiple
regression analysis was also the method used in this study. It was interesting to note that

42
Magsamen-Conrad et al. diverged from Venkatesh et al., Chauhan and Jaiswal’s (2016)
study on ERP training adoption, and this study’s design by using facilitating conditions as
a predictor of behavioral intent. The suggested change in the relationship between
facilitating conditions to behavioral intent instead of facilitating conditions to use
behavior conceived by Magsamen-Conrad et al. provided evidence that modifications of
the UTAUT model can be used in different technology disciplines. Magsamen-Conrad et
al. acknowledged that facilitating conditions was not indicated as a predictor of
behavioral intent in the original UTAUT model and cited prior research that discovered
facilitating conditions can be a predictor of behavioral intent by executing a stepwise
regression. The results of the stepwise regression indicated facilitating conditions
positively predicted 24% of behavioral intent variance concerning mobile tablet use,
indicating that the change in relationship was valid for the purpose of their study and this
study.
In addition to facilitating conditions, performance expectancy and social influence
were found not to be significant predictors of behavioral intent to use mobile tablets
(Magsamen-Conrad et al., 2015). Magsamen-Conrad et al. concluded that differences in
intention to use tablets existed between older generations, referred to as builders, and
younger generations, referred to as boomers. The study reflected that age significantly
moderated the effects of the independent variables on behavioral intent to use mobile
tablets and was interpreted to mean boomers were more intent on using mobile tablets as
compared with builders.

43
Magsamen-Conrad et al.’s study was important because it validated age as a
moderator in the examination of behavioral intent to use technology, however, this study
does not address generation gaps and therefore does not include age as a moderator.
Magsamen-Conrad et al.’s study was significant because it may help develop training
targeting the reduction of the digital divide phenomenon, that different generations
experience, by lowering the barrier to entry required to use mobile tablets. Digital divide
was not evidenced in the body of knowledge pertaining to continuous delivery and
therefore age may not moderate the behavioral intent to adopt continuous delivery
examined in this study.
The study by Magsamen-Conrad et al. (2015) was also important because they
acknowledged that cited studies reported use behavior of technology was not always
applicable in cases where technology was created for a specific use case such as mobile
tablets. Continuous delivery may also be viewed as a technology that was created for a
specific use case and this study does not include use behavior, however, Chauhan and
Jaiswal (2016) did not report this as a factor. In addition removing use behavior as a
dependent variable, Magsamen-Conrad et al. also explained that limitations such as non-
longitudinal duration and network quota sampling might have affected their findings and
were also identified as a limitation of this study. Magsamen-Conrad et al.’s research
additionally supports this study because they did not add independent variables to the
application of the UTAUT model (Venkatesh et al., 2003).
The second study in the area of information and communication technology that
was analyzed was executed by Chauhan and Jaiswal (2016) that examined adoption of

44
ERP software training in India business schools using Venkatesh et al.’s UTAUT model
(2003). Chauhan and Jaiswal differed from Magsamen-Conrad et al.’s (2015) conceptual
framework by preserving the relationship between facilitating conditions and use
behavior found in the original UTAUT model. This study did not preserve the
relationship between facilitating conditions and use behavior.
Chauhan and Jaiswal posited that training on ERP systems in India business
schools assisted individual’s pursuit of a profitable career, however, there may be a
problem in realizing this aspiration as evidenced by employers that have raised concerns
regarding a university’s capability to adequately train students in ERP concepts that align
with industry expectations (Chauhan & Jaiswal, 2016). Chauhan and Jaiswal applied the
UTAUT model (Venkatesh et al., 2003) to a quantitative survey of 324 business students
using multi-group structured equation modeling in an attempt to determine the causes of
perceived misalignment of expectations between ERP education and the ERP industry.
Unlike Magsamen-Conrad et al.’s (2015) conceptual framework, Chauhan and
Jaiswal (2016) supplemented the UTAUT model (Venkatesh et al., 2003) by including
convenience from online access and innovativeness in IT as independent variables that
may affect behavioral intention. Inclusion of the two new constructs was validated by
testing with Cronbach’s alpha on a piloted, 25 question survey. Cronbach’s alpha ranges
were acceptable for the addition of convenience from online access and innovativeness in
IT independent variables and were therefore included for analysis and interpretation
(Chauhan & Jaiswal, 2016). Chauhan and Jaiswal also included gender and experience as
moderators, which differed from Magsamen-Conrad et al.’s study by excluding age as a

45
moderator, arguing that age was within a fixed range inside a university setting. Age was
not fixed in enterprise software development, however, there was no evidence that there
was a difference in continuous delivery implementation across generation gaps in the
body of knowledge and therefore it is not be examined in this study. The inclusion of
experience by Chauhan and Jaiswal, as a moderator, was a reason why it was included in
this study. Chauhan and Jaiswal also diverted from the original UTAUT model by not
including voluntariness as a moderator because the students are matriculated into a
university and therefore are already complicit in the consumption of offered educational
programs. The following discussion reflects the detailed information concerning the
findings included in the Chauhan and Jaiswal study.
Chauhan and Jaiswal reported that convenience from online access,
innovativeness in IT, performance expectancy, and effort expectancy positively predicted
a student’s behavioral intent to use ERP training software. Performance expectancy and
effort expectancy had the strongest relationship with behavioral intent to use ERP
training software and facilitating conditions and behavioral intent were predictors of use
behavior of ERP training software (Chauhan & Jaiswal, 2016). Unlike Magsamen-
Conrad et al. (2015), Chauhan and Jaiswal discovered social influence was the only
construct that was not a predictor of behavioral intention to use ERP training software
among business school students, which was contrary to existing literature in the e-
learning body of knowledge. In addition to the independent variables, analysis of
moderators such as gender differences reflected female’s behavioral intent to use ERP
training software was higher than males when measuring the effects of convenience from

46
online access and effort expectancy; whereas social influence and performance
expectancy remained unaffected (Chauhan & Jaiswal, 2016). Experience moderated
effort expectancy, revealing those with some experience had stronger behavioral intent to
use ERP training systems that required less effort as compared to individuals with more
experience (Chauhan & Jaiswal, 2016). This study was not focused on continuous
delivery training and therefore gender was not included as a moderator, however,
moderation by experience was a factor supported by Shahin et al. (2017) and Alotaibi
(2016) that may moderate the behavioral intent to adopt continuous delivery examined.
Chauhan’s and Jaiswal’s study was an important contribution to the body of
knowledge because students invest time and money into university programs hoping to
secure gainful employment upon graduation, trusting that programs are aligned with
industry expectations. Individuals may not qualify for employment if programs centered
on training business students to use ERP systems are not aligned with industry
requirements (Chauhan & Jaiswal, 2016). Investing time and money into project manager
training to improve social skillsets, which can therefore support technical advancements
such as continuous delivery adoption was a similar concept researched in this study. The
study concluded that improving course content and focusing on areas of online access
and effort expectancy may help business schools and vendors produce better-qualified
candidates for careers in ERP (Chauhan & Jaiswal, 2016). One interesting reflection on
Magsamen-Conrad et al. (2015) and Chauhan and Jaiswal was the difference in their
conceptual frameworks and methods of analysis, however, both works collectively extend
the information and communication technology body of knowledge in the same direction

47
by suggesting the need for additional training to overcome adoption impediments in the
information and communication technology domain and demonstrating the adaptability
and applicability of the UTAUT model (Venkatesh et al., 2003). Submitting this study to
the body of knowledge concerned with continuous delivery adoption may help support
other researchers in a similar manner.
Chauhan and Jaiswal (2016) differed from Magsamen-Conrad et al. (2015) in
ways other than moderators and relationships. Chauhan and Jaiswal explained limitations,
different than Magsamen-Conrad et al., existed in generalizing findings due to constraints
such as English-only participants and disqualification of participants from schools
unrelated to business. This study included an English-only survey and therefore had have
similar constraints. Chauhan and Jaiswal’s study was otherwise well constructed but
lacked enough peer-reviewed citation to explain and interpret results thoroughly.
In a study similar to Chauhan and Jaiswal (2016) on ERP training, Wagaw
examined a different aspect of ERP systems by examining the adoption of homegrown
ERP systems in Ethiopia using Venkatesh et al.’s UTAUT model (2003). ERP systems
provide a combined view of all functions and processes a business performs using one
software solution (Wagaw, 2017). According to Wagaw, commercial off-the-shelf ERP
systems do not consistently align with all business data, processes, and functions vital for
all businesses, internally developed, or homegrown, ERP systems can be a better fit in
some cases, another alignment challenge. Wagaw included a population of 324
participants, assumed Ethiopian, ranging between 31 to 40 years of age. Wagaw utilized
the UTAUT model and the Pearson product-moment correlation coefficient to analyze

48
the participant’s responses and therefore provided support to the use of Pearson product-
moment correlation coefficient in this study.
Similar to Chauhan and Jaiswal (2016), but different from Magsamen-Conrad et
al. (2015), Wagaw (2017) adapted the UTAUT model (Venkatesh et al., 2003) to their
domain of study by adding constructs such as competitive advantage and cost-
effectiveness. The following analysis describes how all the included variables and
moderators predicted the dependent variable. Wagaw reported performance expectancy,
effort expectancy, social influence, facilitating conditions, competitive advantage, and
cost-effectiveness independent variables were strong predictors of homegrown ERP
system acceptance in Ethiopia. Moderators such as experience exhibited moderating
effects on performance expectancy, effort expectancy, social influence, competitive
advantage, and voluntariness revealed moderating effects on social influence and
facilitating conditions. Wagaw found that experience had a significant moderating effect
on predicting behavioral intention to adopt and use homegrown ERP systems, which was
similar to findings by Chauhan and Jaiswal with respect to the moderating effects of
experience on ERP training system adoption. Wagaw explained individuals with more
experience were more likely to accept and use homegrown ERP systems that required
less effort (effort expectancy) and resulted in more benefits (performance expectancy),
whereas individuals with less experience used the systems when they perceived peer
workers expected them to do so (social influence). Wagaw’s inclusion of experience, as a
moderator, was a reason why it was included in this study.

49
Wagaw’s study was important because it may assist businesses in developing
countries, such as Ethiopia, with compliance to changing regulations by enabling the use
of customized, homegrown ERP systems, instead of attempting to force existing
commercial off-the-shelf ERP systems to fit their requirements. Continuous delivery
systems are similar to homegrown ERP systems because they require flexibility and
modularity to address the specific needs of an organization (Fitzgerald & Stol, 2017;
Wagaw, 2017). Improving use of homegrown ERP systems may reduce cost and time
associated with application support, modifying functions, and adapting business
processes to commercial off-the-shelf ERP solutions (Wagaw, 2017). Reducing the
project manger’s anticipated support effort associated with continuous delivery may also
affect the behavioral intent to adopt continuous delivery practices, which was the focus of
this study. Wagaw’s study was essential to advancing the body of knowledge concerning
application of the UTAUT model (Venkatesh et al., 2003) to technology adoption,
however, limitations and repeatability of the study were not explicitly documented even
though questionnaire reliability was reasonably tested (Wagaw, 2017).
ERP systems can also be delivered as services over the internet, which hides the
complexity of installing and maintaining the application from the user, and is referred to
as Software as a Service (Alotaibi, 2016). Continuous delivery, the focus of this study,
can be used to support the building and maintenance of Software as a Service services.
Continuously delivering IT, such as web applications, produced a tremendous
opportunity for revenue from the development of new technology platforms like Software
as a Service (Alotaibi, 2016). Alotaibi investigated the beliefs and perceptions that affect
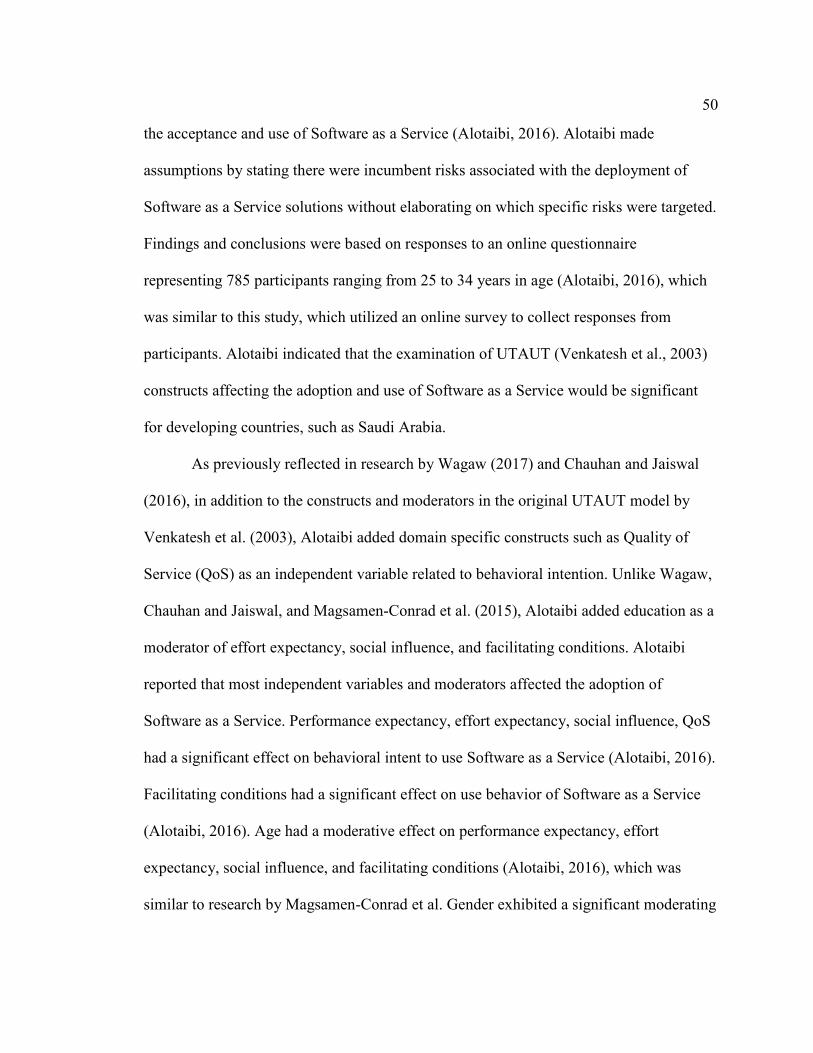
50
the acceptance and use of Software as a Service (Alotaibi, 2016). Alotaibi made
assumptions by stating there were incumbent risks associated with the deployment of
Software as a Service solutions without elaborating on which specific risks were targeted.
Findings and conclusions were based on responses to an online questionnaire
representing 785 participants ranging from 25 to 34 years in age (Alotaibi, 2016), which
was similar to this study, which utilized an online survey to collect responses from
participants. Alotaibi indicated that the examination of UTAUT (Venkatesh et al., 2003)
constructs affecting the adoption and use of Software as a Service would be significant
for developing countries, such as Saudi Arabia.
As previously reflected in research by Wagaw (2017) and Chauhan and Jaiswal
(2016), in addition to the constructs and moderators in the original UTAUT model by
Venkatesh et al. (2003), Alotaibi added domain specific constructs such as Quality of
Service (QoS) as an independent variable related to behavioral intention. Unlike Wagaw,
Chauhan and Jaiswal, and Magsamen-Conrad et al. (2015), Alotaibi added education as a
moderator of effort expectancy, social influence, and facilitating conditions. Alotaibi
reported that most independent variables and moderators affected the adoption of
Software as a Service. Performance expectancy, effort expectancy, social influence, QoS
had a significant effect on behavioral intent to use Software as a Service (Alotaibi, 2016).
Facilitating conditions had a significant effect on use behavior of Software as a Service
(Alotaibi, 2016). Age had a moderative effect on performance expectancy, effort
expectancy, social influence, and facilitating conditions (Alotaibi, 2016), which was
similar to research by Magsamen-Conrad et al. Gender exhibited a significant moderating

51
effect on performance expectancy and effort expectancy (Alotaibi, 2016), similar to
research by Chauhan and Jaiswal. Education, not included in the original UTAUT model,
Chauhan and Jaiswal, Magsamen-Conrad et al., and Wagaw, exhibited a significant
moderative effect on effort expectancy, social influence, and facilitating conditions.
Alotaibi reported gender as a moderator of social influence was the only model element
that was not significant. Lack of gender significance related to social influence in the
study by Alotaibi was a reason why it was not included as a moderator in this study.
Similar to Magsamen-Conrad et al., Alotaibi’s did not include Venkatesh et al.’s UTAUT
voluntariness of use moderator because mandatory use of Software as a Service concepts
was an inclusion criterion for respondent participation. Continuous delivery system use
was also a requirement for all participants in this study and therefore voluntariness of use
was not included as a moderator. In addition to excluding voluntariness as a moderator,
Alotaibi contended, without peer-reviewed citations, experience and education can be
used interchangeably as moderators in the application of Venkatesh et al.’s UTAUT
model, as was in the case in Chauhan and Jaiswal, Magsamen-Conrad et al., and Wagaw.
Alotaibi noted that two of the six hypotheses were rejected based on their analysis. The
findings reflected effort expectancy and social influence effects on behavioral intent as
moderated by age, in this case elderly individuals, were not supported (Alotaibi, 2016),
which was unlike findings in the study by Magsamen-Conrad et al. concerning mobile
tablet adoption. In addition to lack of support for age differences, gender moderation of
social influence effect on behavioral intent to use Software as a Service technologies by
Women was not supported (Alotaibi, 2016), which was unlike Chauhan and Jaiswal

52
findings concerning adoption and use of ERP training software. Lack of support for age
and gender differences in Alotaibi was a reason why they were not included as
moderators in this study.
Alotaibi’s (2016) study was advanced the body of knowledge because it extended
the UTAUT model (Venkatesh et al., 2003) to include QoS as an independent variable as
it related to behavioral intent. The pattern of adding constructs to the conceptual
framework was similar and consistent with research by Chauhan and Jaiswal (2016) and
Wagaw (2017), but different from Magsamen-Conrad et al. (2015) and this study, which
does not include additional independent variables. Alotaibi noted the voluntariness of
participants and single execution as the main limitations of the study. This study was also
limited by single execution and did not include voluntariness of use as a moderator.
The findings in Alotaibi’s (2016) study supported the application of UTAUT
(Venkatesh et al., 2003) in subsequent research on Software as a Service -related
technologies such as continuous delivery researched in this study. It was therefore
feasible to test the UTAUT in the examination of project manager behavioral intent to
adopt continuous delivery. Alotaibi’s study was a good contribution to the body of
knowledge, however, it may have benefited from better explanations of findings,
diversity of age in survey participation, simplified hypotheses, and stronger incorporation
of Saudi Arabia’s role in the study. The study also does not adequately represent the
elderly population when it includes participants ranging in age from 25 to 34 years old.
There was strong evidence of UTAUT application, however, Alotaibi’s study was weak
in terms of structure and execution.

53
Software as a Service product offerings such as ERP may use cloud computing to
deliver services to customers (Fitzgerald & Stol, 2017). Cloud computing services covers
a wide range of online computing disciplines such as social networking, information
sharing, and file storage (Alsmadi & Prybutok, 2018). Services offered on cloud
computing environments may use continuous delivery, the focus of this study, as a means
of developing and testing software (Fitzgerald & Stol, 2017). One specific area of the
cloud computing services discipline that was often scrutinized was in privacy and
compliance concerns for information sharing and storage (Alsmadi & Prybutok, 2018).
Vendors in the information sharing and storage software domain have argued that
previous privacy and compliance violations should not concern potential users because
stronger security and privacy mechanisms are implemented (Alsmadi & Prybutok, 2018).
Alsmadi and Prybutok examined the relationship between the independent variables of
the UTAUT model (Venkatesh et al., 2003) and information sharing and storage
behavior. Alsmadi and Prybutok used the UTAUT model and included an analysis of
responses from 129 professionals working with information sharing and storage behavior
to determine how constructs related with cloud computing services adoption and use.
Alsmadi and Prybutok (2018) utilized the original UTAUT model (Venkatesh et
al., 2003) independent variables, which include: performance expectancy, effort
expectancy, social influence, and facilitating conditions, and added adoption hindrances
such as perceived security and perceived privacy. The addition of constructs by Alsmadi
and Prybutok was consistent with research by Wagaw (2017), Chauhan and Jaiswal
(2016), and Alotaibi (2016), however, it differs from the approach taken by Magsamen-
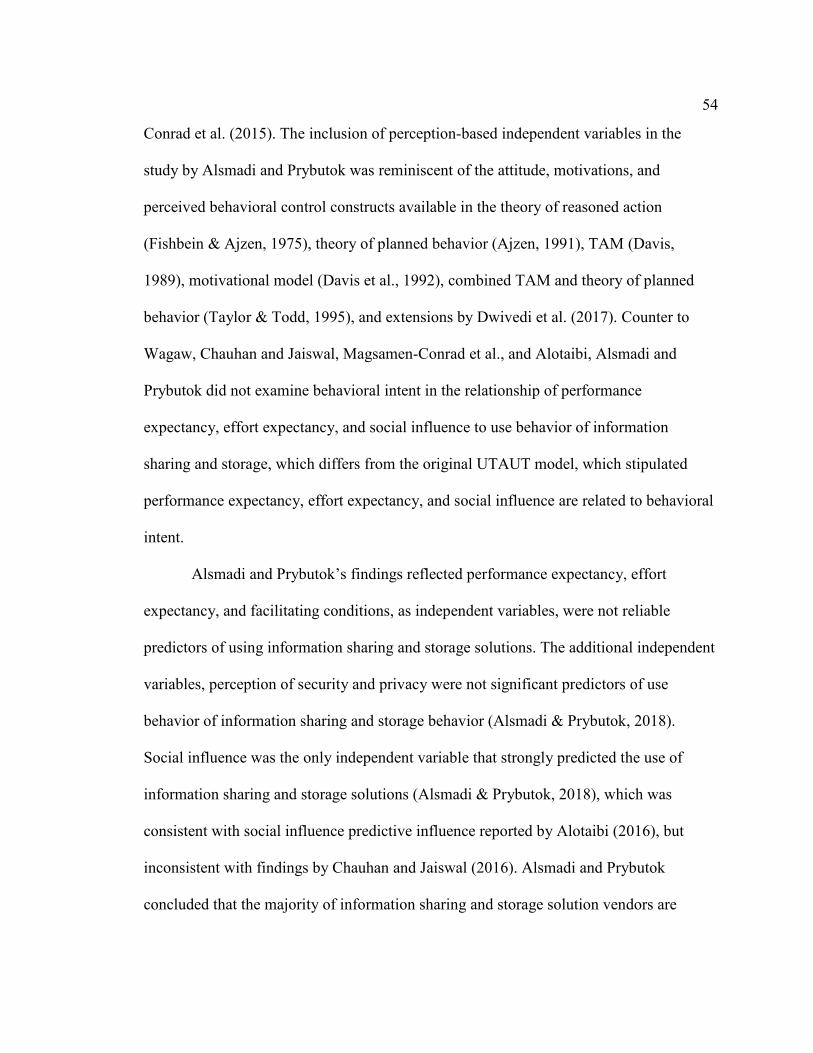
54
Conrad et al. (2015). The inclusion of perception-based independent variables in the
study by Alsmadi and Prybutok was reminiscent of the attitude, motivations, and
perceived behavioral control constructs available in the theory of reasoned action
(Fishbein & Ajzen, 1975), theory of planned behavior (Ajzen, 1991), TAM (Davis,
1989), motivational model (Davis et al., 1992), combined TAM and theory of planned
behavior (Taylor & Todd, 1995), and extensions by Dwivedi et al. (2017). Counter to
Wagaw, Chauhan and Jaiswal, Magsamen-Conrad et al., and Alotaibi, Alsmadi and
Prybutok did not examine behavioral intent in the relationship of performance
expectancy, effort expectancy, and social influence to use behavior of information
sharing and storage, which differs from the original UTAUT model, which stipulated
performance expectancy, effort expectancy, and social influence are related to behavioral
intent.
Alsmadi and Prybutok’s findings reflected performance expectancy, effort
expectancy, and facilitating conditions, as independent variables, were not reliable
predictors of using information sharing and storage solutions. The additional independent
variables, perception of security and privacy were not significant predictors of use
behavior of information sharing and storage behavior (Alsmadi & Prybutok, 2018).
Social influence was the only independent variable that strongly predicted the use of
information sharing and storage solutions (Alsmadi & Prybutok, 2018), which was
consistent with social influence predictive influence reported by Alotaibi (2016), but
inconsistent with findings by Chauhan and Jaiswal (2016). Alsmadi and Prybutok
concluded that the majority of information sharing and storage solution vendors are

55
confident in the technical expertise that were developing and supporting their products,
working towards reducing security and privacy threats. Existing peer-reviewed literature
cited by Alsmadi and Prybutok asserted that the regularity and consistency with which
users of information sharing and storage solutions became accustomed to may have made
reliability less of a concern and instead made peer influence (social influence) more
relevant. In addition to the influence of social influence, age, as a moderator of
performance expectancy, effort expectancy, social influence, and facilitating conditions,
had no significant moderating effect on information sharing and storage behavior among
the population of respondents, which was counter to the findings of Magsamen-Conrad et
al. (2015) in their study on mobile tablet adoption. Lack of support for the use of age as a
moderator in Alsmadi and Prybutok was one reason why age was not included as a
moderator in this study.
Alsmadi and Prybutok’s study was essential because the findings reflected peer
influence (social influence ) as the strongest predictor of information sharing and storage
behavior use, which was interpreted as reputation and customer perception are critical to
information sharing and storage solution vendors. Social influence may also have an
effect on project manager’s behavioral intent to adopt continuous delivery. Alsmadi and
Prybutok also warned that their study findings may drive reduced vigilance in security
and privacy innovation because vendors may prioritize marketing and reputation
management to address social influence instead of code quality, lowering the priority on
technical innovation (Alsmadi & Prybutok, 2018). Alsmadi and Prybutok additionally
acknowledged limitations regarding small sample size, which can lead to lack of
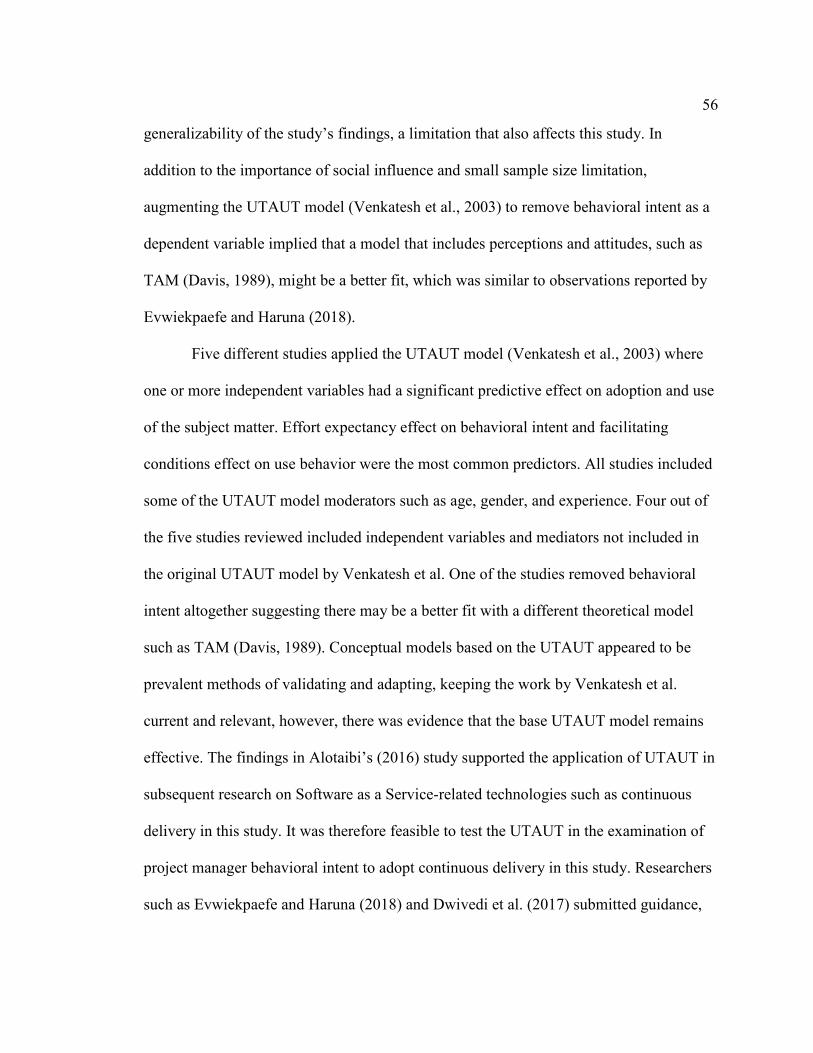
56
generalizability of the study’s findings, a limitation that also affects this study. In
addition to the importance of social influence and small sample size limitation,
augmenting the UTAUT model (Venkatesh et al., 2003) to remove behavioral intent as a
dependent variable implied that a model that includes perceptions and attitudes, such as
TAM (Davis, 1989), might be a better fit, which was similar to observations reported by
Evwiekpaefe and Haruna (2018).
Five different studies applied the UTAUT model (Venkatesh et al., 2003) where
one or more independent variables had a significant predictive effect on adoption and use
of the subject matter. Effort expectancy effect on behavioral intent and facilitating
conditions effect on use behavior were the most common predictors. All studies included
some of the UTAUT model moderators such as age, gender, and experience. Four out of
the five studies reviewed included independent variables and mediators not included in
the original UTAUT model by Venkatesh et al. One of the studies removed behavioral
intent altogether suggesting there may be a better fit with a different theoretical model
such as TAM (Davis, 1989). Conceptual models based on the UTAUT appeared to be
prevalent methods of validating and adapting, keeping the work by Venkatesh et al.
current and relevant, however, there was evidence that the base UTAUT model remains
effective. The findings in Alotaibi’s (2016) study supported the application of UTAUT in
subsequent research on Software as a Service-related technologies such as continuous
delivery in this study. It was therefore feasible to test the UTAUT in the examination of
project manager behavioral intent to adopt continuous delivery in this study. Researchers
such as Evwiekpaefe and Haruna (2018) and Dwivedi et al. (2017) submitted guidance,
57
evidence, and potential modifications of the UTAUT model, which provided support to
extended models and alternative relationships between independent and dependent
variables. This study does not add constructs or moderators to the original UTAUT model
because it was not yet clear if other related independent variables exist in the continuous
delivery domain. This study also shares limitations and constraints similar to those
reported in the reviewed literature.
Project Management Research
Research in the domain of project management included studies concerning the
technical and business factors that can influence project success. Software application
project success traditionally relied on understanding the relationship between business
constraints such as time, money, and resources (Hornstein, 2015). Theories and models
such as the theory of constraints (Goldratt & Cox, 1984) and the iron triangle, which
depicted quality at the center of a triangular interrelationship between time, cost, and
scope of objectives, became accepted methods for describing the interrelationship of
constraints that commonly existed in all projects (Cullen & Parker, 2015). The PMI
notably mapped the definition of the iron triangle to the term triple constraints (PMI,
2013). Both iron triangle and triple constraints (PMI, 2013) are models that explain
spending more time on quality may increase cost and might require additional time,
which therefore decreases the scope of objectives (Cullen & Parker, 2015), rebalancing
the sides of the iron triangle to preserve the fixed volume (Goldratt and Cox, 1984).
Researchers such as Araújo and Pedron (2015) expanded on triple constraints by
enumerating additional competencies such as (a) resource utilization, (b) time

58
management, (c) risk management, (d) scope management, and (e) alignment were most
relevant to experienced, mid-level analysts and managers in large multinational
companies. Araújo and Pedron asserted that traditional constraints of time, resource, and
scope still exist, however, constraints such as risk management and alignment are equally
important when evaluating project success predictors.
Cullen and Parker (2015) supported the work of Araújo and Pedron (2015) by
combining existing project success constraint theories in a new approach to the problem
of project success as a function of resource management. Cullen and Parker
conceptualized the theory of constraints (Goldratt & Cox, 1984), resource-based view
(Wernerfelt, 1984), and resource-dependence theory (Pfeffer & Salancik, 2003) could be
combined and applied in project success studies, defined by independent variables cost,
time, and scope, and the dependent variable quality. To create a better understanding of
the work by Cullen and Parker, the following is a description of each of the three theories
included in their study:
• theory of constraints: related constraints are a part of every manageable
system and therefore identifying, exploiting, and mitigating them was
central to project success (Goldratt & Cox, 1984).
• resource-based view (Wernerfelt, 1984) described knowledge-based,
intangible resources as a source of competitive advantage because they are
reflections of the organizational structure, culture, and causal ambiguity of
a company, unique to the business that created the resource (Cullen &
Parker, 2015).
59
• resource-dependence theory was defined by Pfeffer and Salancik (2003) as
the reduction of uncertainty and dependency by forming strategic
relationships that limit external power over an organization.
The construction of London’s Heathrow airport terminal 5 (T5), as reported in the
study by Cullen and Parker (2015), utilized theory of constraints (Goldratt & Cox, 1984),
resource-based view (Wernerfelt, 1984), and resource-dependence theory (Pfeffer &
Salancik, 2003). Cullen and Parker posited British Airport Authority completed an
extensive review of previously executed, large-scale projects and concluded combining
theory of constraints (Goldratt & Cox, 1984), resource-based view (Wernerfelt, 1984),
resource-dependence theory (Pfeffer & Salancik, 2003) and other project management
theories may increase the probability of project success. The following was a discussion
of how each of the three theories contributed to the study conclusions:
• theory of constraints (Goldratt & Cox, 1984) was utilized to identify more
than 700 constraints, improve partner collaboration, and mitigate risks by
implementing pre-fabrication and testing of components (Cullen & Parker,
2015). Mitigating risks by identifying and pro-actively addressing
constraints improved timeliness, which reduced cost and improved quality
(Araújo & Pedron, 2015; Cullen & Parker, 2015).
• resource-based view (Wernerfelt, 1984) was applied when British Airport
Authority introduced standard designs and leveraged homegrown project
management competencies (Cullen & Parker, 2015). Utilizing standards
and in-house cultivated resources created competitive advantage and
60
unique customer experience, improving quality by reducing time,
inconsistency, and uncertainty inherent to external resources (Cullen &
Parker, 2015), which was also regarded as risk by Araújo and Pedron
(2015).
• Cullen and Parker (2015) reported that resource-dependence theory
(Pfeffer & Salancik, 2003) was demonstrated by British Airport Authority
when long-term partnerships and first-tier suppliers were selected.
Reducing the power and risk of external dependencies by actively
delineating contracts to include mutually beneficial outcomes may lower
long-term cost and improve the overall quality of a project (Cullen &
Parker, 2015).
Cullen and Parker’s study was vital to the field of project management because it
underscored the necessity to mitigate risks and optimize internal project resources and
dependencies through the use of combined approaches, however, the study was non-
empirical, providing little quantitative or qualitative evidence. The use of combined
theories and approaches to examining project success was supported by Walldén et al.
(2016) and Evwiekpaefe and Haruna (2018). Using combined approaches to manage
interdependencies was similar to project management practices such as continuous
delivery, the focus of this study, which integrates several methods and tools to improve
the efficiency of software engineering and maintenance (Fitzgerald & Stol, 2017). Cullen
and Parker’s study was also important because it focused on aligning performance
management with strategic outcomes that may increase project success rates, similar to
61
this study’s examination of performance expectancy as an independent variable in the
UTAUT model (Venkatesh et al., 2003). Adoption of technology that provides
competitive advantage can improve project success by reducing risks represented by
external dependencies, eliminating time wasted on routine tasks, and improving quality
(Cullen & Parker, 2015). Improving quality may improve reputation, which was essential
when measuring use behavior such as in the study by Alsmadi and Prybutok (2018),
which positively related social influence to acceptance of information sharing and storage
solutions using UTAUT. Social influence may affect behavioral intent to adopt
continuous delivery in this study because one goal of continuous practices was to
improve quality of software.
As Cullen and Parker (2015) and Araújo and Pedron (2015) observed, traditional
business constraints such as resources, time, budget and quality are elements project
managers must consider during all phases of a project, however, there are others worthy
of consideration. Carvalho, Patah, and de Souza Bido (2015) reported that human factors,
such as those project managers (PM) oversee, may affect project success as it relates to
margins, cost, and scheduling. This study also includes an examination of human factors
related to project managers and their effect on continuous delivery adoption. Carvalho et
al. used a longitudinal, 3-year, field survey with participants in 10 different industries,
spread out across three countries, and data from 1387 projects to analyze how project
managers affect project success in national business environments. This study crosses
industries and projects in a manner similar to Carvalho et al.

62
Carvalho et al. used structural equation modeling to measure the effects of the
independent variables: project management areas and project management enablers
(PMEn), on the dependent variable of project success represented by cost variation (Y1),
schedule variation (Y2), and margin variation (Y3), while controlling for country of origin
(C1), industry (C2), and project complexity (C3). Carvalho et al. defined PMEn as (a) PM
process roles, (b) PM web portal, (c) benchmarking and implementation status, (d) PM
assessment, and (e) small project size. Project management areas were defined as (a)
contract management, (b) people management, (c) quality management, (d) knowledge
management, (e) procurement management, and (f) project control (Carvalho et al.,
2015). Frequency distribution, bivariate analysis, descriptive statistics, and partial least
squares path modeling (PLS-PM) were used to analyze data from 1387 projects. The use
of bivariate analysis in Carvalho et al. was the same as the method used in this study.
Country of origin (C1) had a significant effect on project success (Carvalho et al.,
2015). Brazil, the country with the most significant number of study participants, has
experienced a high density of PMI and IPMI certified professionals (Carvalho et al.,
2015), however, unlike this study, the population was confined to three countries and
therefore may reduce generalization of results. Study findings supported literature that
stated complexity (C3) and industry (C2) had a substantial effect on project performance
(Carvalho et al., 2015). Cost (Y1) and margin (Y3) were not affected by independent
variables PMEn and project management areas, which validated prior research suggesting
less mature projects, those falling below capability maturity model integration level three,
may not experience significant cost reductions or margin improvements (Carvalho et al.,

63
2015). PMEn or project management areas did have a significant effect on schedule
variation (Y2) linked to increased agile project manager training and capabilities
development, which are considered soft skill improvements (Carvalho et al., 2015),
which was similar to skills required to socially influence adoption and use of processes,
methods, and tools examined in this study. In a similar study, Masombuka and Mnkandla
(2018) proposed a collaboration and acceptance model, which compared the reported
maturity level, similar to capability maturity model integration, of DevOps principles and
practices in a software development organization to factors like social influence and tool
integration.
Carvalho et al.’s study was important because the findings reflected investment in
soft-skills, which affects human factors of agile project management such as those
examined in this study, improved project success rates. Human factors, in addition to
business factors, such as project management training, have a significant effect on project
performance (Carvalho et al., 2015) and was one of the elements of this study. Amrit et
al. also found that human factors such as coordination, collaboration in the development
process, trust, expert recommendation, and culture amongst the most studied subjects in
software development literature. Cullen and Parker (2015) and Araújo and Pedron (2015)
similarly stated that factors other than time, money, scope, and quality are important
considerations in determining project success. The UTAUT (Venkatesh et al., 2003)
measures independent variables that represent human factors (Amrit et al., 2014, Cullen
&Parker, 2015) and therefore can be used to measure effects of project managers on
adoption of agile practices, such as continuous delivery in this study. UTAUT human-

64
related constructs such as performance expectancy, effort expectancy, and social
influence are elements that project managers may use to affect behavioral intent to adopt
continuous delivery.
Carvalho et al. (2015), Cullen and Parker (2015), Araújo and Pedron (2015), and
Amrit et al. (2014) researched human factors and the impact they had on project success.
Another way that project managers may improve project success was by addressing
technical and human factors with the adoption of Agile principles and methods. Agile
project management is a method for dividing large projects into small, manageable tasks,
which may potentially increase project success rates (Hornstein, 2015). Agile project
management also promoted using soft-skills, which are difficult to standardize, are
essential to project success, and have an effect on collaboration, mentoring, and
facilitation (Hornstein, 2015). Combining human and technical factors to examine
adoption of technology is a key component of the UTAUT model (Venkatesh et al.,
2003) used in this study because it combines human elements such as performance
expectancy, effort expectancy, social influence, and experience with technical factors
such as facilitating conditions.
Proponents of agile software development practices such as those conveyed by
Hornstein (2015), believed that agile principles increase project success rates (Serrador &
Pinto, 2015). Project success can be measured using critical success factors (CSF) to
identify and measure individual elements that may affect project success rates (Hornstein,
2015). Serrador and Pinto measured efficiency and overall stakeholder satisfaction effects
on organizational goals, as part of a study on project success, using an online survey of

65
1002 projects spread across multiple countries and industries by contacting PMI members
of LinkedIn project management groups with an online survey from surveymonkey.com,
which was similar to the method of recruitment and survey used in this study.
The degree of effort in agile planning was the independent variable in the study
by Serrador and Pinto, which supported previous assumptions made by Conforto, Salum,
Amaral, da Silva, and de Almeida (2014). Overall project success, project efficiency, and
stakeholder satisfaction were the dependent variables, as moderated by the quality of the
vision or goals, project complexity, and team experience (Serrador & Pinto, 2015).
Serrador and Pinto discovered increased adoption of agile practices in projects reflected a
statistically significant effect on all dimensions of project success, such as stakeholder
satisfaction, efficiency, and overall project performance. Quality of vision and goals for
the project were strong moderators of the effect of agile practice maturity on project
success (Serrador & Pinto, 2015). Project complexity and team experience did not
moderate the effect of agile practice maturity on agile project success (Serrador & Pinto,
2015). Individual experience, not team experience, was one of the moderators included in
this study and was examined for its effects on effort expectancy, social influence, and
facilitating conditions contributing to a project manager’s behavioral intent to adopt
continuous delivery.
Serrador’s and Pinto’s study was important because it validated project success
research by Conforto et al. (2014), Cullen and Parker (2015), and Carvalho et al. (2015),
however, research quality factors such as non-response errors, incomplete responses, and
issues related to environment were not discussed (Serrador & Pinto, 2015). Serrador and

66
Pinto was also important because many studies have assessed team structure and
teamwork for traditional development, however, there were no studies that examined the
effect of teamwork on agile development suggested by Fowler and Highsmith (2001).
Serrador’s and Pinto’s work was essential to this study because it examines human and
technical factors related to project success and supports the methodology and approach to
creating, distributing, collecting, and analyzing survey data as outlined in Chapter 3. This
study included a distributed survey whereby project managers entered responses using
surveymonkey.com. Chapter 3 contains detailed information regarding methods used in
the design of this study.
The work of Serrador and Pinto (2015) and Conforto et al. (2014) are underpinned
by the agile principles that originated in the agile manifesto by Fowler and Highsmith
(2001), which declared self-organizing, self-directed teams are essential to innovation
and development of good software design and requirements. Lindsjørn, Sjøberg,
Dingsøyr, Bergersen, and Dybå expanded the body of knowledge when they studied the
differences in the effects of traditional and agile teamwork quality on team performance
and work satisfaction. Traditional development was based on limited customer
interaction, large team size, specialized skills, decisions made by managers, and
individual work (Lindsjørn et al., 2016). Unlike traditional development methods, agile
development focuses on multi-skilled team members, collaboration, small team size,
increased customer interaction, and decisions made by many (Hornstein, 2015; Lindsjørn
et al., 2016). Lindsjørn et al.’s study included a structural equation modeling analysis of

67
71 agile software teams comprised of 477 participants in 26 companies to examine some
of the differences between traditional and agile software development practices.
Lindsjørn et al.’s conceptual framework was based on Hackman’s input-process-
output model on group behavior and effectiveness (Hackman, 1987), which includes the
following independent variables: (a) communication, (b) coordination, (c) balance of
member contribution, (d) mutual support, (e) effort, and (f) cohesion. Lindsjørn et al.
included team performance and team member’s success as dependent variables,
representing project success. Two surveys, one for traditional teams and one for agile
teams, were created and tested satisfactorily for Cronbach’s alpha (Lindsjørn et al., 2016)
similar to the method used to validate the UTAUT (Venkatesh et al., 2003) questionnaire
used in this study. The agile survey was distributed during the November 2011
Norwegian Agile Conference and the traditional survey distribution and compared to
analysis covered in a previously published study (Lindsjørn et al., 2016). Survey
respondents included team leaders, project leaders, and team members, such as architects,
testers, support staff, developers, and configuration managers (Lindsjørn et al., 2016).
The findings of Lindsjørn et al. reflected that teamwork quality significantly affects team
performance and team member’s success as rated by team members. Agile teams
reported minor differences in effects of teamwork quality on performance and team
member’s success when compared with previously analyzed traditional team survey
results (Lindsjørn et al., 2016). Effects of teamwork quality on project success were the
same between surveys, however, the traditional survey echoed equal rating distribution
for teamwork quality independent variables across team roles whereas the agile survey
68
findings revealed significant differences in team leaders, project leaders, and team
members rating distribution (Lindsjørn et al., 2016).
Lindsjørn et al.’s study was an essential contribution to the body of knowledge
concerning peer-reviewed project management research because it reflected significant
differences between traditional and agile project management highlighting alignment of
management and individual contributor priorities and objectives. The accentuation of
management alignment was captured in the social influence independent variable of the
UTAUT model (Venkatesh et al., 2003) used in this study. Traditional team product
owners, team leaders, and team members equally regarded teamwork quality effects on
team performance and team member’s success, however, agile teams reported differences
in client requirements-related priorities between product owners and the collective group
of team members and team leaders (Lindsjørn et al., 2016), which extends the
examination of project success factors by Carvalho et al. (2015), Cullen and Parker
(2015), Araújo and Pedron (2015), and Amrit et al. (2014). The differences found by
Lindsjørn et al. indicated a closer alignment between team leaders, such as project
managers, and team members in agile teams when compared with traditional teams,
resulting in agile team leaders having more influence on agile team members than from
other mid-level agile management positions. The observed closeness between project
managers and team members provided the foundational support for this study’s
examination of the influence project managers have over adoption of automated
processes that may benefit a team’s ability to be successful. Lindsjørn et al. indicated a
healthy separation of duties existed in agile teams, evidenced by advocacy for the
69
customer requirements by product owners, business and human factors by team leaders,
code quality by team members, and customer satisfaction by all, however, limitations
concerning generalizing findings outside of Norwegian companies.
Lindsjørn et al. (2016) and Serrador and Pinto (2015) provided evidence that
implementing Agile principles can potentially improve project success rates, however
transitioning from traditional development methods, such as waterfall, to agile methods,
such as scrum, was difficult because of procedural, organizational, and human factors
(Gandomani & Nafchi, 2016). Transitioning from traditional development methods to
agile development methods was called the agile transformation process (Gandomani &
Nafchi, 2016). Gandomani and Nafchi examined human-related agile transformation
process factors using grounded theory to qualitatively analyze responses from 49 agile
practitioners in 13 countries. A collection of human-related agile transition challenges
were the dependent variables in the study by Gandomani and Nafchi. Participants
qualified for inclusion if they had experience with one agile transformation (Gandomani
& Nafchi, 2016), which was similar to the qualifying factor of having experience with
one continuous delivery project in this study and was a reason why experience was
included as a moderator. Impediments to agile transition were (a) lack of knowledge, (b)
cultural issues, (c) resistance to change, (d) wrong mindset, and (e) lack of effective
collaboration; and perceptions about the change process were defined as (a) worried, (b)
enthusiastic but misguided, (c) lack of belief in change, (d) indifferent, and (e) unrealistic
expectations; emerged as independent variables after completion of coding analysis of
participant responses (Gandomani & Nafchi, 2016).

70
Gandomani and Nafchi (2016) posited that investment in pre-transition
organizational education about agile principles and expected outcomes may decrease the
effect of the following independent variables: lack of knowledge, worry, enthusiastic but
misguided, and unrealistic expectations. Examination of investment in education
reflected by Gandomani and Nafchi was similar to the studies on homegrown ERP
implementations in Ethiopia by Wagaw (2017) and ERP training in India universities by
Chauhan and Jaiswal (2016).
The population of project managers surveyed in the study by Gandomani and
Nafchi (2016) played a significant role in reducing the effect of the wrong mindset,
cultural, and lack of effective collaboration and was a supporting factor in examining
project manager behavioral intent in this study. Gandomani and Nafchi observed
command and control management methods that are preferable in traditional management
contributed to the wrong mindset in the population of project managers, which aligns
with the findings of Carvalho et al. (2015), Cullen and Parker (2015), Araújo and Pedron
(2015), and Amrit et al. (2014) on agile project management success factors. Gandomani
and Nafchi asserted that facilitative management style, suggested in agile project
management, can reduce the effects of the wrong mindset in the agile transition process.
Gandomani and Nafchi’s research was a significant contribution to the body of
knowledge because it exposed fine-grained causes of human factors involved with the
agile transformation process. Previous studies by Carvalho et al. (2015), Cullen and
Parker (2015), Araújo and Pedron (2015), and Amrit et al. (2014) only captured general
impediments, however, the research did not contain quantitative evidence to support the
71
degree to which negatively impacting sentiment, such as unrealistic expectations,
enthusiastic but misguided, indifference to change, and lack of belief in change, affected
the agile transformation process. Project managers attitudes, beliefs, and actions can
affect human-related agile transition challenges through impediments and perceptions
(Gandomani and Nafchi, 2016). Examining the antecedents of a project manager’s intent
to adopt continuous delivery, which was the purpose of this study, would extend the
study by Gandomani and Nafchi.
Lindsjørn et al. (2016), Serrador and Pinto (2015), Conforto et al. (2014), and
Gandomani and Nafchi (2016) agreed with the principles of the agile manifesto (Fowler
& Highsmith, 2001), however, some researchers have interpreted the manifesto’s (Fowler
& Highsmith, 2001) references to small-sized teams as a reason that large, globally
distributed teams, may not be able to adopt agile methods (Papadopoulos, 2015).
Papadopoulos extended the body of knowledge in a study of the effects of large agile
teams on the dependent variables: (a) quality as a benefit to using agile, (b) customer
perception of the product, (c) intra-team collaboration, (d) intra-team communication,
and (e) employee satisfaction. Papadopoulos used a combination of a survey instrument,
observations, and defect log data to perform a case study analysis and present the
findings on two projects inside one business. The use of a defect log was important
because it was used to determine actual usage or use behavior of agile methods instead of
solely relying on respondent answers, boosting validity of results. In this study on
continuous delivery it was unnecessary to use logging to validate usage because once
implemented, continuous delivery, by definition, automatically executes continuously.

72
Papadopoulos asserted that embracing agile practices, the readiness of system and
UI design, handling of meetings, demonstrating team results, and reducing continuous
integration effort, the independent variables, may affect a large agile team’s ability to
benefit from agile methods, the dependent variable. Organizational factors such as
organizational design, decision making, collaboration and coordination, and agile culture,
as well as scaling factors: multi-team backlog, multiple meetings, infrastructure
scalability, and organizational agility, were selected as moderators of the independent
variable effects on the ability to benefit from agile methods (Papadopoulos, 2015). Many
of the same moderators were also found in the studies by Lindsjørn et al. (2016), Serrador
and Pinto (2015), and Gandomani and Nafchi (2016). Papadopoulos observed project
managers can facilitate cross-linked teams to influence collaboration, communication,
and decision making as it relates to dependent sub-constructs: embracing agile practices,
handling of meetings, and reducing continuous integration effort. Cross-team
collaboration, communication, and decision-making are some of the key elements
required in the adoption of continuous delivery, the focus of this study. Papadopoulos
observed that projects that are large and distributed benefited from using agile methods
by increasing quality, allowing late changes to requirements, and elevating employee
satisfaction, which was supported by Lindsjørn et al., Serrador and Pinto, and Gandomani
and Nafchi. The study contained evidence that agile culture and following agile practices
are essential areas that adopters should address in addition to the transformation process
(Papadopoulos, 2015).
73
Papadopoulos’ study was a significant contribution to the body of knowledge
because it related human-factors, such as agile project managers adopting a facilitative
style of management instead of traditional command and control, and their effect on
adopting agile practices, which was the same properties required for successful
continuous delivery adoption discussed in this study. Facilitating collaboration between
remote teams and reducing continuous integration effort allowed agile project managers
time to address quality and customer interaction (Papadopoulos, 2015). The study
findings add to the body of knowledge concentrated on agile transformation researched
by Lindsjørn et al. (2016), Serrador and Pinto (2015), and Gandomani and Nafchi (2016),
however, the results are limited in terms of generalizability because there was a single
case study, which may not represent the larger population of agile projects.
This study included an analysis and synthesis of six peer-reviewed studies
reporting evidence on human-related factors:
• Collaboration, facilitation, education, culture, and teamwork have a
substantial effect on agile transformation (Gandomani & Nafchi, 2016;
Papadopoulos, 2015),
• project performance and project success (Carvalho et al., 2015; Cullen &
Parker, 2015; Lindsjørn et al., 2016; Serrador & Pinto, 2015).
• Human factors depicted in the UTAUT model (Venkatesh et al., 2003)
and project manager behavioral intent to adopt the agile practice of
continuous delivery, which is the focus of this study.
Four studies focused on project performance and project success:

74
• Cullen and Parker (2015) synthesized existing theories on project success
and conceptualized that reducing time on repetitive tasks as one way to
gain competitive advantage, strengthening intellectual property and
promoting the delivery of quality products, which improved reputation and
social influence. Cullen and Parker postulated project management
involves more than cost, time, scope, and quality considerations.
• Carvalho et al. (2015) studied project management effects on project
success using cross-country and cross-industry moderators and asserted
that investment in agile project manager soft-skills has significant effects
on schedule variation, which affected project performance through making
time constraints more predictable.
• Serrador and Pinto (2015) reported the effects of agile effort on project
success and determined agile practice effort, moderated by the quality of
vision and goals, influenced project success, as conveyed to teams through
the voice of project managers.
• Lindsjørn et al. (2016) examined the effects of teamwork quality on
project success and theorized project managers are closest to team
members and therefore influence teamwork quality constructs, such as
communication, coordination, and cohesion. Lindsjørn et al. did not show
evidence of significant differences between outcomes of teamwork quality
when transitioning from traditional to agile project management methods.
Lindsjørn et al. reflected differences in priorities and objectives for team

75
members, team leads, and product owners existed between traditional and
agile project management methods. Lindsjørn et al. supported the research
of Cullen and Parker (2015), Serrador and Pinto (2015), and Carvalho et
al. (2015).
Two studies focused on the agile transformation process:
• Gandomani and Nafchi (2016) examined human-related challenges and
their effect on agile method adoption and posited that attention to project
management soft-skills has a significant effect on the agile transformation
process
• Papadopoulos (2015) studied aspects of agile transition as moderated by
organization size and team member disbursement and explained that large,
globally distributed organizations that attempted transition to agile
methods experienced positive results when agile project managers were
trained in soft-skills, such as facilitation, and technical understanding,
such as influencing the automation of repetitive tasks.
Gandomani and Nafchi (2016) and Papadopoulos (2015) agreed that focusing on
soft-skill development in agile project managers has a significant effect on the agile
transformation process and future research in the area of agile transformation process
may benefit from a focus on quantitative examination to empirically support the
qualitative work of Gandomani and Nafchi, and Papadopoulos. As evidenced by
Carvalho et al., Cullen and Parker, Gandomani and Nafchi, Lindsjørn et al.,
Papadopoulos, and Serrador and Pinto project management soft-skills have a significant

76
effect on project success, project performance, and agile transformation. Studies
indicated improving collaboration, reducing time on repetitive tasks, communicating
great vision and goals, and building cross-organizational relationships are ways project
managers can affect project success (Carvalho et al., 2015; Cullen & Parker, 2015;
Gandomani & Nafchi, 2016; Lindsjørn et al., 2016; Papadopoulos, 2015; Serrador &
Pinto, 2015). Agile project managers may also affect behavioral intent to adopt time
reduction of repetitive tasks (Carvalho et al., 2015; Cullen & Parker, 2015; Gandomani &
Nafchi, 2016; Lindsjørn et al., 2016; Papadopoulos, 2015; Serrador & Pinto, 2015) such
as those included in continuous delivery systems, which was the focus of this study.
DevOps and Continuous Delivery Adoption History
DevOps includes practices such as continuous integration, continuous delivery,
and continuous deployment. DevOps prescribes lessening of organizational barriers, both
social and technical, for the purposes of information sharing and cross-pollination of
skills and principles (Gupta, Kapur, & Kumar, 2017). Removing barriers encourages
unification of individual and department goals, creating a harmonious environment with
the use of common nomenclature, standard tools, and standard practices to achieve the
same overarching organizational goals (Pinto, Castor, & Reboucas, 2018). DevOps can
be organizationally represented by integrating development and operations department’s
personnel, physically, into one group, by virtual matrix reporting structures or some
combination of physical and virtual arrangement. DevOps organizations contain roles and
responsibilities stretching beyond typical software development management and
engineering types such as product managers, project managers, architects, developers,
77
and testers. DevOps roles incorporated many of the operational subject matter expertise,
that traditionally resided in operations departments, directly into the development
environment. DevOps roles assigned to a software development project can include
infrastructure engineers, platform engineers, site reliability engineers, release engineers,
and data scientists. DevOps engineers that take on the work of multiple roles in an
organization can exist as well.
Continuous practices, that are part of DevOps, such as integration, deployment,
delivery, and experimentation are the tools and processes that work together to automate
the operations of standard software delivery cycles such as build, test, stage, release, and
monitor. Continuous integration, typically the first continuous practice that organizations
adopt, focuses on detecting changes in source code and then automatically compiling
code, testing functions and features, logging information, and errors, and staging output
(Shahin et al., 2018). Continuous integration threads software through various levels of
automated and manual testing to ensure quality and confidence. Upon completion of a
successful continuous integration attempt, the resulting artifact can be deployed to a
variety of supported platforms (Shahin et al., 2018).
Continuous delivery, one of the next continuous practices most organizations
adopt, ensures the latest code, test cases, or server configurations are always utilized to
create the next version of a working software application. Continuous delivery is defined
as the practice of keeping a software solution in a releasable state at all times, which
includes operational readiness, consisting of testing, and acceptance of continuous
integration output (Shahin et al., 2018). Continuous delivery and continuous deployment
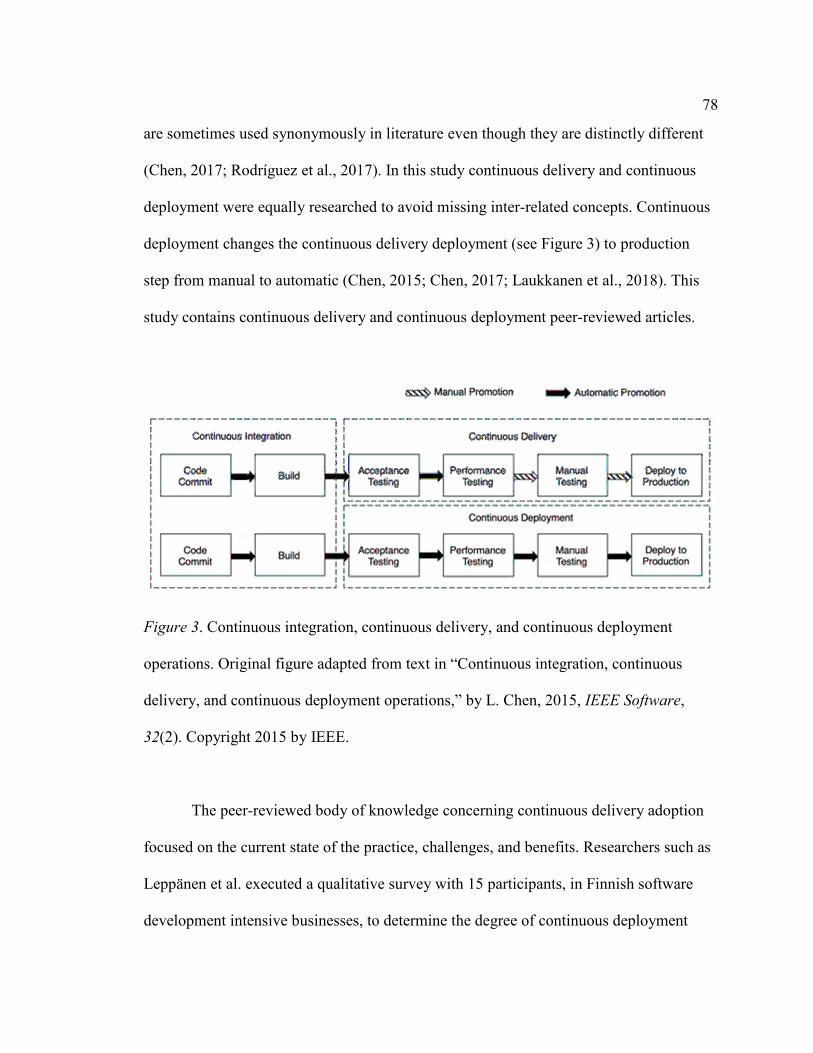
78
are sometimes used synonymously in literature even though they are distinctly different
(Chen, 2017; Rodríguez et al., 2017). In this study continuous delivery and continuous
deployment were equally researched to avoid missing inter-related concepts. Continuous
deployment changes the continuous delivery deployment (see Figure 3) to production
step from manual to automatic (Chen, 2015; Chen, 2017; Laukkanen et al., 2018). This
study contains continuous delivery and continuous deployment peer-reviewed articles.
Figure 3. Continuous integration, continuous delivery, and continuous deployment
operations. Original figure adapted from text in “Continuous integration, continuous
delivery, and continuous deployment operations,” by L. Chen, 2015, IEEE Software,
32(2). Copyright 2015 by IEEE.
The peer-reviewed body of knowledge concerning continuous delivery adoption
focused on the current state of the practice, challenges, and benefits. Researchers such as
Leppänen et al. executed a qualitative survey with 15 participants, in Finnish software
development intensive businesses, to determine the degree of continuous deployment

79
implementation, perceived benefits, and anticipated challenges. Individuals believed
quicker feedback, faster releases, higher quality, effort efficiency, and better
collaboration served as benefits derived from continuous deployment (Leppänen et al.,
2015). UTAUT model (Venkatesh et al., 2003) constructs such as performance
expectancy and effort expectancy used in this study, map to the benefits of continuous
delivery and continuous deployment reported by Leppänen et al. Participants indicated
that automating the deployment to production was not a goal, however, it was a
requirement to have the option to deploy a product manually such as in continuous
delivery examined in this study. Leppänen et al. observed companies did not automate
the last step, deployment to production, of continuous deployment even though they had
developed automated pipelines, opting instead for continuous delivery.
Leppänen et al. supported Claps et al. (2015) by reporting several participants
indicated management did not view continuous delivery and continuous deployment as a
priority, providing a significant obstacle to implementation. Customer preference, domain
constraints, developer attitude, code age, and environmental differences posed a
significant threat to implementing continuous delivery and deployment (Leppänen et al.,
2015). Telecommunications and network software development organizations, which can
lose remote device update capability if an automated update causes a firmware runtime
error, experienced resistance to the idea of automated production deployment. Leppänen
et al. advanced the research in continuous delivery and continuous deployment by
reporting automation of tasks may be feasible, however, it was not encouraged in many
cases, which gives support to this study on continuous delivery.

80
Chen (2015) detailed the continuous delivery and continuous deployment
similarities and differences exposed studies such as Leppänen et al. (2015) in a case study
that concentrated on continuous delivery adoption at Paddy Power corporation. Chen, L.
conveyed that quicker time to market, product market alignment, release reliability, as
well as improvements in productivity, efficiency, quality, and customer satisfaction, are
benefits of adopting continuous delivery. UTAUT model (Venkatesh et al., 2003)
constructs used in this study such as performance expectancy, effort expectancy, and
experience relating to the benefits of continuous delivery reported by Chen. Paddy Power
experienced organizational, process, and technical challenges. Chen and Leppänen et al.
agreed on many of the benefits and challenges of continuous delivery.
Claps et al. (2015) expanded research by Chen (2015) and Leppänen et al. (2015)
by identifying social and technical adoption challenges experienced by organizations
through an explorative case study, at Altassian corporation, involving detailed interviews
of software practitioners. Claps et al. utilized a survey conceived by Vavpotic and Bajec
(2009) that included questions regarding social and technical obstacles confronted during
software development methodology adoption. Thematic analysis revealed 20 social and
technical adoption challenges and mitigation strategies (Claps et al., 2015). Adjustments
in role responsibilities can affect continuous delivery adoption. Claps et al. observed
cross-organizational communication and collaboration, fostered by management, affected
adoption of continuous delivery. Claps et al. added to research from Chen and Leppänen
et al. by reporting changes delivered to their clients through continuous delivery can
cause a lack of feature awareness. Features that are delivered to customers regularly may

81
go unnoticed or cause confusion, especially changes to user interfaces (Claps et al.,
2015).
Claps et al.’s (2015) study was an essential contribution to continuous delivery
adoption body of knowledge because it validated findings by Chen (2015) and Leppänen
et al. (2015), making their results generalizable. Claps et al. chose a different response
collection strategy than Chen and Leppänen et al. by using a proxy, or gate-keeper, to
manage communication between interviewer and interviewee. The use of a gate-keeper
made Claps et al.’s study subject to selection bias limitations. This study uses an online,
quantitative survey to collect responses and therefore differs from the qualitative analysis
offered in Chen, Leppänen et al., and Claps et al. The use of an online survey allows for
broader participation, which was suggested as a limitation and the reason Claps et al.
suggests future research.
Chen (2017) acknowledged the challenge of gaining support from a broad set of
organization representatives when adopting continuous delivery as observed and reported
by Chen (2015), Claps et al. (2015), and Leppänen et al. (2015). Chen (2017) extended
the peer-reviewed continuous delivery adoption literature by constructing strategies to
overcome challenges in a follow-up case study performed at Paddy Power corporation.
Chen (2017) leveraged four years of continuous delivery implementation experience as
the source of information to assert that accelerated time to market, product to market
alignment, improved efficiency and productivity, release reliability, improved customer
satisfaction, and improved product quality are the benefits of adopting and using a
continuous delivery system. Chen (2017) extended Chen (2015) and supported findings

82
by Claps et al., and Leppänen et al. by suggesting six strategies to mitigate challenges
such as:
• Chen (2017) observed including continuous delivery experts from other parts
of the organization, also known as expert drop, was useful in extending a
team’s technology acceptance and experience by sharing knowledge and
experience from other areas of the organization,
• continuous delivery pipeline visualization promotes a consistent
understanding of continuous delivery efforts and current product
development, testing, and release status (Chen, 2017),
• starting with simple but important examples reduces barriers to entry
associated with sophisticated continuous delivery systems (Chen, 2017),
• continuously delivering continuous delivery increases reliability and
confidence in product development (Chen, 2017),
• Chen (2017) posited selling continuous delivery as a painkiller positions
automation as an answer to many of the challenges facing customer
satisfaction,
• and multi-disciplinary teams such as those suggested by DevOps principles
and practices.
Chen’s (2017) study was essential because it validated his previous work (see
Chen, 2015) and the contributions of Leppänen et al. and Claps et al. on challenges of
adopting continuous delivery. Chen (2017) extended peer-reviewed body of knowledge
on continuous delivery adoption by conceptualizing six strategies for improving adoption

83
success. Chen (2017) further suggested empirical testing of organizational structures and
process design that support continuous delivery adoption like the examination in this
study. The studies synthesized in the literature review in this study reflected that
excessive documentation, lengthy processes, architectural limitations, tools, non-
functional requirements, and legacy platforms reported by Fowler and Highsmith (2001)
are still hampering adoption of continuous delivery in many organizations and deserve
closer examination (Chen, 2017). Organizations that choose to adopt continuous delivery
may experience many of the same challenges and benefits (Chen, 2015; Chen, 2017;
Claps et al., 2015; Leppänen et al., 2015). In addition to documenting the challenges and
benefits of adoption, all peer-reviewed studies in this section emphasized that future
continuous delivery adoption empirical research should be conducted with broader
populations (Chen, 2015; Chen, 2017; Claps et al., 2015, Leppänen et al., 2015).
Canvasing broader populations using existing adoption models was evidenced by Chen
(2015), Chen (2017), Claps et al. and Leppänen et al., who reported the effects similar to
performance expectancy, effort expectancy, and facilitating conditions, as moderated by
experience, on continuous delivery adoption using the UTAUT model (Venkatesh et al.,
2003), which was the theoretical foundation of this study. There was direct support for
future research by Chen (2017) in the area of continuous delivery enablement tools,
which statistically related to facilitating conditions and are part of the UTAUT model by
Venkatesh et al. (2003).

84
Continuous Delivery Research
Continuous delivery research efforts have not kept pace with the explosion of new
terms and concepts created by the software development community (Gupta et al., 2017).
Numerous attributes influence DevOps implementation such as those found in maturity
models like the continuous delivery model for continuous delivery and release
management (Humble & Farley, 2010) and the capability maturity model integration.
Maturity models help organizations internally measure and improve software
development practices against industry standards (Fitzgerald & Stol, 2017). Gupta et al.
developed a DevOps maturity model, using a key set of independent attributes, that could
be used to focus future research on the maturity of DevOps practices such as continuous
delivery. Gupta et al. analyzed DevOps practices by executing a two-step method to
determine the effects of 18 independent attributes on maturity and investigate the
relationship between them. Most of the attributes were previously reported by Chen
(2015), Chen (2017), Claps et al. (2015) and Leppänen et al. (2015). Gupta et al.
surveyed 300 senior professionals, working for multi-national software development
organizations, in the field of DevOps, with at least 15 years of enterprise application
experience, regarding the relevance of 18 independent DevOps attributes in support of
their proposed model. Gupta et al. created their model to explain the relationships
between the 18 key attributes. Exploratory and confirmatory factor analysis was used to
confirm the underlying factors for the 18 named attributes (Gupta et al., 2017). Gupta et
al. named continuous delivery, source control, cohesive teams, and automation as latent
variables that serve in a parent relationship to the 18 independent variables.

85
Similar to Chauhan and Jaiswal (2016), Lindsjørn et al. (2016), and Carvalho et
al. (2015), Gupta et al. (2017) used structural equation modeling to validate the
connectivity between the attribute’s peer and parent relationships in the resulting model.
Child attributes of automation and source control were found to be the most influential
factors in adopting and maturing DevOps practices efficiently and key independent child
attributes included: (a) feature toggle, (b) branching scatter, (c) automated code review,
(d) branching changes, (e) automated deployment, (f) automated testing, (g) branching
depth, (h) automated monitoring tools, (i) branching pattern, and (j) infrastructure as code
(Gupta et al., 2017). Gupta et al. executed the two-way assessment inside an enterprise
software development organization to confirm their findings. The organization used
Gupta et al.’s DevOps maturity model to identify and mitigate four lagging attributes and
discovered a 40% increase in maturity level.
Gupta et al.’s (2017) study was an essential contribution to the literature because
project success was statistically related to process maturity (Carvalho et al., 2015). As
reported by Gupta et al. a 40% increase in process maturity may lead to increases in
project success rates. The maturity of software process improvement effects project
success and therefore effects cost, schedule variance, resource availability, and quality
(Carvalho et al., 2015). Gupta et al. asserted maturity model assessment allows
organizations to self-assess and rapidly improve their software development process,
increasing the probability of project success. Project managers influence the use of the
key attributes identified in Gupta et al.’s research and may be able to use this study to
improve adoption of continuous delivery and project success.
86
Laukkanen et al. (2018) agreed with Gupta et al. (2017) that advanced agile
software development practices, such as continuous delivery, are difficult to adopt.
Related software development literature such as Papadopoulos (2015) argued that small
organizations may experience a more natural and more beneficial agile transformation
process than large organizations. Agile development focused on multi-skilled team
members, collaboration, small team size, increased customer interaction, and decisions
made by many (Lindsjørn et al., 2016; Hornstein, 2015). Small team size can be
interpreted to indicate large teams, co-located or globally distributed, may not be able to
adopt agile methods (Papadopoulos, 2015).
Laukkanen et al. executed a case study of one small, 50-member, startup
software-intensive company and one large, 180-member, mature software-intensive
organization to determine the effects of organizational context on advanced release
engineering practice adoption. Laukkanen et al. performed 18 interviews among
organization members with different roles and responsibilities, a total of nine interviews
per business. Laukkanen et al.’s interview incorporated themes such as organizational
structure, software development process, organizational differences, metrics, product
differences, continuous integration, and background information. The organization roles
of Interviewed participants ranged from team member to executive leadership
(Laukkanen et al., 2018). In a similar manner, this study surveyed a single participant
role, technical project manager, to examine the effect they have on behavioral intent to
adopt continuous delivery.

87
Laukkanen et al. observed that release engineering included six distinct focus
areas: (a) infrastructure-as-code, (b) build systems, (c) deployment pipeline, (d) version
control or branching and merging, (e) deployment, and (f) release. Gupta et al. similarly
reported unified teams, source control, automation, and continuous delivery as high-level
attributes. Laukkanen et al.’s study was similar to Gupta et al. 2017), however, Gupta et
al. focused DevOps adoption instead of release engineering. DevOps is a superset of
release engineering and organizational concerns (Gupta et al., 2017). Laukkanen et al.
synthesized the relationship between the release engineering driving forces applicable in
both case organizations. The release engineering driving forces model by Laukkanen et
al. shows how the independent variables positively or negatively affect each other.
Laukkanen et al. posited that the number of customers, number of production
environments, available resources, and degree of control over production environment
affect release capability through internal quality standards. Organization size and
distribution influenced release capability through continuous integration, elements related
to source control management (Laukkanen et al., 2018), which was similar to findings in
Papadopoulos (2015).
Laukkanen et al. reported several differences. Small organizations that have
relatively low organization size can substitute internal testing with customer testing to
avoid decreases in intrinsic quality (Laukkanen et al., 2018). Customer testing was
related to making customers a priority as mentioned in research by Serrador and Pinto
(2016). Small organizations experienced faster release cadence, achieved by continuous
delivery, however, large organizations may achieve faster release cadence by increasing

88
collaboration between departmental roles, facilitated by project managers (Laukkanen et
al., 2018). Laukkanen et al. balanced their statement on faster release cadence by
determining faster release cadence was not a predictor of higher quality standards and
improved reputation, which was the focus of research on information sharing and storage
by Alsmadi and Prybutok (2018).
Laukkanen et al.’s (2018) study on the effects of organizational context on
advanced release engineering practice adoption was an essential contribution to the aims
of this study because it provided validation that project managers have an effect on
continuous delivery. Laukkanen et al. also supported Papadopoulos (2015) who
explained, large, globally distributed organizations that attempt transition to agile
methods experience positive results when agile project managers are trained in soft-skills
such as facilitation, and technical understanding such as influencing the increase of
automation of repetitive tasks. Laukkanen et al. additionally concurred with Serrador and
Pinto (2015) that quality, one element of project success, was not moderated by team
experience and project complexity. Many of the constructs and moderators used in this
study are supported by Laukkanen et al. and provided support for selecting the UTAUT
model (Venkatesh et al., 2003). However, the generalizability of Laukkanen et al.’s study
was limited because it was a small case study and they did not have access to all of the
large organization’s members. Laukkanen et al. reported interpretations that may not be
common knowledge reduced study reliability and repeatability. Laukkanen et al.
suggested future research may examine how to measure internal quality standards and

89
how organizational size and distribution affect release capability through continuous
integration.
Release engineering techniques described by Laukkanen et al. (2018) such as
creating rapid releases of software may distract software-intensive businesses from the
effort to innovate and stay competitive in the software solutions marketplace. Systems
that support rapid releases such as continuous delivery and continuous deployment
consist of tools connected via a workflow, an automated toolchain (Mäkinen et al., 2016).
Mäkinen et al. researched why 18 Finnish software development intensive organizations
chose not to use automated toolchains in certain phases of continuous delivery and
deployment and examined the effect this choice may have on delivery speed. Dissimilar
to this study, Mäkinen et al. used qualitative, semi-structured surveys to gather
information regarding tooling used in the requirements, development, operations, testing,
quality, and feedback phases of continuous delivery by different members of software
development organizations. Mäkinen et al. used thematic analysis to code and produce
results. Background information from other studies such as Claps et al. (2015) and
Leppänen et al. (2015) provided moderators such as industry, organization size, team
size, code platform, primary coding technology, and release cadence. The independent
variable, tool selection, was used to predict delivery speed, the dependent variable
(Mäkinen et al., 2016). Mäkinen et al. did not use or provide a theoretical or conceptual
model for their study, which differs from this study.
Mäkinen et al. discovered release cadence was not affected by variances in the
number of tools implemented. Organizations that lacked tool coverage were able to

90
deliver equally as fast as organizations that implemented tools in most phases, however,
they noted that absence of tool implementation for a given phase was not necessarily
indicative of disregard for the operation performed in the phase (Mäkinen et al., 2016).
Deployment and monitoring tools were the least implemented in the 18 Finnish
organizations surveyed (Mäkinen et al., 2016). An example of a place where continuous
delivery and deployment toolchains were not heavily leveraged was in the industry of
mobile gaming due to the manual testing required for gaming applications (Mäkinen et
al., 2016). The study by Mäkinen et al. invalidated toolchain coverage as a predictor of
release cadence, however, constraints such as the number of participants lead to lack of
generalizability and reliability of findings. Leppänen et al. (2015) and Claps et al. (2015)
did not investigate the linkage between release cadence and toolchain coverage and
therefore Mäkinen et al.’s study served as support for further research to determine why
continuous delivery adoption might be affected by other factors.
Similar to continuous delivery practices studied by Mäkinen et al. (2016),
continuous integration is a sub-practice of continuous delivery that characterized the
source control mechanisms used to absorb developer’s code changes and compile code
into binary format (Pinto, Castor, & Reboucas, 2018). As evidenced by Mäkinen et al. on
continuous delivery benefits and challenges of continuous integration can also be unclear
and lead to technology adoption problems (Pinto et al., 2018). Pinto et al. utilized
qualitative and quantitative measurement to synthesize the attitudes of 158 open-source
developers using the Travis continuous integration platform. Pinto et al. used a survey
containing a mixture of closed and open-ended questions relating to areas such as reasons

91
for build breakage, benefits and challenges of continuous integration systems, personal
background information, experience with continuous integration, and continuous
integration fundamentals. The quantitative, closed-ended survey method used by Pinto et
al. was similar to the method used in this study, however, the open-coding and axial-
coding used to distill themes from the participant responses by Pinto et al. was qualitative
in nature and did not apply to this study.
Pinto et al. (2018) discovered several reasons preceded the adoption of continuous
integration, which included:
• improving communication,
• improving transparency,
• best practices,
• credibility,
• cross-platform testing,
• personal needs,
• enforcement of automated software testing, and
• detecting regressions or bugs.
Pinto et al. discovered builds broke during continuous integration for technical
reasons such as version changes, dependency management, the intricacy of code,
inadequate testing, time-zone differences, missed edge cases, and git misuse (Pinto et al.,
2018). Social reasons for build breakage include: (a) time pressure, (b) lack of testing
culture, (c) lack of domain knowledge, (d) carelessness, (e) lack of communication, and
(f) acceptable build breakage in agile development (Pinto et al., 2018). Many of the social

92
reasons were studied in project management research such as Araújo and Pedron (2015),
Lindsjørn et al. (2016), Serrador and Pinto (2015), Conforto et al. (2014), and Gandomani
and Nafchi (2016), however, they were not referenced and might have provided
additional support for the findings of the study. Pinto et al. reported the benefits of using
a continuous integration system included: (a) catching problems early, (b) automation, (c)
software quality, (d) fast development cycles, (e) cross-platform testing, and (f) build
confidence. Challenges of using a continuous integration system comprised: (a)
configuring the build environment, (b) false sense of confidence, (c) discipline, (d)
additional effort, (e) multiple environments, and (f) monetary costs. The benefits and
challenges from research by Chen (2015), Chen (2017), Claps et al., (2015), and
Leppänen et al. (2015) on continuous practices were not referenced in Pinto et al. and
may have provided more support for their findings. Unlike Pinto et al., this study reached
across continuous practices and project management disciplines to ensure inclusion and
synthesis of related subject matter material to provide strong evidence and support for
findings.
Pinto et al.’s (2018) study was an essential contribution to the continuous
practices body of knowledge because it defined the need for education and guidance as
facilitated by effective project management, however, non-commercial open-source
projects do not typically include project managers and as a result only four of the
respondents were project managers. Pinto et al. posited continuous integration was an
important skill and educators play a significant role in transferring knowledge from
continuous integration experts to developers that had little or no continuous integration

93
experience. Pinto et al.’s findings on education support Alotaibi’s (2016) application of
UTAUT (Venkatesh et al., 2003), with education as a moderator, on adoption of Software
as a Service, and Gandomani’s and Nafchi’s (2016) observations surrounding the
importance of project management’s facilitation of education during the agile
transformation process. Pinto et al. did not include participants from commercial
continuous integration projects and excluded users of other popular continuous
integration platforms, which was the opposite of the population inclusion criteria of this
study.
As Chen (2015), Chen (2017), Claps et al., (2015), and Leppänen et al. (2015)
have documented, continuous practices like continuous delivery can be challenging to
adopt for a variety of reasons such as lack of automation skills, organizational structure,
and, as Mäkinen et al. (2016) supported, tool selection (Shahin et al., 2017). Shahin et al.
(2017) investigated how architectural design and implementation of software may affect
continuous delivery adoption and use. Shahin et al. executed an empirical mixed-methods
study that included a survey of 91 respondents in the professional software field, and
interviews with 21 participants in the software industry to examine their research
question. Interviews were coded using thematic analysis and then combined with a
descriptive statistical analysis of the survey responses (Shahin et al., 2017). Background
information, such as job role, experience, organization size, and organization domain,
was collected from the participants, which could be used as moderators. Shahin et al.’s
inclusion of experience was a reason for examining it as a moderator in this study.
94
Shahin et al. (2017) created a theoretical framework of independent variables
consisting of strategies that influence continuous delivery adoption such as monoliths,
small and independent deployable units, operational aspects, and quality attributes.
• Avoiding monolithic design, and implementing small independent deployable
units have the most potent effect on adopting continuous delivery practices
(Shahin et al., 2017).
• Quality attributes such as the ability to deploy, log, monitor, test, modify, and
avoid failure are all positively influenced by decomposing monolithic
architects into smaller deployable units (Shahin et al., 2017).
• Reusability of code was negatively affected because decomposing monoliths
increased interdependencies between code and organizational structures
(Shahin et al., 2017).
• Delaying architectural decisions, standardizing log output, increasing test
coverage, designing for failure, and prioritizing operational concerns were
ways software architects can improve continuous delivery adoption rates
(Shahin et al., 2017).
Shahin et al. (2017) contributed to the continuous delivery literature by validating
architecture of software applications can affect continuous delivery adoption, and
software architects should be included in the process of selecting and implementing a
continuous delivery practice. Project managers, such as those participating in this study,
can work with architects to understand the technical challenges affecting the adoption of
continuous delivery and share the strategies to mitigate barriers with local teams and the
95
broader organization. Sharing and embodying the architectural strategies characterized by
Shahin et al. agreed with efforts to improve collaboration and communication posited by
Carvalho et al. (2015), Cullen and Parker (2015), Gandomani and Nafchi (2016),
Laukkanen et al. (2018), Lindsjørn et al. (2016), and Papadopoulos (2015). Similar to
Claps et al. (2015), Shahin et al. encouraged future research on changes to the
organizational structure but acknowledged their study was limited to architectural
concerns and a small number of participants.
Summary and Conclusions
The literature of the body of knowledge concerning technology acceptance,
project management, and continuous delivery research suggested an overlap between the
subjects and a need to execute more studies to interrelate them. Literature reviewed
included in this study indicated project success was an area of research where problems
exist and success rates reported by businesses are not acceptable (Carvalho et al., 2015,
Cullen & Parker, 2015; Gandomani & Nafchi, 2016; Papadopoulos, 2015). There are
concerted efforts being made by governing bodies such as PMI, IPMI, and APM to
advance the body of knowledge required for project managers to have a positive effect on
project and agile transformation success (Hornstein, 2015; Seymour & Hussein, 2014),
however, project management research reflects soft-skills related to human factors
required more study (Carvalho et al., 2015).
In addition to the problems concerning project success rates, continuous delivery
research was primarily qualitative and suffered from a lack of generalizability.
Continuous delivery and continuous delivery adoption studies included in this study did

96
not use formal acceptance models to examine the behavior of populations. Semi-
structured interviews provided a way to identify common challenges and benefits
thematically, however, there was still a need to empirically validate results to extend
research (Chen, 2015; Chen, 2017; Claps et al., 2015; Leppänen et al., 2015). Studies in
Software as a Service (Alotaibi, 2016), ERP (Chauhan & Jaiswal, 2016; Wagaw, 2017),
tablets (Magsamen-Conrad et al., 2015), and online information and file sharing services
(Alsmadi & Prybutok, 2018) have each made significant contributions to research by
examining the acceptance of new technology using the UTAUT (Venkatesh et al., 2003)
Continuous delivery adoption, which is the focus of this study, may be examined using
UTAUT. Evidence of support to use a model such as UTAUT was found in studies by
Chen (2015), Chen (2017), Claps et al., and Leppänen et al. that revealed elements
related to performance expectancy, effort expectancy, and facilitating conditions, as
moderated by experience, affect continuous delivery adoption.
The UTAUT (Venkatesh et al., 2003) provides a validated model for
understanding the effects of social and technical factors on project success. This study
examines the possibility that project managers may affect the behavioral intent to adopt
continuous delivery. Studies such as Laukkanen et al. (2018) and Papadopoulos (2015)
provided the project management, agile development, large enterprise, and continuous
delivery support required for the objectives of this study. Chen (2015, 2017) reported
elements closely related to performance expectancy, effort expectancy, and facilitating
conditions affect continuous delivery adoption, which provided support for using the
UTAUT model in this study to examine continuous delivery adoption. This study was

97
designed to provide a contribution to the project management and continuous delivery
body of knowledge and help to fill the gap of knowledge identified by Chen (2015,
2017), Laukkanen et al., and Papadopoulos, through the examination of project manager
behavioral intent to adopt continuous delivery, testing the UTAUT model.
Chapter 2 included a restatement of the problem and purpose of this study, a
summary of the research gap to be studied, the literature search strategy used, a
discussion of the theoretical foundations, and a comprehensive and exhaustive literature
review in the project management, UTAUT (Venkatesh et al., 2003), and continuous
delivery fields of study. Chapter 3 focuses on the research method used for this study.
Chapter 3 includes an introduction to the research design and rationale, study population
and sampling procedure details, plans for analysis, an explanation of threats and ethical
concerns, and a summary.

98
Chapter 3: Research Method
Introduction
The purpose of this study was to address software development project managers’
perceptions on behavioral intent to adopt continuous delivery. The objective was to test
the UTAUT—which relates performance expectancy, effort expectancy, social influence,
and facilitating conditions with behavioral intent to adopt continuous delivery—regarding
software development project managers at large software development organizations.
Chapter 3 is separated into three parts. The first part includes an introduction to the
research design and rationale, detail concerning the study population and sampling
procedures, and a description of plans for analysis. The second part contains an
explanation of threats and ethical concerns, and a review of trustworthiness. Chapter 3
concludes with a summary.
Research Design and Rationale
The independent variables for this study included UTAUT’s (Venkatesh et al.,
2003) performance expectancy, effort expectancy, social influence, and facilitating
conditions, as moderated by experience. Experience was the only moderator because
research has indicated that it can have a statistically significant effect on effort
expectancy, social influence, and facilitating conditions. Age, gender, and voluntariness
of use as moderators have not reflected statistically significant effects and therefore were
excluded from this study. UTAUT’s behavioral intent was the dependent variable. Use
behavior was not included as a dependent variable because research has indicated that it
is redundant and is a subjective self-measurement (Shahin et al., 2018; Walldén et al.,

99
2016). The removal of use behavior led to looking at facilitating conditions as an
independent variable affecting behavioral intent. Research has indicated that facilitating
conditions positively predicted 24% of behavioral intent variance concerning mobile
tablet use (Magsamen-Conrad et al., 2015), meaning that the change in relationship was
valid for the purpose of this study.
Due to the augmentation of the UTAUT model used in this study, it was
necessary to assemble an expert panel to provide content validity by evaluating the
survey questions (Appendix E), research questions, problem statement, and purpose
statement. The panel consisted of three industry subject matter experts in enterprise
software development, project management, and continuous delivery. I invited the
members to the expert panel via e-mail by providing them with the survey questions
(Appendix E), research questions, problem statement, purpose statement, original model,
proposed model, and a request for their participation. The first panel member was a 30-
year industry veteran with expertise in enterprise software architecture, design, and
implementation. This expert panel member has expertise in project management and
mathematics, was a guest lecturer and adjunct associate undergraduate computer science
professor at a university. The second panel member was an enterprise software solution
expert with 35 years of experience working with continuous delivery of services for
major financial organizations around the world. This expert panel member has held the
title of CTO for an organization specialized in architecture, design, and implementation
of enterprise-level and project-level software development lifecycles. The third panel
member was a 28-year enterprise software development industry veteran with specific
100
expertise in DevOps. This expert panel member holds an honors management and
computer science, a master’s in business administration, and has been a multi-year
honorary teaching fellow for two universities and one company in the area of IT
architecture and data science.
The questions for the survey in this study were adapted directly from the original
UTAUT study (Venkatesh et al., 2003). The expert panel members individually evaluated
the survey questions, research questions, problem statement, purpose statement, original
model, and proposed model for this study. I asked the panel members to review the
removal of use behavior, as a dependent variable, and the reassignment of the facilitating
conditions independent variable to the behavioral intent dependent variable as indicated
in Magsamen-Conrad et al. (2015). All three expert panel members agreed that the
changes made to remove one of the independent variables (use behavior ) and adjust the
independent variable (facilitating conditions) relationship to the remaining dependent
variable (behavioral intent) were acceptable for the purpose of this study. No additional
changes were suggested by the expert panel members.
After the survey questions were reviewed by the panel, I used a modified version
of Venkatesh et al.’s (2003) survey for performance expectancy, effort expectancy, social
influence, facilitating conditions, experience, and behavioral intention. In addition to the
independent and dependent variable constructs, experience as a moderator was
represented by a question in the demographic section of the survey included in this study.
Each survey item was used to determine the effect of each contributing factor on the
behavioral intent to adopt continuous delivery that software development project
101
managers experienced. Multiple regression analysis and bivariate correlation was used to
determine if any constructs affect behavioral intent to adopt continuous delivery.
The research design was consistent with the UTAUT literature on technology
adoption. The UTAUT measures independent variables that represent technical and social
factors (Amrit et al., 2014) and therefore can be used to measure effects of project
managers on adoption of agile practices, such as continuous delivery. Studies have
validated the use of the UTAUT model to examine the effect of human and technical
factors on technology adoption (Alotaibi, 2016; Alsmadi & Prybutok, 2018; Chauhan &
Jaiswal, 2016; Magsamen-Conrad et al., 2015; Wagaw, 2017). The research design
aligned with the gaps of knowledge identified in continuous delivery challenges by
Laukkanen et al. (2018); organization size, project management, and agile transformation
by Papadopoulos (2015); and continuous delivery adoption challenge mitigation
strategies by Chen (2015, 2017). The research design may advance knowledge in
continuous delivery through the examination of project manager’s behavioral intent to
adopt continuous delivery by testing the UTAUT model (Venkatesh et al., 2003).
The research design required access to individual project managers. Project
manager groups are available through LinkedIn. LinkedIn is a career professional social
media platform where project management groups exist and that allow permission and
access to their membership. This study was intended to include project management
professional members from the PMI, participants from a national database, and
participants from SurveyMonkey; however, permission to use and cost of acquiring an e-
mail list of project management professionals from the PMI or a list of project managers

102
from national databases, or a participant pool from SurveyMonkey was prohibitive and
therefore was a constraint.
Methodology
Population
The general population for this study was all English-speaking project managers
over the age of 18 who have worked for professional software intensive businesses. The
target population was recruited from LinkedIn project management groups. The LinkedIn
group PMI Project, Program and Portfolio Management contains 239,330 members (PMI
Project, Program and Portfolio Management, n.d.), Project Manager Community - Best
Group for Project Management has 379,275 members (Project Manager Community -
Best Group for Project Management. (n.d.), The Project Manager Network - #1 Group for
Project Managers includes 865,903 members (The Project Manager Network - #1 Group
for Project Managers, n.d.), PMI NYC Chapter has 936 members (PMI NYC Chapter,
n.d.), and PMI Long Island Chapter has 1,708 members (PMI Long Island Chapter, n.d.).
I sent LinkedIn connection invitations to random members of LinkedIn project
management groups. The LinkedIn connection invitation included a recruitment
statement that asked if they would like to participate in this study as a project
management professional and include a link to the SurveyMonkey survey (Appendix E).
The SurveyMonkey survey included a consent form on the first page that the respondent
must accept before participating. The total target population covered by all LinkedIn
groups was 1,487,152. The target sample size for this study was 82 based on an a priori
power analysis. If 1% of the target population took the survey, there would be 14,871
103
responses, 181 times the number of responses needed to satisfy the calculated sample size
required for this study. I sent connection requests to random individuals in targeted
population groups in the following order:
1. PMI Project, Program and Portfolio Management
2. Project Manager Community - Best Group for Project Management
3. The Project Manager Network - #1 Group for Project Managers
4. PMI NYC Chapter
5. PMI Long Island Chapter
Submitting posts to one target population at a time allowed a contingency plan in
case fewer than 82 survey responses were collected. The survey was created and
distributed with SurveyMonkey. Online surveys provide an easy method to access
questionnaires by study participants and access to results by surveyors (Rea & Parker,
2014).
Sampling and Sampling Procedures
Simple random sampling (de Mello et al., 2015) was used to collect responses.
Simple random sampling was consistent with targeting a random collection of English-
speaking, project managers from LinkedIn professional project management groups. The
survey link was distributed to professional project management LinkedIn members over
the age of 18 through direct message after they accept my initial connection invitation.
An a priori power analysis was performed using Faul, Erdfelder, Buchner, and
Lang’s (2009) G*Power 3.1.9.4 application using a two-tail, point biserial model
correlation, medium effect size of 0.30, power of 0.80, and .05 error probability

104
(Khechine, Lakhal, & Ndjambou, 2016). According to G*Power (Faul et al., 2009), a
sample size of 82 participants was required to achieve reliable results. The medium effect
is aligned with previous UTAUT studies completed (Khechine et al., 2016).
Procedures for Recruitment, Participation, and Data Collection
An online, English-only, self-administered, cross-sectional survey consisting of
six sections was constructed using SurveyMonkey to collect primary data. After approval
from the Walden University Institutional Review Board (IRB; approval no. 06-25-19-
0199742) was granted and permission from the LinkedIn members was granted, the
survey link was given to the LinkedIn member through direct message. LinkedIn
participants were recruited by sending a connection invitation that included the purpose
of this study, information regarding qualification criteria and confidentiality, Walden’s
IRB contact information, and a link to the SurveyMonkey questionnaire.
The SurveyMonkey survey consisted of an introduction; informed consent
section; one qualification section; one demographic section, which includes a question on
experience; a Likert Scale (Joshi, Kale, Chandel, & Pal, 2015); closed-ended question
sections; and a disqualification page. The introduction included an explanation that the
term system refers to the continuous delivery system they experienced. In the informed
consent section, if the participant agreed to informed consent, they were redirected to the
qualification section; if they did not agree, they were redirected to the disqualification
page and were no longer able to participate in the survey. In the qualification section, if
the participant acknowledged that they are, or were, a project manager, over the age of
18, for an organization responsible for software development they were redirected to the

105
demographic section of the survey; if they did not indicate this criteria, they were
redirected to the disqualification page. The first section of the survey collected
nonidentifying background information such as business revenue, business industry,
participant experience, and length of the project. The survey questions from Venkatesh et
al. (2003) were used in the closed-ended sections two through six.
Participants had the option to go to previous sections by clicking back to adjust
their responses and to the next section by clicking next. A progress bar was provided to
indicate the current survey page and the percentage complete. The survey was marked
complete when the participant clicked submit on the final page of the closed-ended
question section. There were no debriefing procedures or requirements for follow-up
interviews. No identifying information was collected from the participants of the survey.
Aggregate results of the survey were shared with the targeted LinkedIn groups upon the
publishing of this study.
Instrumentation and Operationalization of Constructs
This study was designed to capture the perceptions of project managers as it
relates to adoption of continuous delivery systems. Understanding the effect of
performance expectancy, effort expectancy, social influence, and facilitating conditions,
as moderated by experience, perceived by project management on continuous delivery
may help businesses adopt continuous delivery more efficiently. I used the UTAUT,
which was supported by previous research on project management and continuous
delivery. For example, Laukkanen et al. (2018) and Papadopoulos (2015) indicated
project management characteristics that affect the adoption of technology. Additionally,

106
Chen (2015, 2017) reported that individual expectations concerning performance and
effort, facilitating conditions, and experience affect the adoption of continuous delivery.
Further, Venkatesh et al.’s UTAUT has been applied to many technologies including
Software as a Service (Alotaibi, 2016), ERP training (Chauhan & Jaiswal, 2016),
homegrown ERP (Wagaw, 2017), internet sharing and file storage (Alsmadi & Prybutok,
2018), and mobile tablets (Magsamen-Conrad et al., 2015).
Measurements of reliability such as internal consistency are assessed using
Cronbach’s alpha, Split-half correlation, and the Spearman-Brown prediction formula.
Reliability testing for Venkatesh et al.’s (2003) UTAUT model was sufficient for this
study because the survey questions are reused from the UTAUT. Cronbach’s alpha for
the four independent variables of Venkatesh et al.’s UTAUT model scored .70 or higher,
exceeding the threshold needed for testing (Lescevica, Ginters, & Mazza, 2013). Use
behavior, in the original UTAUT model did not include examples of questions
(Venkatesh et al., 2003), so removing it does not affect the original Cronbach alpha
calculation of the model used in this study. Split-half correlation and the Spearman-
Brown formula for the UTAUT model constructs approach 1.0, indicating acceptable
conditions for use in this study (Lescevica et al., 2013). The publisher (see Appendix B)
and one author (see Appendix A) of the UTAUT model (Venkatesh et al., 2003) provided
permission to use the figures, tables, and survey questions in this study. External and
internal validity are addressed later in Chapter 3 as part of the Threats to Validity section.
Operationalization of constructs. Five constructs and one moderator of the
UTAUT model (Venkatesh et al., 2003) were measured in the closed-ended survey

107
questions. The participants were informed in the introduction page of the survey that each
question uses the term system to refer to the continuous delivery system they experienced.
A 5-point Likert Scale that ranged from strongly disagree to strongly agree was used to
collect participant responses to all items. A Likert scale is a psychometric technique that
was designed to measure attitude (Joshi et al., 2015) and is consistent with measuring
UTAUT model constructs and moderators (Venkatesh et al., 2003). Participants were
presented with a series of statements representing each of the five constructs and one
question on experience. Only one response could be selected for each statement
representing each construct and moderator. For each construct and moderator measured
an operational definition, related items, scoring calculation, score representation, and
examples of use were provided. Pearson’s product-moment correlation coefficient, or
bivariate correlation (r), was used to measure the weighted numeric values associated
with the responses for each of the closed-ended items. Using Pearson’s product-moment
correlation coefficient was validated by Wagaw’s (2017) research on homegrown ERP
systems using the UTAUT model (Venkatesh et al., 2003). After the weighted numeric
values were calculated, a stepwise multiple linear regression analysis was used to
determine if there was a relationship between the multiple independent variables and the
dependent variable. A narrative was constructed around the regression results based on
acceptance or rejection of the null hypothesis for each research question.
Performance expectancy is the degree to which a person perceives that using a
specific system helps them achieve higher job performance (Venkatesh et al., 2003).
Performance expectancy was measured with responses to four items:

108
1. I would find the system useful in my job.
2. Using the system enables me to accomplish tasks more quickly.
3. Using the system increases my productivity.
4. If I use the system, I will increase my chances of getting a raise.
A score was assigned to performance expectancy by calculating the bivariate correlation
(r) of the weighted numeric values associated with the responses for each of the four
items. Once the numeric weight was calculated it was used in a stepwise multiple linear
regression analysis to determine the strength and direction of the relationship between
performance expectancy and behavioral intent. The resulting score for performance
expectancy represents how the adoption of a continuous delivery system affected the
project manager’s ability to complete their tasks with more or less personal benefit. If a
project manager strongly disagrees that using a continuous delivery system would
increase his or her productivity, then performance expectancy is likely to have a weaker
effect on the project manager’s behavioral intent to adopt continuous delivery.
Effort expectancy is the degree to which a person perceives the difficulty
associated with using a specific system (Venkatesh et al., 2003). Effort expectancy was
measured with responses to four items:
1. My interaction with the system would be clear and understandable.
2. It would be easy for me to become skillful at using the system.
3. I would find the system easy to use.
4. Learning to operate the system is easy for me.
109
A score was assigned to effort expectancy by calculating the bivariate correlation (r) of
the weighted numeric values associated with the responses for each of the four items.
Once the numeric weight was calculated it was used in a stepwise multiple linear
regression analysis to determine the strength and direction of the relationship between
effort expectancy and behavioral intent. The resulting score for effort expectancy
represents how the adoption of a continuous delivery system affected the project
manager’s ability to complete their tasks with more or less effort. If a project manager
strongly agrees that using a continuous delivery system would be easy to use, then effort
expectancy is likely to have a stronger effect on the project manager’s behavioral intent
to adopt continuous delivery. Experience, as a moderator, was included to determine if it
has any effect on the relationship between effort expectancy and behavioral intent.
Social influence is the degree to which a person perceives that other important
people encourage the use of a specific system (Venkatesh et al., 2003). Social influence
was measured with responses to four items:
1. People who influence my behavior think that I should use the system.
2. People who are important to me think that I should use the system.
3. The senior management of this business has been helpful in the use of the
system.
4. In general, the organization has supported the use of the system.
A score was assigned to social influence by calculating the bivariate correlation (r) of the
weighted numeric values associated with the responses for each of the four items. Once
the numeric weight was calculated it was used in a stepwise multiple linear regression

110
analysis to determine the strength and direction of the relationship between social
influence and behavioral intent. The resulting score for social influence represents how
the project manager’s peers view their use of the continuous delivery system. If a project
manager strongly disagrees that people who are important to him or her think that he or
she should use the system, then social influence is likely to have a weaker effect on the
project manager’s behavioral intent to adopt continuous delivery. Experience, as a
moderator, was included to determine if it has any effect on the relationship between
social influence and behavioral intent.
Facilitating conditions is the degree to which a person perceives that technical and
organizational support exists to support the use of a specific system (Venkatesh et al.,
2003). Facilitating conditions was measured with responses to four items:
1. I have the resources necessary to use the system.
2. I have the knowledge necessary to use the system.
3. The system is not compatible with other systems I use.
4. A specific person (or group) is available for assistance with system
difficulties.
A score was assigned to facilitating conditions by calculating the bivariate correlation (r)
of the weighted numeric values associated with the responses for each of the four items.
Once the numeric weight was calculated it was used in a stepwise multiple linear
regression analysis to determine the strength and direction of the relationship between
facilitating conditions and behavioral intent. The resulting score for facilitating
conditions represents the resources available to assist the use of a continuous delivery

111
system by a project manager. If a project manager strongly agrees that there are
resources in place to help them use the system, then facilitating conditions is likely to
have a stronger effect on the project manager’s behavioral intent to adopt continuous
delivery. Experience, as a moderator, was included to determine if it has any effect on the
relationship between facilitating conditions and behavioral intent.
Behavioral intent is the degree to which a person believes they will use a system
in the future (Venkatesh et al., 2003). Behavioral intent was measured with responses to
three items:
1. I intend to use the system in the next 3 months.
2. I predict I would use the system in the next 3 months.
3. I plan to use the system in the next 3 months.
A score was assigned to behavioral intent by calculating the bivariate correlation (r) of
the weighted numeric values associated with the responses for each of the three items.
The score for behavioral intent represents the project manager’s intention to adopt a
continuous delivery system. If a project manager has strongly disagreed that they plan to
use a system in the next 3 months, then behavioral intent to adopt continuous delivery is
likely to be weaker.
Data Analysis Plan
An a priori power analysis was performed that indicated a minimum of 82
participants was required for this study. The survey was available until 82 or more
responses are collected. Incomplete surveys were discarded. 85 surveys were collected
after 17 days of survey availability. A weighted numeric value represents the Likert Scale

112
ranging from strongly disagree to strongly agree: 1 for strongly disagree, 2 for disagree, 3
for neither agree or disagree, 4 for agree, 5 for strongly agree (Joshi et al., 2015). Data
was downloaded from SurveyMonkey and imported into IBM’s Statistical Package for
Social Sciences (SPSS) v25. SPSS was used to analyze the weighted numerical value
data collected from the respondents using multiple regression.
Research questions. The following research questions were used to guide this
study:
Research Question 1: What is the relationship between performance and
continuous delivery adoption?
H01: No statistically significant relationship exists between performance
expectancy and behavioral intent to adopt continuous delivery.
Ha1: A statistically significant relationship exists between performance
expectancy and behavioral intent to adopt continuous delivery.
Research Question 2: What is the relationship between effort expectancy and
continuous delivery adoption?
H02: No statistically significant relationship exists between effort expectancy and
behavioral intent to adopt continuous delivery.
Ha2: A statistically significant relationship exists between effort expectancy and
behavioral intent to adopt continuous delivery.
Research Question 3: What is the relationship between social influence and
continuous delivery adoption?

113
H03: No statistically significant relationship exists between social influence and
behavioral intent to adopt continuous delivery.
Ha3: A statistically significant relationship exists between social influence and
behavioral intent to adopt continuous delivery.
Research Question 4: What is the relationship between facilitating conditions and
continuous delivery adoption?
H04: No statistically significant relationship exists between facilitating conditions
and behavioral intent to adopt continuous delivery.
Ha4: A statistically significant relationship exists between facilitating conditions
and behavioral intent to adopt continuous delivery.
Research Question 5: How does experience moderate the relationship between
effort expectancy and behavioral intent to adopt continuous delivery?
H05: Experience has no moderating effect on the relationship between effort
expectancy and behavioral intent to adopt continuous delivery.
Ha5: Experience has a moderating effect on the relationship between effort
expectancy and behavioral intent to adopt continuous delivery.
Research Question 6: How does experience moderate the relationship between
social influence and behavioral intent to adopt continuous delivery?
H06: Experience has no moderating effect on the relationship between social
influence and behavioral intent to adopt continuous delivery.
Ha6: Experience has a moderating effect on the relationship between social
influence and behavioral intent to adopt continuous delivery.
114
Research Question 7: How does experience moderate the relationship between
facilitating conditions and behavioral intent to adopt continuous delivery?
H07: Experience has no moderating effect on the relationship between facilitating
conditions and behavioral intent to adopt continuous delivery.
Ha7: Experience has a moderating effect on the relationship between facilitating
conditions and behavioral intent to adopt continuous delivery.
Regression analysis was used to measure the statistical significance of
relationships between the independent variables: performance expectancy, effort
expectancy, social influence, and facilitating conditions, as moderated by experience, and
the dependent variable behavioral intent. According to Halinski and Feldt (1970),
multiple regression analysis can be used to calculate a single value that represents
multiple predictors. The value associated with the strength of a relationship between
multiple independent variables and a single dependent variable was consistent with the
use of multiple regression analysis techniques. The bivariate correlation (r) calculated for
a relationship between significant independent and dependent variable ranges from -1.0
to +1.0. A calculated value closer to -1.0 indicates a weak correlation, and a value closer
to +1.0 represents a stronger correlation to a dependent variable from the independent
variable.
Threats to Validity
Threats to validity include external, internal, construct and statistical conclusion.
Examples of external validity threats include: multiple-treatment interference, reactive
effects of experimental arrangements, and specificity of variables (Reio, 2016). External
115
validity is concerned with the degree to which research findings can be generalized to
populations outside a study’s participant pool (Alahyari et al., 2019). Multiple-treatment
interference is described as the different treatment that participants may be exposed to
when engaging and therefore affecting the respondent’s responses in the future (Kourea
& Lo, 2016). This study included a one-time study whereby participants are not able to
take the survey multiple times. Multiple-treatment interference was not a concern in this
study. Reactive effects of experimental arrangements are defined as the effect a pre-test
may have on a participant’s responses (Campbell & Stanley, 1963). Reactive effects of
experimental arrangements are not a concern in this study because there was no pre-test.
Specificity of variables is described as the generalizability of the operationalized
variables (Kourea & Lo, 2016). UTAUT (Venkatesh et al., 2003) has been applied to a
variety of technologies, and therefore its operationalized variables are well known and
are generalizable. This study was not affected by the specificity of variables as a threat to
external validity.
The population of this study was small compared to the total population of project
managers. Small populations can incur a threat to external validity because the findings
may not be generalizable. Simple random sampling and statistical power of .80 in the
power analysis performed was used to reduce the threat to external validity.
Examples to internal validity include: maturation, history, instrumentation, and
statistical regression (Reio, 2016). Maturation refers to participants maturity related to the
subject matter being research (Gage & Stevens, 2018). Project manager skill sets are
likely to mature with years of experience and number of projects managed. Project

116
manager adoption of continuous delivery may mature, and therefore maturation was a
threat to internal validity for this study. History is defined as the passage of time between
participant testing (Yilmaz, O’Connor, Colomo-Palacios, & Clarke, 2017). This study
was non-longitudinal and therefore does not incur history as a threat to internal validity.
Instrumentation refers to the changes in elements of a study such as a survey and scoring
that may affect the outcome of the experiment (Reio, 2016). This study requires Walden
University IRB approval, which stipulates all elements must not be changed before a
survey was distributed and taken by willing participants. Instrumentation was not a threat
to internal validity for this study. Statistical regression is defined as the biased selection
of high or low scoring responses to guarantee an outcome (Campbell & Stanley, 1963)
and was applied in this study. Simple random sampling was used to prevent selection bias
and was therefore not a threat to internal validity for this study (de Mello et al., 2015).
Threats to the statistical conclusion or construct validity for this study may arise
because there has been no prior UTAUT (Venkatesh et al., 2003) research that examines
project managers perceptions as they relate to continuous delivery adoption and use.
Assumptions concerning the responsibility of the project manager as it relates to
continuous delivery adoption were made based on an exhaustive literature review,
however, this may not be enough evidence to substantiate a real relationship exists. The
execution of this study may encourage testing of the UTAUT model (Venkatesh et al.,
2003) with individuals holding other roles in an agile organizational structure. Future
research in the area of continuous delivery adoption may reduce statistical conclusion or
construct validity.

117
Ethical Procedures
The purpose of this study was to examine the extent to which the Venkatesh et
al.’s (2003) UTAUT relates the independent variables, performance expectancy, effort
expectancy, social influence, and facilitating conditions, as moderated by experience, to
the dependent variable of behavioral intent to adopt continuous delivery as perceived by
project managers in enterprise software-intensive businesses. Before a survey to collect
responses was issued, and responses were collected, the Walden University Institutional
Review Board (IRB, Approval No. 06-25-19-0199742) approved the study proposal. The
Walden University IRB is responsible for minimizing the risk that participants may be
subject to by participating in this study. Walden University’s IRB approval ensures that
all United States federal guidelines are followed.
No relationship exists with the participants, and therefore there are no perceived
ethical concerns. All participants received notice that their responses are anonymous and
confidential. All data was collected anonymously and confidentially because no
identifying information was requested from the participants. Potential respondents were
required to acknowledge informed consent, and they were able to cancel the survey at
any time without risk of inclusion. The data collected was encrypted and stored by
SurveyMonkey. Data will be kept for a period of at least 5 years, as required by Walden
University.
Summary
Chapter 3 included an introduction, research design, and rationale, detailed
method information concerning population and sampling procedures, data collection

118
details, explanation of operationalization of constructs used, threats to validity, and
ethical procedures. Chapter 4 will include detailed information concerning data collection
and study results. Chapter 5 will include an interpretation of findings, limitations of the
proposed study, implications for change, and a conclusion.

119
Chapter 4: Results
Introduction
This study was focused on the problem that some software development project
managers in large enterprise organizations are not aligned with the relationship between
performance expectancy, effort expectancy, social influence, and facilitating conditions,
as moderated by experience, and behavioral intent to adopt continuous delivery. The
purpose of this quantitative, regression analysis study was to test the UTAUT (Venkatesh
et al., 2003) independent variables (performance expectancy, effort expectancy, social
influence, and facilitating conditions, as moderated by experience) with the dependent
variable (behavioral intent to adopt continuous delivery) for software development
project managers at large software development organizations. Chapter 4 is divided into
two parts. The first part includes information on the data collection, recruitment, and
response rates using demographic and descriptive characteristics. Differences between
the plan presented in Chapter 3 and the actual collection are explained in addition to a
discussion of how the collected data represents the larger population of possible
respondents. The second part of Chapter 4 contains a narrative to explain the results
through descriptive statistics organized by research questions and hypotheses using tables
and figures. Chapter 4 concludes with a summary and transition to Chapter 5.
Data Collection
The recruitment statement and a link to the SurveyMonkey survey were sent as
LinkedIn connection requests to 1,521 randomly selected members of five different
LinkedIn software development project management focus groups:

120
• PMI Project, Program and Portfolio Management
• Project Manager Community - Best Group for Project Management
• The Project Manager Network - #1 Group for Project Managers
• PMI NYC Chapter
• PMI Long Island Chapter
The survey included a consent form, which contained background information regarding
the UTAUT and the constructs tested in this study, survey instructions, sample questions,
risks and benefits, privacy, and important contact information. Table 1 reflects the survey
response rates based on LinkedIn group name, the number of members, the number of
invites send, and the number of responses.
Table 1 Group Survey Response Rates
Group(s) Campaign Members Invites Sent
Accepts Response Rate
Completion Rate
PMI Project, Program and Portfolio Management
1 239,330 342 16 0.047 0.029
Project Manager Community - Best Group for Project Management
2 379,275 313 25 0.080 0.064
The Project Manager Network - #1 Group for Project Managers
3 865,903 351 26 0.074 0.051
PMI NYC Chapter 4 936 358 34 0.095 0.059
PMI Long Island Chapter 5 1,037 157 5 0.032 0.019
Reminder to participate (All Groups)
6 291 18 0.062 0.045
The overall response rate of 5.5% was based on 1,521 connection invitations and
85 completed surveys. There were 291 LinkedIn invitation acceptances out of 1,521
invitations sent using six different SurveyMonkey collection campaign links. Of the 291
121
accepted invitations, 124 (43%) clicked on the survey link. Of the 124 surveys started, 85
completed the survey (69%). The sample target of 82 participants for this study was
exceeded in 17 days, which was less than the proposed estimate of 4 weeks. A reminder
to participate was sent out during the second week of the survey to encourage
participation from those who accepted the invitation but had not completed the survey.
The low response rate may be attributed to disinterest in the subject matter or caution
with respect to clicking on links from a survey company. The reduced amount of time
needed to conduct the survey may be attributed to the reminder to participate.
The plan for data collection detailed in Chapter 3 was followed carefully. The
recruitment statement and survey link were sent to members of the five groups, and the
SurveyMonkey survey remained open for 2-and-a-half weeks. Most responses occurred
within the first 24 hours of sending the link to participants. One reminder notice was sent
to the randomly selected group members who had accepted the invitation to participate.
Every participant utilized the SurveyMonkey link to submit their responses. All responses
were exported from SurveyMonkey after the survey participation was satisfied.
SurveyMonkey will retain and secure the survey results for a period of 5 years.
Baseline Descriptive Statistics
Table 2 contains the central tendency, as calculated by mean scores, and variance,
as calculated by standard deviation, for all independent and dependent variables. The
mean scores for all variables ranged between 3.37 and 3.90. The small spread between
the mean scores indicated scoring was in roughly the same range for all independent
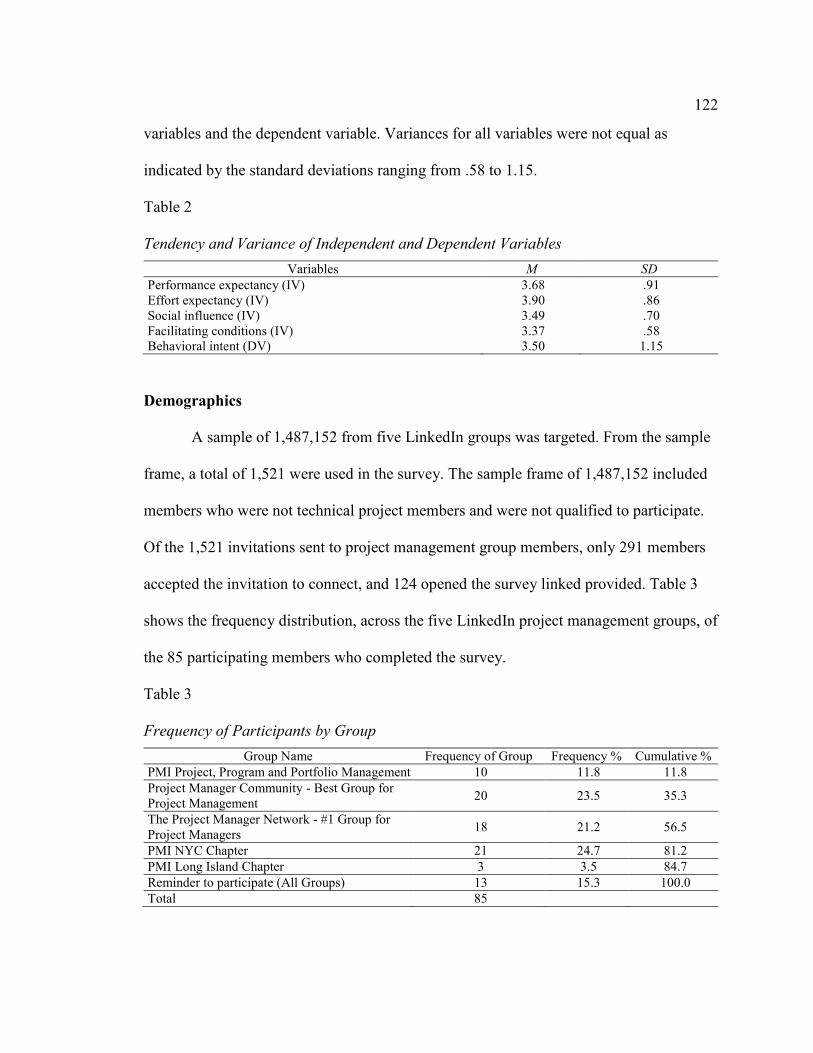
122
variables and the dependent variable. Variances for all variables were not equal as
indicated by the standard deviations ranging from .58 to 1.15.
Table 2 Tendency and Variance of Independent and Dependent Variables
Variables M SD
Performance expectancy (IV) 3.68 .91 Effort expectancy (IV) 3.90 .86 Social influence (IV) 3.49 .70 Facilitating conditions (IV) 3.37 .58 Behavioral intent (DV) 3.50 1.15
Demographics
A sample of 1,487,152 from five LinkedIn groups was targeted. From the sample
frame, a total of 1,521 were used in the survey. The sample frame of 1,487,152 included
members who were not technical project members and were not qualified to participate.
Of the 1,521 invitations sent to project management group members, only 291 members
accepted the invitation to connect, and 124 opened the survey linked provided. Table 3
shows the frequency distribution, across the five LinkedIn project management groups, of
the 85 participating members who completed the survey.
Table 3 Frequency of Participants by Group
Group Name Frequency of Group Frequency % Cumulative %
PMI Project, Program and Portfolio Management 10 11.8 11.8
Project Manager Community - Best Group for Project Management
20 23.5 35.3
The Project Manager Network - #1 Group for Project Managers
18 21.2 56.5
PMI NYC Chapter 21 24.7 81.2
PMI Long Island Chapter 3 3.5 84.7
Reminder to participate (All Groups) 13 15.3 100.0
Total 85

123
From the 85 participants, 91% were from the United States. Canada, India,
Panama, and Singapore were represented by 1 participant each. There was a total of four
participants who came from countries not listed in the survey selection list. Based on the
frequency of participant location shown in Table 4, this study was concentrated primarily
on behavior of project managers based in the United States. The 85 participants
accounted for less than 1% of the target population.
Table 4 Frequency of Participant Location
Country Frequency of Country Frequency % Cumulative %
United States 77 90.6 90.6 Canada 1 1.2 91.8 India 1 1.2 92.9 Panama 1 1.2 94.1 Singapore 1 1.2 95.3 Other 4 4.7 100.0 Total 85
The sample consisted of participants working in at least 18 different industry
sectors. Table 5 shows financial services (21.2%) lead the frequency distribution,
followed by health, pharmaceuticals, and biotech (11.8%), and e-commerce software
(12.9%). The variety of industries represented supported that technical project
management was present in traditionally nontechnical business sectors.
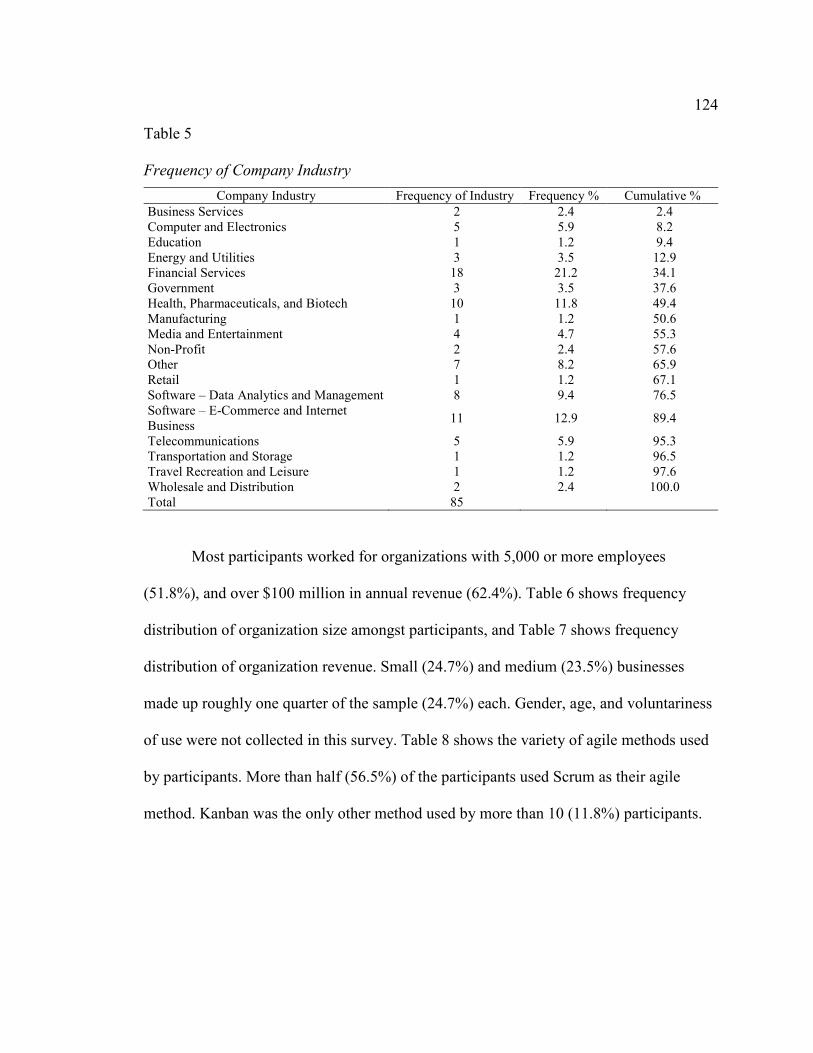
124
Table 5 Frequency of Company Industry
Company Industry Frequency of Industry Frequency % Cumulative %
Business Services 2 2.4 2.4 Computer and Electronics 5 5.9 8.2 Education 1 1.2 9.4 Energy and Utilities 3 3.5 12.9 Financial Services 18 21.2 34.1 Government 3 3.5 37.6 Health, Pharmaceuticals, and Biotech 10 11.8 49.4 Manufacturing 1 1.2 50.6 Media and Entertainment 4 4.7 55.3 Non-Profit 2 2.4 57.6 Other 7 8.2 65.9 Retail 1 1.2 67.1 Software – Data Analytics and Management 8 9.4 76.5 Software – E-Commerce and Internet Business
11 12.9 89.4
Telecommunications 5 5.9 95.3 Transportation and Storage 1 1.2 96.5 Travel Recreation and Leisure 1 1.2 97.6 Wholesale and Distribution 2 2.4 100.0 Total 85
Most participants worked for organizations with 5,000 or more employees
(51.8%), and over $100 million in annual revenue (62.4%). Table 6 shows frequency
distribution of organization size amongst participants, and Table 7 shows frequency
distribution of organization revenue. Small (24.7%) and medium (23.5%) businesses
made up roughly one quarter of the sample (24.7%) each. Gender, age, and voluntariness
of use were not collected in this survey. Table 8 shows the variety of agile methods used
by participants. More than half (56.5%) of the participants used Scrum as their agile
method. Kanban was the only other method used by more than 10 (11.8%) participants.

125
Table 6 Frequency of Organization Size
Number of Employees Frequency of Organization Frequency % Cumulative %
1-100 10 11.8 11.8 100-500 11 12.9 24.7 500-2000 9 10.6 35.3 2000-5,000 11 12.9 48.2 5,001+ 44 51.8 100.0 Total 85
Table 7 Frequency of Revenue Size
Revenue ($) Frequency of Revenue Frequency % Cumulative %
0-10 million 13 15.3 15.3 10-20 million 5 5.9 21.2 20-50 million 5 5.9 27.1 50-100 million 9 10.6 37.6 100+ million 53 62.4 100.0 Total 85
Table 8 Frequency of Agile Method Used
Agile Method Frequency of Use Frequency % Cumulative %
Adaptive Software Development 4 4.7 4.7 Agile Modeling 6 7.1 11.8 Disciplined Agile Delivery 3 3.5 15.3 Feature-Driven Development 4 4.7 20.0 Lean Software Development 4 4.7 24.7 Kanban 10 11.8 36.5 Rapid Application Development 1 1.2 37.6 Scrum 48 56.5 94.1 Scrumban 3 3.5 97.6 Test-Driven Development 2 2.4 100.0 Total 85

126
Table 9 shows the years of experience reported by the survey participants. Many
of the participants had 9 or more years (40%) of project management experience. Most
participants had 8 or fewer years of project management experience (60%). Table 10
shows that most participants reported an even distribution of project counts; however,
many have managed over nine projects (40%). Table 11 reflects the length of projects
managed by participants was more than 10 months (60%). The variance in experience
was necessary to answer the research questions in this study concerning the effect of
experience on the relationships between effort expectancy, social influence, facilitating
conditions, and behavioral intent to adopt continuous delivery. Information regarding the
effect of experience as a mediator on the UTAUT constructs is later in this analysis. The
terms mediator and covariate are used interchangeably throughout this study.
Table 9 Frequency of Years of Experience
Years of Experience Frequency of Experience Frequency % Cumulative %
1-2 5 5.9 5.9 3-4 21 24.7 30.6 5-6 13 15.3 45.9 7-8 12 14.1 60.0 9+ 34 40.0 100.0 Total 85
Table 10 Frequency of Counts of Agile Projects
Agile Project Count Frequency of Projects Frequency % Cumulative %
1-2 12 14.1 14.1 3-4 14 16.5 30.6 5-6 14 16.5 47.1 7-8 11 12.9 60.0 9+ 34 40.0 100.0 Total 85

127
Table 11 Frequency of Project Duration
Duration of Project (Months) Frequency of Duration Frequency % Cumulative %
1-3 5 5.9 5.9 4-6 14 16.5 22.4 7-9 15 17.6 40.0 10-12 20 23.5 63.5 13+ 31 36.5 100.0 Total 85
Construct Descriptive Statistics
Each of the five constructs were measured using a 5-point Likert scale. The 5-
point Likert scale ranged from strongly disagree (1) to strongly agree (5). Each construct
was represented by several statements in the survey for this study. Performance
expectancy, effort expectancy, social influence, and facilitating conditions were
represented by four individual statements. Behavioral intent required the rating of three
statements. Experience was represented by two different questions regarding number of
years’ experience and number of projects.
Study Results
Statistical Analysis of the Findings
This study was created to gain a better understanding of which factors influenced
project managers’ behavioral intent to adopt continuous delivery. Research questions and
hypotheses included in this study were created from the constructs and mediating factors
prescribed by the UTAUT (Venkatesh et al., 2003). The constructs and mediators
included items such as performance expectancy, effort expectancy, social influence,
facilitating conditions, and experience as it affects the relationship between effort
expectancy, social influence, facilitating conditions, and behavioral intent to adopt

128
continuous delivery. Stepwise multiple linear regression was facilitated to analyze the
data resulting from the online distributed survey. An equation was formulated from the
use of the stepwise multiple regression to predict behavioral intent based on the
constructs and mediators of significance. All hypotheses were tested for significance and
strength of their relationship to behavioral intent.
Research Questions
The following research questions and hypotheses guided this study:
Research Question 1: What is the relationship between performance and
continuous delivery adoption?
H01: No statistically significant relationship exists between performance
expectancy and behavioral intent to adopt continuous delivery.
Ha1: A statistically significant relationship exists between performance
expectancy and behavioral intent to adopt continuous delivery.
Research Question 2: What is the relationship between effort expectancy and
continuous delivery adoption?
H02: No statistically significant relationship exists between effort expectancy and
behavioral intent to adopt continuous delivery.
Ha2: A statistically significant relationship exists between effort expectancy and
behavioral intent to adopt continuous delivery.
Research Question 3: What is the relationship between social influence and
continuous delivery adoption?

129
H03: No statistically significant relationship exists between social influence and
behavioral intent to adopt continuous delivery.
Ha3: A statistically significant relationship exists between social influence and
behavioral intent to adopt continuous delivery.
Research Question 4: What is the relationship between facilitating conditions and
continuous delivery adoption?
H04: No statistically significant relationship exists between facilitating conditions
and behavioral intent to adopt continuous delivery.
Ha4: A statistically significant relationship exists between facilitating conditions
and behavioral intent to adopt continuous delivery.
Research Question 5: How does experience moderate the relationship between
effort expectancy and behavioral intent to adopt continuous delivery?
H05: Experience has no moderating effect on the relationship between effort
expectancy and behavioral intent to adopt continuous delivery.
Ha5: Experience has a moderating effect on the relationship between effort
expectancy and behavioral intent to adopt continuous delivery.
Research Question 6: How does experience moderate the relationship between
social influence and behavioral intent to adopt continuous delivery?
H06: Experience has no moderating effect on the relationship between social
influence and behavioral intent to adopt continuous delivery.
Ha6: Experience has a moderating effect on the relationship between social
influence and behavioral intent to adopt continuous delivery.

130
Research Question 7: How does experience moderate the relationship between
facilitating conditions and behavioral intent to adopt continuous delivery?
H07: Experience has no moderating effect on the relationship between facilitating
conditions and behavioral intent to adopt continuous delivery.
Ha7: Experience has a moderating effect on the relationship between facilitating
conditions and behavioral intent to adopt continuous delivery.
Multiple Linear Regression Analysis
A stepwise multiple linear regression analysis was executed using SPSS v25 to
determine the validity of the hypotheses set forth in this study by determining which of
the independent variables were predictors of the behavioral intent dependent variable.
Strength of prediction, if any, was also assessed for each independent variable using the
statistics available from running the analysis. The goal of the analysis was to establish the
predictors, the strength of the predictors, and an explanation of the variance of the
behavioral intent dependent variable. The alternative hypotheses of this study assumed all
four independent variables such as performance expectancy, effort expectancy, social
influence, and facilitating conditions, and experience, as a moderator, could be integrated
into a multivariate model capable of predicting and explaining the variance in the
behavioral intent dependent variable. The null hypotheses of this study asserted that all
variables and moderators could not be used in a multivariate equation to explain the
variance in behavioral intent.
In this study it was necessary to execute a backward stepwise multiple linear
regression to remove each of the independent variables that were not significant to

131
expose the significant predictors. A forward stepwise multiple linear regression was used
initially because I assumed all independent variables would be significant. When the
statistics for enter and forward stepwise multiple linear regression reflected insignificance
for most independent variables, I decided to see if backward stepwise would be a better
fit for the analysis. The backward stepwise automated analysis from SPSS v25 was
capable of finding the best-fit linear regression for validation of pre-existing multivariate
models such as the UTAUT (Venkatesh et al., 2003) used in this study.
The backward stepwise analysis executed four times removing one independent
variable at a time. An insignificance level of α = .05 was used to determine which
independent variables should be removed at each execution. A summary of the execution
steps is found in Appendix F. Table 12 shows the results of the backward stepwise
multiple linear regression analysis for the behavioral intent dependent variable.
Table 12 Stepwise Multiple Linear Regression Analysis of Behavioral Intent and Independent
Variables
Model SS df MS F Sig.
Regression 26.79 1 26.79 26.19 .000 Residual 84.90 83 1.02 Total 111.69 84
Note. N=85
The backward stepwise multiple linear regression analysis determined the
behavioral intent model was significant (p < .001) and that only the performance
expectancy beta coefficient was significant. Performance expectancy was found to be the
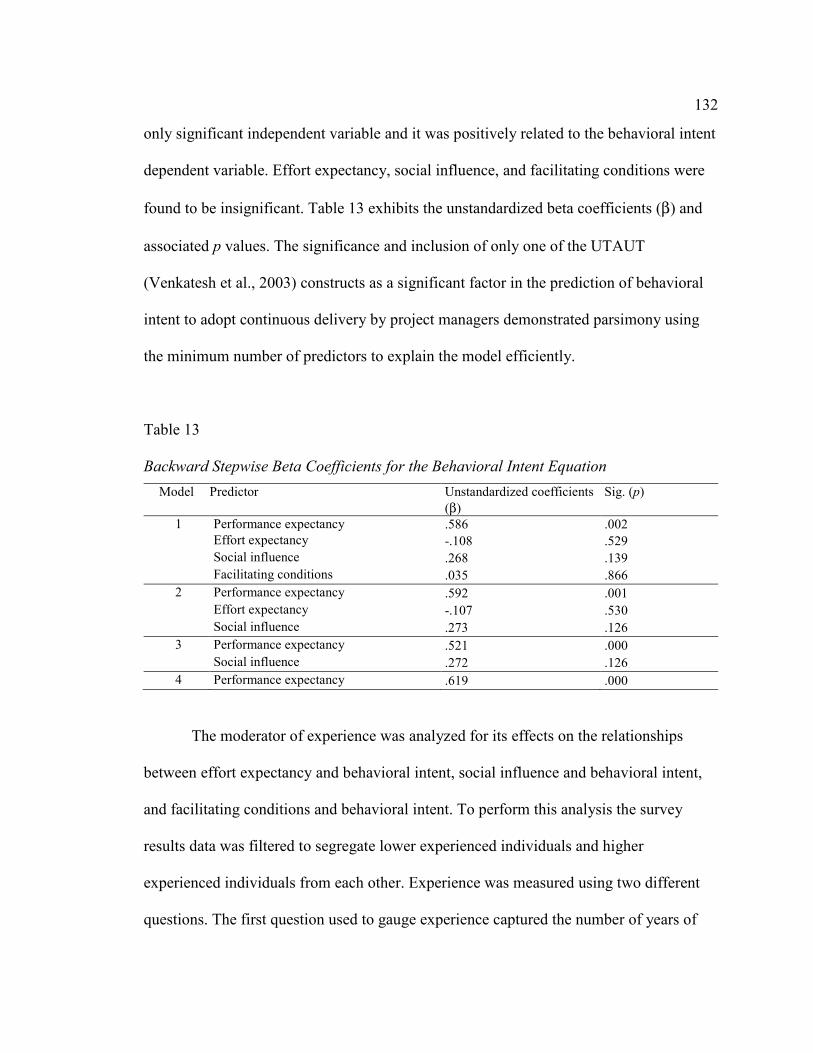
132
only significant independent variable and it was positively related to the behavioral intent
dependent variable. Effort expectancy, social influence, and facilitating conditions were
found to be insignificant. Table 13 exhibits the unstandardized beta coefficients (β) and
associated p values. The significance and inclusion of only one of the UTAUT
(Venkatesh et al., 2003) constructs as a significant factor in the prediction of behavioral
intent to adopt continuous delivery by project managers demonstrated parsimony using
the minimum number of predictors to explain the model efficiently.
Table 13 Backward Stepwise Beta Coefficients for the Behavioral Intent Equation
Model Predictor Unstandardized coefficients
(β)
Sig. (p)
1 Performance expectancy .586 .002
Effort expectancy -.108 .529
Social influence .268 .139
Facilitating conditions .035 .866
2 Performance expectancy .592 .001
Effort expectancy -.107 .530
Social influence .273 .126
3 Performance expectancy .521 .000
Social influence .272 .126
4 Performance expectancy .619 .000
The moderator of experience was analyzed for its effects on the relationships
between effort expectancy and behavioral intent, social influence and behavioral intent,
and facilitating conditions and behavioral intent. To perform this analysis the survey
results data was filtered to segregate lower experienced individuals and higher
experienced individuals from each other. Experience was measured using two different
questions. The first question used to gauge experience captured the number of years of
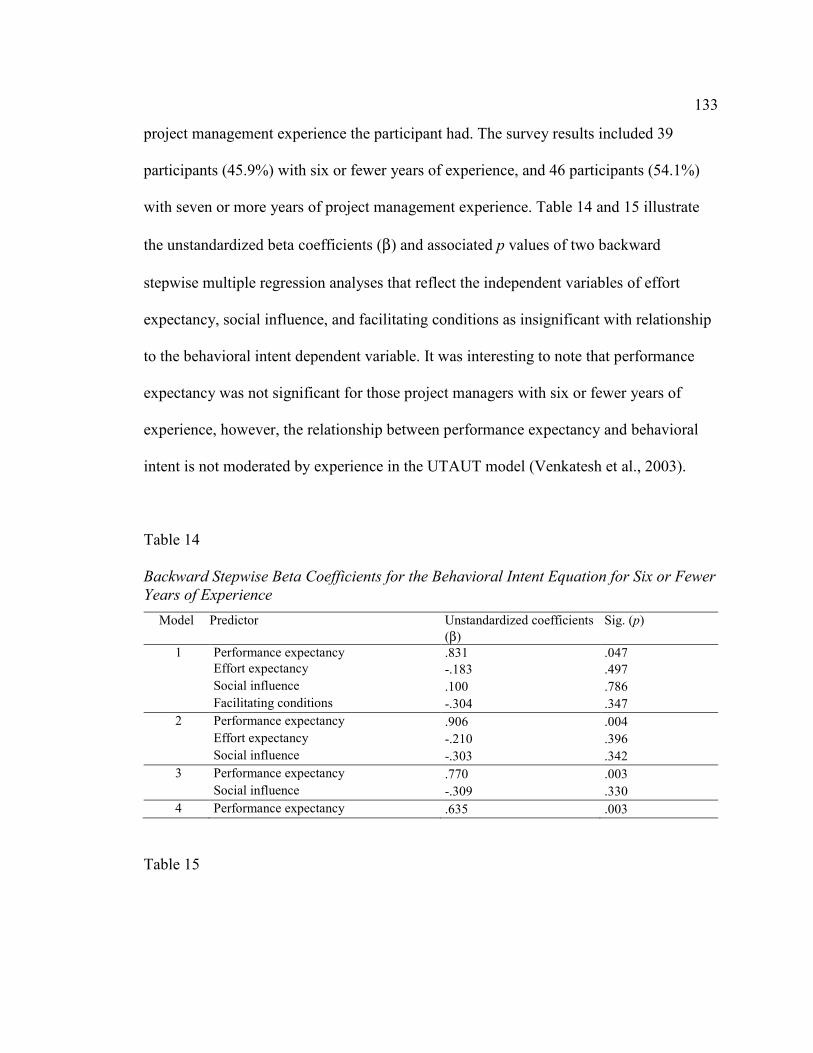
133
project management experience the participant had. The survey results included 39
participants (45.9%) with six or fewer years of experience, and 46 participants (54.1%)
with seven or more years of project management experience. Table 14 and 15 illustrate
the unstandardized beta coefficients (β) and associated p values of two backward
stepwise multiple regression analyses that reflect the independent variables of effort
expectancy, social influence, and facilitating conditions as insignificant with relationship
to the behavioral intent dependent variable. It was interesting to note that performance
expectancy was not significant for those project managers with six or fewer years of
experience, however, the relationship between performance expectancy and behavioral
intent is not moderated by experience in the UTAUT model (Venkatesh et al., 2003).
Table 14 Backward Stepwise Beta Coefficients for the Behavioral Intent Equation for Six or Fewer
Years of Experience
Model Predictor Unstandardized coefficients
(β)
Sig. (p)
1 Performance expectancy .831 .047
Effort expectancy -.183 .497
Social influence .100 .786
Facilitating conditions -.304 .347
2 Performance expectancy .906 .004
Effort expectancy -.210 .396
Social influence -.303 .342
3 Performance expectancy .770 .003
Social influence -.309 .330
4 Performance expectancy .635 .003
Table 15

134
Backward Stepwise Beta Coefficients for the Behavioral Intent Equation for Seven or
More Years of Experience
Model Predictor Unstandardized coefficients
(β)
Sig. (p)
1 Performance expectancy .230 .018
Effort expectancy .248 .689
Social influence .239 .233
Facilitating conditions .304 .385
2 Performance expectancy .173 .005
Effort expectancy .231 .251
Social influence .300 .389
3 Performance expectancy .169 .003
Social influence .229 .205
4 Performance expectancy .158 .000
The second question used to gauge experience captured the number of projects
that the project manager had experienced. The survey results included 40 participants
(47.1%) with six or fewer projects of experience, and 45 participants (52.9%) with seven
or more projects of project management experience. Table 16 and 17 illustrate the
unstandardized beta coefficients (β) and associated p values of two backward stepwise
multiple regression analyses that reflect the independent variables of effort expectancy,
social influence, and facilitating conditions as insignificant with relationship to the
behavioral intent dependent variable.
Table 16 Backward Stepwise Beta Coefficients for the Behavioral Intent Equation for Six or Fewer
Projects of Experience
Model Predictor Unstandardized coefficients
(β)
Sig. (p)
1 Performance expectancy .418 .103
Effort expectancy .278 .934
Social influence .335 .639
Facilitating conditions .288 .213

135
2 Performance expectancy .296 .028
Effort expectancy .319 .606
Social influence .283 .207
3 Performance expectancy .191 .000
Social influence .277 .173
4 Performance expectancy .176 .000
Table 17 Backward Stepwise Beta Coefficients for the Behavioral Intent Equation for Seven or
More Projects of Experience
Model Predictor Unstandardized coefficients
(β)
Sig. (p)
1 Performance expectancy .254 .048
Effort expectancy .300 .695
Social influence .265 .532
Facilitating conditions .327 .445
2 Performance expectancy .188 .003
Effort expectancy .251 .433
Social influence .320 .467
3 Performance expectancy .186 .002
Social influence .245 .349
4 Performance expectancy .167 .000
Research Assumptions
Assumptions such as homoscedasticity, linear relationship, multivariate
normality, and multicollinearity can be made with the support of additional statistical
analysis. Scatterplots and histograms can be used to visually and empirically detect
assumptions. SPSS v25 makes it possible to automatically generate scatterplots and
histograms to help with the analysis of assumptions.
Linear relationship. Linearity was tested using SPSS v25 by using a scatterplot
to visualize the relationship between the regression standardized residual and regression
standardized predicted values. Figure 4 illustrates an approximate balance between error

136
term points above and below the regression line centered on zero. The shape of the error
terms resembles a diamond shape, which was due to the symmetry of the Likert Scale
values plotted. A balanced number of error terms above and below the regression line
indicates that a linear relationship does exist for the behavioral intent dependent variable.
Figure 4. Scatterplot of regression standardized residual versus regression standardized
predicted value for behavioral intent.
Multivariate normality. Figure 5 shows the results of a probability-to-
probability plot between expected and observed probabilities of regression standardized
residual for the behavioral intent dependent variable. In a p-p plot the diagonal line
represents normality and the points represent probabilities. In the p-p plot of regression
standardized residual for the behavioral intent dependent variable there was a small
deviation in the plot against the normality line due to the high number of participants
(N=85) in this study.

137
Figure 5. Normal P-P plot of expected cumulative probability versus observed
cumulative probability for behavioral intent.
Histogram plots may also be used to detect and validate multivariate normality
assumption. Figure 6 illustrates a histogram plot for the frequency of regression
standardized residual for the behavioral intent dependent variable. A slightly negative
bias was observed in the frequency; however it was within an acceptable range and
supports the assumption of multivariate normality.

138
Figure 6. Histogram of frequency versus regression standardized residual for behavioral
intent.
Homoscedasticity. The assumption of homoscedasticity can be determined using
a residual data plot of error terms. Figure 4 illustrated the scatterplot of regression
standardized residuals against regression standardized predicted values as they compare
with a 0-value regression line. The appearance of an even number of points above and
below the centerline reflected that the behavioral intent dependent variable met the
assumption of homoscedasticity and had no indication of heteroscedasticity.
Multicollinearity. The research assumption of multicollinearity can be
determined by observing the variance inflation factor values found in the coefficients
table of the SPSS v25 output. A variance inflation factor value below 10 indicates the
assumption of multicollinearity in a multiple linear regression was not violated. Table 14

139
contains all variance inflation factor values for the coefficients included in this study. All
values were 2.2 or lower, which indicated there was no multicollinearity with the survey
responses.
Table 18 Variance Inflation Factor for Behavioral Intent
Coefficients Collinearity statistic (variance inflation factor)
Performance expectancy 2.2 Effort expectancy 1.9 Social influence 1.3 Facilitating conditions 1.2
Correlation Analysis
Table 19 includes the Pearson bivariate correlation coefficients of all four
hypothesized predictors of the behavioral intent dependent variable. Pearson bivariate
correlation coefficient measures the strength and direction of a relationship, if one exists,
by calculating a value between -1 and 1. In Table 19 the Pearson bivariate correlation
coefficient for all predictors was above zero, however only performance expectancy had
a p value < .001. Performance expectancy was the only predictor that held a relationship
with the behavioral intent dependent variable. The correlation coefficient for performance
expectancy was moderately positive because the value was greater than .40 but less then
.70. A value greater than .70 would be classified as strong, and a value below .40 would
be classified as a weak relationship.

140
Table 19 Pearson Bivariate Correlation Coefficients and p Values of Behavioral Intent
Model Predictor Correlation coefficient (r)
p
1 Performance expectancy .490 .002
Effort expectancy .292 .529
Social influence .358 .139
Facilitating conditions .214 .866
2 Performance expectancy .490 .001
Effort expectancy .292 .530
Social influence .358 .126
3 Performance expectancy .490 .000
Social influence .358 .126
4 Performance expectancy .490 .000
Summary
Based on the research questions, hypotheses and the analysis of frequencies and a
backward stepwise multiple linear regression of the survey results in this study an
equation was developed to explain the variance of behavioral intent based on the
significant predictors.
Behavioral Intent = 1.219 + .619 x Performance Expectancy + E
Random error attributed with the variance equation for behavioral intent in this
study is represented by the variable E. The multiple correlation coefficient (R) associated
with the backward stepwise multiple linear regression was .490 for behavioral intent as
predicted by one significant independent variable, which indicates the strength of the
equation as moderate. A multiple correlation coefficient (R) lower than >.4 is classified
as weak, R > .4 is classified as moderate, and R > .7 is classified as strong.
Experience, as a moderator, was also found to be insignificant in having an effect
on associated predictors. Performance expectancy was the only significant factor
141
captured in the mathematical equation. Of the participants that participated in this study,
project managers’ behavioral intent to adopt continuous delivery was moderately and
positively related to performance expectancy. The behavioral intent equation represented
24.0% of the variance in how behavioral intent to adopt continuous delivery by project
managers could be explained by the stepwise multiple linear regression predictors.
Chapter 4 included detailed information concerning data collection and a
backward stepwise multiple linear regression analysis of the survey data. The data
collected in this study was used to determine support for or against the hypotheses set
forth as well as the strength each independent variable served. A predictive model was
derived from the quantitative methods used to explain the variance in the behavioral
intent dependent variable. Chapter 5 will include an interpretation of findings, limitations
of the proposed study, implications for change, and a conclusion.

142
Chapter 5: Conclusion
Introduction
The purpose of this quantitative, regression analysis study was to test the UTAUT
that relates independent variables performance expectancy, effort expectancy, social
influence, and facilitating conditions, as moderated by experience, with the dependent
variable behavioral intent to adopt continuous delivery for software development project
managers at large software development organizations. Research questions and
hypotheses were developed to guide the study in researching the key elements such as
project management, continuous delivery, DevOps, and the UTAUT model.
The study yielded one mathematical equation consisting of variables and weights
derived from a stepwise multiple linear regression analysis:
Behavioral Intent = 1.219 + .619 x Performance Expectancy + E
The multivariate equation explains the relationship between the significant predictor
independent variable of performance expectancy, the random error that may be
encountered, and the constant with the behavioral intent dependent variable. Performance
expectancy was shown to have a moderately positive relationship with behavioral intent
in this study. The results reflected that the equation explains 24.0% of the variance in
behavioral intent to adopt continuous delivery by project managers participating in this
study. Furthermore, experience expressed in years and number of projects did not have
any moderating effect on the relationships of effort expectancy, social influence, and
facilitating conditions on behavioral intent to adopt continuous delivery.
143
Interpretation of the Findings
The findings of this study disconfirm that the independent variables of effort
expectancy, social influence, and facilitating conditions have any influence on the
adoption of continuous delivery by participating project managers. The results confirmed
that performance expectancy was a predictor of behavioral intent to adopt continuous
delivery by project managers included in this study. Furthermore, experience as measured
in number of years and number of projects was disconfirmed as a moderator of the
relationship between effort expectancy, social influence, and facilitating conditions with
behavioral intent; there was no significant effect.
The results show that project managers included in this study perceived that
adopting continuous delivery would be useful in their job, would help them accomplish
tasks more quickly, would increase their productivity, and increase their chances at
getting a raise. Project manager attitudes toward behavioral intent to adopt continuous
delivery did not change with the number of years or projects experienced. In the case of
project managers included in this study with 6 or less years of experience, performance
expectancy was not significant. The insignificance of project manager experience on
some predictors of behavioral intent was also supported by findings in Laukkanen et al.
(2018) and Serrador and Pinto (2015). These statements are derived by associating the
moderately positive relationship that performance expectancy had with behavioral intent,
literature reviewed, and the statements associated with the performance expectancy
survey sections collected from the project management participants of this study.

144
Relating the findings to previous research, the research reflects that many
businesses are deriving a benefit from automation and continuous practices such as
continuous delivery. The findings of this study may indicate that project managers, with
respect to behavioral intent to adopt a continuous delivery system, are not influenced
socially to be complicit, feel there was an undue effort required to utilize, or believe they
must be concerned with support of the automated practice. Thus, this study shows that
project managers are most concerned with performance of the continuous delivery system
automation and how it’s adoption benefited them personally.
Though the results support previous research, the findings of this study also
slightly diverge from the literature. Research has indicated that project success has relied
on the efficient management of time, cost, and scope of objectives (Cullen & Parker,
2015). Researchers such as Carvalho et al. (2015), Amrit et al. (2014), and Hornstein
(2015) have also studied how additional human factors contributed to the success of
projects. Although this study supports the assertion that performance is the indicator of
project success, there was a deviation in the focus on the project manager’s own benefit
rather than external influence or supportive resources in the case of continuous delivery
adoption. Project managers surveyed in this study may believe continuous delivery is a
technology that should operate as advertised and provide a means to reflect the progress
made in all other responsibilities of their job description. In other words, continuous
delivery may be a tool to promote the achievements of the project manager and the team
they lead. Based on the results of this study, continuous delivery may have realized the
potential of visualizing and improving success rates through quantification of impact of

145
project management decisions in near real time (Chen, 2017; Lindsjørn et al., 2016;
Serrador & Pinto, 2015).
Further, the insignificance of facilitating conditions in this study suggested that
the agile transition process reduces the effect of requiring direct control by the project
manager in the decision process (see Gandomani & Nafchi, 2016). Agile emphasizes
increased teamwork through autonomy, reducing reliance on a dedicated project manager
to navigate the complexities associated with organizations. Self-forming and self-directed
teams that rely on automated practices such as continuous delivery are possible due to the
distributed nature of the agile methods employed such as scrum and kanban. The
participants in this study communicated that they focused on personal performance and
less on experience, influence, and other resource constraints. The self-empowerment and
autonomy associated with agile practices is prescribed in new organization and workflow
patterns such as the Scaled Agile Framework. New frameworks prescribe larger teams
with fewer project managers. In frameworks such as the Scaled Agile, portfolio and
product managers act as project managers, however, they oversee a greater number of
projects, have increased financial responsibilities, and focus on business objectives
(Dingsoeyr, Falessi, & Power, 2019; see also Papadopoulos, 2015). Portfolio and product
managers are not responsible for delivery of a project, as the teams themselves are trusted
to do so, which removes overhead. As a result of this trend, traditional project managers
may either increase their skillset and responsibility to become a portfolio or product
manager, or they may opt to take smaller roles such as supporting the maintenance of
nonagile, legacy system development projects within an organization.

146
The UTAUT was the theoretical framework for this study, which includes
predictors such as performance expectancy, effort expectancy, social influence, and
facilitating conditions (Venkatesh et al., 2003). The model also includes moderators such
as age, gender, experience, and voluntariness of use. In this study use of experience as a
moderator was supported by previous research (Gandomani & Nafchi, 2016). Moderators
such as age, gender, and voluntariness of use were not included in this study. Use
behavior, as a dependent variable, was also not included in this study. In relation to the
framework, this study supports the findings of Walldén et al. (2016) and Turner et al.
(2010) because the multiple linear regression was only able to explain 24% of the
variance in behavioral intent by project managers to adopt continuous delivery.
Limitations of the Study
The online survey was offered in English-only, which may have prevented
participation from project managers located in specific regions. The study results
reflected 91% of participants were located in the United States. Generalizability of this
study was reduced by the English-only survey limitation.
Participants were also limited to technical project managers who were members
of five specific LinkedIn groups. The project management focused LinkedIn groups
included a large number of nontechnical project managers and members who held
positions unrelated to project management such as recruiters and operational managers.
Similar to the English-only restriction of the survey, the project manager scope limitation
might have reduced the generalization of findings; however, the focus of this study was
on technical project managers.

147
The population of this study was small compared to the total population of
technical project managers. Small populations can incur a threat to external validity
because the findings may not be generalizable. Simple random sampling, to avoid
selection bias, and a statistical power of .80 in the power analysis performed was used to
reduce the threat to external validity.
Finally, the survey used in this study was not used in a time-series and instead
was issued at one point in time. Although this collection method avoids multiple-
treatment interference, it may have reduced the reliability of results by not comparing
results over a period because the UTAUT can be used to explain variances over a time-
series. A longitudinal study may have increased reliability of results.
Recommendations
Prior to the completion of this study, there has been no prior UTAUT research on
project managers perceptions as they relate to continuous delivery adoption and use.
Assumptions concerning the responsibility of the project manager as it relates to
continuous delivery adoption were made based on an exhaustive literature review;
however, this was not enough evidence to substantiate a real relationship exists. The
execution of this study may encourage testing of the UTAUT with individuals holding
other roles in an agile organizational structure such as scrum managers or architects.
Future research in the area of continuous delivery adoption may reduce statistical
conclusion or construct validity.
As agile methods such as scrum and kanban increase in prevalence, and
automated continuous practice such as continuous delivery increase in adoption the study

148
of behavior of people in supporting roles may change from technology adoption to
process maturity. A study that examines the attitudes of all agile-related roles inside a
specific or set of scalable agile frameworks may help managers select the most efficient
organizational workflow available. There are many competing frameworks documented
in the literature (Dingsoeyr, Falessi, & Power, 2019), which may complicate the process
of deciding which one is the best-fit for an organization’s structure and culture. The
endless combination of role definitions, organizational structure, personality types,
culture, and project delivery methods may fuel the literature for decades to come.
Agile maturity is coming in the form of new DevOps models such as DevSecOps
and AIOps. Automating tasks in an autonomous way, using artificial intelligence to
predict human input using metrics available from open source data models, defines the
next generation of DevOps. It may be beneficial to research the role that humans play in
making AIOps a reality. It may prove interesting to see if behavioral intent continues to
matter given the increase in autonomy. Will behavioral intent of an organizational
member matter when a process is automated and does not require their input?
Implications
The significance of this study was to add to the existing body of knowledge
related to adopting continuous delivery as it pertains to a single organizational role,
project managers. Project managers may use the findings of this study to help them adopt
continuous delivery and further achieve improvements such as increased project
predictability, increased customer satisfaction, and improved software release reliability
and quality, and increasing project efficiency and success.
149
Significance to Practice
Riungu-Kalliosaari, Mäkinen, Lwakatare, Tiihonen, and Männistö (2016)
reported that after organizations adopted continuous delivery, they experienced improved
software quality, improved collaboration, better lines of communication, and an increase
in the number of implemented features per software product release, among many other
benefits. A large body of peer-reviewed material suggested that organizational structure
affects behavioral intention to adopt continuous delivery (Chen, 2017; Lustenberger,
2016). Arguably, one of the most important factors in adopting continuous delivery is
creating a collaborative organizational culture in place of a traditional hierarchal structure
(Chow & Cao, 2008; Stankovic, Nikolic, Djordjevic, & Cao, 2013). The findings of this
study indicated performance expectancy was the strongest predictor of behavioral intent
to adopt continuous delivery by participating project managers. These findings may hold
significance to practice as it may improve awareness, alignment, and reduce the time and
cost associated with adopting a continuous delivery system (Chen, 2017), which further
may provide greater project efficiency and possibly increase a company’s competitive
advantage.
Significance to Theory
UTAUT (Venkatesh et al., 2003), introduced in 2003, was implemented over
1200 times in more than 50 different journals (Venkatesh, Thong, & Xu, 2016). The
UTAUT model (Venkatesh et al., 2003) was integrated with other models or extended
more than 60 times (Venkatesh et al., 2016) yet there were no studies that apply the
theory to behavioral intention to adopt continuous delivery. Laukkanen et al. (2017)

150
conducted a systematic literature review, which acknowledged organizational and human
challenges, within the context of continuous delivery adoption, could be analyzed with
general theories of organizational change, such as Venkatesh et al.’s (2003) UTAUT
model. This study contributed to the UTAUT model (Venkatesh et al., 2003) body of
knowledge and illustrated a parsimonious equation for predicting behavioral intent of
participating subjects. The ability to continue to test the UTAUT model (Venkatesh et al.,
2003) more than 15 years after its introduction is proof of the resilience of the technology
adoption research community.
Significance to Social Change
Software solutions have empowered people to make social change by providing
users with tools to solve very complex problems in a faster and more efficient way.
Determining how differences that performance expectancy of project managers
participating in this study affects behavioral intent to adopt continuous delivery may
inform changes necessary to make problem solving more efficient. The knowledge
gained regarding the insignificance of effort expectancy, social influence, facilitating
conditions, and experience may help society deemphasize these constructs. The analysis
and findings of this study demonstrate the need to continue research into societal norms
and assumptions to determine the actual motivations behind an individual’s behavior.
Understanding the real motivations of individuals can improve communication, reduce
conflict, and support societal advancement.
151
Conclusion
The purpose of this quantitative, regression analysis study was to examine the
extent to which the UTAUT (Venkatesh et al., 2003), which includes measurements of
independent variables performance expectancy, effort expectancy, social influence, and
facilitating conditions, as moderated by experience, predicted the dependent variable
behavioral intent to adopt continuous delivery for software development project
managers in software development organizations. The UTAUT model (Venkatesh et al.,
2003) constructs, moderators, and dependent variables were the foundation of the
research questions and hypotheses in this study. The results of this study provided a
mathematical, multivariate model that included one of the constructs and explained 24%
of the variance in behavioral intent to adopt continuous delivery by participating project
managers.
A survey adapted from the original UTAUT (Venkatesh et al., 2003) theory
development was distributed to technical project managers that were members of five
specific social media groups. A sample of 85 project managers participated over the
course of 17 days. A stepwise multiple linear regression analysis and Pearson’s bivariate
correlation was executed using the IBM SPSS v25 statistical analysis package. The
results of the statistical analysis were presented in Chapter 4.
The analysis of the frequencies, assumptions, correlation coefficients, and
significance yielded an equation for explaining the variance of behavioral intent to adopt
continuous delivery. Performance expectancy emerged as the only moderately strong
significant predictor of behavioral intent. All other constructs, as well as experience as a

152
moderator, were deemed insignificant. The resulting predictive mathematical equation
was able to predict 24% of the variance in participating project manager’s behavioral
intent. This study supports the findings of Walldén et al. (2016) and Turner et al. (2010)
whereby the decrease in research studies using technology acceptance methods due to the
diametric alignment of behavioral intent and use behavior of IT present in introspective
studies such as Turner, Kitchenham, Brereton, Charters, and Budgen (2010). Turner et al.
(2010) analyzed TAM-based (Davis, 1989) studies in the field of IT and stated behavioral
intent based on perceived usefulness and perceived ease of use did not align with actual
use behavior. Although it is important to study the behavioral intent of organization
members, the UTAUT model (Venkatesh et al., 2003) may not be an effective tool in
predicting outcomes in the field of IT based upon the findings of this study. The study
may have focused on the wrong target population and may be executed with another
population with different results.
Improving competitive advantage will continue to be a focus for organizations
worldwide. Searching for the most effective combination of skills, processes,
organizational structure, personality types, and culture continues to be a difficult task.
This study contributes to the body of knowledge by illustrating performance was the most
important consideration for project managers when it comes to the automation of tasks
such as continuous delivery of projects. The insignificance of effort expectancy, social
influence, facilitating conditions, and experience may be conceived as positive because a
parsimonious model may be preferred. If there are fewer variables in the prediction of
behavioral intent to adopt an automated continuous delivery system, this may indicate

153
that adoption is less complicated at this period in time and effort to research the maturity
of a continuous delivery system is more appropriate.
Maturity and scalability of automated systems such as continuous delivery is now
the focus of artificial intelligence in the next iteration of DevOps called AIOps. Every
member of an organization will likely interact with an automated system powered by
some form of artificial intelligence in the near future. Competitive advantage as defined
by project success may be one area of automation that becomes possible as a result of
continuous practice maturity. Automatically determining the most important features to
be developed, automatically coding the features, and automatically releasing a product
are all possible outcomes of incorporating human-like inputs to the process. The
parsimonious model yielded by this study may indicate that less human intervention is
necessary and even less is expected in the future.

154
References
Ajzen, I. (1991). The theory of planned behavior. Organizational Behavior and Human
Decision Processes, 50(1), 79-211. doi:10.4135/9781412952576.n208
Alahyari, H., Gorschek, T., & Berntsson Svensson, R. (2019). An exploratory study of
waste in software development organizations using agile or lean approaches: A
multiple case study at 14 organizations. Information and Software Technology,
105, 78-94. doi:10.1016/j.infsof.2018.08.006
Alotaibi, M. B. (2016). Antecedents of software-as-a-service (SaaS) adoption: A
structural equation model. International Journal of Advanced Computer
Research; Bhopal, 6(25), 114-129. doi:10.19101/IJACR.2016.626019
Alsmadi, D., & Prybutok, V. (2018). Sharing and storage behavior via cloud computing:
Security and privacy in research and practice. Computers in Human Behavior, 85,
218-226. doi:10.1016/j.chb.2018.04.003
Amrit, C., Daneva, M., & Damian, D. (2014). Human factors in software development:
On its underlying theories and the value of learning from related disciplines. A
guest editorial introduction to the special issue. Information and Software
Technology, 56(12), 1537-1542. doi:10.1016/j.infsof.2014.07.006
Araújo, C. C. S. de, & Pedron, C. D. (2015). The IT project manager competencies that
impact project success - A qualitative research. Organisational Project
Management, 2(1), 53-75. doi:10.5130/opm.v2i1.4142
Balalaie, A., Heydarnoori, A., & Jamshidi, P. (2016). Microservices architecture enables
DevOps: Migration to a cloud-native architecture. IEEE Software, 33(3), 42-52.

155
doi:10.1109/MS.2016.64
Bandura, A. (1986). Social foundations of thought and action: A social cognitive theory.
Englewood Cliffs, NJ: Prentice Hall.
Banerjee, S. (2016). Role of a project manager in managing in agile projects. Journal of
Business and Financial Affairs, 5(3), 1-4. doi:10.4172/2167-0234.1000204
Baydoun, A., & El-Den, J. (2017). A framework for knowledge based software service
supply chain (SSSC): A comparative analysis with existing frameworks. Procedia
Computer Science, 124, 205-215. doi:10.1016/j.procs.2017.12.148
Bishop, D., Rowland, P., & Noteboom, C. (2018). Antecedents of preference for agile
methods: A project manager perspective. Proceedings of the 51st Hawaii
International Conference on System Sciences, 5435-5444.
doi:10.24251/hicss.2018.678
Campbell, D. T., & Stanley, J. C. (1963). Experimental and quasi-experimental designs
for research. Chicago, IL: Rand McNally College.
Carr, L. T. (1994). The strengths and weaknesses of quantitative and qualitative research:
What method for nursing? Journal of Advanced Nursing, 20(4), 716-721.
doi:10.1046/j.1365-2648.1994.20040716.x
Carvalho, M. M. de, Patah, L. A., & de Souza Bido, D. (2015). Project management and
its effects on project success: Cross-country and cross-industry comparisons.
International Journal of Project Management, 33(7), 1509-1522.
doi:10.1016/j.ijproman.2015.04.004
Chauhan, S., & Jaiswal, M. (2016). Determinants of acceptance of ERP software training
156
in business schools: Empirical investigation using UTAUT model. The
International Journal of Management Education, 14(3), 248-262.
doi:10.1016/j.ijme.2016.05.005
Chen, L. (2015). Continuous delivery: Huge benefits, but challenges too. IEEE Software,
32(2), 50-54. doi:10.1109/MS.2015.27
Chen, L. (2017). Continuous delivery: Overcoming adoption challenges. Journal of
Systems and Software, 128, 72-86. doi:10.1016/j.jss.2017.02.013
Chow, T., & Cao, D.-B. (2008). A survey study of critical success factors in agile
software projects. Journal of Systems and Software, 81(6), 961-971.
doi:10.1016/j.jss.2007.08.020
Claps, G. G., Svensson, R. B., & Aurum, A. (2015). On the journey to continuous
deployment: Technical and social challenges along the way. Information and
Software Technology, 57, 21-31. doi:10.1016/j.infsof.2014.07.009
Cohen, P., Cohen, P., West, S., & Aiken, L. (1983). Applied multiple
regression/correlation analysis for the behavioral sciences.
doi:10.4324/9781410606266
Compeau, D. R., & Higgins, C. A. (1995). Computer self-efficacy: Development of a
measure and initial test. MIS Quarterly, 19(2), 189-211. doi:10.2307/249688
Conway, M. E. (1968). How do committees invent. Datamation, 14(5). Retrieved from
http://www.melconway.com/Home/pdf/committees.pdf
Cullen, K., & Parker, D. W. (2015). Improving performance in project-based
management: Synthesizing strategic theories. International Journal of

157
Productivity and Performance Management, 64(5), 608-624. doi:10.1108/IJPPM-
02-2014-0031
Conforto, E. C., Salum, F., Amaral, D. C., da Silva, S. L., & de Almeida, L. F. M. (2014).
Can agile project management be adopted by industries other than software
development? Project Management Journal, 45(3), 21-34.
doi:10.1002/pmj.21410
Davis, F. (1989). Perceived usefulness, perceived ease of use, and user acceptance of
information technology. MIS Quarterly, 13(3), 319-339. doi:10.2307/249008
Davis, F. D., Bagozzi, R. P., & Warshaw, P. R. (1992). Extrinsic and intrinsic motivation
to use computers in the workplace. Journal of Applied Social Psychology, 22(14),
1111-1132. doi:10.1111/j.1559-1816.1992.tb00945.x
de Mello, R. M., Da Silva, P. C., & Travassos, G. H. (2015). Investigating probabilistic
sampling approaches for large-scale surveys in software engineering. Journal of
Software Engineering Research and Development, 3(1), 1-26.
doi:10.1186/s40411-015-0023-0
Denning, S. (2015). New lessons for leaders about continuous innovation. Strategy &
Leadership, 43(1), 11-15. doi:10.1108/SL-11-2014-0083
Dima, A. M., & Maassen, M. A. (2018). From waterfall to agile software: Development
models in the IT sector, 2006 to 2018. Impacts on company management. Journal
of International Studies, 11(2). doi:10.14254/2071-8330.2018/11-2/21
Dingsoeyr, T., Falessi, D., & Power, K. (2019). Agile development at scale: The next
frontier. IEEE Software, 36(2), 30-38. doi:10.1109/MS.2018.2884884
158
Drury-Grogan, M. L., Conboy, K., & Acton, T. (2017). Examining decision
characteristics & challenges for agile software development. Journal of Systems
and Software, 131, 248-265. doi:10.1016/j.jss.2017.06.003
Dwivedi, Y. K., Rana, N. P., Jeyaraj, A., Clement, M., & Williams, M. D. (2017). Re-
examining the unified theory of acceptance and use of technology (UTAUT):
Towards a revised theoretical model. Information Systems Frontiers, 1-16
doi:10.1007/s10796-017-9774-y
Ebert, C., Gallardo, G., Hernantes, J., & Serrano, N. (2016) DevOps. IEEE Software,
33(3), 94-100. doi:10.1109/MS.2016.68
Elberzhager, F., Arif, T., Naab, M., Süß, I., & Koban, S. (2017). From agile development
to DevOps: Going towards faster releases at high quality - Experiences from an
Industrial Context. In D. Winkler, S. Biffl, & J. Bergsmann (Eds.), International
conference on software quality (Vol. 269, pp. 33-44). doi:10.1007/978-3-319-
49421-0_3
Evwiekpaefe, A. E., & Haruna, M. Z. (2018). Individual and organizational acceptance of
technology theories and models: Conceptual gap and possible solutions. Pacific
Journal of Science and Technology, 10(2), 189-197. Retrieved from
http://www.akamaiuniversity.us/PJST19_1_189.pdf
Faul, F., Erdfelder, E., Buchner, A., & Lang, A. G. (2009). Statistical power analyses
using G*Power 3.1: Tests for correlation and regression analyses. Behavior
Research Methods, 41(4), 1149-1160. doi:10.3758/BRM.41.4.1149
Fishbein, M., & Ajzen, I. (1975). Belief, attitude, intention, and behavior: An
159
introduction to theory and research. doi:10.12691/ajap-1-3-6
Fitzgerald, B., & Stol, K. J. (2017). Continuous software engineering: A roadmap and
agenda. Journal of Systems and Software, 123, 176-189.
doi:10.1016/j.jss.2015.06.063
Fowler, M., & Highsmith, J. (2001). The agile manifesto. Software Development
Magazine, 9(8), 29-30. Retrieved from
http://users.jyu.fi/~mieijala/kandimateriaali/Agile-Manifesto.pdf
Gage, N. A., & Stevens, R. N. (2018). Rigor, replication, and reproducibility: Increasing
the relevance of behavioral disorders research. Education & Treatment of
Children; Pittsburgh, 41(4), 567–588. doi:10.1353/etc.2018.0029
Gandomani, T. J., & Nafchi, M. Z. (2016). Agile transition and adoption human-related
challenges and issues: A Grounded Theory approach. Computers in Human
Behavior, 62, 257-266. doi:10.1016/j.chb.2016.04.009
Ghezzi, C. (2018). Formal methods and agile development: Towards a happy marriage.
In V. Gruhn & R. Striemer (Eds.), The Essence of Software Engineering, 25-36.
Cham: Springer International Publishing. doi:10.1007/978-3-319-73897-0_2
Goldratt, E. M., & Cox, J. (1984). The goal: Excellence in manufacturing. Croton-on-
Hudson, NY: North River Press Inc.
Gupta, V., Kapur, P. K., & Kumar, D. (2016). Modelling and measuring code smells in
enterprise applications using TISM and two-way assessment. International
Journal of System Assurance Engineering and Management, 7(3), 332-340.
doi:10.1007/s13198-016-0460-0

160
Gupta, V., Kapur, P. K., & Kumar, D. (2017). Modeling and measuring attributes
influencing DevOps implementation in an enterprise using structural equation
modeling. Information and Software Technology, 92, 75-91.
doi:10.1016/j.infsof.2017.07.010
Hackman, J. R., (1987). The design of work teams. In Handbook of Organizational
Behavior, 315-342. Englewood, Cliffs, NJ: Prentice-Hall.
Hardgrave, B. C., & Johnson, R. A. (2003). Toward an information systems development
acceptance model: The case of object-oriented systems development. IEEE
Transactions on Engineering Management, 50(3), 322-336.
doi:10.1109/TEM.2003.817293
Halinski, R. S., & Feldt, L. S. (1970). The selection of variables in multiple regression
analysis. Journal of Educational Measurement, 7(3), 151-157.
doi:10.1111/j.1745-3984.1970.tb00709.x
Hornstein, H. A. (2015). The integration of project management and organizational
change management is now a necessity. International Journal of Project
Management, 33(2), 291-298. doi:10.1016/j.ijproman.2014.08.005
Humble, J., & Farley, D. (2010). Continuous delivery: Reliable software releases through
build, test, and deployment automation. Pearson Education
Joshi, A., Kale, S., Chandel, S., & Pal, D. (2015). Likert scale: Explored and explained.
British Journal of Applied Science & Technology, 7(4), 396-403.
doi:10.9734/BJAST/2015/14975
Karvonen, T., Behutiye, W., Oivo, M., & Kuvaja, P. (2017). Systematic literature review
161
on the impacts of agile release engineering practices. Information and Software
Technology, 86, 87-100. doi:10.1016/j.infsof.2017.01.009
Khan, S., Gani, A., Abdul Wahab, A. W., Guizani, M., & Khan, M. K. (2017). Topology
discovery in software defined networks: Threats, taxonomy, and state-of-the-art.
IEEE Communications Surveys & Tutorials, 19(1), 303-324.
doi:10.1109/COMST.2016.2597193
Khechine, H., Lakhal, S., & Ndjambou, P. (2016). A meta-analysis of the UTAUT
model: Eleven years later. Canadian Journal of Administrative Sciences, 33(2),
138-152. doi:10.1002/cjas.1381
Kourea, L., & Lo, Y. (2016). The educational validity and utility of single-case design
research in building evidence-based practices in education. International Journal
of Research & Method in Education, 39(4), 349–364.
doi:10.1080/1743727X.2016.1160278
Kuciapski, M. (2017). A model of mobile technologies acceptance for knowledge transfer
by employees. Journal of Knowledge Management, 21(5), 1053-1076.
doi:10.1108/JKM-03-2016-0136
Kukreja, V., Ahuja, S., & Singh, A. (2018). Measurement and structural model of agile
software development critical success factors. International Journal of
Engineering & Technology, 7(3), 1236-1242. doi:10.14419/ijet.v7i3.12776
Laukkanen, E., Itkonen, J., & Lassenius, C. (2017). Problems, causes and solutions when
adopting continuous delivery - a systematic literature review. Information and
Software Technology, 82, 55-79. doi:10.1016/j.infsof.2016.10.001

162
Laukkanen, E., Paasivaara, M., Itkonen, J., & Lassenius, C. (2018). Comparison of
release engineering practices in a large mature company and a startup. Empirical
Software Engineering, 23(6), 3535-3577. doi:10.1007/s10664-018-9616-7
Leffingwell, D. (2007). Scaling software agility. Upper Saddle River, NJ: Addison-
Wesley
Leppänen, M., Mäkinen, S., Pagels, M., Eloranta, V.-P., Itkonen, J., Mäntylä, M. V., &
Männistö, T. (2015). The highways and country roads to continuous deployment.
IEEE Software, 32(2), 64-72. doi:10.1109/MS.2015.50
Lescevica, M., Ginters, E., & Mazza, R. (2013). Unified theory of acceptance and use of
technology (UTAUT) for market analysis of FP7 CHOReOS products. Procedia
Computer Science, 26, 51-68. doi:10.1016/j.procs.2013.12.007
Lesser, E., & Ban, L. (2016). How leading companies practice software development and
delivery to achieve a competitive edge. Strategy & Leadership, 44(1), 41-47.
doi:10.1108/SL-11-2015-0083
Lindgren, E., & Münch, J. (2015). Software Development as an Experiment System: A
qualitative survey on the state of the practice. In C. Lassenius, T. Dingsøyr, & M.
Paasivaara (Eds.), Agile Processes in Software Engineering and Extreme
Programming, 212, 117-128. Cham: Springer International Publishing.
doi:10.1007/978-3-319-18612-2_10
Lindsjørn, Y., Sjøberg, D. I. K., Dingsøyr, T., Bergersen, G. R., & Dybå, T. (2016).
Teamwork quality and project success in software development: A survey of agile
development teams. Journal of Systems and Software, 122, 274-286.

163
doi:10.1016/j.jss.2016.09.028
Lustenberger, F. (2016). On the fading of organizational interfaces in the era of internet-
of-things. IEEE Engineering Management Review, 44(1), 14-15.
doi:10.1109/EMR.2016.2530642
Magsamen-Conrad, K., Upadhyaya, S., Joa, C. Y., & Dowd, J. (2015). Bridging the
divide: Using UTAUT to predict multigenerational tablet adoption practices.
Computers in Human Behavior, 50, 186-196. doi:10.1016/j.chb.2015.03.032
Mäkinen, S., Leppänen, M., Kilamo, T., Mattila, A.-L., Laukkanen, E., Pagels, M., &
Männistö, T. (2016). Improving the delivery cycle: A multiple-case study of the
toolchains in Finnish software intensive enterprises. Information and Software
Technology, 80, 175-194. doi:10.1016/j.infsof.2016.09.001
Malhotra, Y., & Galletta, D. F. (1999). Extending the technology acceptance model to
account for social influence: Theoretical bases and empirical validation.
Proceedings of the 32nd Hawaii International Conference on System Sciences, 1-
14. doi:10.1109/HICSS.1999.772658
Moore, G. C, and Benbasat, I. (1991). Development of an instrument to measure the
perceptions of adopting an information technology innovation. Information
Systems Research, 2(3), 192-222. doi:10.1287/isre.2.3.192
Morris, P. (2013). Reconstructing project management reprised: A knowledge
perspective. Project Management Journal, 44(5), 6-23. doi:10.1002/pmj.21369
Mosweu, O., Bwalya, K., & Mutshewa, A. (2016). Examining factors affecting the
adoption and usage of document workflow management system (DWMS) using

164
the UTAUT model. Records Management Journal; Bradford, 26(1), 38-67.
doi:10.1108/RMJ-03-2015-0012
Nybom, K., Smeds, J., & Porres, I. (2016). On the impact of mixing responsibilities
between devs and ops. Agile Processes in Software Engineering and Extreme
Programming, 131-143. doi:10.1007/978-3-319-33515-5_11
Papadopoulos, G. (2015). Moving from traditional to agile software development
methodologies also on large, distributed projects. Procedia - Social and
Behavioral Sciences, 175, 455-463. doi:10.1016/j.sbspro.2015.01.1223
Parnin, C., Helms, E., Atlee, C., Boughton, H., Ghattas, M., Glover, . . . Williams, L.
(2017). The top 10 adages in continuous deployment. IEEE Software, 34(3), 86-
95. doi:10.1109/MS.2017.86
Pedrini, M., & Ferri, L. M. (2018). Stakeholder management: A systematic literature
review. Corporate Governance: The International Journal of Business and
Society, 1-16. doi:10.1108/CG-08-2017-0172
Pfeffer, J., & Salancik, G. (2003). The external control of organizations: A resource
dependence perspective. Stanford, CA: Stanford University Press.
Pinto, G., Castor, F., & Reboucas, R. B. M. (2018). Work practices and challenges in
continuous integration: A survey with Travis CI users. Software: Practice and
Experience, 48(12), 17. doi:doi.org/10.1002/spe.2637
PMI NYC Chapter. (n.d.). Posts [LinkedIn company]. Retrieved March 5, 2019 from
https://www.linkedin.com/company/pmi-nyc-chapter/
PMI Long Island Chapter. (n.d.). Posts [LinkedIn group]. Retrieved July 15, 2019 from

165
https://www.linkedin.com/groups/1802544/
PMI Project, Program and Portfolio Management. (n.d.). Posts [LinkedIn group].
Retrieved March 5, 2019 from https://www.linkedin.com/groups/2784738/
Rose, K. H. (2013). A Guide to the Project Management Body of Knowledge (PMBOK
Guide)(5th Edition ed.). Project Management Journal, 44(3).
doi:10.1002/pmj.21345
Project Manager Community - Best Group for Project Management. (n.d.). Posts
[LinkedIn group]. Retrieved March 7, 2019 from
https://www.linkedin.com/groups/35313.
Rea, L. M., & Parker, R. A. (2014). Designing and conducting survey research: A
comprehensive guide. San Francisco, CA: Wiley.
Reio, T. G. (2016). Nonexperimental research: Strengths, weaknesses and issues of
precision. European Journal of Training and Development; Limerick, 40(8/9),
676–690. doi:10.1108/EJTD-07-2015-0058
Riungu-Kalliosaari, L., Mäkinen, S., Lwakatare, L. E., Tiihonen, J., & Männistö, T.
(2016). DevOps adoption benefits and challenges in practice: A case study. In:
Abrahamsson P., Jedlitschka A., Nguyen Duc A., Felderer M., Amasaki S.,
Mikkonen T. (Eds.) Product-Focused Software Process Improvement. PROFES
2016. Lecture Notes in Computer Science, (Vol. 10027). Springer, Cham.
doi:10.1007/978-3-319-49094-6_44
Rodríguez, P., Haghighatkhah, A., Lwakatare, L. E., Teppola, S., Suomalainen, T.,
Eskeli, J., . . . Oivo, M. (2017). Continuous deployment of software intensive

166
products and services: A systematic mapping study. Journal of Systems and
Software, 123, 263-291. doi:10.1016/j.jss.2015.12.015
Rodríguez, P., Mäntylä, M., Oivo, M., Lwakatare, L., Seppänen, P., & Kuvaja, P. (2018).
Advances in using agile and lean processes for software development. In:
Memon, A. (2019) Advances in Computers, (Vol. 112). Academic Press.
doi:10.1016/bs.adcom.2018.03.014
Rogers, E. (1995). Diffusion of innovations. New York: Free Press.
Schermann, G., Cito, J., Leitner, P., Zdun, U., & Gall, H. C. (2018). We’re doing it live:
A multi-method empirical study on continuous experimentation. Information and
Software Technology, 99, 41-57. doi:10.1016/j.infsof.2018.02.010
Serrador, P., & Pinto, J. K. (2015). Does agile work? - A quantitative analysis of agile
project success. International Journal of Project Management, 33(5), 1040-1051.
doi:10.1016/j.ijproman.2015.01.006
Seymour, T., & Hussein, S. (2014). The history Of project management. International
Journal of Management & Information Systems (IJMIS), 18(4), 233-240.
doi:10.19030/ijmis.v18i4.8820
Shahin, M., Ali Babar, M., & Zhu, L. (2017). Continuous integration, delivery and
deployment: A systematic review on approaches, tools, challenges and practices.
IEEE Access, 5, 3909-43. doi:10.1109/ACCESS.2017.2685629
Shahin, M., Zahedi, M., Babar, M. A., & Zhu, L. (2018). An empirical study of
architecting for continuous delivery and deployment. Empirical Software
Engineering. doi:10.1007/s10664-018-9651-4

167
Ståhl, D., & Bosch, J. (2017). CINDERS: The continuous integration and delivery
architecture framework. Information and Software Technology, 83, 76-93.
doi:10.1016/j.infsof.2016.11.006
Standish Group International. (2014). CHAOS [White Paper]. London, United Kingdom:
Project Smart. Retrieved from https://www.projectsmart.co.uk/white-
papers/chaos-report.pdf
Stankovic, D., Nikolic, V., Djordjevic, M., & Cao, D.-B. (2013). A survey study of
critical success factors in agile software projects in former Yugoslavia IT
companies. Journal of Systems and Software, 86(6), 1663-1678.
doi:10.1016/j.jss.2013.02.027
Souza, R., Chavez, C., & Bittencourt, R. A. (2015). Rapid releases and patch backouts: A
software analytics approach. IEEE Software, 32(2), 89–96.
doi:10.1109/MS.2015.30
Subramanian, A., Krishnamachariar, P. K., Gupta, M., & Sharman, R. (2018). Auditing
an agile development operations ecosystem. International Journal of Risk and
Contingency Management, 7(4), 21. doi:10.4018/IJRCM.2018100105
Tan, W., Fan, Y., Ghoneim, A., Hossain, M. A., & Dustdar, S. (2016). From the service-
oriented architecture to the web API economy. IEEE Internet Computing, 20(4),
64-68. doi:10.1109/MIC.2016.74
Taylor, K. J. (2016). Adopting agile software development: The project manager
experience. Information Technology & People, 29(4), 670-687. doi:10.1108/ITP-
02-2014-0031
168
Taylor, S., and Todd, P. A. (1995). Assessing IT usage: The role of prior experience. MIS
Quarterly, 19(2), 561-570. doi:10.2307/249633
The Project Manager Network - #1 Group for Project Managers. (n.d.). Posts [LinkedIn
group]. Retrieved March 7, 2019 from https://www.linkedin.com/groups/37888.
Thompson, R. L., Higgins, C. A., and Howell, J. M. (1991). Personal computing: Toward
a conceptual model of utilization. MIS Quarterly, 15(1), 124-143.
doi:10.2307/249443
Triandis, H. C. (1979). Values, attitudes, and interpersonal behavior. In Nebraska
symposium on motivation, 27, University of Nebraska Press.
Turner, M., Kitchenham, B., Brereton, P., Charters, S., & Budgen, D. (2010). Does the
technology acceptance model predict actual use? A systematic literature review.
Information and Software Technology, 52(5), 463-479.
doi:10.1016/j.infsof.2009.11.005
Vavpotic, D., & Bajec, M. (2009). An approach for concurrent evaluation of technical
and social aspects of software development methodologies. Information and
software Technology, 51(2), 528-545. doi:10.1016/j.infsof.2008.06.001
Venkatesh, V., & Davis, F. D. (2000). A theoretical extension of the technology
acceptance model: Four longitudinal field studies. Management Science, 46(2),
186-204. doi:10.1287/mnsc.46.2.186.11926
Venkatesh, V., Morris, M. G., Davis, G. B., & Davis, F. D. (2003). User acceptance of
information technology: Toward a unified view. MIS Quarterly, 27(3), 425.
doi:10.2307/30036540

169
Venkatesh, V., Thong, J. Y. L., & Xu, X. (2016). Unified theory of acceptance and use of
technology: A synthesis and the road ahead. Journal of the Association for
Information Systems, 17(5), 328-376. doi:10.17705/1jais.00428
Wagaw, M. (2017). Acceptance of homegrown enterprise resource planning (ERP)
systems in Ethiopia. Applied Informatics; Heidelberg, 4(1), 1-10.
doi:10.1186/s40535-017-0034-5
Walldén, S., Mäkinen, E., & Raisamo, R. (2016). A review on objective measurement of
usage in technology acceptance studies. Universal Access in the Information
Society; Heidelberg, 15(4), 713-726. doi:10.1007/s10209-015-0443-y
Wernerfelt, B. (1984). A resource‐based view of the firm. Strategic management
journal, 5(2), 171-180. doi:10.1002/smj.4250050207
Yilmaz, M., O’Connor, R. V., Colomo-Palacios, R., & Clarke, P. (2017). An examination
of personality traits and how they impact on software development teams.
Information and Software Technology, 86, 101–122.
doi:10.1016/j.infsof.2017.01.005
Zhu, L., Bass, L., & Champlin-Scharff, G. (2016). DevOps and its practices. IEEE
Software, 33(3), 32-34. doi:10.1109/MS.2016.81
170
Appendix A: Permission of UTAUT Author to Use Model, Instrument, and Images
Re: Permission to use instrument and images in UTAUT published work.
Gordon Davis @umn.edu
Sent: Mon 1/7/2019 2:40 PM
To: Andrew J Anderson @waldenu.edu>
The instrument is in the public domain. You may use it.
Gordon B Davis
--
Gordon B Davis, Professor Emeritus of Information Systems
Carlson School of Management - University of Minnesota
On January 7, 2019, at 11:12 AM, "Andrew J Anderson" @waldenu.edu> wrote:
Dr. Morris, Dr. Davis, Dr. Davis,
I am a PhD student at Walden University. I am writing a dissertation on the
adoption of DevOps in large enterprises. I would like to use the Unified Theory of
Acceptance and Use of Technology to study my topic. May I have your permission to use
the instrument and images contained in your published work:
Venkatesh, Morris, Davis, & Davis. (2003). User Acceptance of Information
Technology: Toward a Unified View. MIS Quarterly, 27(3), 425.
https://doi.org/10.2307/30036540
Thank you for your consideration in advance, Andrew Anderson

171
Appendix B: Permission of UTAUT Publisher to Use Model, Instrument, and Images
MIS QuarterlyCarlson School of Management
University of MinnesotaSuite 3-306 CSOM
321 19th Avenue SouthMinneapolis, MN 55455
January 9, 2019
Andrew AndersonWalden University
Permission to use material fromMIS Quarterly in doctoral dissertation
Permission is hereby granted for Andrew Anderson to use material from “User Acceptance of InformationTechnology: Toward a Unified View,” V. Venkates h, M. Morris, G. B. Davis, and F. D. Davis, MIS Quarterly(27:3), September 2003, pp. 425-478, specifically instrument, Figures 1 and 3 (and additional material asneeded), in his doctoral dissertation, “Examination of Adoption Theory on the DevOps Practice ofContinuous Delivery,” being completed at Walden University.
In addition to the citation information for the work, the legend should include
Copyright © 2003, Regents of the Universi ty of Minnesota. Used with permission.
Permission is granted for Proquest through UMI® Dissert ation Publishing to sell or provide online theoriginal dissertation, but does not extend to future revi sions or editions of the dissertation, or publication ofthe material in any other format.
Janice I. DeGrossManager
172
Appendix C: Permission to use Dwivedi et al. (2017) Figures

173
Appendix D: Permission to use Chen (2015) Figures

174
Appendix E: Survey Instrument

175
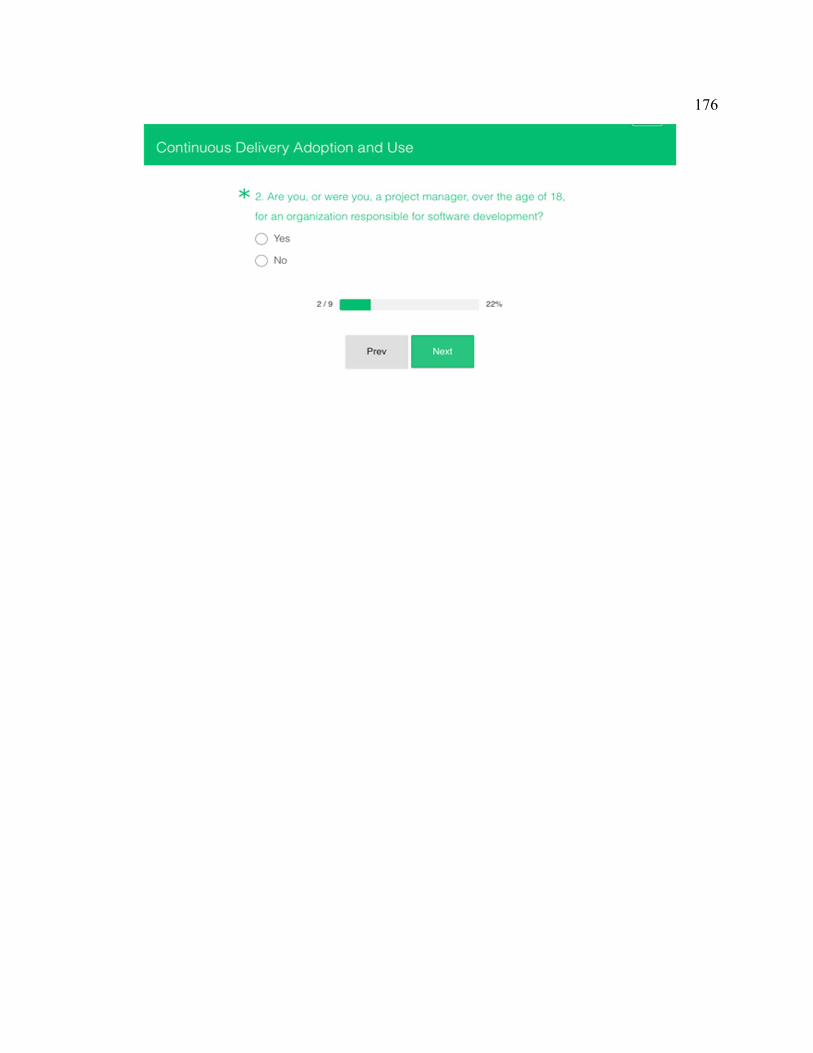
176

177

178

179
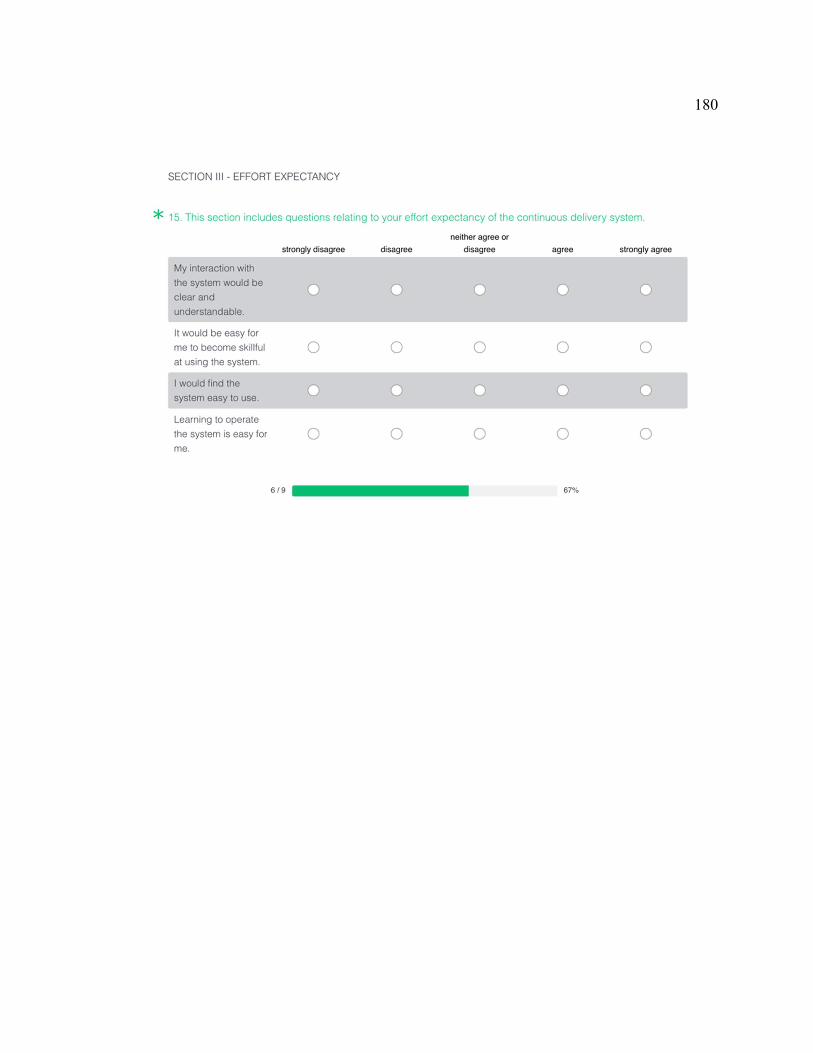
180

181

182
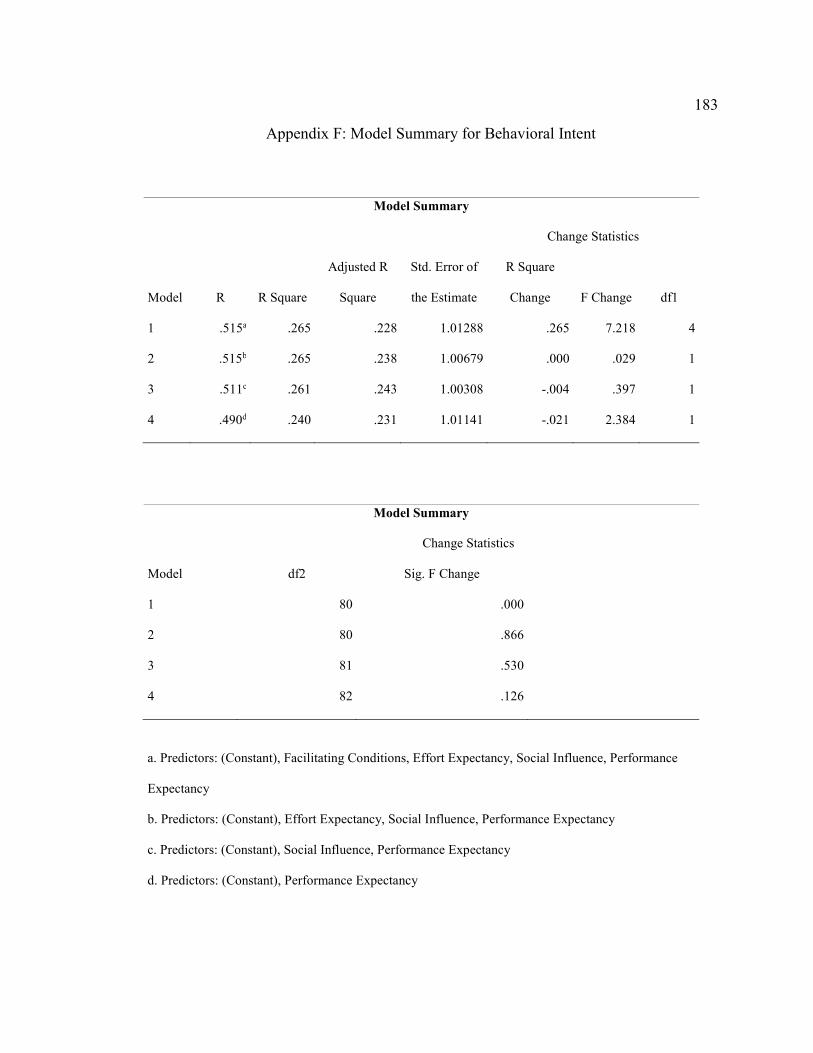
183
Appendix F: Model Summary for Behavioral Intent
Model Summary
Model R R Square
Adjusted R
Square
Std. Error of
the Estimate
Change Statistics
R Square
Change F Change df1
1 .515a .265 .228 1.01288 .265 7.218 4
2 .515b .265 .238 1.00679 .000 .029 1
3 .511c .261 .243 1.00308 -.004 .397 1
4 .490d .240 .231 1.01141 -.021 2.384 1
Model Summary
Model
Change Statistics
df2 Sig. F Change
1 80 .000
2 80 .866
3 81 .530
4 82 .126
a. Predictors: (Constant), Facilitating Conditions, Effort Expectancy, Social Influence, Performance
Expectancy
b. Predictors: (Constant), Effort Expectancy, Social Influence, Performance Expectancy
c. Predictors: (Constant), Social Influence, Performance Expectancy
d. Predictors: (Constant), Performance Expectancy
Top Related