


Languages
Pages
Legal

Charles Darwin (1809--1882) was an English naturalist and is credited for proposing that the mechanism for the process of evolution is natural selection. Darwin spent five years on a voyage that took him around the world with the majority of his time spent in South America and its neighboring islands. For more information access this link: http://en.wikipedia.org/wiki/Charles_Darwin
11/08/15
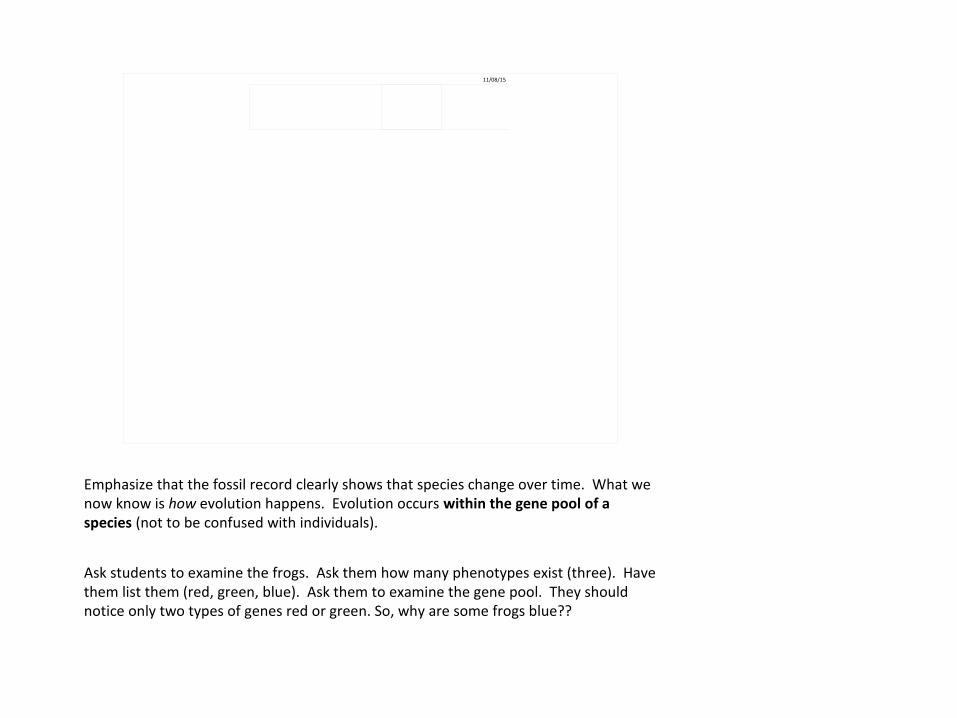
Emphasize that the fossil record clearly shows that species change over time. What we now know is how evolution happens. Evolution occurs within the gene pool of a species (not to be confused with individuals).
Ask students to examine the frogs. Ask them how many phenotypes exist (three). Have them list them (red, green, blue). Ask them to examine the gene pool. They should notice only two types of genes red or green. So, why are some frogs blue??

11/08/15
Have students tally the number of frogs of each color before moving to the next slide! Allele frequency calculations follow on the next slide.
11/08/15
Be sure to connect that the frequencies are the p and q of the Hardy-Weinberg equilibrium equation. Students don’t usually make that connection on their own.
Introducing 4 new green frogs changes the population. Now, there are 15 green frogs, 2 blue and 3 red. (20 individuals, thus 40 alleles)
Have students “do the math” before moving to the next slide.
You can also survey the room to determine the gene pool for human eye color in your classroom population. Use B and b for the alleles. When a brown-eyed student is found, ask them the phenotype of their parents. If one is blue, then you know that the student is Bb.
If both parents have brown eyes, tell the student, “I do not know for sure, but we will guess that you are BB”. Determine the allele frequency similar to the example above.
11/08/15
What do we conclude? Did the allelic frequencies change? Yep! That indicates evolution occurred.
You can also revisit your brown eyed problem by asking them what happens if 6 blue-eyed students joined the population. Let them determine how the allele frequency will change.

11/08/15
Some would argue that the words immigrate and emigrate apply only to human populations.
11/08/15
What do we conclude? Did the allelic frequencies change? Yep! That indicates evolution occurred.
Emphasize that allele frequencies can be changed by gene flow OR emigration and immigration occurring. Now, what would happen if four green frogs joined the population but the population was twice as large as the original population?
11/08/15
The next few slides are investigating the effect of large versus small sample size. What happens to the allelic frequencies when the frog population is twice as large. Have students tally the frogs prior to moving to the next slide.
Additionally, you can ask the students what happens to the allele frequency in the classroom population if the six blue-eyed students joined the school gene pool instead of just the class gene pool. (It would not have as great an effect since the school population is much larger than the class population.)
11/08/15
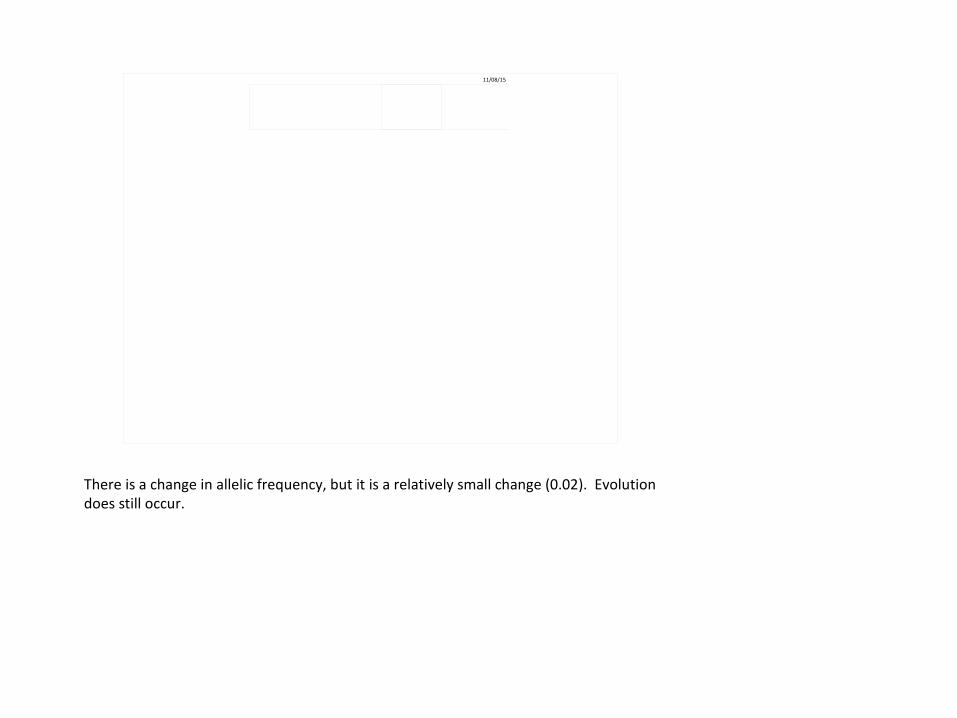
There is a change in allelic frequency, but it is a relatively small change (0.02). Evolution does still occur.
11/08/15
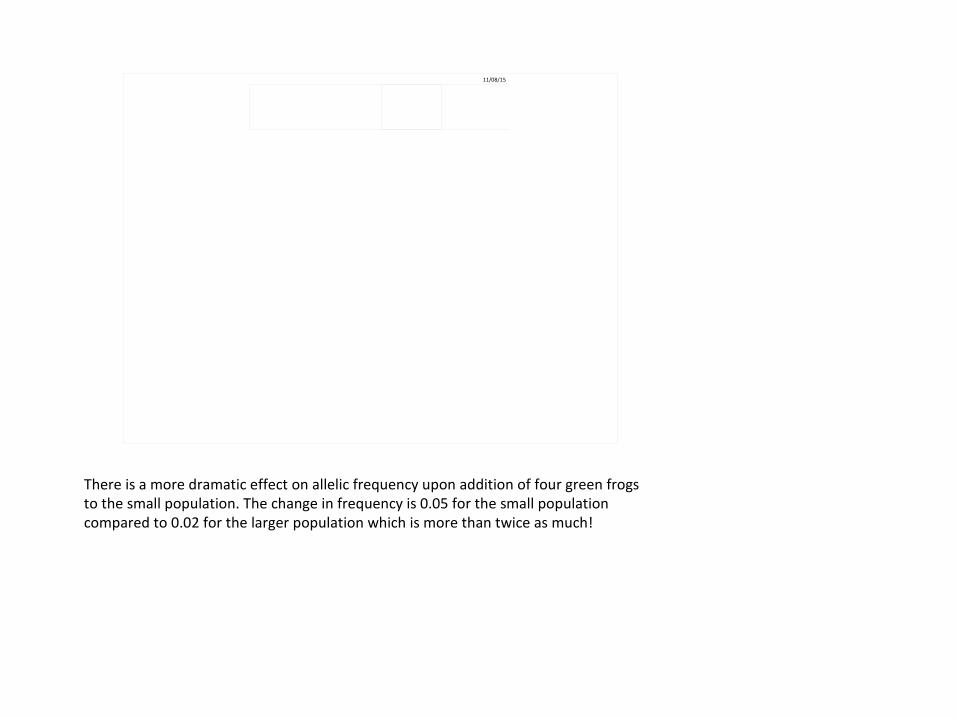
There is a more dramatic effect on allelic frequency upon addition of four green frogs to the small population. The change in frequency is 0.05 for the small population compared to 0.02 for the larger population which is more than twice as much!
11/08/15
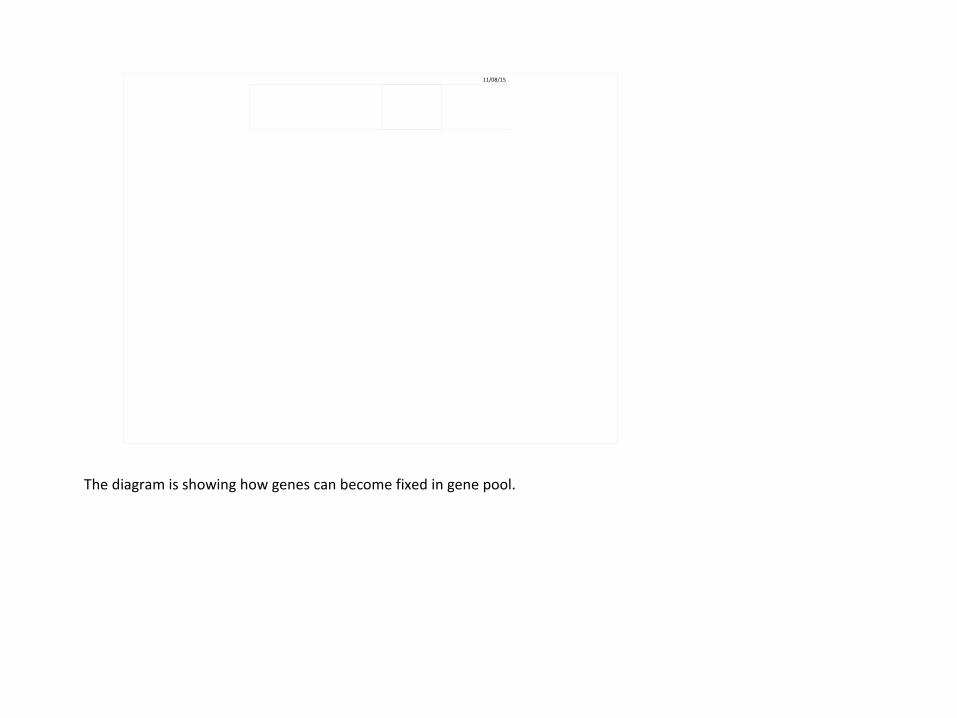
The diagram is showing how genes can become fixed in gene pool.
11/08/15
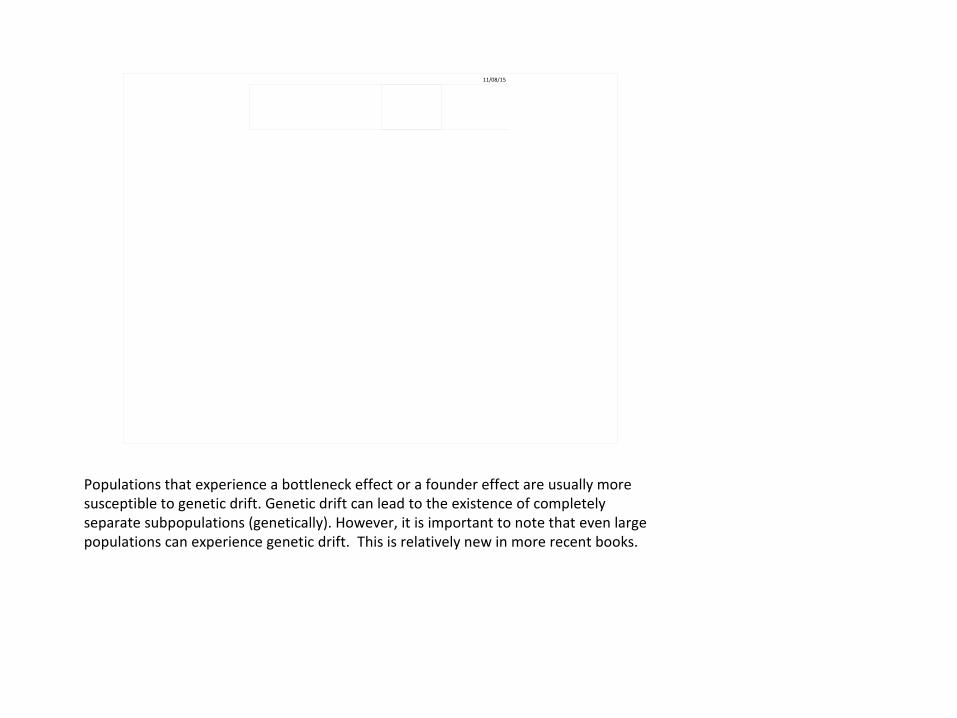
Populations that experience a bottleneck effect or a founder effect are usually more susceptible to genetic drift. Genetic drift can lead to the existence of completely separate subpopulations (genetically). However, it is important to note that even large populations can experience genetic drift. This is relatively new in more recent books.
11/08/15
Populations that experience a bottleneck effect or a founder effect are usually more susceptible to genetic drift. Sometimes it’s a social pressure among humans in particular. The instances of hemophilia among the British royal family for instance. “Pressure” was (and in some cases still is) placed on members of the Royal Family to marry only Royals. The result is that genes become magnified since there is a reduction in genetic diversity.
11/08/15
Emphasize that a reduction in genetic diversity has a negative impact on offspring.
For example, most deleterious alleles like cystic fibrosis are recessive. If these negative genes are ones that are left in the reduced gene pool then it increases the probability that they will be expressed.

11/08/15
The new, yet small population colonizes the area.

11/08/15
http://io9.com/the-founder-effect/

11/08/15
http://io9.com/the-founder-effect/
11/08/15
Another interesting American case of the Founder Effect involves the Fugates of Troublesome Creek in Kentucky. http://www.rootsweb.ancestry.com/~kyperry3/Blue_Fugates_Troublesome_Creek.html and http://news.yahoo.com/humans-eventually-look-brazilians-140349518.html
11/08/15
Random mating is the exception rather than the norm. Most mating is nonrandom. Emphasize that time and space also factor into nonrandom mating. For example, pollen from Ohio is more likely to cross pollinate a neighboring tree in Ohio rather than a tree in Oregon. However, truly nonrandom mating would imply that these events would have an equal probability.

11/08/15
Emphasize that in addition to a flashy appearance males often have vocalizations and compete with other males to attract females.
11/08/15
Emphasize a gene is determined beneficial if it gives an organism an advantage which depends entirely on the environment.
11/08/15
Godfrey Hardy (1877-1947), an English mathematician, and Wilhelm Weinberg (1862-1937), a German physician, both found a way to link genetic probability and evolution the early 20th century. Hardy and Weinberg independently worked on finding a mathematical equation to explain the link between genetic equilibrium and evolution in a population of species.

11/08/15
This slide and the next slide explain that three of the five conditions for Hardy-Weinberg can never be met, therefore evolution occurs within populations.

11/08/15
The next three slide derive the Hardy-Weinberg equilibrium.

11/08/15
As long as the allelic frequencies are remaining constant, there is no evolution of the population.

11/08/15
Whoever said “It isn’t easy being green?”
11/08/15
Ask students if they know the “FOIL” method for solving (p + q)2. FOIL stands for “first by the first, outsides, insides, second by the second.” It’s a mnemonic device math teachers use to teach binomial expansions and arrive at p2 + 2pq + q2 which equals 1 in this situation since p + q = 1, thus (p + q)2 = 12 = 1 as well, and gives this algebraic expression: p2 + 2pq + q2. It may have been a while since your last Algebra class, but it hasn’t been that long since students mastered this skill!
This pair of equations along with a subsequent Chi square calculation allow us to determine if a population is in H-W equilibrium.
11/08/15
Emphasize to students that the phrases “survival of the fittest” and “struggle for existence” are commonly used to describe natural selection, BUT they should not be taken to mean between individuals! There are reproductive advantages among animals that are passive and do not involve a form of battle:
•An animal may be a better “food gatherer”, thus has more energy to lay more eggs.
•An animal may be better camouflaged, thus lives longer and produces more offspring.
11/08/15
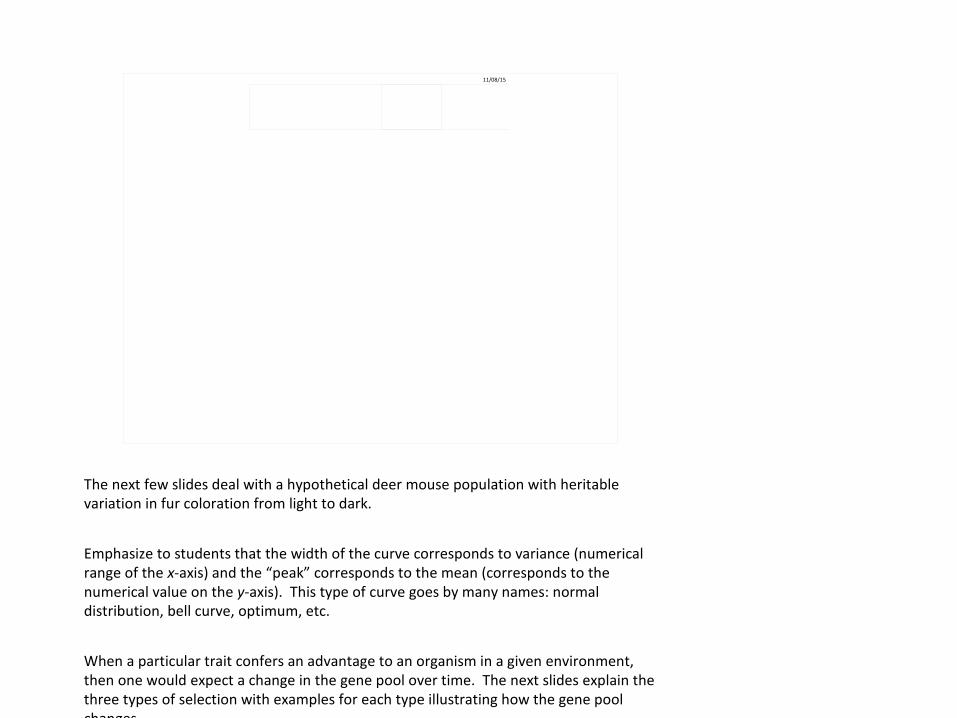
The next few slides deal with a hypothetical deer mouse population with heritable variation in fur coloration from light to dark.
Emphasize to students that the width of the curve corresponds to variance (numerical range of the x-axis) and the “peak” corresponds to the mean (corresponds to the numerical value on the y-axis). This type of curve goes by many names: normal distribution, bell curve, optimum, etc.
When a particular trait confers an advantage to an organism in a given environment, then one would expect a change in the gene pool over time. The next slides explain the three types of selection with examples for each type illustrating how the gene pool changes.
11/08/15
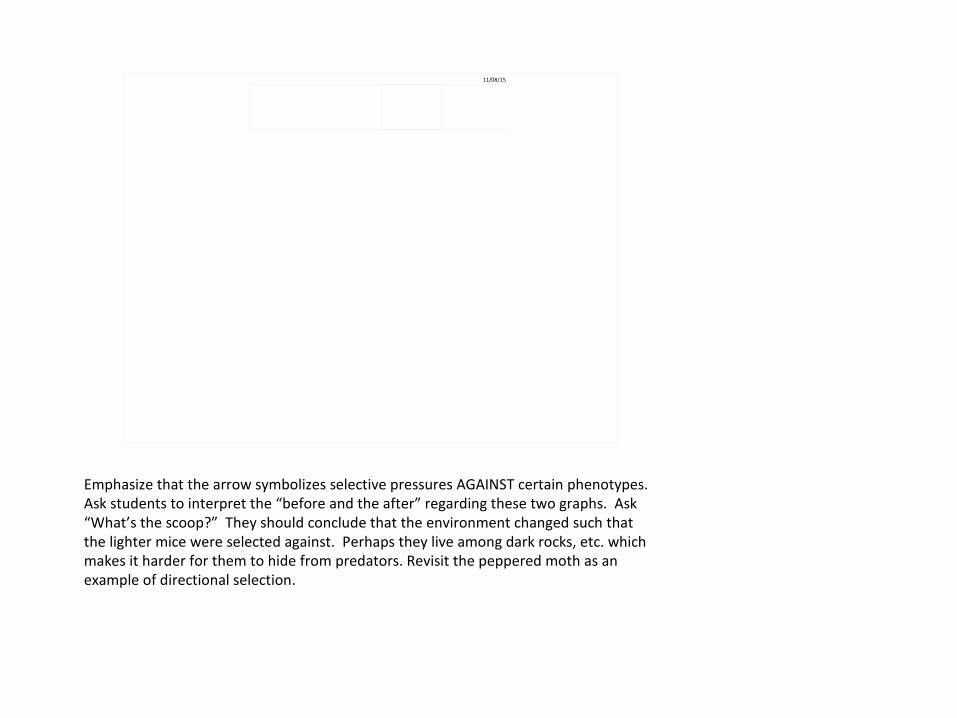
Emphasize that the arrow symbolizes selective pressures AGAINST certain phenotypes. Ask students to interpret the “before and the after” regarding these two graphs. Ask “What’s the scoop?” They should conclude that the environment changed such that the lighter mice were selected against. Perhaps they live among dark rocks, etc. which makes it harder for them to hide from predators. Revisit the peppered moth as an example of directional selection.

11/08/15
Ask students to propose possible consequences of continual directional selection (extinction or speciation).

11/08/15
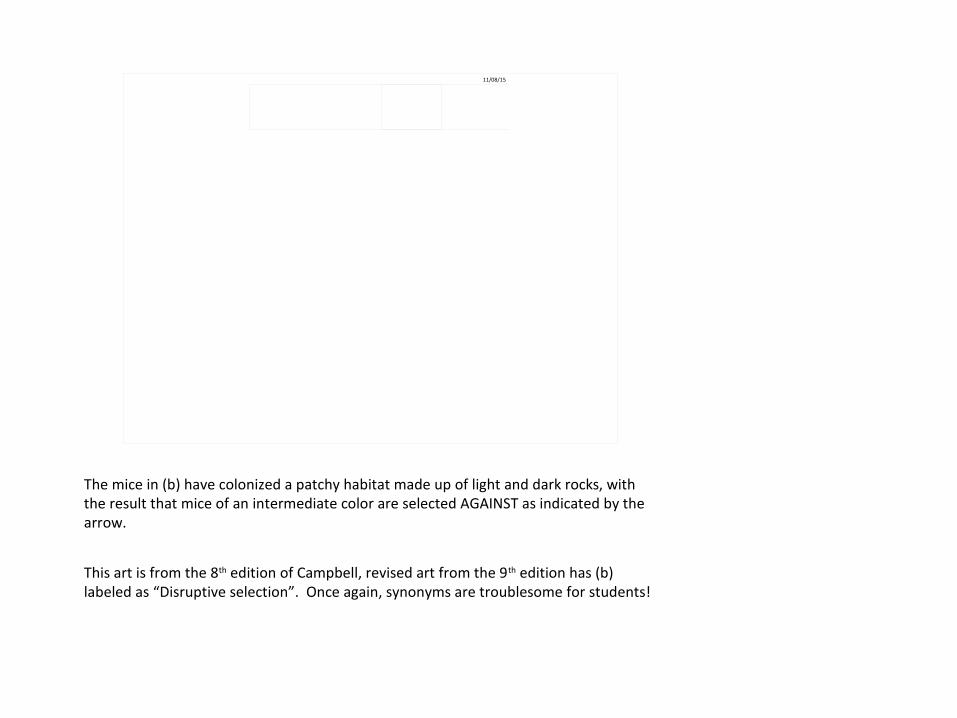
The mice in (b) have colonized a patchy habitat made up of light and dark rocks, with the result that mice of an intermediate color are selected AGAINST as indicated by the arrow.
This art is from the 8th edition of Campbell, revised art from the 9th edition has (b) labeled as “Disruptive selection”. Once again, synonyms are troublesome for students!
11/08/15
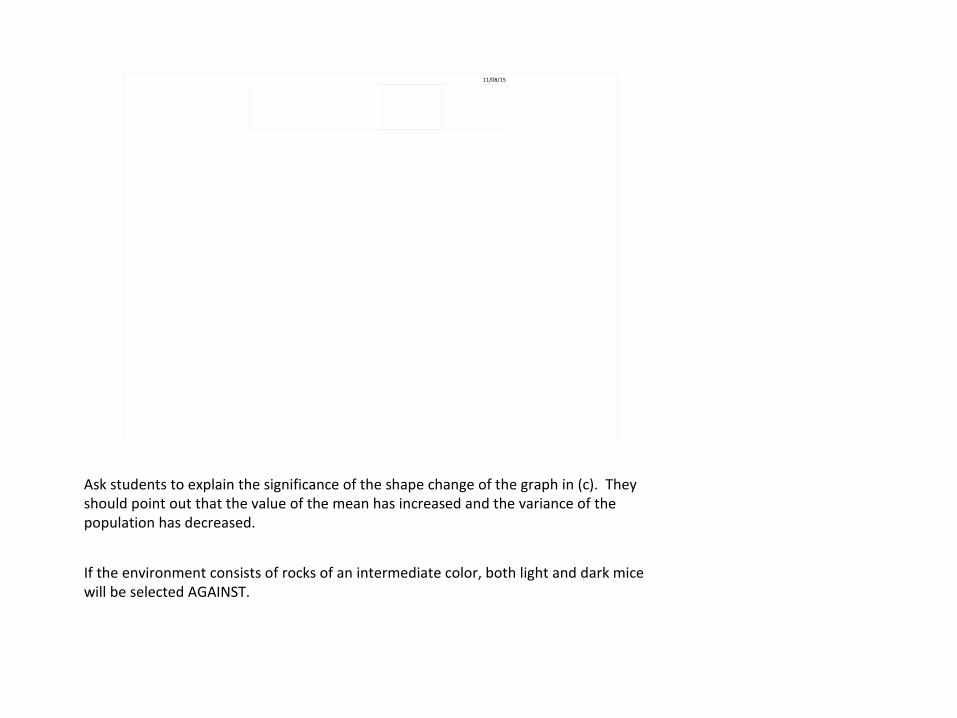
Ask students to explain the significance of the shape change of the graph in (c). They should point out that the value of the mean has increased and the variance of the population has decreased.
If the environment consists of rocks of an intermediate color, both light and dark mice will be selected AGAINST.

11/08/15
Ask students to identify “differences in secondary sexual characteristics”. Possible answers include: size, color, ornamentation and behavior.
11/08/15
Remind students that the prefix intra- means “within” as opposed to the prefix inter- which means “between” as in interstate highways that connect states. HI and AK don’t have those types of highways!
Ask student to come up with examples of intrasexual selection: patrolling a group of females, male to male combat, marking a territory, etc.

11/08/15
Ask student to come up with examples of showiness and its possible consequences: bright coloration—sacrifice of camouflage, mating call or song—alerting would be predators of the prey’s location, etc.
11/08/15
Genetic variation in a gene pool is beneficial. The question is how certain populations can maintain genetic variation. These next slides explain how genetic variation can be maintained.

11/08/15
Recessive alleles might not be favored under present environmental conditions, but can still bring new benefits if the environment changes.

11/08/15
Recessive alleles might not be favored under present environmental conditions, but can still bring new benefits if the environment changes.
11/08/15
Natural selection may favor non-poisonous butterflies that have the same color pattern as poisonous butterflies. This system is called Batesian mimicry. When they are rare, birds will tend to avoid the mimics, because they will have already have encountered a poisonous butterfly of the same appearance. But when the non-poisonous type is common, the previous encounters of birds with butterflies of their appearance are more likely to have been rewarding; the birds will not avoid eating them, and their fitness will be lower. The fitness of the mimics is negatively frequency-dependent.
11/08/15
Though natural selection leads to adaptation, nature abounds with examples of organisms that are less than ideally “engineered” for their lifestyles.
11/08/15
With these 4 constraints, evolution does not tend to craft perfect organisms. Natural selection operates on a “better than” basis. As a result, many organisms contain imperfections.
Top Related