


Languages
Pages
Legal


WHO CENTRE FOR HEALTH DEVELOPMENT
Developing Indicators for the Global Age-Friendly Cities
30-31 AUGUST 2012
ST. GALLEN, SWITZERLAND
MEETING SUMMARY
1. BACKGROUND
1.1. Rapid population ageing and urbanization are reshaping the global demographic landscape. In
2005, 51.5% of the world’s older population already lived in urban areas (UNDESA 2009);
1.2. Population ageing, particularly in cities, underscores several key issues related to health:
1.2.1. Sustainability of public welfare expenditures;
1.2.2. Appropriate action for elderly-oriented health and social services;
1.2.3. Appropriate urban planning and development.
1.3. To support governments develop and strengthen health and social policies that are responsive
to population ageing, the World Health Organization (WHO) developed the Global Age-friendly
Cities Guide and brought together 33 cities across 22 countries to create a checklist of essential
features of age-friendly cities;
1.4. In 2010, The Global Network of Age-friendly Cities and Communities (i.e. the Network) was
launched by the WHO with the following objectives:
1.4.1. Connect cities and communities that share the commitment of becoming more age-
friendly;
1.4.2. Facilitate the exchange of information and best practices;
1.4.3. Provide technical support and training; and
1.4.4. Ensure that interventions taken to improve the lives of older people are appropriate,
sustainable and cost-effective.
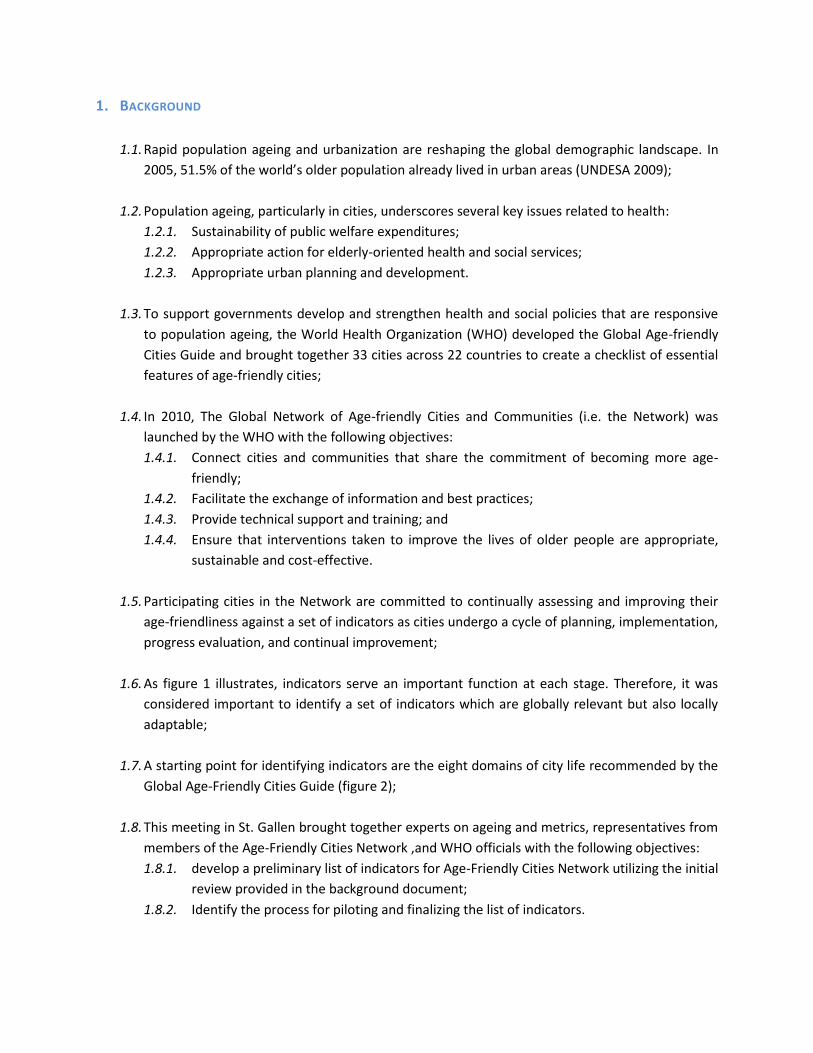
1.5. Participating cities in the Network are committed to continually assessing and improving their
age-friendliness against a set of indicators as cities undergo a cycle of planning, implementation,
progress evaluation, and continual improvement;
1.6. As figure 1 illustrates, indicators serve an important function at each stage. Therefore, it was
considered important to identify a set of indicators which are globally relevant but also locally
adaptable;
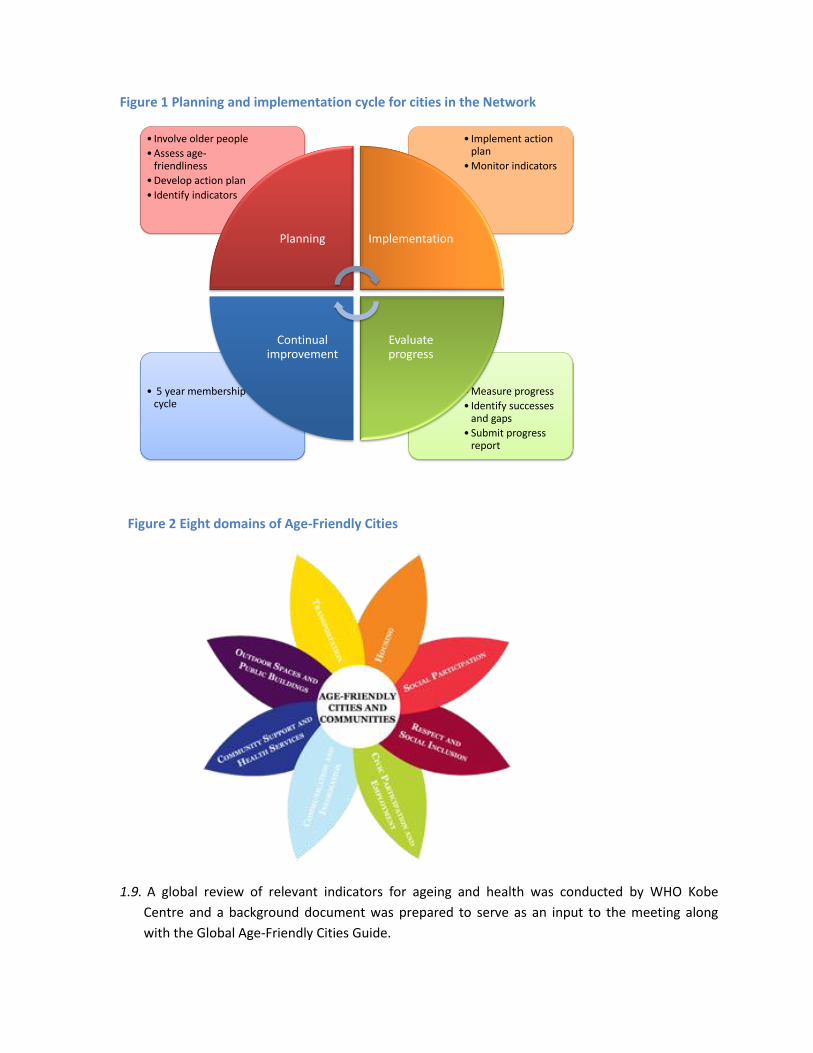
1.7. A starting point for identifying indicators are the eight domains of city life recommended by the
Global Age-Friendly Cities Guide (figure 2);
1.8. This meeting in St. Gallen brought together experts on ageing and metrics, representatives from
members of the Age-Friendly Cities Network ,and WHO officials with the following objectives:
1.8.1. develop a preliminary list of indicators for Age-Friendly Cities Network utilizing the initial
review provided in the background document;
1.8.2. Identify the process for piloting and finalizing the list of indicators.
• Measure progress
• Identify successes and gaps
• Submit progress report
• 5 year membership cycle
• Implement action plan
• Monitor indicators
• Involve older people
• Assess age-friendliness
• Develop action plan
• Identify indicators
Planning Implementation
Evaluate progress
Continual improvement
1.9. A global review of relevant indicators for ageing and health was conducted by WHO Kobe
Centre and a background document was prepared to serve as an input to the meeting along
with the Global Age-Friendly Cities Guide.
Figure 1 Planning and implementation cycle for cities in the Network
Figure 2 Eight domains of Age-Friendly Cities
2. SETTING THE CONTEXT
2.1. Three presentations were made in this session:
2.1.1. WHO’s global strategy on ageing and health (Dr. John Beard, WHO);
2.1.2. Introduction to Global Age-Friendly Cities Guide (Dr. Louise Plouffe, Consultant);
2.1.3. Review of global initiatives on developing indicators for monitoring population ageing
(Mr. Amit Prasad, WHO).
2.2. Dr. John Beard indicated in his presentation that “ageing” as an issue was becoming a priority
for the WHO. In particular, WHO, in its new strategy is focusing on health across the life-course
where issues relating to ageing have a prominent presence.
2.3. Dr. Beard also emphasized that the key objective of an Age-Friendly City should be to facilitate
the process of Active Ageing1.
2.4. Dr. Louise Plouffe presented the Global Age-Friendly Cities Guide (the Guide) including the
process of developing the Guide;
2.5. Dr. Plouffe specified that the essential features of an Age-Friendly City are to:
2.5.1. Raise public awareness of the capacities and needs of a growing older citizenry;
2.5.2. Stimulate and guide local action to make urban settings and services more age-friendly.
2.6. Mr Amit Prasad presented the global review of ageing and health related indicators. A total of
sixteen relevant initiatives were identified and 195 indicators from these initiatives were
mapped to the eight domains of the Guide. Two additional domains were created for “health”
and “other” issues. The latter mainly consisted of demographic and contextual variables.
Table 1 Distribution of indicators by domain based on WHO review in 2012
2.7. Mr. Prasad also described the process for developing indicators for the Urban Health Equity
Assessment and Response Tool (Urban HEART).
1 “Active Ageing is the process of optimizing opportunities for health, participation and security in order to
enhance the quality of life as people age.” WHO Active Ageing: A Policy Framework, 2002.
Domain No. of
indicators Domain
No. of indicators
Health 42 Outdoor spaces and buildings 16
Civic participation and employment 27 Respect and social inclusion 16
Housing 21 Social participation 14
Community and health services 21 Transportation 12
Other 20 Communication and information 6

2.8. In the plenary discussion that followed a number of observations and suggestions were made;
2.9. Indicators for Age-friendly Cities should be adaptable for relevance at the local level. The
indicators should be appropriate towards capturing the diversity within a city. Some indicators
will also be relevant at the national and global levels;
2.10. Gender issues should be incorporated specifically in the Age-Friendly Cities set of indicators
from both an urban and age-friendliness perspective;
2.11. Selected indicators should reflect planning and implementation stages, intermediary results as
well as long-term outcome indicators;
2.12. Indicators should only be selected if they lead to or reflect the consequences of action;
2.13. There was substantial discussion on the value of having globally comparable indicators:
2.13.1. The international comparability of indicators and their measurement strategies was
considered to be of great benefit by some participants;
2.13.2. Others disagreed with the importance on international comparability since cities were
primarily interested in locally relevant indicators e.g. in Canada;
2.13.3. Also, some cities may not want to be explicitly compared to other cities e.g. the
experience of the Alliance for Healthy Cities in Asia;
2.13.4. There was greater agreement to include indicators that were at least comparable over
time within cities;
2.14. Although it would be useful to have consistent measures of progress over time there was a
sense that some cities may be reluctant to do so in times of financial crisis and budget cuts e.g.
in Ireland at present;
2.15. Indicators selected at the global level should be adaptable to local needs and the process of
selecting indicators should be an iterative and dynamic process;
2.16. Consider the use of qualitative assessment methods as well e.g. stories, photographs etc.;
2.17. Timeliness of indicators was emphasized as well as the need to collect them from administrative
systems as much as possible;
2.18. To sustain the use of the indicators it was important to engage non-governmental organizations
(NGOs) and the government/parliament.
2.19. Indicators for ageing should also be recommended in the list of post-MDG (2015) indicators at
the international level. However, participants noted that this would require a different process
than the current one for developing indicators for the Network;

2.20. A glossary is needed to clarify and define various terms used in the Guide e.g. sustainability,
accessibility, universal design etc.
3. DEVELOPING INDICATORS FOR MONITORING AGE-FRIENDLY CITIES: CRITERIA AND DOMAINS
3.1. Three presentations were made in this session:
3.1.1. The experience of Japan Gerontological Evaluation Study (JAGES) HEART (Prof. Katsunori
Kondo, Nihon Fukushi University);
3.1.2. The experience of developing indicators in Canada (Dr. Heather Orpana, PHAC);
3.1.3. The role of age profiles and indicators for the European Healthy Cities Network on
healthy ageing (Dr. Manfred Huber, WHO).
3.2. Prof. Katsunori Kondo provided an overview of the development of the JAGES benchmarking
system. The purpose of developing benchmarks is to inform and improve the performance of
Japan’s public long term care insurance. The project has been funded by the Ministry of Health
and Labour Welfare in Japan.
3.3. The latest JAGES study in 2010/11 included 31 municipalities in Japan with 112,123 respondents
and the results were widely accepted. More municipalities may join the project in the future;
Figure 3 Municipalities in Japan who participated in JAGES in 2010/11, Source: Nihon Fukushi University
33
38
578
30
8586
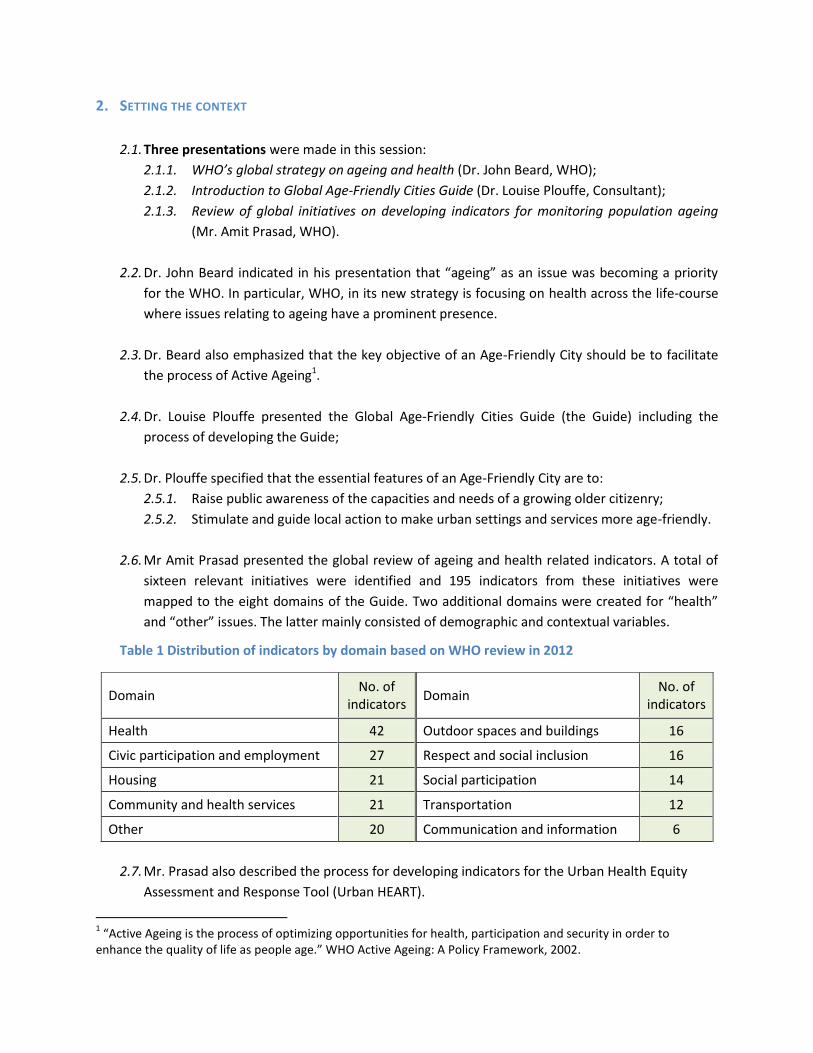
3.4. Dr. Heather Orpana presented, via Skype, the development of indicators to monitor age-
friendliness of communities in Canada. There are more than 800 Age-Friendly Communities in
Canada.
3.5. Canada's recognition program includes five milestones, the fifth of which is "Committing to
measuring activities, reviewing action plan outcomes, and reporting on them publicly”. In order
to support communities, the Public Health Agency of Canada (PHAC) is currently developing a
set of coherent indicators of age-friendliness for use by communities;
Figure 4 Distribution of over 800 AFCs in Canada Source: PHAC (Canada)
3.6. Dr. Manfred Huber presented the development of Healthy Ageing profiles for European
countries at the local level as part of the work of the Sub-network on Ageing for the WHO
European Healthy Cities Network;
3.7. Dr. Huber mentioned three main outputs of the Sub-network:
3.7.1. Action on implementation and exchange of good practice;
3.7.2. Development/consolidation of tools and guidelines;
3.7.3. Building external partnerships.
3.8. In the plenary discussion that followed a number of observations and suggestions were made;
3.9. A few similarities were noted between the three presentations:
3.9.1. Engagement of wider group of stakeholders;
3.9.2. Use of similar criteria to identify indicators;
3.9.3. Linkages were built between different efforts with similar goals.
3.10. A parsimonious list of indicators would be essential in taking forward this initiative especially if
data collection methods are going to require surveys;
3.11. The Japanese example and some cities in Europe conducted surveys to collect data. Some cities
are ambitious and have resources, both human and financial, to implement surveys. However,
surveys may not always be feasible especially when resources are scarce;
3.12. The Canadian example provided a practical and good way of engaging stakeholders;
3.13. Focus for the future should be a policy and intervention oriented tool. The tool should be fit for
purpose and should include a clear communication strategy;
3.14. It would be useful to have a “User Manual” or relevant tools with the indicators that can guide
users through the process of outcomes reporting, developing policies and interventions;
3.15. In WHO Region for the Western Pacific, the approach is to build capacity on city health
governance, then offer topic-specific advice, instead of building policy capacity on each issue;
3.16. It is important to capture the heterogeneity within cities as well. How can we deal with cities
that are 90% age-friendly but 10% of the city is not age-friendly? There are some tools such as
Urban HEART to assess inequity within cities but they do not cover ageing issues, explicitly, yet;
3.17. It will be important to recommend disaggregation by gender, socioeconomic status, ethnicity etc.
The use of equity indicators could also be encouraged. For example, how do cities provide
services to low-income groups?
4. GROUP WORK 1: DEVELOPING CRITERIA FOR IDENTIFYING INDICATORS
4.1. Participants were divided into three groups in this session and each group was expected to
answer three sets of questions;
4.2. The three sets of questions related to:
4.2.1. Revisiting the domains
4.2.2. Key purpose of the indicators
4.2.3. Technical and practical criteria for identifying indicators
4.3. In revisiting the domains (from 4.2.1) the group agreed on the following key points:

4.3.1. The domains were mostly acceptable, easily understandable and relevant to measure
the age-friendliness of a city;
4.3.2. Two new domains were proposed:
4.3.2.1. “Economic Security” ;
4.3.2.2. “Governance” including implementation and sustainability mechanisms;
4.3.2.3. The domains of “Social Participation” and “Respect and Social Inclusion” were
recommended to be merged into “Social participation, respect and social
inclusion”.
4.3.3. A practical challenge in introducing new domains was noted as some countries had
already been using the current set of eight domains in their respective Networks.
Further discussion with a larger group of stakeholders on domains will be required;
4.4. For the questions in 4.2.1. the following issues were also considered to be of importance:
4.4.1. Stratification of data by gender, socioeconomic status minority groups should be
explicitly included;
4.4.2. Life-long learning should be included within one of the domains e.g. civic participation
and employment;
4.4.3. The importance of family, friends and pets (e.g., social support) should also be
considered, in a new domain, or within one of the existing domains, such as “Respect
and Social Inclusion”;
4.4.4. Engagement of and ownership by older people should be considered a cross-cutting
theme. Other cross-cutting themes include accessibility and affordability;
4.4.5. “Respect” should cover freedom from prejudice, discrimination and abuse;
4.4.6. Food security should also be included under one of the domains e.g. the new domain of
economic security or the domain of community and health services.
4.5. The key purpose of the indicators was identified by all groups as “Local planning and
monitoring”. National monitoring and global comparability were considered secondary or
tertiary objectives for the indicators;
4.6. Table 2 presents the list of all technical and practical criteria considered by the groups;
Table 2 Criteria for identifying indicators
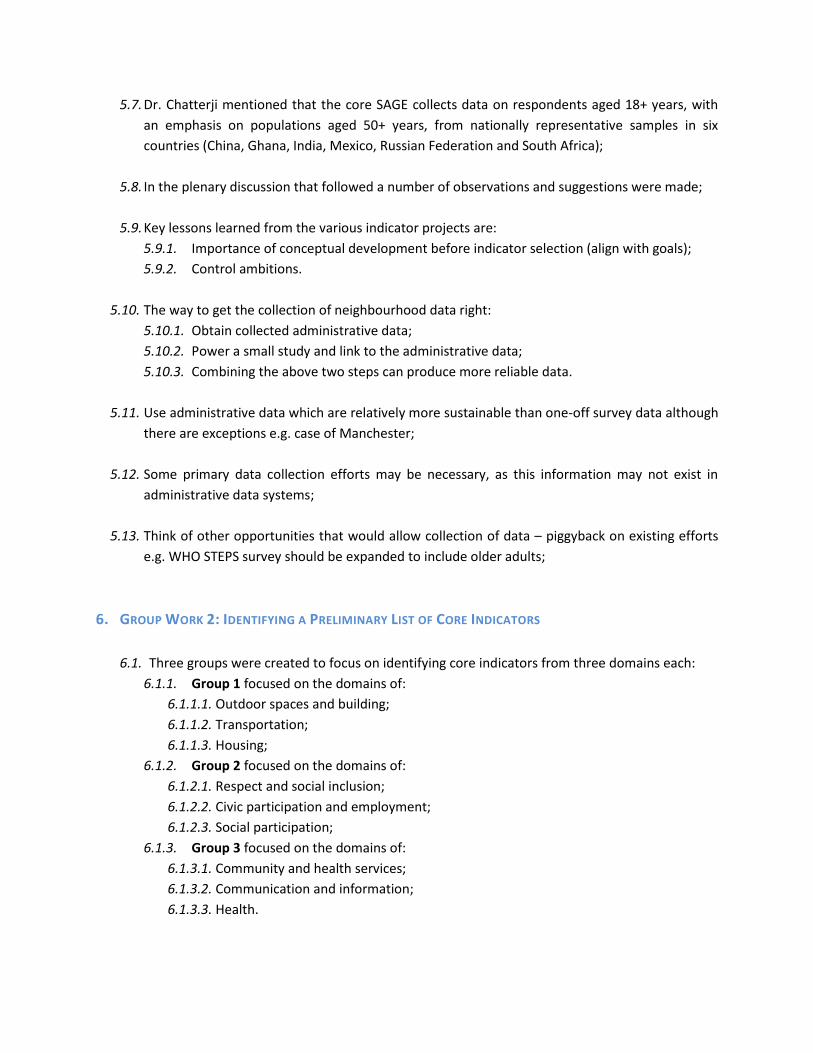
TECHNICAL PRACTICAL
Valid and reliable Parsimonious list
Replicable Core, recommended and optional indicators
Measurable and observable Aligns with goals
Sensitivity Within appropriate sphere of influence (local)
0%
10%
20%
30%
40%
50%
60%
50-59 75+ 50-59 75+
Richest 2nd 3rd 4th Poorest
Men Women
TECHNICAL PRACTICAL
Representativeness Ease of data collection
Process and outcome indicators Social acceptability
Quantitative and qualitative indicators Evidence of impact
5. DEVELOPING INDICATORS FOR MONITORING AGE-FRIENDLY CITIES: A PRELIMINARY LIST
5.1. Three presentations were made in this session:
5.1.1. The experience of Manchester City Council in developing indicators for population ageing
and health (Dr. Sophie Handler, Manchester City Council);
5.1.2. Developing indicators for the Active Ageing Index in Europe (Dr. Asghar Zaidi, European
Centre for Social Welfare Policy and Research);
5.1.3. Study on Global Ageing and Adult Health (SAGE) (Dr. Somnath Chatterji, WHO).
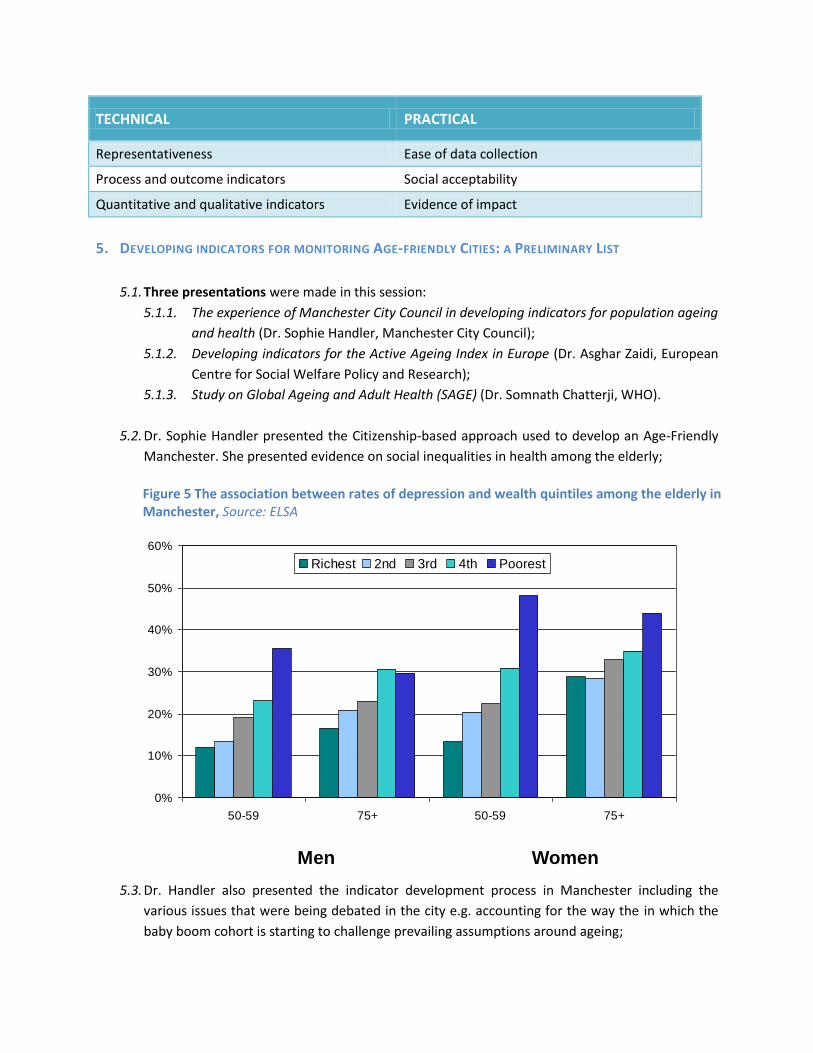
5.2. Dr. Sophie Handler presented the Citizenship-based approach used to develop an Age-Friendly
Manchester. She presented evidence on social inequalities in health among the elderly;
5.3. Dr. Handler also presented the indicator development process in Manchester including the
various issues that were being debated in the city e.g. accounting for the way the in which the
baby boom cohort is starting to challenge prevailing assumptions around ageing;
Figure 5 The association between rates of depression and wealth quintiles among the elderly in Manchester, Source: ELSA
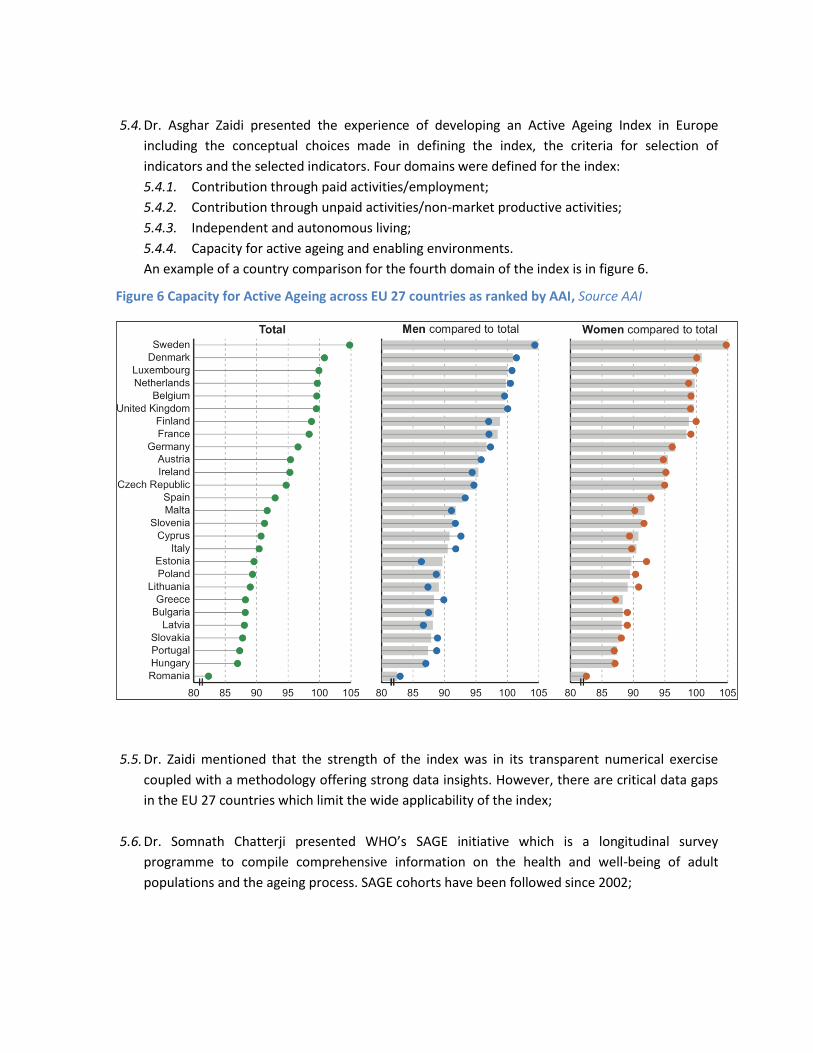
5.4. Dr. Asghar Zaidi presented the experience of developing an Active Ageing Index in Europe
including the conceptual choices made in defining the index, the criteria for selection of
indicators and the selected indicators. Four domains were defined for the index:
5.4.1. Contribution through paid activities/employment;
5.4.2. Contribution through unpaid activities/non-market productive activities;
5.4.3. Independent and autonomous living;
5.4.4. Capacity for active ageing and enabling environments.
An example of a country comparison for the fourth domain of the index is in figure 6.
5.5. Dr. Zaidi mentioned that the strength of the index was in its transparent numerical exercise
coupled with a methodology offering strong data insights. However, there are critical data gaps
in the EU 27 countries which limit the wide applicability of the index;
5.6. Dr. Somnath Chatterji presented WHO’s SAGE initiative which is a longitudinal survey
programme to compile comprehensive information on the health and well-being of adult
populations and the ageing process. SAGE cohorts have been followed since 2002;
Figure 6 Capacity for Active Ageing across EU 27 countries as ranked by AAI, Source AAI
5.7. Dr. Chatterji mentioned that the core SAGE collects data on respondents aged 18+ years, with
an emphasis on populations aged 50+ years, from nationally representative samples in six
countries (China, Ghana, India, Mexico, Russian Federation and South Africa);
5.8. In the plenary discussion that followed a number of observations and suggestions were made;
5.9. Key lessons learned from the various indicator projects are:
5.9.1. Importance of conceptual development before indicator selection (align with goals);
5.9.2. Control ambitions.
5.10. The way to get the collection of neighbourhood data right:
5.10.1. Obtain collected administrative data;
5.10.2. Power a small study and link to the administrative data;
5.10.3. Combining the above two steps can produce more reliable data.
5.11. Use administrative data which are relatively more sustainable than one-off survey data although
there are exceptions e.g. case of Manchester;
5.12. Some primary data collection efforts may be necessary, as this information may not exist in
administrative data systems;
5.13. Think of other opportunities that would allow collection of data – piggyback on existing efforts
e.g. WHO STEPS survey should be expanded to include older adults;
6. GROUP WORK 2: IDENTIFYING A PRELIMINARY LIST OF CORE INDICATORS
6.1. Three groups were created to focus on identifying core indicators from three domains each:
6.1.1. Group 1 focused on the domains of:
6.1.1.1. Outdoor spaces and building;
6.1.1.2. Transportation;
6.1.1.3. Housing;
6.1.2. Group 2 focused on the domains of:
6.1.2.1. Respect and social inclusion;
6.1.2.2. Civic participation and employment;
6.1.2.3. Social participation;
6.1.3. Group 3 focused on the domains of:
6.1.3.1. Community and health services;
6.1.3.2. Communication and information;
6.1.3.3. Health.

Indicator Valid? Aligns with goals?
Actionable?
Comment
Licensed drivers (ages 75 + years) N N Y Not desirable
Public transport use Y Y Y Not important
Proportion of residents age 65+ who travel every
day, once a week, once a month, or neverN N N
Average number of trips taken on public
transportation every day, once a week, once a
month by residents 65 years old or older
Y Y Y Note on 65 year cutoffSelf report (mostly)
Average number of times per week that
residents 65 years old or older report staying at
home because of lack of transportation
Y Y Y Self report
Proportion of residents 65 years or older that
require assistance from family members or other
individuals to access the following services:
pharmacy, grocery store, bank, etc.
N
Participation: There are public transportation options in the community that can accommodate people with mobility challenges, are reliable, and availability is congruent with the demand for service
Y Y Y A good start! Availability and adequacy.
6.2. In addition, all groups were requested to identify core indicators from the new domains of
“Economic Security” and “Governance”;
6.3. The groups were not asked specifically to address the two proposed to be merged domains
(“Respect and social inclusion” and “Social participation”). However, since the two domains
were addressed together this should not results in a loss of information from the exercise;
6.4. The “Health” domain identified during the review of ageing and health initiatives was including
together with the “Community and Health Services” domain;
6.5. All groups used the annex to the background document prepared for the meeting as a reference
for the list of indicators (175 indicators) to select from: “AFC Meeting - Complementary
Background Paper - Tables and Annex.docx”;
6.6. Figure 7 provides a sample of the various considerations that group members had to make when
discussing the selection of appropriate and core indicators:
6.7. For each domain the groups were expected to identify not more than five “core” indicators;
Figure 7 Sample table with key considerations in the selection of core indicators
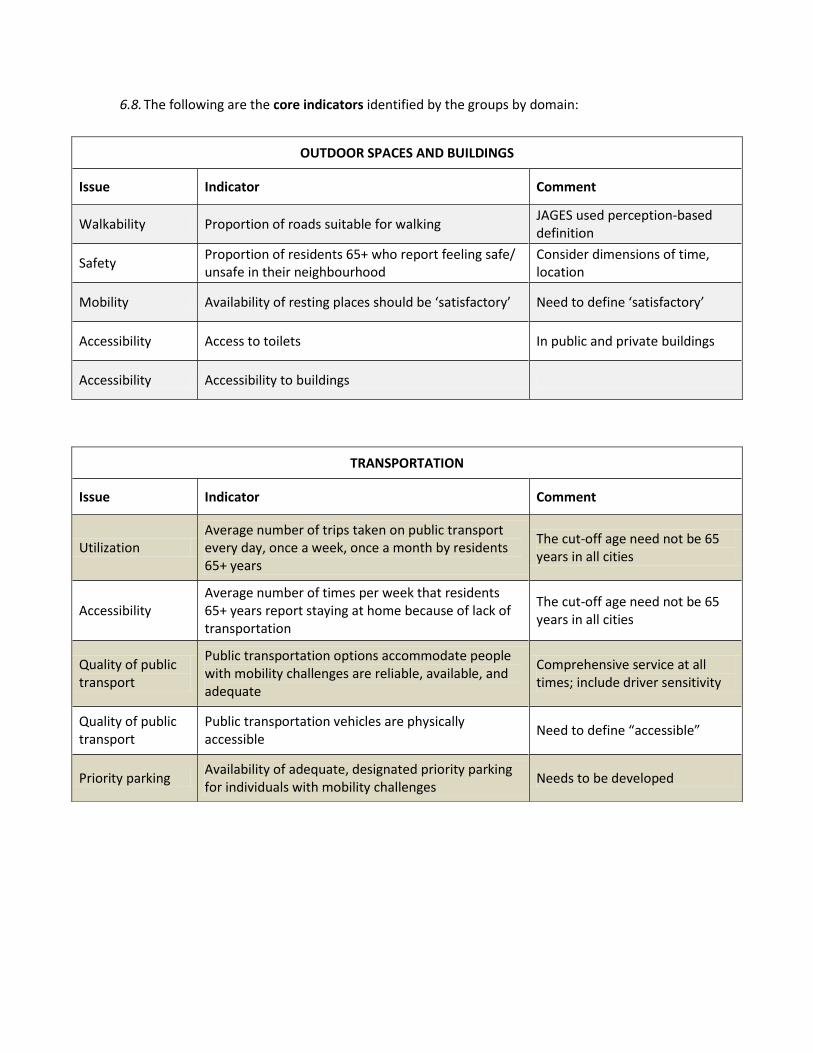
6.8. The following are the core indicators identified by the groups by domain:
OUTDOOR SPACES AND BUILDINGS
Issue Indicator Comment
Walkability Proportion of roads suitable for walking JAGES used perception-based definition
Safety Proportion of residents 65+ who report feeling safe/ unsafe in their neighbourhood
Consider dimensions of time, location
Mobility Availability of resting places should be ‘satisfactory’ Need to define ‘satisfactory’
Accessibility Access to toilets In public and private buildings
Accessibility Accessibility to buildings
TRANSPORTATION
Issue Indicator Comment
Utilization Average number of trips taken on public transport every day, once a week, once a month by residents 65+ years
The cut-off age need not be 65 years in all cities
Accessibility Average number of times per week that residents 65+ years report staying at home because of lack of transportation
The cut-off age need not be 65 years in all cities
Quality of public transport
Public transportation options accommodate people with mobility challenges are reliable, available, and adequate
Comprehensive service at all times; include driver sensitivity
Quality of public transport
Public transportation vehicles are physically accessible
Need to define “accessible”
Priority parking Availability of adequate, designated priority parking for individuals with mobility challenges
Needs to be developed
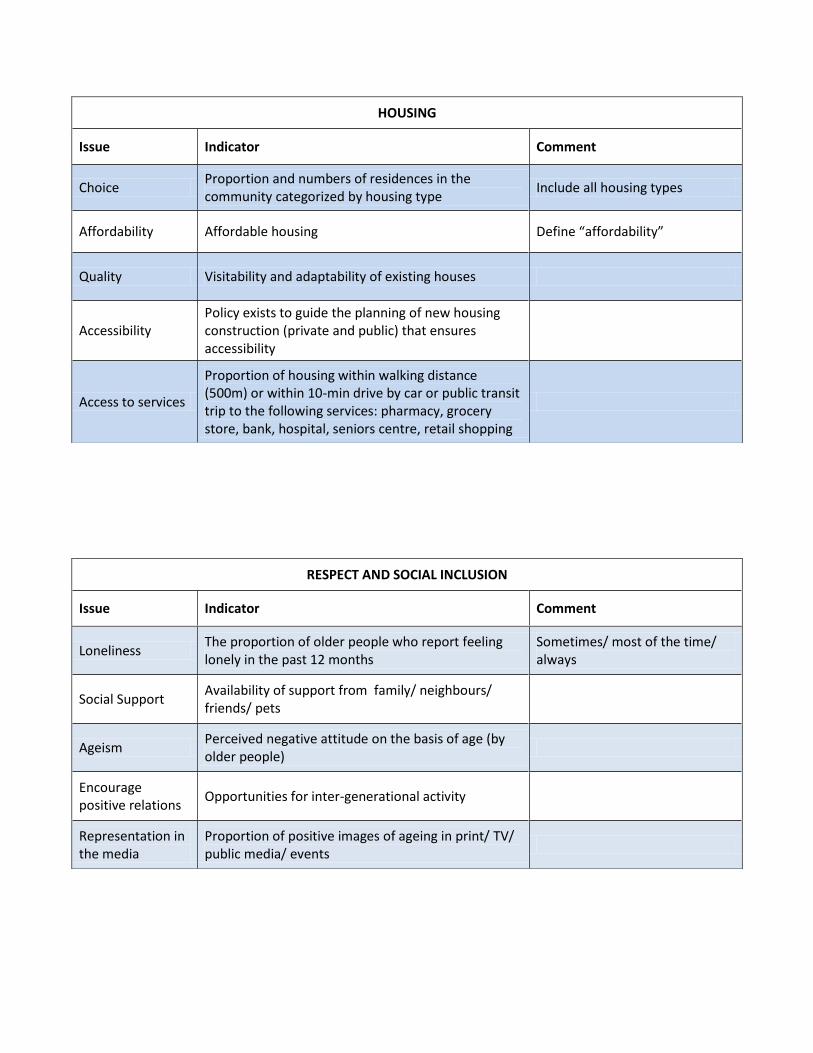
HOUSING
Issue Indicator Comment
Choice Proportion and numbers of residences in the community categorized by housing type
Include all housing types
Affordability Affordable housing Define “affordability”
Quality Visitability and adaptability of existing houses
Accessibility Policy exists to guide the planning of new housing construction (private and public) that ensures accessibility
Access to services
Proportion of housing within walking distance (500m) or within 10-min drive by car or public transit trip to the following services: pharmacy, grocery store, bank, hospital, seniors centre, retail shopping
RESPECT AND SOCIAL INCLUSION
Issue Indicator Comment
Loneliness The proportion of older people who report feeling lonely in the past 12 months
Sometimes/ most of the time/ always
Social Support Availability of support from family/ neighbours/ friends/ pets
Ageism Perceived negative attitude on the basis of age (by older people)
Encourage positive relations
Opportunities for inter-generational activity
Representation in the media
Proportion of positive images of ageing in print/ TV/ public media/ events
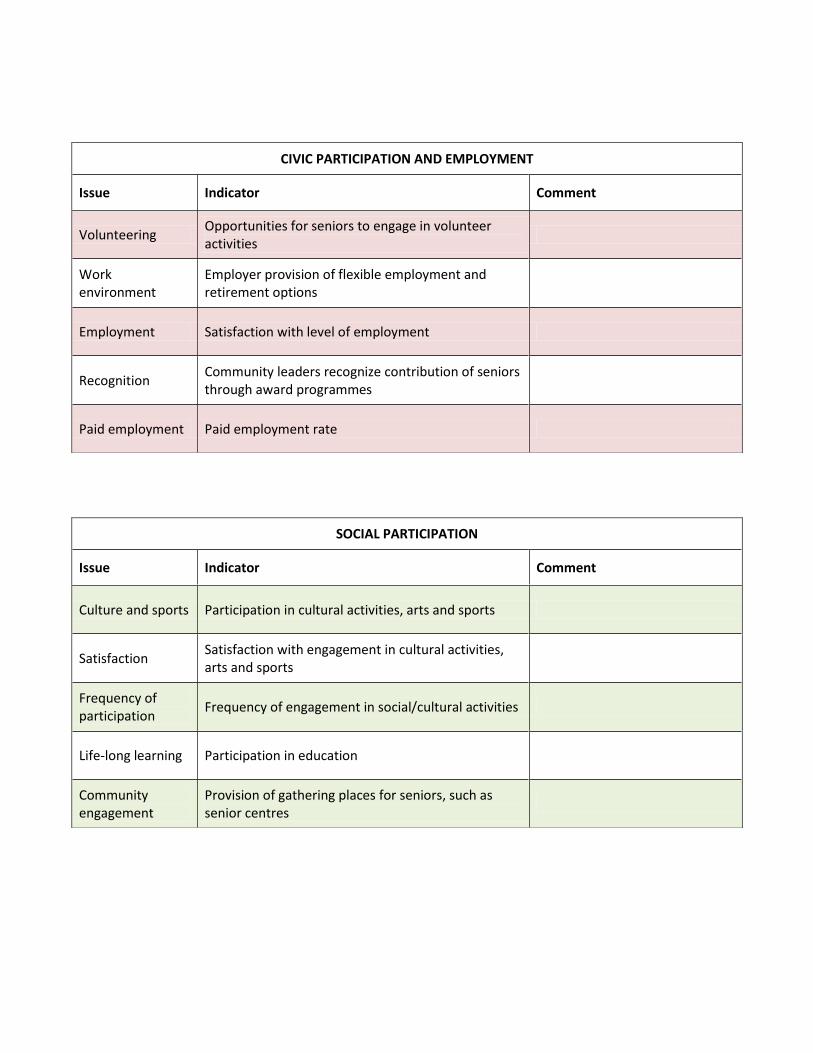
CIVIC PARTICIPATION AND EMPLOYMENT
Issue Indicator Comment
Volunteering Opportunities for seniors to engage in volunteer activities
Work environment
Employer provision of flexible employment and retirement options
Employment Satisfaction with level of employment
Recognition Community leaders recognize contribution of seniors through award programmes
Paid employment Paid employment rate
SOCIAL PARTICIPATION
Issue Indicator Comment
Culture and sports Participation in cultural activities, arts and sports
Satisfaction Satisfaction with engagement in cultural activities, arts and sports
Frequency of participation
Frequency of engagement in social/cultural activities
Life-long learning Participation in education
Community engagement
Provision of gathering places for seniors, such as senior centres
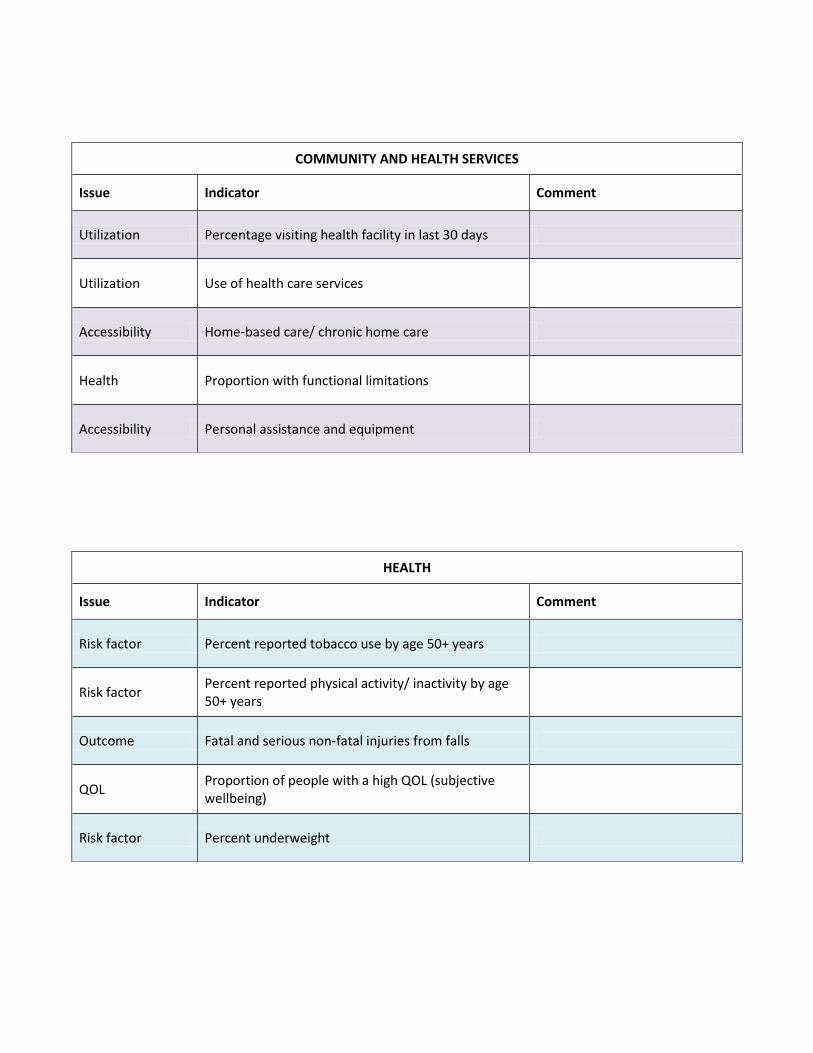
COMMUNITY AND HEALTH SERVICES
Issue Indicator Comment
Utilization Percentage visiting health facility in last 30 days
Utilization Use of health care services
Accessibility Home-based care/ chronic home care
Health Proportion with functional limitations
Accessibility Personal assistance and equipment
HEALTH
Issue Indicator Comment
Risk factor Percent reported tobacco use by age 50+ years
Risk factor Percent reported physical activity/ inactivity by age 50+ years
Outcome Fatal and serious non-fatal injuries from falls
QOL Proportion of people with a high QOL (subjective wellbeing)
Risk factor Percent underweight
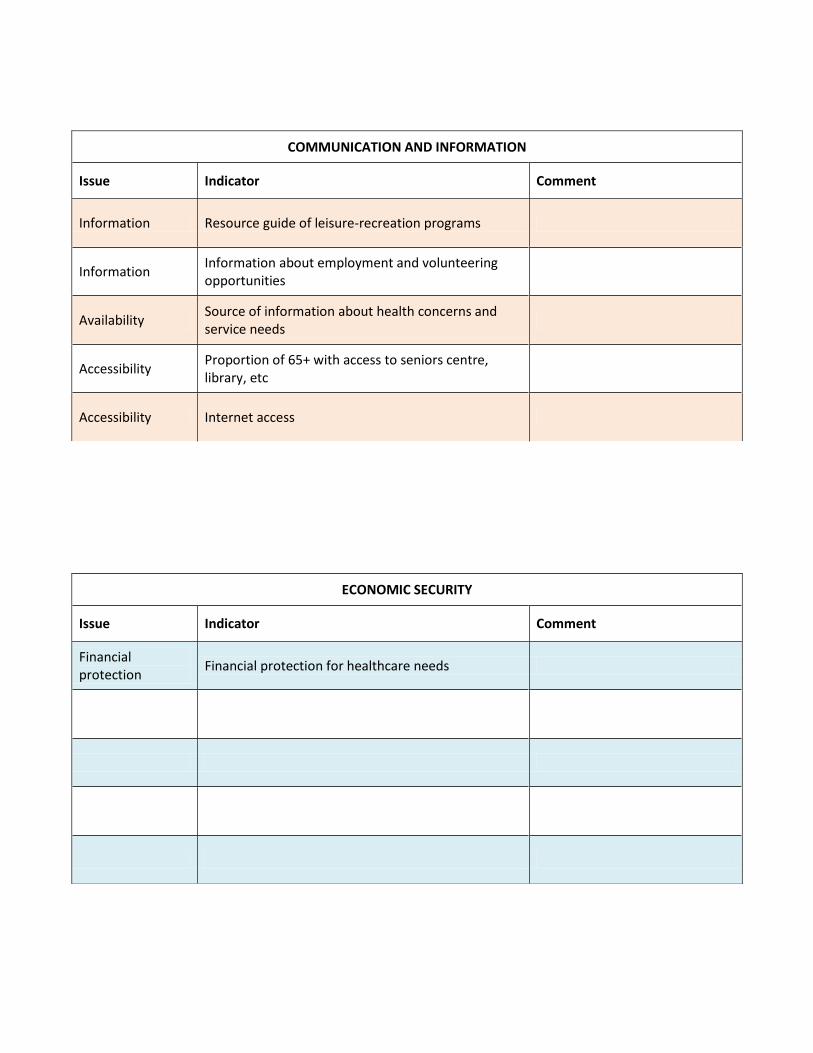
COMMUNICATION AND INFORMATION
Issue Indicator Comment
Information Resource guide of leisure-recreation programs
Information Information about employment and volunteering opportunities
Availability Source of information about health concerns and service needs
Accessibility Proportion of 65+ with access to seniors centre, library, etc
Accessibility Internet access
ECONOMIC SECURITY
Issue Indicator Comment
Financial protection
Financial protection for healthcare needs
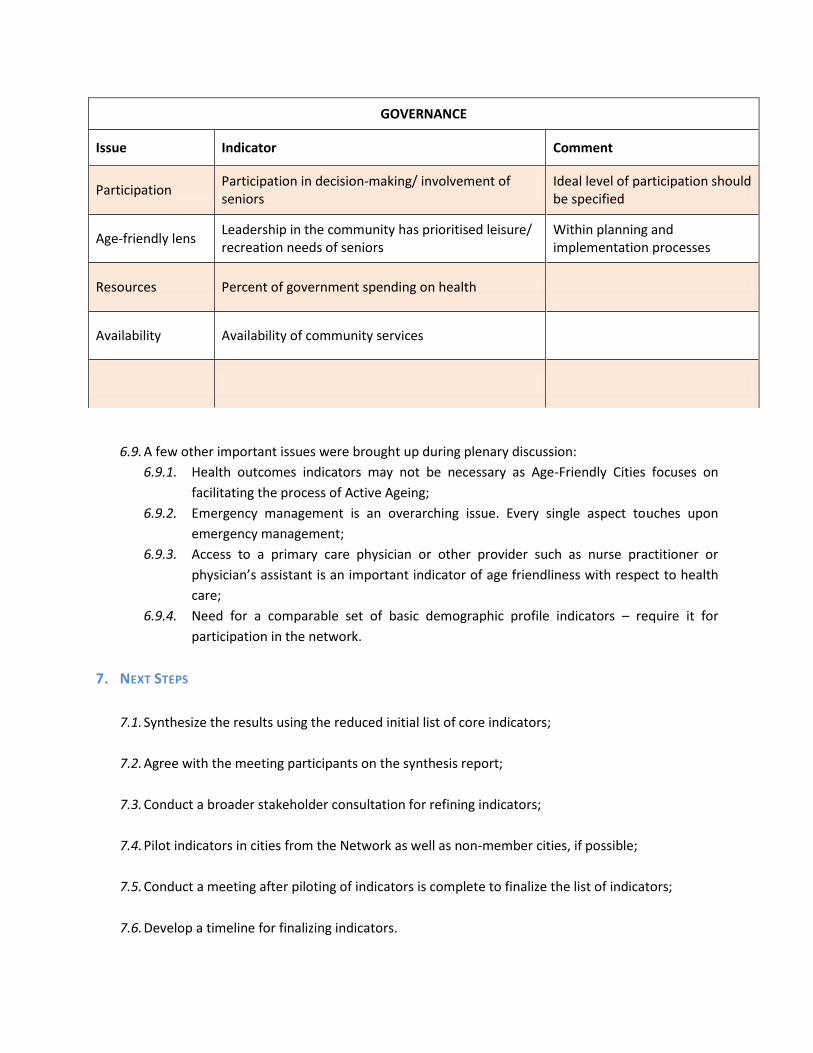
6.9. A few other important issues were brought up during plenary discussion:
6.9.1. Health outcomes indicators may not be necessary as Age-Friendly Cities focuses on
facilitating the process of Active Ageing;
6.9.2. Emergency management is an overarching issue. Every single aspect touches upon
emergency management;
6.9.3. Access to a primary care physician or other provider such as nurse practitioner or
physician’s assistant is an important indicator of age friendliness with respect to health
care;
6.9.4. Need for a comparable set of basic demographic profile indicators – require it for
participation in the network.
7. NEXT STEPS
7.1. Synthesize the results using the reduced initial list of core indicators;
7.2. Agree with the meeting participants on the synthesis report;
7.3. Conduct a broader stakeholder consultation for refining indicators;
7.4. Pilot indicators in cities from the Network as well as non-member cities, if possible;
7.5. Conduct a meeting after piloting of indicators is complete to finalize the list of indicators;
7.6. Develop a timeline for finalizing indicators.
GOVERNANCE
Issue Indicator Comment
Participation Participation in decision-making/ involvement of seniors
Ideal level of participation should be specified
Age-friendly lens Leadership in the community has prioritised leisure/ recreation needs of seniors
Within planning and implementation processes
Resources Percent of government spending on health
Availability Availability of community services
Annex
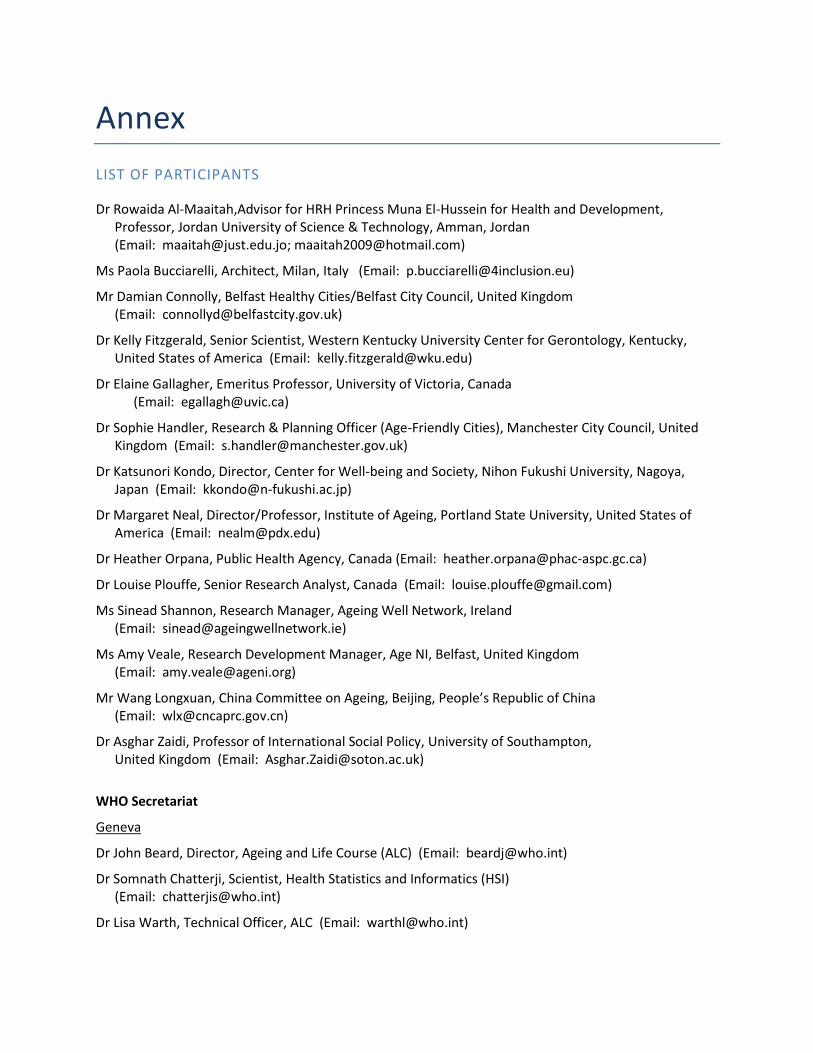
LIST OF PARTICIPANTS
Dr Rowaida Al-Maaitah,Advisor for HRH Princess Muna El-Hussein for Health and Development, Professor, Jordan University of Science & Technology, Amman, Jordan (Email: [email protected]; [email protected])
Ms Paola Bucciarelli, Architect, Milan, Italy (Email: [email protected])
Mr Damian Connolly, Belfast Healthy Cities/Belfast City Council, United Kingdom (Email: [email protected])
Dr Kelly Fitzgerald, Senior Scientist, Western Kentucky University Center for Gerontology, Kentucky, United States of America (Email: [email protected])
Dr Elaine Gallagher, Emeritus Professor, University of Victoria, Canada (Email: [email protected])
Dr Sophie Handler, Research & Planning Officer (Age-Friendly Cities), Manchester City Council, United Kingdom (Email: [email protected])
Dr Katsunori Kondo, Director, Center for Well-being and Society, Nihon Fukushi University, Nagoya, Japan (Email: [email protected])
Dr Margaret Neal, Director/Professor, Institute of Ageing, Portland State University, United States of America (Email: [email protected])
Dr Heather Orpana, Public Health Agency, Canada (Email: [email protected])
Dr Louise Plouffe, Senior Research Analyst, Canada (Email: [email protected])
Ms Sinead Shannon, Research Manager, Ageing Well Network, Ireland (Email: [email protected])
Ms Amy Veale, Research Development Manager, Age NI, Belfast, United Kingdom (Email: [email protected])
Mr Wang Longxuan, China Committee on Ageing, Beijing, People’s Republic of China (Email: [email protected])
Dr Asghar Zaidi, Professor of International Social Policy, University of Southampton, United Kingdom (Email: [email protected])
WHO Secretariat
Geneva
Dr John Beard, Director, Ageing and Life Course (ALC) (Email: [email protected])
Dr Somnath Chatterji, Scientist, Health Statistics and Informatics (HSI) (Email: [email protected])
Dr Lisa Warth, Technical Officer, ALC (Email: [email protected])
Regional Office for Europe, Copenhagen
Dr Manfred Huber, Coordinator, Healthy Ageing, Disability and Long-term Care (ADC) (Email: [email protected])
Regional Office for the Western Pacific, Manila
Dr Katrin Engelhardt, Technical Officer, Noncommunicable Diseases and Health Promotion (NHP) (Email: [email protected])
WHO Kobe Centre
Mr Amit Prasad, Technical Officer, Urban Health Metrics (UHM) (Email: [email protected])
Dr Megumi Kano, Technical Officer, UHM (Email: [email protected])
Top Related
