


Languages
Pages
Legal


Faculty of Science and Engineering Department of Petroleum Engineering
Evaluating Factors Controlling Damage and Productivity in Tight Gas Reservoirs
Hassan Bahrami
This thesis is presented for the degree of Doctorate of Philosophy
Of Curtin University of Technology
July 2012

2
Declaration
To the best of my knowledge and belief this thesis contains no material previously
published by any other person except where due acknowledgment has been made.
This thesis contains no material which has been accepted for the award of any other
degrees or diploma in any university.
Hassan Bahrami
Signature
Date
5‐Nov‐2012

3
Copyright
I warrant that I have obtained, where necessary, permission from the copyright
owners to use any third-party copyright material reproduced in the thesis (e.g.
questionnaires, artwork, unpublished letters), or to use any of my own published
work (e.g. journal articles) in which the copyright is held by another party (e.g.
publisher, co-author).
Hassan Bahrami
Signature:
Date: 5-Nov-2012
4
Abstract Production at economical rates from tight gas reservoirs in general is very
challenging not only due to the very low intrinsic permeability but also as a
consequence of several different forms of formation damage that can occur during
drilling, completion, stimulation, and production operations. The common strategies
used in tight gas reservoirs development are hydraulic fracturing and horizontal well
drilling. However in many cases of tight gas reservoirs, the key factors that control
well productivity and formation damage mechanisms are not well understood, since
it is challenging to characterise them in tight formations.
In this thesis I demonstrate how different well and reservoir parameters control well
productivity and damage mechanisms in tight gas reservoirs. Reservoir simulation
model for Whicher Range tight gas field is built and run. Analytical and numerical
simulation approaches are integrated with core flooding experiments and tight gas
field data analysis in order to characterize the key reservoir parameters and
understand the effects of different parameters on well productivity.
Using core flooding experiments data analysis, the relative permeability curves are
generated for Whicher Range tight gas reservoir, and quantitatively is shown how
the phase trapping damage can be reduced by use of oil based drilling fluid instead
of water based fluid. A new technique of welltest analysis was introduced for tight
gas reservoirs that can reduce uncertainties in estimation of average reservoir
permeability, and also a new correlation that can determine permeability of the
natural fractures in tight formations is proposed in this study. I study and analyse
different well completion, production and reservoir data from Whicher Range tight
gas field in order to identify why production rates are significantly lower than
expectations, and investigate possible remedial strategies to achieve viable gas
production rates.
Based on this research, drilling long horizontal deviated wells using non-aqueous
fluids in underbalanced conditions may be more efficient than hydraulic fracturing.
As the optimum strategy to further improve the well productivity, drilling the well
with a high deviation to intersect multiple sand lenses; orienting the wellbore
direction perpendicular to the maximum horizontal stress to intersect higher
permeability conduits and control wellbore instability issues; completing the well as
open-hole to have the advantage of enlarged wellbore caused by large wellbore

5
breakouts; running slotted liner to control wellbore collapse; open-hole perforation
in the direction of maximum horizontal stress to reach a deeper formation
penetration; and unloading the wellbore from drilling and fracturing fluids can help
achieve commercial gas production rates from tight gas reservoirs.

6
Contents
Preface........................................................................................................................ 11
1 Introduction to tight gas reservoirs .................................................................... 16
1.1 Tight gas reservoirs characteristics ................................................................ 16
1.2 Damage mechanisms in tight gas reservoirs .................................................. 18
1.3 Hydraulic fracturing in tight gas reservoirs ................................................... 21
1.4 Damage due to hydraulic fracturing............................................................... 22
1.5 Mitigating damage in tight gas reservoirs...................................................... 23
1.6 Summary ........................................................................................................ 24
2 Tight gas reservoirs characterisation for dynamic parameters........................... 25
2.1 Estimation average permeability of tight gas reservoirs ............................ 25
2.1.1 Field example: Welltest analysis in a West Australian tight gas well ... 27
2.2 Estimating the permeability of natural fractures........................................ 28
2.3 Determination of tight gas relative permeability curves ............................ 29
2.4 Formation testing in tight gas reservoirs.................................................... 31
2.5 Summary ........................................................................................................ 32
3 Tight gas reservoir simulation............................................................................ 33
3.1 Effect of damage mechanisms on well productivity .................................. 33
3.1.1 Damaged zone permeability and radius ................................................. 33
3.1.2 Phase trapping damage caused by water invasion ................................. 34
3.1.3 Effect of phase-trap damage on skin factor............................................ 36
3.1.4 Overbalanced and underbalanced drilling.............................................. 37
3.1.5 Phase trapping caused by oil based and water based drilling fluids ...... 38
3.1.6 Water blocking damage in hydraulically fractured wells ...................... 38
3.1.7 Damage to natural fractures ................................................................... 41
3.2 Effect of wellbore related parameters on well productivity....................... 41
3.2.1 Hydraulic fractures................................................................................. 41

7
3.2.2 Drilling direction and permeability anisotropy...................................... 42
3.2.3 Wellbore breakouts ................................................................................ 43
3.2.4 Perforation parameters ........................................................................... 44
3.2.5 Liquid loading in wellbore ..................................................................... 45
3.3 Effect of natural fractures parameters on welltest response....................... 46
3.4 Pressure measurement in tight gas reservoirs ............................................ 47
3.5 Summary .................................................................................................... 49
4 Tight gas field example: effect of damage mechanims on well productivity .... 50
4.1 Wellbore instability........................................................................................ 50
4.2 Perforation data .............................................................................................. 50
4.3 Hydraulic fractures......................................................................................... 52
4.4 Formation sensitivity to water invasion damage............................................ 52
4.5 Well production history (Pre-fracturing and post-fracturing)........................ 52
4.6 Formation damage caused by water and oil invasion .................................... 53
4.6.1 Damage caused by water invasion ......................................................... 54
4.6.2 Damage caused by oil invasion.............................................................. 54
4.6.3 Comparison of damage caused by water and oil.................................... 55
4.7 Well productivity evaluation in Whicher Range tight gas field..................... 55
4.8 Tight gas development strategy for optimized productivity .......................... 56
5 Conclusions........................................................................................................ 57
6 Nomenclatures.................................................................................................... 61
7 References .......................................................................................................... 63
8 Written Endorsements........................................................................................ 71
9 Appendices......................................................................................................... 73
8
List of Figures
Figure 1: Normal and sub-normal Swi in tight gas reservoirs ................................... 17
Figure 2: Typical sand lenses in tight gas reservoirs ................................................. 17
Figure 3: Reduced effective permeability due to phase trapping damage (Bennion et
al, 2006) ............................................................................................................. 19
Figure 4: Damage caused by water and oil phase trapping (Bennion et al, 2006).... 20
Figure 5: Effect of stress anisotropy on propagation of hydraulic fractures.............. 21
Figure 6: longitudinal and transverse hydraulic fractures in tight gas reservoirs ...... 22
Figure 7: Pressure build-up Log-Log diagnostic plot ................................................ 26
Figure 8: The diagnostic plot based on the 2nd derivative of transient pressure....... 27
Figure 9: Welltest analysis in the tight gas well ........................................................ 27
Figure 10: Core flooding facilities of Pet. Eng. Department in Curtin University .... 30
Figure 11: Brine production and pressure differential in the core flooding experiment
............................................................................................................................ 30
Figure 12: The relative permeability curves for the tight sand core sample.............. 31
Figure 13: Invaded zone parameters and the effect on flow efficiency ..................... 34
Figure 14: Water saturation in the model before water invasion ............................... 34
Figure 15: Water saturation in the model at the end of water injection period.......... 35
Figure 16: Water saturation in the model at the end of gas production period.......... 35
Figure 17: Effect of phase trap damage on skin factor .............................................. 36
Figure 18: Effect of wellbore pressure during drilling on phase trap damage........... 37
Figure 19: Effect of water and oil invasion damage on gas recovery........................ 38
Figure 20: Effect of initial water saturation on gas production rate .......................... 39
Figure 21: Effect of water invasion damage on gas production rate.......................... 39
Figure 22: Effect of water invasion on productivity of hydraulic fractured wells..... 40
Figure 23: Effect of damage to natural fractures on productivity.............................. 41
Figure 24: Productivity of hydraulic fractures: transverse versus longitudinal ......... 42
Figure 25: Effect of wellbore direction on well productivity .................................... 43
Figure 26: Effect of wellbore breakouts on well productivity ................................... 44
Figure 27: Effect of perforation tunnel length on flow efficiency ............................. 44
Figure 28: Effect of perforation tunnel length on flow efficiency ............................. 45
Figure 29: Simulation of liquid loading in wellbore (effect of gas production rate) . 45
Figure 30: Relationship between fracture parameters and welltest permeability ...... 46

9
Figure 31: Formation testing response in the case of no water invasion ................... 47
Figure 32: Effect of liquid invasion on formation testing response........................... 48
Figure 33: Effect of wellbore breakouts on perforation performance........................ 51
Figure 34: The tight gas well production comparison, before versus after hydraulic
fracturing............................................................................................................ 53

10
List of tables Table 1: Simulation results for injected water and recovered water.......................... 40
Table 2: Model predictions for perforation jet penetration and skin ......................... 51
Table 3: Details of the core samples characteristics .................................................. 54
Table 4: Core flooding experiment results for water invasion damage ..................... 54
Table 5: Core flooding experiment results for oil invasion damage.......................... 55
11
Preface The PhD study was started in July 2009, and several papers were reviewed on
different aspects of tight gas reservoirs. The objectives of this study were to review
and evaluate the factors that have significant influence on formation damage and
well productivity in tight gas reservoirs, such as effective permeability, relative
permeability, the degree of formation damage and skin factor. The work presented in
this thesis is the result of three years of field data analysis, reservoir simulation,
analytical derivation of equations, and analysis of laboratory experiments data in
order to generate new knowledge regarding tight gas reservoir characterization and
productivity evaluation.
To meet the study objectives, formation damage mechanisms and productivity issues
were reviewed, laboratory core flooding experiments were executed, core and field
data were analysed, and numerical simulation models for core scale, well scale and
reservoir scale were built using commercial reservoir simulation softwares. Data
from the Whicher Range tight gas field (SW Western Australia) including well
completion, stimulation, reservoir and production engineering data were also
reviewed, studied and analysed. The majority of the simulation works in this study
are based on Whicher Range field data.
In the early stage of the study, typical tight gas data were gathered from the reviewed
papers, and three basic conceptual models were built at core scale, well scale and
reservoir scale in order to simulate numerically different damage mechanisms and
their effect on well productivity. Then after gathering actual laboratory and field
data, the simulation models were updated in a series of trials to get more realistic
results.
Simulations were run using industry-standard software that have the advantage of a
high degree of validation in real-world situations. CMG-IMEX and ECLIPSE-100
black-oil reservoir simulators were used to numerically model damage mechanisms
and the effect on well productivity in tight gas reservoirs, KAPPA-Ecrin software
was used for analytical and numerical simulation of well production performance and
transient pressure data analysis, ANSIS-FLUENT was used to model wellbore
phenomena, Schlumberger SPAN 7.02 was used for perforation modelling, and the
SENDRA.2010 program was used to analyse core flooding data and determine the
relative permeability curves.

12
The core flooding experiments in this research study were performed using the lab
facilities of Petroleum Engineering Department at Curtin University, which have
been designed, developed and setup by Dr. Ali Saeedi (Saeedi, 2012). The
experiments were performed to generate a set of relative permeability curves for the
tight gas reservoir. In order to understand the damaging effects caused by different
fluid types as the invading liquid, the core flooding experiments were also executed
in the cases of water and synthetic oil invasion into the core sample.
The study brings new insights regarding tight gas reservoirs characterization for
dynamic parameters, and quantifies the phase trapping damage effect on tight gas
sand reservoirs productivity for different cases such as non-fractured and
hydraulically wells, under-balanced and over-balanced drilling, and invasion of
different fluids into the tight formation (water and oil). To the best of my
knowledge, phase trapping damage issues have mostly been discussed qualitatively
in the published papers to date, and a detailed level of study has not been presented
by the authors. The relative permeability and capillary pressure curves were
determined for Whicher Range tight gas reservoir using core flooding experiments
data analysis. Furthermore, a new method of welltest analysis for more reliable
estimation of the average reservoir permeability, a new correlation for estimating the
permeability of natural fractures in tight formations, and also the effect of in-situ
stresses, wellbore breakouts, perforation parameters and different hydraulic fractures
systems on well productivity are presented. A summary of my research over the first
two years of PhD studies was presented in the 2011 SPE European Formation
Damage Conference, and the published paper went on the list of top 10 downloaded
papers from the SPE e-library, which showed interest of the industry in results of the
tight gas damage and productivity evaluation study.
During the course of this research, several papers were published in peer-reviewed
journals, all of which were relevant to the work carried out in this research. Every
paper was peer-reviewed by at least two expert reviewers and their comments were
applied to improve this work. These papers cover most aspects of this research;
however some parts of the study have not been published yet, since the journal that
the papers were submitted to, have not responded yet. Consequently this Ph.D. thesis
is presented based on the published papers which are explained briefly in the body of
the thesis report and in more detailed in the appendices where the published papers
are presented. The sections that have not been published yet are explained in more

13
details in the thesis report. In the different chapters of the thesis report, the published
parts are explained briefly, and the papers are referred at the end of each section for
more details.
The following list provides the published papers:
1) Bahrami, H., Rezaee. R., Clennell, B., 2012. Water Blocking Damage in
Hydraulically Fractured Tight Sand Gas Reservoirs, An Example from Perth
Basin, Western Australia. Journal of Petroleum Science and Engineering
(Appendix A)
2) Bahrami H., Rezaee R., Hossain M, 2012. Characterizing Natural Fractures
Productivity in Tight Gas Reservoirs, Journal of Petroleum Exploration and
Production Technology (Appendix B)
3) Bahrami H., Jayan. V., Rezaee. R., Hossain, M.M., 2012. Welltest analysis of
hydraulically fractured tight gas reservoirs: An Example from Perth Basin,
Western Australia. APPEA Journal (Appendix C)
4) Bahrami H., Rezaee. R., Nazhat D., Ostojic J., 2011. Evaluation of damage
mechanisms and skin factor in tight gas reservoirs. APPEA Journal
(Appendix D)
5) Murickan G., Bahrami H., Rezaee R., Saeedi A., Mitchel P.A.T., 2012. Using
relative permeability curves to evaluate phase trapping damage caused by
water-based and oil-based drilling fluids in tight gas reservoirs. APPEA
Journal (Appendix E)
6) Ostojic, J., Rezaee, R., and Bahrami, H., 2011. Hydraulic fracture
productivity performance in tight gas sands – A Numerical Simulation
Approach. Journal of Petroleum Science and Engineering (Appendix F)
7) Bahrami H., Rezaee. R., Rasouli V., Hosseinian A., 2010. Liquid loading in
wellbore and its effect on well clean-up period and well productivity in tight
gas reservoirs, APPEA Journal, Brisbane, Australia (Appendix G)
Concerning the written thesis, Chapter 1 presents a brief introduction about the
problems associated with tight gas reservoirs and a review of past studies conducted
by other researchers. The objectives and significance of this research are outlined. In
Chapter 2, determination of the effective permeability of tight formations is
discussed and the new techniques are proposed. In Chapter 3, reservoir simulation
studies for different types of well and tight reservoirs are illustrated. In Chapter 4, the

14
tight gas field data are analysed and the well productivity issues in this field are made
clear. Finally, a summary of this work is presented in Chapter 5, followed by
conclusions and recommendations.
Acknowledgements
This work could have not been completed without the help and support of many
individuals during these three years. I would like to express my deep and sincere
gratitude to my supervisor Associate Professor Reza Rezaee for kindly supporting
me with his great experience and knowledge, offering invaluable assistance and
guidance throughout my studies, and providing a clear road map to complete my
thesis work. I am greatly thankful to Dr. Ben Clennell and Dr. Mofazzal Hossain and
Dr. Ali Saeedi for detailed and constructive technical guide, advices, help, and
valuable feedback that significantly improved quality of my PhD research studies. I
wish to give my sincere thanks to Professor Brian Evans, head of the Petroleum
Engineering Department at Curtin University, and Associate Professor Vamegh
Rasouli for their kind support regarding my PhD research studies and giving valuable
feedback about my progress. I wish to extend my warmest thanks to all my
colleagues and postgraduate students in the Petroleum Engineering Department who
have helped me with my work. I would like to thank KAPPA Engineering, Computer
Modelling Group of Canada, and Strategy Central for their generous support by
providing free licenses of their software to Curtin University’s Petroleum
Engineering Department.

15
To my beloved parents who always supported me in all stages of my life

16
1 Introduction to tight gas reservoirs
A tight gas sand (TGS) reservoir is generally characterized as a formation with
effective permeability less than 0.1 md (Law and Curtis, 2002). Tight gas sand
reservoirs are subject to different damage mechanisms during drilling, completion,
work-over and stimulation operations (Fairhurst et al, 2007). If damage in tight gas
reservoirs is not controlled, it causes the well productivity to be too low to have
economical production rates (Campbell, 2009). The typical tight gas reservoirs
produce mainly dry gas, and contain very low amounts of heavy components.
Economical development of tight gas reservoirs is challenging as they generally do
not naturally flow gas to surface at commercial rates. They must effectively be
stimulated by a large hydraulic fracture treatment and/or be produced from a
horizontal or multilateral wellbore that can intersect high permeability conduits of
the tight reservoir (Holditch, 2006; Meeks et al., 2006).
1.1 Tight gas reservoirs characteristics
The matrix permeability of tight formations may be very low due to the depositional
processes, or because of the post-depositional diagenetic events (Gonfalini, 2005). If
the tight gas reservoir is naturally fractured, then the gas flow is mainly controlled by
the open undamaged natural fractures that are connected to the wellbore (Teufel et al,
2004).
The rock matrix may primarily be composed of micro-pores where average pore
throat aperture is very small, causing tremendous amounts of potential capillary
pressure energy suction. In tight formations that are water-wet in nature, the capillary
forces cause liquid to be imbibed and held in the capillary pores. This causes the
critical water saturation and irreducible water saturation to be high in the tight
formations (Mahadevan et al, 2007; Bennion and Brent, 2005). Initial water
saturation (Swi) in tight gas reservoirs might vary depending on the timing of gas
migration. A tight gas reservoir may have normal initial water saturation (Swi ~ Swc)
1

17
or in some cases sub-normal (Swi << Swc) due to water phase vaporization into the
gas phase as shown in Figure 1. A sub-normal Swi provides relatively a higher
effective permeability for gas phase, close to absolute permeability. The initial water
saturation might also be more than critical water saturation if the hydrocarbon trap is
created during or after the gas migration time. In the case of high initial water
saturation, relative permeability to gas may be very low (Gonfalini, 2005, Bennion
and Thomas, 1996).
Figure 1: Normal and sub-normal Swi in tight gas reservoirs
The reservoir geometry of tight gas reservoirs depends on their deposition of
environment: they normally consist of numerous reservoir layers/lenses, which are
discontinuous both vertically and laterally in a thick complex sedimentary system,
and separated by non-reservoir shales. The stacks of isolated lenses of sand bodies
may vary in characteristics, shape and volume as shown in Figure 2 (Kantanong et al,
2012). The recoverable gas in place in tight gas reservoirs is mainly controlled by the
sand lens width, and the effect of sand lens length is not very significant (Bahrami et
al, 2012). Horizontal deviated well drilling can help intersecting as many of the sand
lenses as possible, and effectively increase lateral reservoir exposure to wellbore
(Holditch, 2006).
Figure 2: Typical sand lenses in tight gas reservoirs
In addition to the effect of reservoir dynamics and petrophysical characteristics, the
tight gas reservoirs productivity may also be affected by in-situ stresses as they can
control hydraulic fractures propagation, reservoir flow regimes, permeability
Rock
Water
Gas
Normal Swi Sub-normal Swi
Sand Shale

18
anisotropy, wellbore instability and long term production performance. Tight gas
sandstones are typically very stiff rocks capable of supporting high, or even extreme
deviatoric stresses. Therefore understanding of the relative magnitude of in-situ
stresses and their direction, and their relationship with permeability are essential for
tight gas development (Abass et al. 2007; Teufel et al. 1993). Tight gas reservoirs are
normally heterogeneous and anisotropic in nature, where permeability is a direction
dependent property. The permeability anisotropy may be further enhanced by the
pattern of earlier geological deformation and amplified by in-situ stresses (Dusseault,
1993), as the permeable conduits and natural fractures that are aligned with
maximum horizontal stress (perpendicular to the minimum stress direction) may
have larger aperture and greater permeability (Bahrami et al, 2010).
Tight formations commonly have wellbore instability issues during drilling, which
causes large wellbore breakouts and washouts across the tight sand intervals. The
wellbore instability issues in tight formations can be reduced by drilling the well in
the minimum stress direction (Jaeger et al. 2007).
The productivity of tight gas wells may also be controlled by perforation parameters.
Perforation performance depends on factors such as length of down-hole penetration,
shot phasing, and shot density. Deep penetration, at least 50% beyond the damage
thickness, is needed to effectively connect wellbore to undamaged rock. Perforation
efficiency in tight gas reservoirs is affected by the high rock strength that makes
penetration of perforation jet to be significantly reduced compared with an equivalent
sandstone of higher porosity. Using deep penetrating perforation charges run with
shock absorbers can mitigate damage to perforation tunnels and reduce the skin
factor (Behrmann, 2000).
Note: For detailed explanations regarding the tight gas reservoir characteristics and
productivity, Refer to my published papers presented in appendices A and D.
1.2 Damage mechanisms in tight gas reservoirs
Tight gas reservoirs can be subject to different damage mechanisms during well
drilling, completion, stimulation and fracturing, such as mechanical damage to
formation rock, plugging of natural fractures by invasion of mud solid particles,
permeability reduction around wellbore mainly as a result of filtrate invasion, clay
swelling and liquid phase trapping (Holditch, 1979). Materials such as mud filtrate,
19
cement slurry, or clay particles may enter the open pores of the formation and reduce
permeability around the wellbore as well (Abass and Ortiz, 2007). The solids may
penetrate only a short distance into the rock matrix and cause only a shallow
mechanically damaged zone. However the damage to natural fractures and open
permeable conduits can be severe, as drilling fluids invasion mostly occurs through
the natural fractures (Sharif, 2007; Araujo et al, 2005).
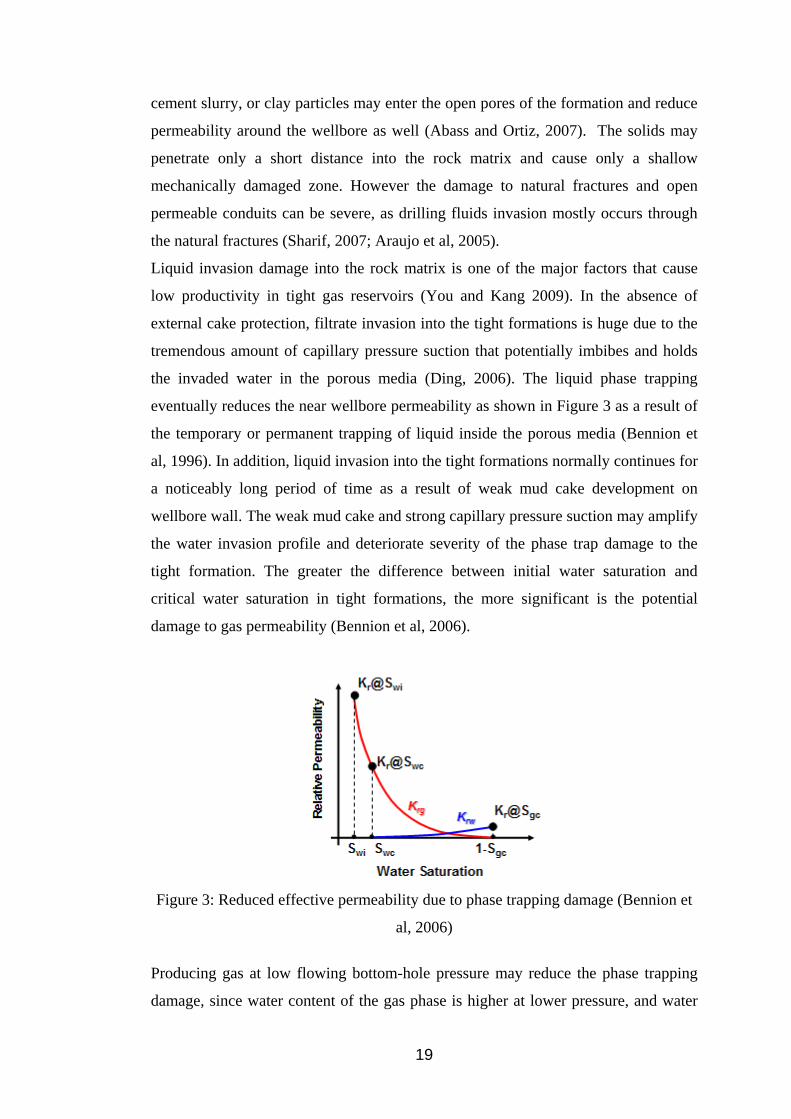
Liquid invasion damage into the rock matrix is one of the major factors that cause
low productivity in tight gas reservoirs (You and Kang 2009). In the absence of
external cake protection, filtrate invasion into the tight formations is huge due to the
tremendous amount of capillary pressure suction that potentially imbibes and holds
the invaded water in the porous media (Ding, 2006). The liquid phase trapping
eventually reduces the near wellbore permeability as shown in Figure 3 as a result of
the temporary or permanent trapping of liquid inside the porous media (Bennion et
al, 1996). In addition, liquid invasion into the tight formations normally continues for
a noticeably long period of time as a result of weak mud cake development on
wellbore wall. The weak mud cake and strong capillary pressure suction may amplify
the water invasion profile and deteriorate severity of the phase trap damage to the
tight formation. The greater the difference between initial water saturation and
critical water saturation in tight formations, the more significant is the potential
damage to gas permeability (Bennion et al, 2006).
Figure 3: Reduced effective permeability due to phase trapping damage (Bennion et
al, 2006)
Producing gas at low flowing bottom-hole pressure may reduce the phase trapping
damage, since water content of the gas phase is higher at lower pressure, and water

20
phase may partially be vaporized into the gas phase in the reduced pressure zone
around the wellbore (Lokken et al, 2008). However in the cases that are not truly dry
gas situation, producing with the large pressure drawdown may cause condensate
banking in the reservoir near the wellbore, if the flowing bottom-hole pressure drops
below the dew point pressure of the gas phase (Ravari et al, 2005).
Oil based fluids may be considered in some situations for low permeability gas
reservoirs. In the case of oil-based drilling fluid invasion, there is no external water
being introduced into the formation and the fluid saturations and wettability
remaining unchanged. However invasion of the oil filtrate into the tight formations
may result in introduction of an immiscible liquid hydrocarbon around wellbore,
causing entrapment of an additional third phase in the porous media. In the case of
oil-based fluids invasion into water wet gas reservoirs, the invaded oil may tend to
be trapped in the central portion of the pore space, rather than adhering tightly to the
matrix walls as the wetting phase. Although this central pore space occlusion can
cause substantial reductions in permeability, in some cases, the damaging effect in
overall is less than the case where water based system is used in the same
circumstances. Some types of oil may also dissolve in the gas and clean up after
some time. The relative permeability curves illustrated in Figure 4 show the reduced
effective permeability due to water invasion into the formation, compared with
damage to permeability caused by oil invasion. (Chi et al, 2004, Bennion et al.,
2006).
Figure 4: Damage caused by water and oil phase trapping (Bennion et al, 2006)
Note: For more detailed explanations regarding the damage mechanisms in tight gas
reservoirs, Refer to my published papers presented in appendices A, D and E.

21
1.3 Hydraulic fracturing in tight gas reservoirs
Hydraulic fracturing is performed to bypass the damaged zone and create larger
contact area between the wellbore and the permeable conduits in the reservoir. The
importance of hydraulic fracturing in tight gas sandstone reservoirs is well
documented and understanding the hydraulic fracture parameters is essential for
evaluation of the well production performance (Wang, 2008). Massive hydraulic
fractures in particular, can enhance the effective permeability around wellbore and
may connect the wellbore to the adjacent sand lenses that are not penetrated by the
well (Cipola and Mack, 2010).
Propagation and direction of hydraulic fractures in tight formations are mainly
controlled by in-situ stresses as shown in Figure 5. Where there is high contrast
between minimum and maximum horizontal stresses, the stimulation creates a
narrow or linear fracture fairway, and where the stress contrast is low, wide or
complex fracture geometry are created during the treatment (Fan et al, 2010).
Figure 5: Effect of stress anisotropy on propagation of hydraulic fractures
A common practice in unconventional gas reservoirs is to drill a horizontal well,
consider short perforation intervals, and then hydraulically fracture the formation in
multi-stages to create a treated zone around each hydraulic fracture (Bagherian et al,
2010). Considering a horizontal well in a normal faulting stress regime, the
hydraulic fracture might be different as illustrated in Figure 6. If the horizontal well
is drilled in the direction of maximum horizontal stress, the longitudinal hydraulic
fractures are likely to be initiated along the wellbore, and if the horizontal well is
drilled in the direction of minimum horizontal stress, then the transverse hydraulic
fractures are initiated perpendicular to the wellbore axis (Hossain and Rahman,
2008).

22
Figure 6: longitudinal and transverse hydraulic fractures in tight gas reservoirs
Note: For more detailed explanations regarding hydraulic fracturing in tight gas
reservoirs, Refer to my published papers presented in appendix F.
1.4 Damage due to hydraulic fracturing
Hydraulic fracturing in some cases may not improve well productivity in tight gas
reservoirs, or the productivity may increase only temporarily. During the stimulation
and fracturing in tight gas reservoirs, fracturing liquids invade the reservoir and may
create a bank of fracturing agent around the hydraulic fracture wings, which can
develop negative effects on the long term production performance of the well (Wang
and Holditch, 2008). Low productivity of a hydraulically fractured well might be due
to the existence of damage mechanisms associated with liquid phase trapping in rock
pores next to the fractures (Mahadevan, 2007). The tight formations with sub-normal
initial water saturation are significantly more sensitive to damage caused by water
phase trapping, and therefore water blocking may plague the success of hydraulic
fracturing in low permeability gas reservoirs with this characteristic. The injected
fluid during hydraulic fracturing should be compatible with formation to avoid clay
swelling (Bennion and Brent, 2005). In the case of naturally fractured reservoirs, the
fracturing fluids may transport the damaging solids through the natural fractures into
deeper parts of the reservoir and further reduce the well productivity (Rodgerson,
2000).
Use of polymer gels with hydraulic fracturing fluid may control the invasion of
fracturing liquid and fluid loss into the tight formation, as the polymer is deposited
on fracture faces, and cause very short distance penetration of the unbroken polymer
Longitudinal fracture
Transverse fractures
23
gel into the reservoir rock. However this can make the fracturing fluid to be highly
viscous, which may result in plugging as well as damaging of the hydraulic fractures
face, dramatically lessen the effective length and width of the hydraulic fractures,
and restrict the return of fluids during clean-up and gas production period (Raible
and Gall, 1985). The damage inside the fractures may also be due to proppant
crushing, embedding, or fracture plugging with chemicals and polymers. The
polymer may become a highly concentrated gel, and if it is left in the fractures, the
gel damage can be the reason for ineffective clean-up and short effective fracture
length. The polymer plugging can be reduced if suitable breakers are used, but this
breaker must be able to be activated deep within the fractures (Wand and Holditch,
2008).
In tight gas reservoirs that are sensitive to water invasion damage, hydraulic
fracturing may fail to produce gas at commercial rates as it causes excessive liquid
leak off into the tight formation. The preferred option in tight gas reservoirs might be
horizontal well drilling in underbalanced conditions (Veeken et al, 2007).
In hydraulic fracturing, additional production difficulties may also be experienced on
the downstream side of the formation interface. These problems include proppant
back-production that causes erosion of surface facilities (Abbas 2009). Also in the
case of significant liquid leak-off and fluid loss into the tight formation during
fracturing, the post-fracturing gas production and the well productivity may be
affected by loading of the fracturing liquid in wellbore that cannot be lifted to surface
by the natural gas flow (Salim and Lee, 2009).
Note: For more detailed explanations regarding hydraulic fracturing in tight gas
reservoirs, Refer to my published papers presented in appendix A. Regarding the
effect of liquid loading in wellbore on well productivity, Refer to Appendix G.
1.5 Mitigating damage in tight gas reservoirs
The damage mechanisms in tight gas reservoirs are controlled by pore system
geometry, interfacial tension between the invading trapped fluid and the produced (or
injected) reservoir fluid, capillary pressure, relative permeability, wettability, fluid
saturation levels, depth of invading fluid penetration, reservoir temperature, reservoir
pressure and well bottom-hole flowing pressure. With most of the phase trapping
problems, prevention is generally more effective than remediation from an economic
24
perspective. Removing damage is more common in the industry although it may be
more problematic and certainly more costly (Ding, 2006, Bennion et al, 2006).
The damage due to liquid invasion and clay swelling can be minimized by properly
choice of the base fluid for drilling and fracturing treatments, and reducing
overbalance pressure during drilling and completion. Improving drilling or fracturing
fluid rheology and filter cake building ability, which can provide an effective cake
that is later removable can help control the damaged zone depth and reduce the
damage due to liquid invasion. Reducing interfacial tension (IFT) between the
trapped injected fluid and the reservoir fluid using IFT reducing agents such as
methanol and liquid phase carbon dioxide can help more efficient recovery of the
trapped phase from the invaded zone. Adding methanol in the fracturing fluid can
reduce the water block as it helps faster clean-up and drying of water from the
invaded zone (Bazin, 2009, Motealleh, 2009).
Using hydrocarbon-based drilling fluid in designing a drilling fluid can result in
minimal phase trap potential, as it can avoid clay swelling. In addition, interfacial
tension that directly affects capillary pressure and retention, it is significantly less
between oil-gas is less compared with gas-water, and can result in reduced phase
trapping damage. Down-hole heating is another method that can remove aqueous
phase traps as well as thermally decomposing potentially reactive swelling clays. The
water phase trapping may also be removed by injection of dehydrated dry gas into
the formation to initiate conduits of higher gas permeability through the damaged
zone (Bennion et al, 2006, Jamaluddin et al, 1998).
1.6 Summary
Based on this literature review, it is evident that there are many factors that that can
influence the production performance of tight gas reservoir. Understanding the
effects can be paramount for successful development and exploitation of tight gas
reservoir. This chapter reviewed the different factors that control damage mechanism
and well productivity, and the optimum strategies for tight gas reservoirs were
discussed.

25
2 Tight gas reservoirs characterisation for
dynamic parameters
Tight gas reservoirs might be very different in term of reservoir characteristics, and
it is challenging to adequately determine the reservoir dynamics parameters such as
the effective permeability of matrix and natural fractures, relative permeability, skin
factor, hydraulic fractures size and conductivity and fluid gradients in the reservoir.
Similar to the conventional gas reservoirs, the reservoir characterization tools such
as well testing, logging, core analysis and formation testing are commonly used and
run in tight gas reservoirs. However due to the tight formations complexity,
heterogeneity and very low permeability, use of the acquired data to obtain
meaningful results may not be well understood in term of determining the well and
reservoir parameters and predicting the well production performance. Especially, the
time scales involved, and the ratios between wellbore storage, skin and intrinsic
reservoir parameters may be very different in tight gas sands compared with
conventional reservoirs (Gonfalini, 2005; Mahadik et al, 2012).
2.1 Estimation average permeability of tight gas reservoirs
Reservoir permeability can be estimated by analyzing the pressure transient data
acquired during well testing. The conventional method of welltest analysis is to use
the plot of transient pressure (P) and its derivative (P’: -d[P]/d[Log((tp+t)/t)])
versus time function on Log-Log scale to identify radial flow regime and determine
the slope of Horner plot straight line (m) as shown in Figure 7, in order to calculate
the reservoir permeability (Kappa Engineering, 2011). In pressure transient tests,
different flow regimes might be observed on the pressure derivative curve: the slope
of +1 shows wellbore storage effect, the slopes of -0.5, +0.5, +0.25 and +0.36
indicate spherical, linear, bi-linear and elliptical flow regimes respectively, and the
slope of zero indicates radial flow regime. Diagnosis of the radial flow regime is
critical in quantitative welltest interpretation, since reliable estimation of reservoir
permeability and skin factor can be performed when late-time radial flow regime is
established in the reservoir (Badazhkov, 2008; Bourdarot, 1998).
2

26
Figure 7: Pressure build-up Log-Log diagnostic plot
The early portion of welltest data during pressure build-up tests is normally affected
by wellbore storage and skin factor. In tight gas reservoirs, the low permeability
slows down the reservoir response to the pressure disturbance during transient
testing, which causes the wellbore storage effect to be significantly long (Garcia et
al, 2006). In addition, the need for hydraulic fracturing to obtain commercial flow
rates in tight gas reservoirs adds to the complexity of the problem and makes analysis
of the pressure transient data more difficult. Field observations in a large number of
tight gas wells have also shown a long-term linear flow behaviour due to the very
low reservoir permeability, hydraulic fractures and natural fractures, permeability
anisotropy, and reservoir geometry (Restrepo, 2009; Arevalo et al, 2001). As a result,
tight gas reservoirs typically require a relatively long pressure build-up testing time
to reach the late time pseudo radial flow regime, which is often not practical.
Therefore, welltest analysis using the conventional techniques may fail to provide
reliable results.
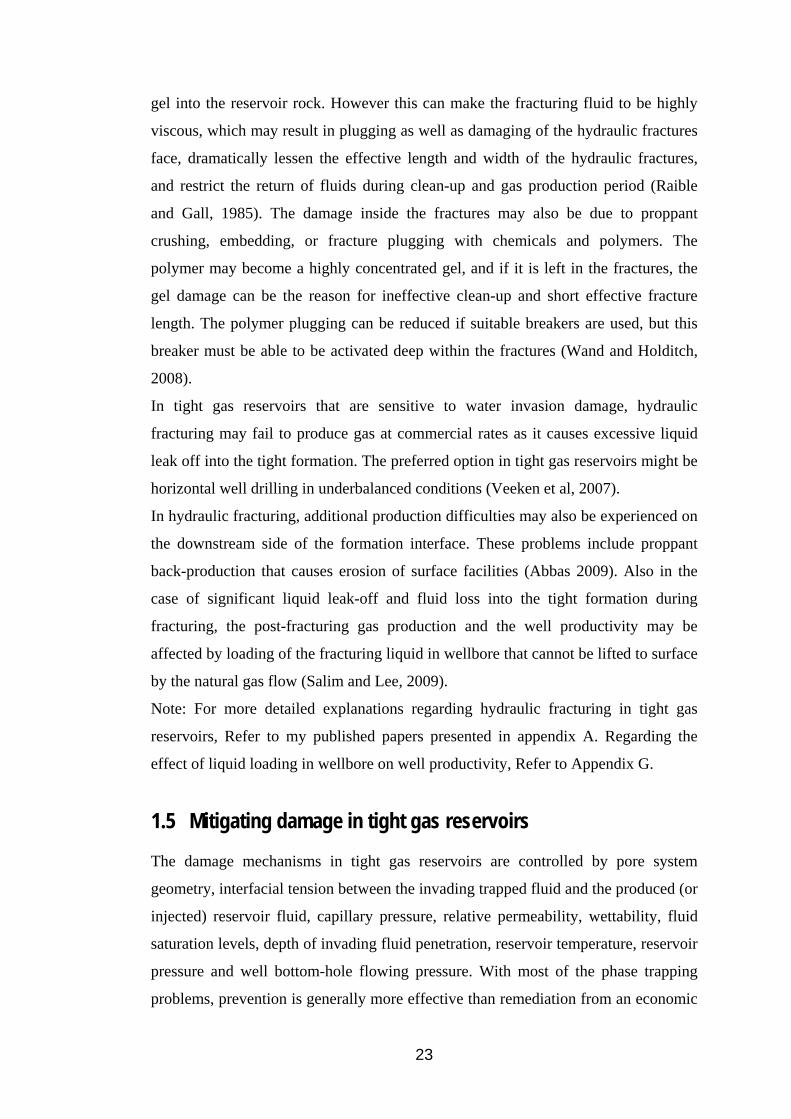
In order to reduce the uncertainties, a new method is introduced for welltest analysis
based on taking the second derivative of transient pressure with respect to the
logarithm of time function, that is defined as P’’: -d2[P]/d[Log((tp+t)/t)]2.
Compared with the first derivative, the advantage of the second derivative of
transient pressure as shown in Figure 8 is that its intercept is certain (zero) and
therefore the second derivative curve trend might be predictable. The second
derivative of transient pressure versus time function on Semi-Log plot can validate
the existence of the radial-flow regime on a first derivative chart, when there is
uncertainty in radial flow regime identification using the standard diagnostic plots.
Non-fractured well Hydraulically fractured well
27
Figure 8: The diagnostic plot based on the 2nd derivative of transient pressure
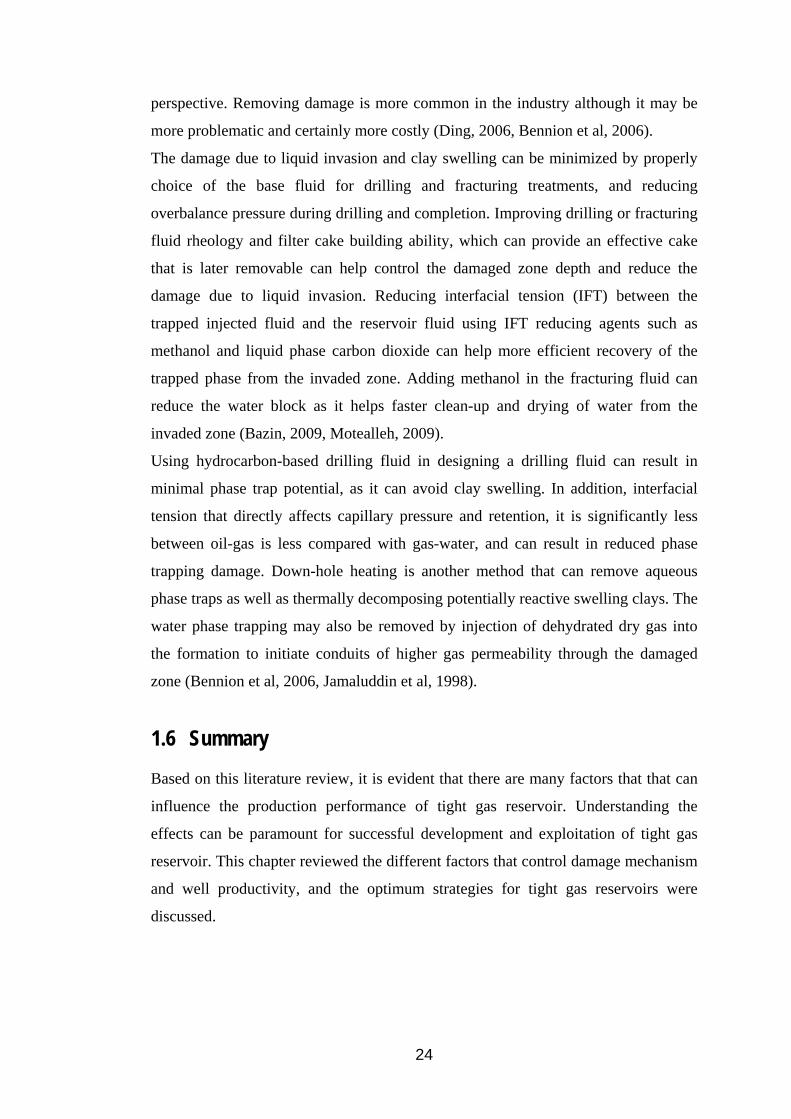
2.1.1 Field example: Welltest analysis in a West Australian tight gas well
Pressure build-up test in a hydraulically fractured vertical well (longitudinal fracture)
in the West Australian tight gas reservoir is analysed in order to estimate reservoir
permeability and evaluate the well productivity. However, the test duration was not
long enough in this test, and analysis of the welltest data may have uncertainties.
To have reliable welltest analysis results, the second derivative of transient pressure
is used (Bahrami and Siavoshi, 2005). Using the welltest analysis shown in Figure 9,
the value of pressure derivative in radial flow region is estimated as 3.7E+8 psi2/cp,
which corresponds to permeability of 0.006 mD, skin of -4.3. Using the K and S
values, by matching the pressure and the first pressure derivative curves on the
standard Log-Log diagnostic plot, it resulted in fracture half length size of 55 ft.
Figure 9: Welltest analysis in the tight gas well
Non-fractured well Hydraulically fractured well

28
Note: For details of the method using the second derivative of transient pressure,
equations derivation, reservoir flow regimes in hydraulically fractured wells, a
workflow for welltest analysis in tight gas wells, and verification of the methodology
and its reliability, refer to my published paper presented in Appendix C.
2.2 Estimating the permeability of natural fractures
Natural fractures may contribute the most to total gas production from tight gas
reservoirs, and identification of their characteristics is essential for well production
performance evaluations. The basic dynamic characteristics of the natural fractures
are fracture storativity and interporosity flow coefficient, which can be estimated
from welltest analysis. Then using the parameters, natural fractures permeability can
be estimated as follows (Tiab et al, 2006):
2w
mf r
KK
[2-1]
Where Km is matrix permeability, Kf is fracture permeability, rw is wellbore
radius, is shape factor, and is interporosity flow coefficient. The shape factor can
be estimated from image log fracture spacing, matrix permeability can be estimated
from core analysis, and the interporosity flow coefficient can be estimated from
welltest analysis if dual-porosity, dual-permeability response is clearly observed on
pressure build-up diagnostic plots (Racht, 1982).
However in tight gas reservoirs, due to the long wellbore storage effect and also the
tightness and heterogeneity of the reservoir rock, pressure build-up diagnostic plots
may not be able to show the dual porosity dual permeability response. Hence,
estimating the interporosity flow coefficient and fracture permeability from such
welltest data might not be feasible, and the conventional approaches might fail to
characterize the fracture parameters in tight gas reservoirs.
To be able to estimate permeability of natural fractures for tight gas reservoirs, a new
method is introduced based on Kazemi model that assumes parallel layers of matrix
and fracture in a uniform fracture network model (Racht, 1982), averaging reservoir
permeability based on thickness of matrix and fracture layers (Bourdarot, 1998), and
applying some correction factors. The proposed simplified equation to determine the
natural fractures permeability is as follows:

29
2)(**1C
f
fwelltestf b
aKCK [2-2]
Where Kwelltest is welltest permeability, bf is average fracture aperture, af is average
fracture spacing, and C1 and C2 are the correction factors. For a tight gas reservoir,
average permeability can be estimated from welltest analysis, fracture spacing and
fracture aperture can be approximated from image log processing, and the constants
C1 and C2 can be determined from reservoir simulation and sensitivity analysis.
Note: For more details regarding natural fractures characterization, the equations
derivation, the assumptions that were used, a field example on typical natural
fractures parameters, determining the input parameters that are required for fracture
permeability estimation using Equation 2-2, and also the verification of the
methodology and its accuracy, refer to the published paper presented in Appendix B.
2.3 Determination of tight gas relative permeability curves
The major damage mechanisms in tight gas reservoirs such as phase trapping are
found to be associated with relative permeability and capillary pressure curves. The
damaging effects are reflected on gas and water relative permeability curves
(Bennion et al, 2006).
The relative permeability data for tight gas sands are extremely difficult to obtain by
the conventional steady state flow analysis technique as it requires impractically very
long stabilization time and flow rates are usually small (Ning and Holditch, 1990). In
this study, however, an unsteady state flow analysis technique is applied to a core
flooding experiment, in which the tight core samples are fully saturated with water
(initial water saturation of 100% for primary drainage), and then gas-flooded at
constant volumetric flow rate to reach irreducible water saturation. During the core
flooding experiment, the pressure differential across the core sample and volume of
the produced water are recorded. The details of the technique and the experimental
procedures are published and available (Saeedi, 2012).
The core flooding experiments were performed using the lab facilities of the
Department of Petroleum Engineering at Curtin University, as shown in Figure 10.
Different core samples in Whicher Range tight gas field were studied, and the best
quality core (effective permeability of 0.035 md and porosity of 9.6%) was selected
and prepared for the core flooding experiment.

30
Figure 10: Core flooding facilities of Pet. Eng. Department in Curtin University
The core flooding experiment provided the data related to water production and
differential pressure across the core sample. The experimental core flood data were
used in the commercial core flooding data analysis software SENDRA, in order to
generate relative permeability curves by matching the core flood data for brine
production and pressure differential data as shown in Figure 11.
Figure 11: Brine production and pressure differential in the core flooding experiment
The SENDRA analysis results based on the history matching resulted in the
following relative permeability curves as shown in Figure 12, which indicate relative
permeability to water is significantly lower compared with relative permeability to
gas (typical behaviour in water sensitive formations). The core flooding experiment
also indicated the irreducible water saturation of 60%. For the core sample, air-

31
mercury capillary pressure data were also provided, which then using some
conversion factors, the gas-water capillary pressure data could be determined.
Figure 12: The relative permeability curves for the tight sand core sample
For oil-gas system, the core flooding data that are required for determination of gas-
oil relative permeability were not possible to determine due to some limitations in the
laboratory facilities when oil is used as liquid phase. Therefore typical published oil-
gas relative permeability data had to be considered in the reservoir simulation studies
related to oil-gas system (Ravari et al, 2005).
Note: For more details regarding the petrophysical characterises of the core sample
that was used in the core flooding experiments, the typical relative permeability data
for water-oil and gas-oil, Refer to my published papers presented in Appendices A
and E.
2.4 Formation testing in tight gas reservoirs
A formation test is used to measure the pressure of a formation, pressure gradient,
and gas water contact. To measure pressure of reservoir at each depth, the tool inserts
a probe into the borehole wall to performs a mini pressure drawdown and build-up
by withdrawing a small amount of formation fluid, and then waiting for the pressure
to build up to the formation pore pressure at that depth. Formation testers measure
the pressure of the continuous phase in the invaded region, which is the pressure of
the drilling fluid filtrate. Using the pressure measurements at different depths,
gradient of pressure in the reservoir is determined, which can indicate reservoir fluid
type and water-hydrocarbon contact (Schlumberger formation testing, 2005).

32
In tight gas reservoirs, formation testing is challenging due to tightness of the
reservoir rock, weak mud cake across the wellbore, and presence of large wellbore
breakouts across the tight sand intervals. Although using advanced formation testing
tools may help improve reservoir characterization of tight gas reservoirs (Schrooten,
2007), formation testing results in tight formations may still have some uncertainties.
In good permeability zones, formation tests are effective and normal. However in the
case of low reservoir permeability, the mud cake is often ineffective in preventing
filtrate invasion, thus causing the measured pressure to be affected by wellbore
pressure that might be higher than the actual formation pressure (supercharging
effect). In testing of a very tight formation, even a large pressure drawdown may
result in no flow from the reservoir (dry test). Tight gas reservoirs are often
associated with bad-hole conditions (large wellbore breakouts) causing lost seals
around the tool packer and failure during testing of the formation (Schlumberger
formation testing, 2005). The formation testing measurements may also be
influenced by the effects of capillary pressure in the case of liquid invasion into a gas
bearing zone. As a result, the measured pressure might be different to the true
formation pressure (Elshahavi et al, 1999; Andrews et al, 2012).
2.5 Summary
The tight gas reservoirs dynamic parameters such as relative permeability, reservoir
average permeability, and natural fractures permeability are the key factors that
control production performance of tight gas wells. This section presented a new
method of welltest analysis for more reliable estimation of the average reservoir
permeability and a new correlation for estimating the permeability of natural
fractures in tight formations. The relative permeability and capillary pressure curves
for Whicher Range tight gas reservoir were also determined.
33
3 Tight gas reservoir simulation
Analytical and numerical simulation studies are performed to have a qualitative
understanding of damage mechanisms associated with production from non-fractured
and hydraulically fractured tight gas reservoirs; and evaluate its potential impact on
well productivity.
In building tight gas reservoirs simulation model, it is important to use a consistent
set of field data in order to get meaningful simulation outputs. Based on the West
Australian tight gas field data, the simulation models are built at reservoir scale and
core scale.
Note: The detailed information about the core and reservoir scale simulation models,
including the input data and 3-D views of the models, are presented in Appendices
A, D and E.
3.1 Effect of damage mechanisms on well productivity
Reservoir simulation is used to understand how damage mechanisms are controlled
by the well and reservoir parameters such as reservoir permeability, permeability of
the damaged zone, radius of the damaged zone, drilling fluid type, capillary pressure
and relative permeability curves.
In this section, the effects of different parameters on damage and skin factor are
studied using the reservoir simulation models. To evaluate the damage effects, the
term flow efficiency (FE) is used in some of the cases, which is defined as the ratio
of the pressure drop across the model in the case of zero skin virgin homogeneous
rock; to the pressure drop in the case of perforated and/or damaged rock (FE equals
to 1 in the case that there is no damage introduced to a non-perforated model).
3.1.1 Damaged zone permeability and radius
The simulation model is run for conventional and tight cores, with damaged zone
permeability of Kd and damaged zone radius of rd. The model results are shown in
3

34
Figure 13. According to the results, the effect of damaged zone permeability and
damaged zone radius on flow efficiency is more significant in tight gas reservoirs
compared with conventional cores, indicating the importance of damage control in
tight gas reservoirs.
Figure 13: Invaded zone parameters and the effect on flow efficiency
Note: Refer to the APPEA paper presented in appendix C for details of the
simulation works including modelling and analysis.
3.1.2 Phase trapping damage caused by water invasion
The effect of water invasion in the reservoir model is evaluated by injecting water at
the well location, followed by gas production. The water saturation in the reservoir
model at initial conditions (top view) is shown in Figure 14 (Swi=0.6).
Figure 14: Water saturation in the model before water invasion
Sw X Y
100 ft
100 ft

35
First, water is injected at the well location, which increases water saturation around
the wellbore. Water saturation at the end of the injection period is shown in Figure
15 (equivalent radius of water invaded zone: 9 ft). Afterwards, the model is put on
gas production to clean-up the invading water, and reduce water saturation around
the wellbore. Water saturation at the end of the gas production period is shown in
Figure 16 (equivalent radius of water invaded zone: 12 ft). The results indicate
during the gas production phase, not only water from the near wellbore was not
cleaned up by gas production, water invasion was continued into the reservoir due to
the strong capillary pressure suction effects, and damaged zone radius (water invaded
radius) increased with passage of time.
Figure 15: Water saturation in the model at the end of water injection period
Figure 16: Water saturation in the model at the end of gas production period
Note: Refer to Appendix A for details of the simulation work and results analysis.
Sw X Y 100 ft
100 ft
Sw X
Y 100 ft
100 ft

36
3.1.3 Effect of phase-trap damage on skin factor
The reservoir model is also run to understand the effect of phase trapping damage on
skin factor for four different cases. Case A considers no leak-off of liquid into
formation (no damage). Cases B, C and D, consider, respectively approximately 215,
770 and 1400 barrels of water leaks off into the formation. In each run, the water
leak-off is followed by gas production during clean-up.
In each of the models after the liquid leak-off, the well is put on gas production
followed by a pressure build-up test. The pressure transient data are generated to
calculate the skin factor caused by phase trapping. The cumulative injected volume
of water during leak-off (Wi) and the simulated results for cumulative produced
water (Wp) during clean-up and gas production are integrated with welltest results as
shown in Figure 17. In the case of no liquid leak-off into the tight formation (case
A), the water blocking skin is zero. In the case of significant water leak-off into the
formation, skin is found to be positive. The results highlight the fact that phase trap
related damage due to water leak-off into the tight gas reservoir causes positive skin
factor, and significant reduction in gas production rate and gas recovery.
Figure 17: Effect of phase trap damage on skin factor
Note: For more details about model details, production and pressure build-up data
and durations, and the simulation results analysis please prefer to Appendix D.

37
3.1.4 Overbalanced and underbalanced drilling
The model is run at core scale, to understand the effect of wellbore pressure on water
invasion during overbalanced, balanced and underbalanced drilling. The model is run
for the following cases.
500 psia overbalanced pressure resulted in 0.5" liquid invasion into matrix
Balanced pressure conditions resulted in 0.4" liquid invasion into matrix
400 psia underbalanced resulted in 0.3" liquid invasion into matrix
1000 psia underbalanced resulted in 0.3" liquid invasion into matrix
From this simulation results as shown in Figure 18, it is obvious that the wellbore
liquid invades deeper in overbalanced conditions. However for underbalanced
conditions, although the wellbore pressure is less than the reservoir pressure, water
still invades the matrix rock due to the strong capillary suction and causes an
increase in water saturation around the wellbore. Thus, damage caused by water
blocking might still be significant even in the case of underbalanced drilling in tight
formations, owing to the ability of high and negative capillary pressure (water
suction) to compensate for relatively low mud pressure in the common case where
the tight gas formation is strongly water wet.
Figure 18: Effect of wellbore pressure during drilling on phase trap damage
Note: Please see Appendix C for details of the simulation work and results.

38
3.1.5 Phase trapping caused by oil based and water based drilling fluids
The simulation model is run to evaluate the effect of water and oil invasion damage
on well productivity. To evaluate phase-trap damage, the model is run for the cases
of no liquid invasion prior to gas production (no damage), injection of water into the
model, followed by gas production (water damage), and injection of oil into the
model, followed by gas production (oil damage).
The simulation results for cumulative gas production rate are shown in Figure 19,
which indicate that the well productivity is reduced in both oil and water invasion
cases due to the liquid phase trapping that can not be removed by gas production.
However, the well productivity is more sensitive to water invasion damage than
invasion of oil, and in the case of oil invasion, the damaging effect is significantly
less than water invasion.
Figure 19: Effect of water and oil invasion damage on gas recovery
Note: See Appendix E for more details about fluids distribution around the wellbore
and liquid phase trapping in the cases of oil based and water based drilling fluids.
3.1.6 Water blocking damage in hydraulically fractured wells
Hydraulic fractures are introduced to the reservoir scale simulation model as high
permeability planes perpendicular to the wellbore. The model is run to understand
the effect of initial water saturation and water invasion damage on gas production
rate in non-fractured and hydraulically fractured wells.
The simulation results for the effect of initial water saturation are shown in Figure
20, which indicate significant effect of Swi on well productivity. For all the cases,
sub-normal Swi provided significantly higher gas production rate.

39
Figure 20: Effect of initial water saturation on gas production rate
The simulation results in Figure 21 show the effect of water blocking damage in tight
formations with normal Swi. In the case of non-fractured well, water blocking
damage causes significant drop in gas production rate, and in the case of a fractured
well, the hydraulic fractures could improve well productivity. With 5 hydraulic
fractures, the stabilized gas production rate at late time is almost similar in the cases
of damaged and non-damaged wells (A3 and A6), which indicates that the dominant
effect of large hydraulic fractures compared with formation damage effect.
Figure 21: Effect of water invasion damage on gas production rate
The summary of simulated results for cumulative injected water during leak-off, and
cumulative produced water during clean-up and gas production are reported in Table
1, which indicate that in the reservoirs with sub-normal Swi, most of the injected
water during hydraulic fracturing is held inside the reservoir rock by capillary
imbibition. Compared with the normal Swi, the sub-normal Swi models have larger
leak-off of liquid into the formation, and significantly smaller volume of cumulative
water produced back. In other words, water phase trapping damage is more
significant in tight gas reservoirs that have sub-normal initial water saturation.
40
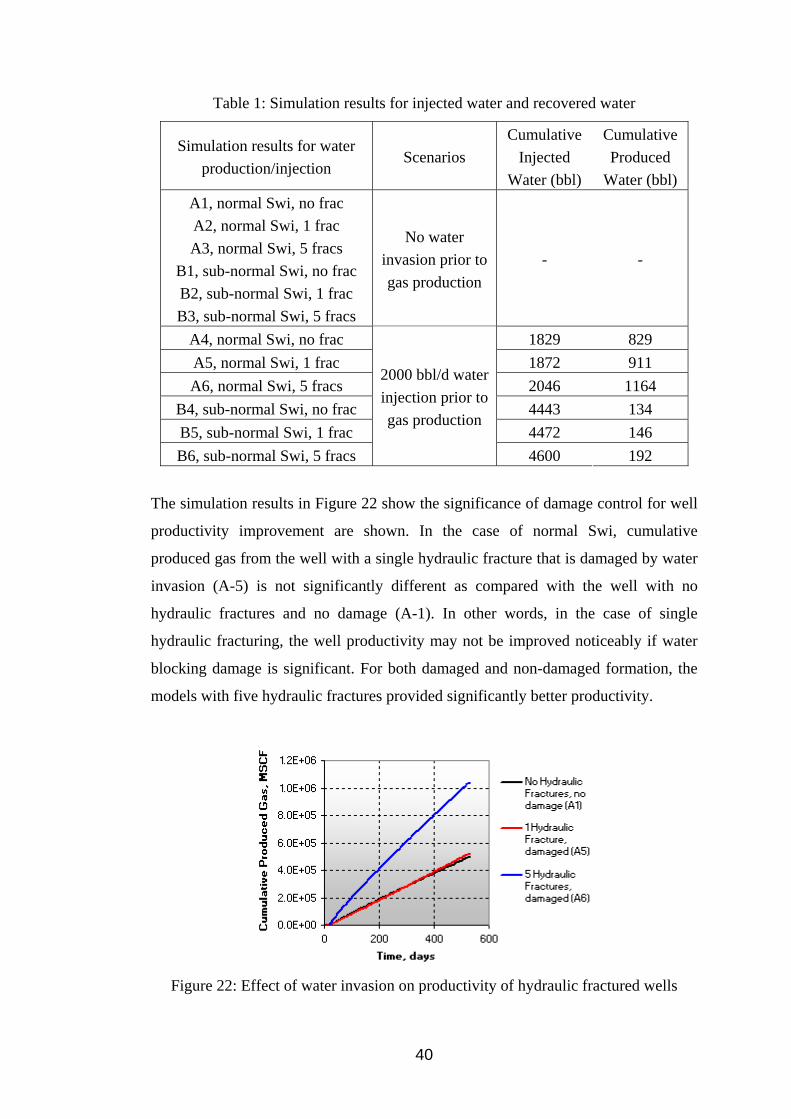
Table 1: Simulation results for injected water and recovered water
Simulation results for water
production/injection Scenarios
Cumulative
Injected
Water (bbl)
Cumulative
Produced
Water (bbl)
A1, normal Swi, no frac
A2, normal Swi, 1 frac
A3, normal Swi, 5 fracs
B1, sub-normal Swi, no frac
B2, sub-normal Swi, 1 frac
B3, sub-normal Swi, 5 fracs
No water
invasion prior to
gas production
- -
A4, normal Swi, no frac 1829 829
A5, normal Swi, 1 frac 1872 911
A6, normal Swi, 5 fracs 2046 1164
B4, sub-normal Swi, no frac 4443 134
B5, sub-normal Swi, 1 frac 4472 146
B6, sub-normal Swi, 5 fracs
2000 bbl/d water
injection prior to
gas production
4600 192
The simulation results in Figure 22 show the significance of damage control for well
productivity improvement are shown. In the case of normal Swi, cumulative
produced gas from the well with a single hydraulic fracture that is damaged by water
invasion (A-5) is not significantly different as compared with the well with no
hydraulic fractures and no damage (A-1). In other words, in the case of single
hydraulic fracturing, the well productivity may not be improved noticeably if water
blocking damage is significant. For both damaged and non-damaged formation, the
models with five hydraulic fractures provided significantly better productivity.
Figure 22: Effect of water invasion on productivity of hydraulic fractured wells
41
Note: Refer to Appendix A for more details about the simulation model, definition of
the different cases, and analysis of the simulation models outputs.
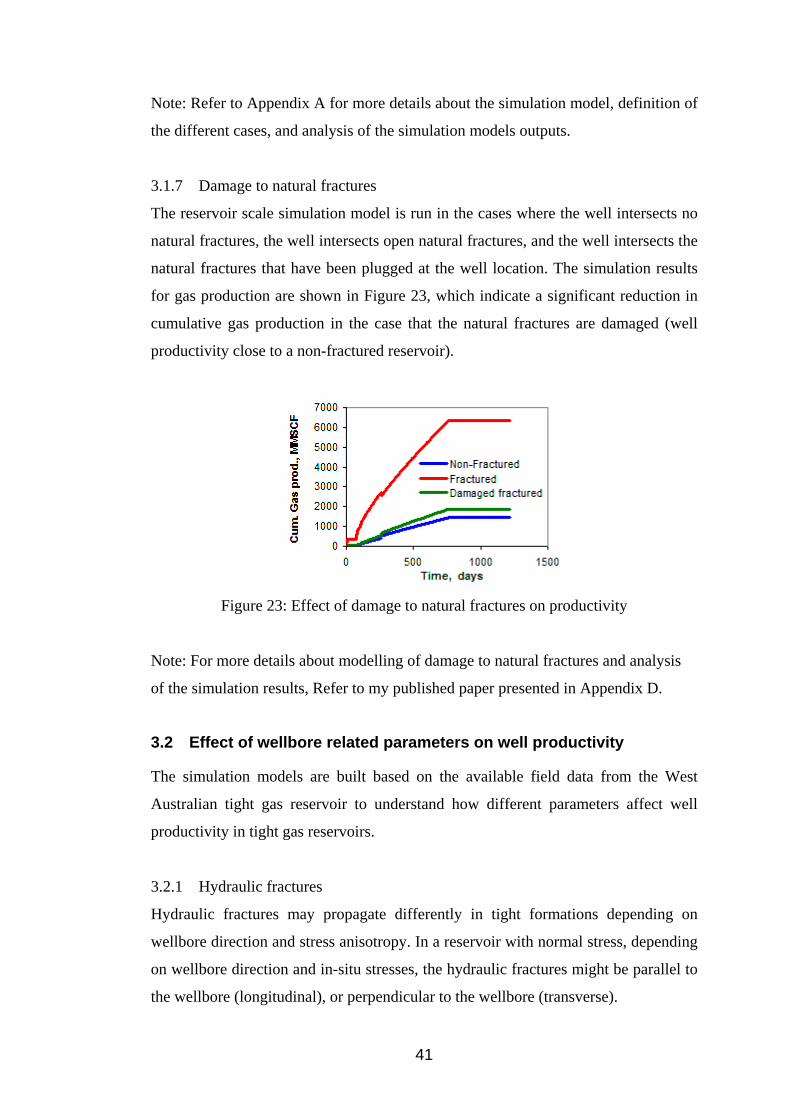
3.1.7 Damage to natural fractures
The reservoir scale simulation model is run in the cases where the well intersects no
natural fractures, the well intersects open natural fractures, and the well intersects the
natural fractures that have been plugged at the well location. The simulation results
for gas production are shown in Figure 23, which indicate a significant reduction in
cumulative gas production in the case that the natural fractures are damaged (well
productivity close to a non-fractured reservoir).
Figure 23: Effect of damage to natural fractures on productivity
Note: For more details about modelling of damage to natural fractures and analysis
of the simulation results, Refer to my published paper presented in Appendix D.
3.2 Effect of wellbore related parameters on well productivity
The simulation models are built based on the available field data from the West
Australian tight gas reservoir to understand how different parameters affect well
productivity in tight gas reservoirs.
3.2.1 Hydraulic fractures
Hydraulic fractures may propagate differently in tight formations depending on
wellbore direction and stress anisotropy. In a reservoir with normal stress, depending
on wellbore direction and in-situ stresses, the hydraulic fractures might be parallel to
the wellbore (longitudinal), or perpendicular to the wellbore (transverse).
42
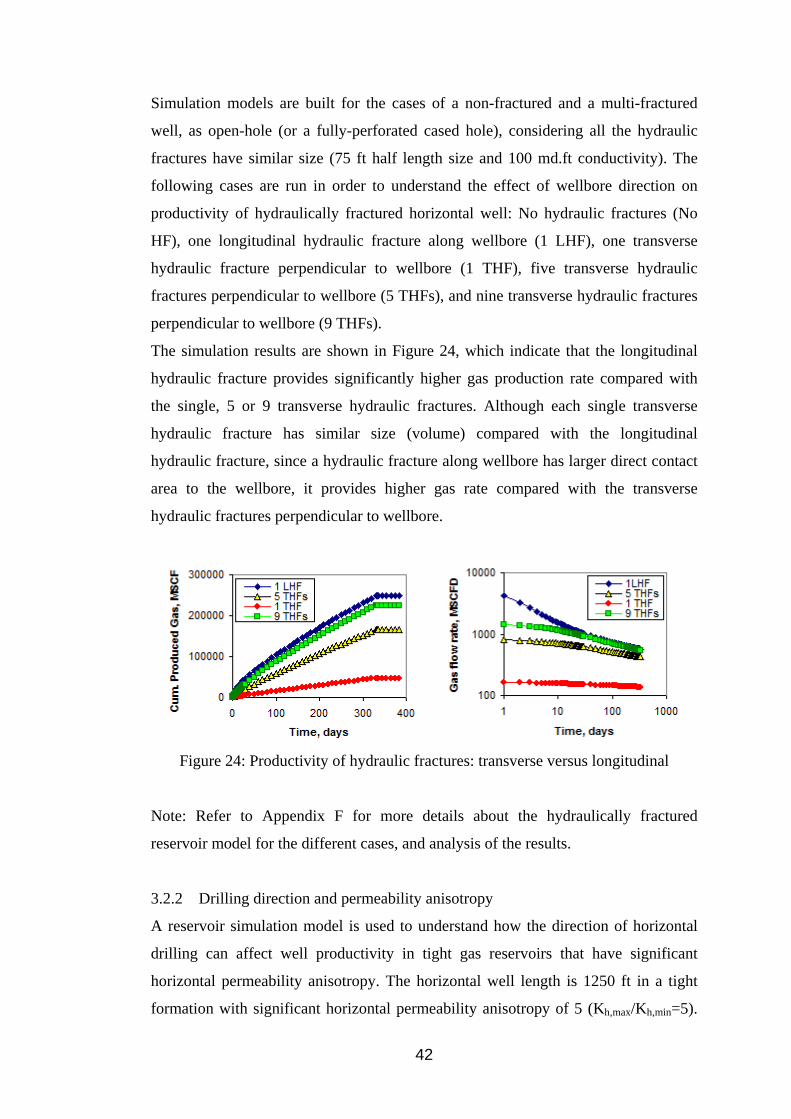
Simulation models are built for the cases of a non-fractured and a multi-fractured
well, as open-hole (or a fully-perforated cased hole), considering all the hydraulic
fractures have similar size (75 ft half length size and 100 md.ft conductivity). The
following cases are run in order to understand the effect of wellbore direction on
productivity of hydraulically fractured horizontal well: No hydraulic fractures (No
HF), one longitudinal hydraulic fracture along wellbore (1 LHF), one transverse
hydraulic fracture perpendicular to wellbore (1 THF), five transverse hydraulic
fractures perpendicular to wellbore (5 THFs), and nine transverse hydraulic fractures
perpendicular to wellbore (9 THFs).
The simulation results are shown in Figure 24, which indicate that the longitudinal
hydraulic fracture provides significantly higher gas production rate compared with
the single, 5 or 9 transverse hydraulic fractures. Although each single transverse
hydraulic fracture has similar size (volume) compared with the longitudinal
hydraulic fracture, since a hydraulic fracture along wellbore has larger direct contact
area to the wellbore, it provides higher gas rate compared with the transverse
hydraulic fractures perpendicular to wellbore.
Figure 24: Productivity of hydraulic fractures: transverse versus longitudinal
Note: Refer to Appendix F for more details about the hydraulically fractured
reservoir model for the different cases, and analysis of the results.
3.2.2 Drilling direction and permeability anisotropy
A reservoir simulation model is used to understand how the direction of horizontal
drilling can affect well productivity in tight gas reservoirs that have significant
horizontal permeability anisotropy. The horizontal well length is 1250 ft in a tight
formation with significant horizontal permeability anisotropy of 5 (Kh,max/Kh,min=5).

43
This level of anisotropy could be produced, for example, by oriented sand bodies or
channels. First, the wellbore direction is considered to be perpendicular to the
direction where permeability is larger. Then the model is run considering the
wellbore direction perpendicular to the direction where permeability is the minimum.
The results for gas production rate from the model are shown in Figure 25. The
horizontal wells drilled in the direction perpendicular to the direction of maximum
permeability (drilling in the direction of minimum horizontal stress, if permeability
anisotropy is caused by stress anisotropy) may provide noticeably higher gas
production rate compared to the wells that are drilled perpendicular to the direction
of minimum permeability (drilling in the direction of maximum horizontal stress, if
permeability anisotropy is caused by stress anisotropy).
Figure 25: Effect of wellbore direction on well productivity
3.2.3 Wellbore breakouts
In order to understand the effect on well productivity, the horizontal well model is
run for a zero skin cased-hole perforated horizontal well (wellbore diameter of 8
inches), and zero skin open-hole horizontal well with enlarged wellbore (wellbore
diameter of 20 inches).
The production predictions from the models as shown in Figure 26, they indicate that
open-hole completion in the gas wells with large wellbore breakouts can provide
significantly higher initial gas production rate compared with cased-hole completion
system. In use of open-hole completion, the enlarged wellbore due to break outs can
result in higher effective wellbore radius, and therefore a lower skin factor and
higher productivity.

44
Figure 26: Effect of wellbore breakouts on well productivity
3.2.4 Perforation parameters
The model was run for damaged and non-damaged perforated cores in the cases of
tight and conventional reservoirs. The simulation results show that the perforation
tunnel provides improvement in core flow efficiency, which is more noticeable in
tight sand cores compared to conventional cores as shown in Figure 27.
Figure 27: Effect of perforation tunnel length on flow efficiency
The simulation model is also run for the case of a open-hole perforated damaged
tight gas reservoir. The results as shown in Figure 28 indicate that if the damaged
zone is not fully bypassed by the perforations, the flow efficiency is still significantly
reduced. The flow efficiency is sensitive to perforation parameters and highlights the
importance of passing damaged zone radius, especially in tight gas reservoirs.
According to the simulation results, even for open-hole wells in tight formations,
improved productivity (flow efficiency greater than 1) may be achieved by creating
deep, clean perforation tunnels that can bypass the mechanical damaged zone.

45
Figure 28: Effect of perforation tunnel length on flow efficiency
Note: Refer to Appendix D for details of the simulation work, analysis of the results,
and a field example regarding how the damaged zone radius is determined.
3.2.5 Liquid loading in wellbore
Well stimulation and fracturing operations in tight formations cause significant liquid
leak-off into the reservoir rock. The invaded liquids when produced, they may be
loaded in wellbore during post-fracturing clean-up period, since natural gas flow rate
may not be high enough to lift the wellbore liquids to surface. A series of simulation
runs are carried out to model the wellbore phenomena for a horizontal deviated
wellbore. The results as shown in Figure 29 indicated water loading problem in
wellbore at 4 MMSCFD gas production rate. The problem becomes more serious
when gas flow rate is reduced to 1 MMSCFD. Based on the simulation results, liquid
loading can be one of the main causes of low well productivity in tight gas wells.
Figure 29: Simulation of liquid loading in wellbore (effect of gas production rate)
The well production performance modelling results also showed that use of oil based
mud instead of water based mud can help reducing liquid loading, since oil has less
density than water, and therefore gas can better lift the liquid to surface. Therefore,
underbalanced drilling using non-aqueous liquid can reduce the issues related to

46
liquid loading in wellbore during clean-up. Tight gas well productivity can also be
further improved by gas lift and optimizing the producing liner and tubing size.
Note: Refer to Appendix D for more details about water loading issues, a field
example, and also the water unloading techniques that can improve well productivity.
3.3 Effect of natural fractures parameters on welltest response
The tight gas reservoir model is built as a dual-porosity dual-permeability medium
using the Kazemi model with parallel layers of low permeability tight matrix and
high permeability fractures. The model generates transient pressure data for gas
production and pressure build-up periods to show the relationship between welltest
permeability and natural fractures parameters.
The model is run for different values of fracture aperture, fracture permeability,
matrix permeability, matrix compressibility, fracture compressibility, matrix
porosity, fracture porosity and fracture spacing. The simulation results for sensitivity
of welltest permeability indicated that among the parameters examined, only the
fracture aperture, fracture permeability and fracture spacing have significant impact
on welltest permeability (k), and the other parameters can be disregarded. According
to the simulation outputs as shown in Figure 30, welltest permeability, k, is directly
proportional to fracture aperture, bf , and fracture permeability, kf (the power
exponent of +1 approximately), and has inverse relationship with fracture spacing, af
(the power exponent of -1 approximately). The observations are in good agreement
with the derived Equation 2-5 regarding how the parameters control fracture
permeability, which confirms the reliability of the proposed equation.
Figure 30: Relationship between fracture parameters and welltest permeability
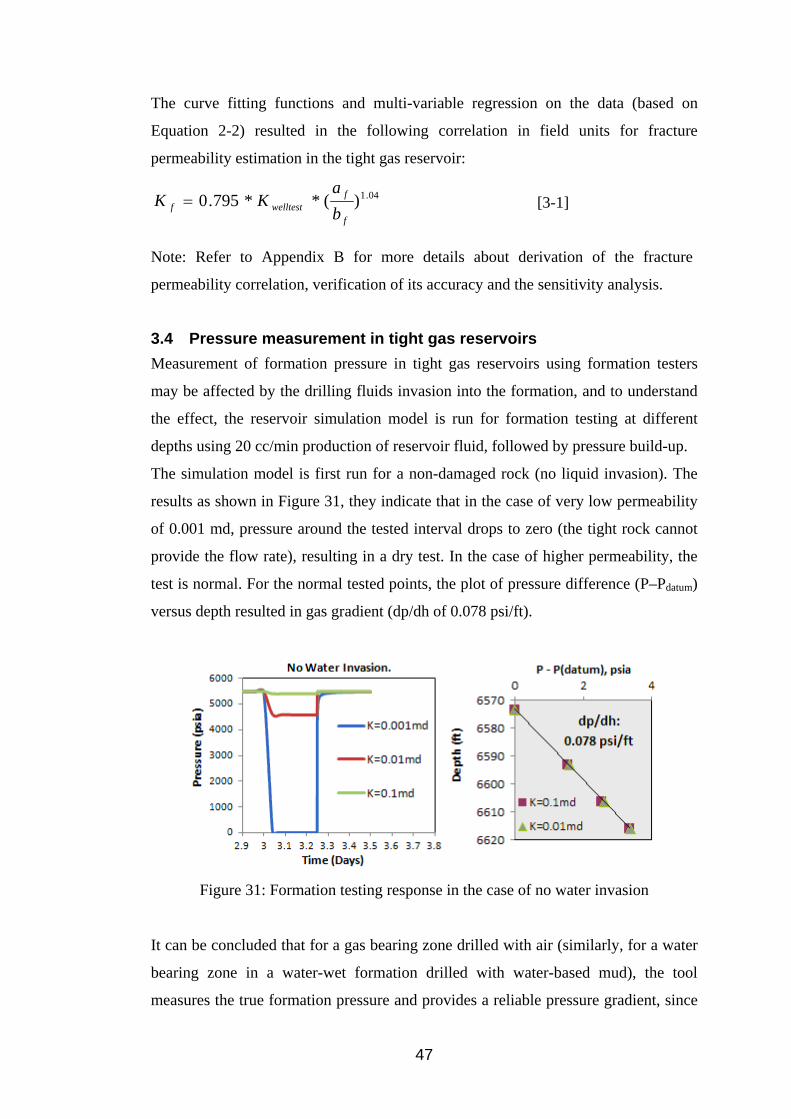
47
The curve fitting functions and multi-variable regression on the data (based on
Equation 2-2) resulted in the following correlation in field units for fracture
permeability estimation in the tight gas reservoir:
04.1)(**795.0f
fwelltestf b
aKK [3-1]
Note: Refer to Appendix B for more details about derivation of the fracture
permeability correlation, verification of its accuracy and the sensitivity analysis.
3.4 Pressure measurement in tight gas reservoirs
Measurement of formation pressure in tight gas reservoirs using formation testers
may be affected by the drilling fluids invasion into the formation, and to understand
the effect, the reservoir simulation model is run for formation testing at different
depths using 20 cc/min production of reservoir fluid, followed by pressure build-up.
The simulation model is first run for a non-damaged rock (no liquid invasion). The
results as shown in Figure 31, they indicate that in the case of very low permeability
of 0.001 md, pressure around the tested interval drops to zero (the tight rock cannot
provide the flow rate), resulting in a dry test. In the case of higher permeability, the
test is normal. For the normal tested points, the plot of pressure difference (P–Pdatum)
versus depth resulted in gas gradient (dp/dh of 0.078 psi/ft).
Figure 31: Formation testing response in the case of no water invasion
It can be concluded that for a gas bearing zone drilled with air (similarly, for a water
bearing zone in a water-wet formation drilled with water-based mud), the tool
measures the true formation pressure and provides a reliable pressure gradient, since
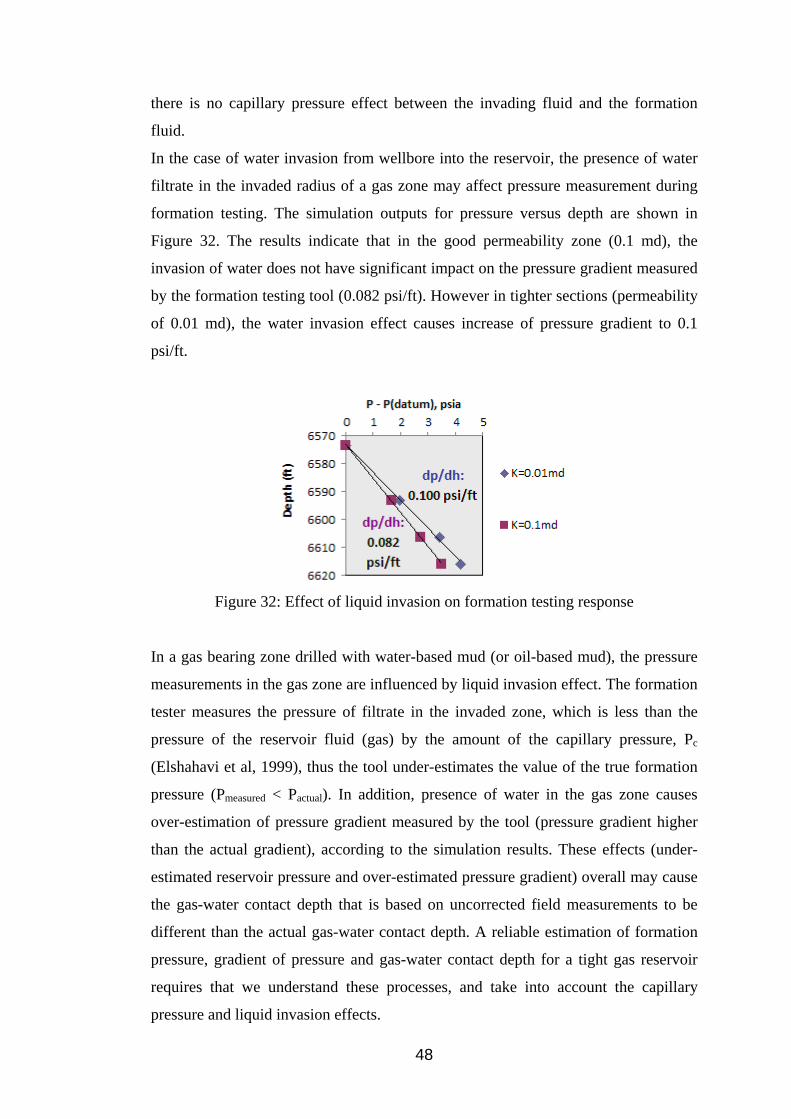
48
there is no capillary pressure effect between the invading fluid and the formation
fluid.
In the case of water invasion from wellbore into the reservoir, the presence of water
filtrate in the invaded radius of a gas zone may affect pressure measurement during
formation testing. The simulation outputs for pressure versus depth are shown in
Figure 32. The results indicate that in the good permeability zone (0.1 md), the
invasion of water does not have significant impact on the pressure gradient measured
by the formation testing tool (0.082 psi/ft). However in tighter sections (permeability
of 0.01 md), the water invasion effect causes increase of pressure gradient to 0.1
psi/ft.
Figure 32: Effect of liquid invasion on formation testing response
In a gas bearing zone drilled with water-based mud (or oil-based mud), the pressure
measurements in the gas zone are influenced by liquid invasion effect. The formation
tester measures the pressure of filtrate in the invaded zone, which is less than the
pressure of the reservoir fluid (gas) by the amount of the capillary pressure, Pc
(Elshahavi et al, 1999), thus the tool under-estimates the value of the true formation
pressure (Pmeasured < Pactual). In addition, presence of water in the gas zone causes
over-estimation of pressure gradient measured by the tool (pressure gradient higher
than the actual gradient), according to the simulation results. These effects (under-
estimated reservoir pressure and over-estimated pressure gradient) overall may cause
the gas-water contact depth that is based on uncorrected field measurements to be
different than the actual gas-water contact depth. A reliable estimation of formation
pressure, gradient of pressure and gas-water contact depth for a tight gas reservoir
requires that we understand these processes, and take into account the capillary
pressure and liquid invasion effects.

49
3.5 Summary
In this section, the effect of various well and reservoir parameters on well
productivity was studied using reservoir simulation models based on the tight gas
field data: phase trapping damage in non-fractured and hydraulically wells, in under-
balanced and over-balanced drilling, and in the case of invasion of different fluids
into the tight formation (water and oil). The effects of permeability anisotropy,
wellbore breakouts, perforation parameters, liquid loading in wellbore, different
hydraulic fractures systems and natural fractures on well productivity were
presented, and it was also shown how formation testing pressure measurements and
gas water contact determination may be influenced by liquid invasion into tight gas
reservoirs.

50
4 Tight gas field example: effect of
damage mechanims on well productivity Whicher Range Field, located in the Southern Perth Basin, is a large, low
permeability and very heterogeneous gas reservoir. It consists of stacked and isolated
lenses of sand separated by shale layers. The wells in this field were mainly drilled
vertically using water based mud in over balanced conditions, and completed as
cased-hole perforated. Hydraulic fracturing was also performed in some of the wells
using water based fracturing fluid. None of the wells produced at viable rates despite
various attempts to stimulate the formation (Rezaee et al, 2012).
There is a long history of various DST and production tests performed in this field
before. Despite well stimulation and other well intervention operations, gas
production rates were found to be low and did not meet the expectations. In this
section, various categories of data are reviewed and analysed and obtain a better
understanding of the reservoir, to evaluates possible mechanisms that might have
contributed to the low productivity and assess the feasibility of achieving
commercial production rates.
4.1 Wellbore instability
The wells drilled in the tight sand formation had severe wellbore instability issues
during drilling, which caused enlargement of wellbore up to 20 inches (2-3 times
bigger than the bit size) across majority of the tight sand intervals.
Note: Refer to Appendix D for more details about the wellbore breakouts, its effect
on skin factor, and the calliper log data in one of the wells in the tight gas field.
4.2 Perforation data
Perforations in these wells were mainly performed using 2 1/8” EJ guns. According
to the well data, the casing has 7” internal diameter and the borehole may have 10”
diameter in the direction of maximum stress where the borehole is stable, and 20” in
the direction of minimum stress due to the wellbore breakouts. Damaged zone
4

51
radius is also assumed as 5”. Schlumberger perforation analysis software (SPAN
7.02) is run for the tight formation to analyse the perforation data in different
directions. The software results for perforation jet penetration and skin factor as
presented in Table 2 and Figure 33. They indicate a positive skin factor for the
tunnels, as penetration is not deep enough to efficiently connect the wellbore to the
formation virgin zone. In fact, the perforation efficiency is lower in the direction of
min due to the large cement volume behind the casing in the intervals with enlarged
wellbore.
Because of the reservoir rock tightness and also presence of the large wellbore
breakouts behind casing filled by cement, the perforation penetration is significantly
reduced. As explained in section 3.2.4, as perforation jet penetration into the tight
formation is not deep enough, the wellbore may not have effectively been connected
to the undamaged rock. The poor perforation efficiency might be the primary reason
of the low productivity in the cased-hole perforated well.
Table 2: Model predictions for perforation jet penetration and skin
Casing Gun
type
Perforation
tunnel direction
Formation
penetration, inches
Perforation
skin
max 6.0 2.3 7"
2 1/8"
gun min 4.2 11.5
Figure 33: Effect of wellbore breakouts on perforation performance

52
Note: This section has been published in 2011 APPEA journal. See Appendix D for
more details about perforation penetration results in use of conventional perforation
guns and deep penetrating guns.
4.3 Hydraulic fractures
Hydraulic fracturing in the tight gas wells had 3-4 fracturing stages, with average
maximum pumping pressure of 10,000 psia, average pump rate of 20 bbl/min,
average total proppant per stage of 35000 lbs, and average total liquid injected per
stage of 2500 bbls. The fracturing models predicted 100-150 ft fracture half length
size, and fracture conductivity of 700-2100 md.ft for the fractures.
After the hydraulic fracturing operations and then cleaning up the well from the
fracturing liquids by gas production, only 10-60% of the injected fracturing liquid
could be recovered (40-90% of fracturing liquid being trapped in the reservoir),
which may have caused significant damage to near wellbore formation.
4.4 Formation sensitivity to water invasion damage
The core samples in the tight gas field that were tested and analyzed using X-Ray
diffraction, they detected smectite, meaning that the tight formation can have
medium to strong sensitivity to fresh or sodium chloride waters (indicating a water
sensitive tight formation). With such minerals present, clay swelling may be reduced
by using relatively high concentrations of KCl, sometimes accompanied by CaCl2 in
the drilling and stimulation fluids.
4.5 Well production history (Pre-fracturing and post-fracturing)
The well after completion and perforation produced at the rate of 1.9 MMSCFD,
which was not an economical rate. The well was later hydraulically fractured using
KCl based fracturing fluid in order to improve well productivity. The post fracturing
gas flow was around 0.5 MMSCFD (production lasted only for a short period of
time). After the well clean-up, the well produced 1.3 MMSCFD gas with all the
intervals open, which does not show production improvement compared to pre-
fracturing flow rate. The well production comparison is shown in Figure 34, which
indicates low fracturing efficiency.

53
In the fracturing job, approximately 60% of the fluids were recovered during post
fracturing production test, and significant amounts of water based treating fluids was
trapped in the water-sensitive tight formation (we believe that this trapped in the
reservoir, causing significant damage to reservoir permeability). Therefore it could
be concluded that the leak-off of water into the tight sand gas reservoir during
fracturing might be the reasons for the low well productivity after stimulation.
Figure 34: The tight gas well production comparison, before versus after hydraulic
fracturing
In term of hydraulic fractures performance, the fracturing job was not successful.
The well may produce gas at a commercial rate using massive hydraulic fracturing
and creating large treated zone volume, which might be achieved by use of non-
damaging fracturing liquid, increasing numbers of fracturing stages (For instance
10-20 fracturing stages instead of 3-4), higher pumping rates of fracturing fluid (For
instance 60-80 bbl/min instead of 20 bbl/min) and larger volumes of liquid and
proppant injection per stage.
Note: This section has been published in 2012 JPSE journal. See Appendix A for
more details.
4.6 Formation damage caused by water and oil invasion
Laboratory experiments on the West Australian core samples were performed using
the core flooding facilities in Petroleum Engineering Department at Curtin
University, in order to compare damage to the core permeability, caused by water
invasion versus oil invasion.

54
Absolute permeability of each core sample is measured at 100% gas saturation. The
characteristics of the core samples tested for damage evaluation are reported in Table
3. The test conditions are 5800 psia pore pressure and 109 ˚C temperature.
Table 3: Details of the core samples characteristics
Core sample Core porosity, % Core absolute permeability, md
Sample A1 6.7 0.003
Sample A2 9.6 0.034
Sample A3 11.4 0.026
Sample B1 4.6 0.034
Sample B2 5.4 0.032
4.6.1 Damage caused by water invasion
For water damage evaluation, the core samples are saturated with water, followed by
flooding of gas into the core samples until water saturation is reduced to the
minimum of residual water saturation, and then core effective permeability to gas is
measured (Krg@Swr). From the core experiments as reported in Table 4, water
invasion causes the relative permeability of gas to be reduced to 0.22-0.35, indicating
around 70% reduction in effective permeability.
Table 4: Core flooding experiment results for water invasion damage
Core sample flooded with water, cleaned up with gas
End point methane Kr @
Swr
Sample A1:
0.224
Sample A2:
0.353
Sample A3:
0.219
4.6.2 Damage caused by oil invasion
For oil invasion damage evaluation, the core samples are saturated with oil, then gas
is flooded into the core samples until oil saturation is reduced to minimum of
residual oil saturation in order to measure core effective permeability to gas
(Krg@Sor). From core experiments as reported in Table 5, the effective permeability
is reduced by 55% due to oil invasion.

55
Table 5: Core flooding experiment results for oil invasion damage
Core is flooded with oil, cleaned up with gas
End point methane Kr @ Sor Sample B1:
0.507
Sample B2:
0.413
4.6.3 Comparison of damage caused by water and oil
The experiments highlight the fact that tight gas reservoirs are subjected to invasion
damage in both cases of oil filtrate invasion (from OBM) or water filtrate invasion
(from WBM). In other words, even when oil-based fluids are used instead of water-
based fluid for drilling or fracturing, the reservoir rock is damaged. However severity
of the damage is less in the case of damage caused by oil based fluid as compared to
the damage caused by water invasion.
Note: This section has been published in 2012 APPEA journal. See Appendix E for
more details about damage caused by oil and water.
4.7 Well productivity evaluation in Whicher Range tight gas field
The wells in the tight gas reservoir were drilled overbalanced using water based
mud, and completed as cased-hole perforated wells. Analysis of the field and lab
data showed that there are various possible explanations or combination of
circumstances that may have contributed to the wells’ poor productivities:
Vertical wells in low permeability gas reservoirs may not provide
economical rates due to the very limited formation surface area that is open
to the wellbore.
The core data analysis (X-Ray diffraction) detected smectite which shows
the reservoir rock is sensitive to water based fluids. Drilling the wells
overbalanced using water based mud, may have caused significant damage
and low productivity.
In addition, perforation efficiency was low due to the reservoir rock
tightness and also presence of the large wellbore breakouts behind casing
filled by cement.
In the wells that were hydraulically fractured, the fracturing operations did not result
in any improvement of productivity which might be due to:

56
Job reports indicate that about 40% of the water based treating fluids is not
recovered. The formation is sensitive to water damage and the large leak-off
of water into formation during fracturing might be one of the main factors
that cause low productivity.
Well production and test data also indicated that hydraulic fracture size is
significantly smaller than the expectations. The limited size hydraulic
fractures may have caused the hydraulic fractures productivity to be low.
4.8 Tight gas development strategy for optimized productivity
Gas recovery might be low if drainage area of a well is limited to a few sand lenses
(which might be the case in vertical wells drilling). The optimum strategy for the
tight gas field might be to drill long highly deviated horizontal/deviated wells in
underbalanced conditions using non-aqueous drilling fluid to intersect as many as
possible of the sand lenses, increase the lateral reservoir exposure to wellbore, and
minimize damage to formation. Drilling direction should be designed based on sand
lenses width and length. Completing the well as open-hole (and running a slotted
liner to control wellbore collapse) can further improve the well productivity as it
provides using the advantage of enlarged wellbore and the reduced skin factor due to
presence of the wellbore breakouts. Also perforating using deep perforation shots
through the slotted liner and penetrating into the formation can help better bypassing
the possible mechanically damaged zone in the tight formations. As perforation
strategy, shooting the perforation jets aligned with the maximum stress direction
(oriented perforation with 180 degrees phasing) might help improve perforation
efficiency in the cased-hole perforated tight gas wells.
Improving drilling or fracturing fluid rheology and filter cake building ability, which
can provide an effective cake that is later removable can help control the damaged
zone depth and reduce the damage due to liquid invasion.
In the cases of significant liquid leak-off into formation, use down-hole pumps, gas
lift system in the early stage (especially during cleaning the wells) and/or optimum
tubing size, to unload the well from drilling or fracturing liquids, to allow the well to
produce at higher gas rates.

57
5 Conclusions
The objectives of this study were to review, understand and evaluate the factors that
have significant influence on formation damage and well productivity in tight gas
sand reservoirs. Various tight gas field completion, production and reservoir
engineering data were studied, laboratory experiments were performed, and
reservoir simulation models were run. Based on the study results, the following
conclusions can be drawn:
Liquid phase trapping damage is one of the main factors that can significantly
affect well productivity in tight gas reservoirs. The damage mechanism is
mainly controlled by capillary pressure and its resulting relative permeability
curves.
Core flooding experiments using unsteady state technique integrated with
numerical simulation approach, provided the relative permeability curves for a
typical West Australian tight gas reservoir.
Damage caused by water blocking is considered to be one of the main causes
of low well productivity in water sensitive tight gas reservoirs (i.e. sandstones
containing clays, especially smectite).
In tight reservoir rocks that are sensitive to water, exposure of formation to
water during drilling may cause severe damage to near-wellbore formation
permeability.
Core flooding experiments using core samples taken from the typical West
Australian tight gas reservoir showed that the damage to formation might be
reduced by use of oil based mud drilling fluid, instead of water based mud.
The field study and reservoir simulation highlighted that hydraulic fracturing
may be inefficient in tight gas formations that are sensitive to liquid invasion
damage. In some cases, hydraulic fracturing may even reduce well
productivity.
Underbalanced drilling is considered as a method to reduce damage to tight
formations. However the study highlighted that even in the case of
5
58
underbalanced drilling, mud filtrate (water or oil) may still invade the rock
matrix around the wellbore due to the strong capillary pressure suction.
After the liquid leak-off into formation is stopped, during clean-up period
when gas is produced from the tight reservoir, water still continues invading
more area of the reservoir due to the very strong capillary pressure suction
effect.
Liquid loading in wellbore may significantly affect well productivity in tight
formations, since the initial gas production rates are normally not high enough
to lift the wellbore liquid to surface.
In the case of damage to natural fractures, well productivity is reduced
significantly. Well productivity of a damaged naturally fractured reservoir may
not be very different than well productivity in a non-fractured reservoir until
the reservoir contact area is very great.
Field observations indicated that wellbore instability can cause large wellbore
breakouts and washouts across the tight sand intervals.
Cased-hole perforated completion may not be the optimum option in tight gas
reservoirs. In cased-hole completed wells, the large wellbore breakouts filled
by cement may reduce accessibility to the formation via perforation tunnels, as
they may fail to penetrate deep enough into the formation. In addition,
perforation jet penetration depths are significantly reduced by the tightness of
the formation.
Open-hole completion in tight gas reservoirs, provides using the advantage of
enlarged wellbore (reduced skin factor) caused by large wellbore breakouts.
Open-hole perforating using deep penetrating perforation charges may further
improve the well productivity.
In the case of perforation, the optimum option might be to use deep
penetrating perforation charges oriented towards maximum stress direction
i.e., 180 degree phasing (the direction where wellbore is stable and has no
considerable breakouts).
Use of the second derivative of transient pressure in welltest analysis can
provide more reliable determination of reservoir permeability, skin factor and
hydraulic fracture parameters in tight gas reservoirs.
In tight reservoirs with significant permeability anisotropy, drilling
perpendicular to the maximum permeability provides higher productivity.
59
If stress anisotropy is the main cause of permeability anisotropy, drilling long
deviated/horizontal wells perpendicular to the maximum horizontal stress
direction can result in achieving higher gas production rates, by intersecting
the higher permeability conduits.
Drill directional wells perpendicular to the maximum horizontal stress azimuth
to improve wellbore stability, and intersecting higher permeability conduits,
especially for the reservoir with normal faulting stress regime condition.
In the case of fully perforated horizontal well, a longitudinal hydraulic fracture
provides noticeably a higher productivity than a transverse hydraulic fracture.
Welltest permeability and image log fracture aperture and fracture spacing can
provide approximation of natural fractures permeability in naturally fractured
tight gas reservoir, and result in more reliable evaluation of well productivity.
Liquid invasion into tight formations may affect the formation pressure
measurements and result in under-estimating reservoir pressure and over-
estimating pressure gradient.
In this thesis I have demonstrated how different well and reservoir parameters
control well productivity and damage mechanisms in tight gas reservoirs. I have also
quantitatively shown the effect of phase trapping damage, well parameters and
reservoir characteristics on tight gas sand reservoirs productivity for different cases.
These cases include non-fractured and hydraulically fractured wells, under-balanced
and over-balanced drilling, and invasion of different fluids into the tight formation.
Reservoir simulation model for Whicher Range tight gas field is built and run, and
analytical and numerical simulation approaches are integrated with core flooding
experiments and field data analysis in order to characterize the key reservoir
parameters and understand the effects of different parameters on well productivity.
The study brings new insights regarding tight gas reservoirs characterization for
dynamic parameters. I determined the relative permeability curves for Whicher
Range tight gas reservoir using core flooding experiments integrated with numerical
simulation approach. I have quantitatively shown how the phase trapping damage
can be reduced by use of oil based drilling fluid instead of water based fluid. I
introduced a new technique of welltest analysis for tight gas reservoirs that can
reduce uncertainties in estimation of average reservoir permeability, and also
developed a new correlation that can determine permeability of the natural fractures

60
in tight formations. I studied and analysed the different well completion, production
and reservoir data from Whicher Range tight gas field in order to identify why
production rates are significantly lower than expectations, and investigate possible
remedial strategies to achieve viable gas production rates. Based on the study
outcomes, I have proposed the optimum tight gas development strategies to achieve
an improved productivity.

61
6 Nomenclatures
µ Viscosity
af Fracture spacing
bf Aperture of natural fracture
C Compressibility
GWC Gas water contact
h Thickness
ID Internal diameter
Porosity
K Permeability
Kd Damaged zone permeability
Kf Fracture permeability
Kr Relative permeability
m Slope of pressure derivative versus natural log of time function
MMSCFD Million standard cubic feet per day
n Number
OB Overbalanced
P Pressure
Pc Capillary pressure
Q Flow rate
Qg Gas production rate
Qd Dimensionless production rate
Q’d Rate derivative function
S Skin
In-situ stress
Sgc Critical gas saturation
Sgi Initial gas saturation
Sw, connate Connate Water Saturation
6

62
Swi Initial Water Saturation
t Time
tp Production time
T Temperature
UB Underbalanced
Wf Aperture of hydraulic fracture
X Direction in x direction (horizontal)
Xf Hydraulic fracture half length size
Y Direction in Y direction (horizontal)
Z Direction in Z direction (vertical)
63
7 References
1. Abass, H., 2009. Optimizing proppant conductivity and number of hydraulic
fractures in tight gas sand wells, SPE 126159, SPE Technical Symposium,
Saudi Arabia.
2. Abass, H., Ortiz, I., 2007. Understanding Stress Dependant Permeability of
Matrix, Natural Fractures, and Hydraulic Fractures in Carbonate Formations,
SPE 110973, SPE Saudi Arabia Technical Symposium.
3. Abass, H., Sierra L., Tahini A., 2009. Optimizing proppant conductivity and
number of hydraulic fractures in tight gas sand wells, SPE 126159, SPE
Technical Symposium, Saudi Arabia.
4. Ahmed, T., 2000. Handbook of reservoir engineering, 2nd edition, Elsevier's
Science & Technology publishing
5. Andrews J.T., Bahrami H., Rezaee R., Pourabed H., S. Mehmood, H. Salemi.
2012. Effect of liquid invasion and capillary pressure on wireline formation
tester measurements in tight gas reservoirs, SPE-154649, IADC/SPE Asia
Pacific Drilling Technology Conference and Exhibition held in Tianjin, China
6. Badazhkov, D., 2008. Analysis of Production Data with Elliptical Flow
Regime in Tight Gas Reservoirs, SPE 117023, SPE Russian Oil and Gas
Technical Conference and Exhibition, Moscow, Russia
7. Bagherian B., Sarmadivaleh M., Ghalambor A., Nabipour A., Rasouli V.,
Mahmoudi M., 2010. Optimization of Multiple-Fractured Horizontal Tight
Gas Well, SPE 127899, Symposium and Exhibition on Formation Damage
Control, Lafayette, Louisiana, USA
8. Bahrami H., Siavoshi J., 2005. Second derivative yields new insights to well
test analyses, Oil and Gas Journal, Canada
9. Bahrami H., Rezaee R., Kabir. A., Siavoshi J., Jammazi R., 2010. Using
Second Derivative of Transient Pressure in Welltest Analysis of Low
Permeability Gas Reservoirs , SPE 132475, Production & Operations
Conference, Tunis, Tunisia
7

64
10. Bahrami H., Rezaee R., Asadi M.S., 2010. Stress Anisotropy, Long-Term
Reservoir Flow Regimes and Production Performance in Tight Gas
Reservoirs, SPE 136532, SPE Eastern Regional Meeting held in
Morgantown, West Virginia, USA
11. Bahrami H., Rezaee R., Hossain M.M., Murickan G., Basharudin N.,
Alizadeh N., Fathi A., 2012. Effect of Sand Lens Size and Hydraulic
Fractures Parameters on Gas In Place Estimation Using 'P/Z vs Gp Method' in
Tight Gas Reservoirs, SPE 151038, SPE/EAGE European Unconventional
Resources Conference and Exhibition held in Vienna, Austria
12. Bazin B., Peysson Y., Lamy F., Martin F, Aubry E., Chapuis C., 2009. Insitu
water blocking measurement and interpretation related to fracturing
operations in tight gas reservoirs, SPE formation damage control symposium,
The Netherlands, 2009.
13. Behrmann, L., 2000. Perforating Practices That Optimize Productivity,
Oilfield Review, Spring
14. Bennion, D. B., Brent, F., 2005. Formation Damage Issues Impacting the
Productivity of Low Permeability, Low Initial Water Saturation Gas
Producing Formations, Journal of Energy Resources Technology, Vol. 127,
pages 240246.
15. Bennion, D.B., Thomas, F.B., 2000. Formation Damage Processes Reducing
Productivity of Low Permeability Gas Reservoirs, SPE low permeability
reservoirs symposium and exhibition, Denver, CO.
16. Bennion, D.B., Thomas, F.B., 1996. Low permeability gas reservoirs:
problems, opportunities and solutions for drilling, completion, stimulation
and production, SPE 35577, SPE Gas Technology Conference, Calgary,
Canada.
17. Bennion, D. B., Thomas F.B., Schlumeister B., Romanova U.G., 2006. Water
and Oil Base Fluid Retention in Low Permeability Porous Media – an
Update, Canadian International Petroleum Conference, Calgary, Canada.
18. Bonner, A., Saljooghi, A., 2007. Improvement of MDT success ratio, 2007
Schlumberger Reservoir Symposium, Abu Dhabi, UAE.
19. Bourdarot, G., 1998. Well Testing Interpretation Methods, Editions Technip
20. Chi, S., Torres, C., Wu J., Alpak O. F., 2004. Assessment of Mud-Filtrate
Invasion Effects on Borehole Acoustic Logs and Radial Profiling of

65
Formation Elastic Parameters, SPE 90159, SPE Annual Technical
Conference, Houston, USA.
21. Cipola C., Mack M., 2010. Reducing Exploration and Appraisal Risk in Low-
Permeability Reservoirs Using Microseismic Fracture Mapping, SPE 137437,
Canadian Unconventional Resources and International Petroleum
Conference, Calgary, Alberta, Canada
22. Civan, F., 2000. Reservoir Formation Damage, Gulf Publishing Company,
Texas, USA, chapter 12, pages 262279
23. Ding, Y., Herzhaft, B., Renard G., 2006. Near-Wellbore Formation Damage
Effects on Well Performance: A Comparison Between Underbalanced and
Overbalanced Drilling, SPE Production & Operations Journal,
Volume 21, Number 1.
24. E&P Focus newsletter, 2011. Creating extensive, conductive hydraulic
fractures in low permeability gas reservoir, National Energy Technology
Laboratory, Page 16.
25. Elshahavi H., Fathy K., Heikal S., 1999 - Capillary Pressure and Rock
Wettability Effects on Wireline Formation Tester Measurements, SPE 56712,
SPE Annual Technical Conference and Exhibition, Houston, Texas, U.S.A.
26. Lokken V. T., Bersas A., Christensen K. O., Nygaard C. F., Solbraa E., 2008.
Water content of high pressure natural gas, international gas union research
conference, Paris, France.
27. Fairhurst, D. L., Indriati S., Reynolds B.W., 2007. Advanced Technology
Completion Strategies for Marginal Tight Gas Sand Reservoirs: A Production
Optimization Case Study in South Texas, SPE 109863, SPE Annual
Technical Conference and Exhibition, California, U.S.A.
28. Fan L., Thompson J.W., Robinson J.R., 2010. Understanding gas production
mechanism and effectiveness of well stimulation in the Haynesville shale
through reservoir simulation, SPE 136696, Canadian Unconventional
Resources and International Petroleum Conference, Calgary, Alberta, Canada
29. Fjar E., Holt R.M., Horsrud P., Raaen A.M., Risenes R., 2008. Petroleum
related rock mechanics, 2nd edition. Developments in petroleum science 53.
30. Garcia, J. P., Pooladi Darvish, M., Brunner, F., Santo, M., and Mattar, L.,
2006. Welltesting of tight gas reservoirs, SPE 100576, SPE Gas Technology
Symposium, Calgary, Alberta, Canada

66
31. Gonfalini, M., 2005. Formation Evaluation Challenges in Unconventional
Tight Hydrocarbon Reservoirs, presented in 2005 SPE Italian section, Italy.
32. Guo, B.; Ghalambor, 2005. Natural Gas Engineering Handbook, Gulf
Publishing Company.
33. Hategan F., Hawkex R. V., 2006. The Importance of Initial Reservoir
Pressure for Tight Gas Completions and Long-Term Production Forecasting,
7th Canadian International Petroleum Conference, Calgary, Alberta, Canada,
13-15 June, PETSOC-2006-171CS.
34. Hernandez J., Pacheco E., Proett M. A., 2011. Enhancing Gas-Reservoir
Characterization by Integrating a Reliable Formation Testing Permeability
Method Into the Workflow, SPE 143084, Brasil Offshore, 14-17 June 2011,
Macaé, Brazil
35. Holditch S. A., 2006. Tight Gas Sands, Texas A & M University, SPE
103356, Journal of Petroleum Technology.
36. Holditch, S. A., 1979. Factors affecting water blocking and gas flow from
hydraulically fractured gas wells, JPT Journal, Volume 31, Number 12, pages
1515-1524
37. Holditch, S. A., 2009. Unlocking the Unconventional Oil and Gas Reservoirs:
Stimulation of Tight Gas Sands, OTC 20267, Offshore Technology
Conference, Houston, Texas.
38. Hossain, M.M. M., and Rahman, M. K., 2008. Numerical simulation of
complex fracture growth during tight reservoir stimulation by hydraulic
fracturing, Journal of Petroleum Science and Engineering, Vol 60, p86–104
39. Hossain, M.M. M., Rahman, M. K. and Rahman, S. S., Hydraulic fracture
initiation and propagation: roles of wellbore trajectory, perforation and stress
regimes, Journal of Petroleum Science and Engineering, Vol 27, 2000, p129–
149
40. Ibrahim M.N.M., Koederitz L.F., 2001. Two Phase Steady State and
Unsteady State Relative Permeability Prediction Models, SPE 68065, SPE
Middle East Oil Show, Bahrain.
41. Ilk D., Rushing J.A., 2008. Exponential vs. Hyperbolic Decline in Tight Gas
Sands, Understanding the Origin and Implications for Reserve Estimates
Using Arps' Decline Curves, SPE 116731, Annual Technical Conference and
Exhibition, Denver, Colorado, USA.

67
42. Ingrid Campbell, An Overview Of Tight Gas Resources In Australia, PESA
news, July 2009
43. Jaeger, J.C., Cook, N.G.W., Zimmerman, R.W., 2007. Fundamentals of Rock
Mechanics, 4th Edition, Blackwell Publishing, 2007, Chapter 12, P 370
44. Jamaluddin A. K. M., Mehta S. A., MooreR. G., 1998. Downhole Heating
Device to Remediate Near-wellbore Formation Damage Related to Clay
Swelling And Fluid Blocking, Document ID: 98-73, SPE Annual Technical
Meeting Calgary, Alberta, Canada.
45. Houze, O., Vituart D., Fjaere, O. S., 2011. Kappa Dynamic Data Analysis,
Kappa engineering, V4.12.01.
46. Kantanong N., Bahrami H., Rezaee R., Hossain M. M., 2012. Effect of sand
lens size and hydraulic fractures orientation on tight gas reservoirs ultimate
recovery, SPE 151037, Middle East Unconventional Gas Conference, Abu
Dhabi, UAE
47. Kupchenko C. L., 2008. Tight Gas Production Performance Using Decline
Curves, SPE 114991, Gas Technology Symposium, Calgary, Canada.
48. Kukal, G.C., Biddison, C.L., Hill, R.E., Monson, E.R., Simons, K.E., 1983.
Critical Problems Hindering Accurate Log Interpretation of Tight Gas Sand
Reservoirs, SPE/DOE Low Permeability Gas Reservoirs Symposium,
Denver, Colorado, USA.
49. Lea, J. F., Nickens, H.V., 2004. Solving Gas-Well Liquid-Loading Problems,
SPE 72092, Journal of Petroleum Technology, Volume 56, Number 4
50. Mahadevan, J., Sharma, M. , Yortsos , Y. C., 2007. Capillary Wicking in Gas
Wells, SPE 103229, SPE Journal, Volume 12, Number 4, pages 429437.
51. Mahadik M.K., Bahrami H., Hossain M., Mitchel P.A.T., 2012. Production
decline analysis and forecasting in tight -gas reservoirs, APPEA Journal
52. Meeks M.H., Susewind K.D., Templeman T.L., 2006. Maximizing Gas
Recovery From Tight Gas Reservoirs In Trawick Field, SPE 101221, Abu
Dhabi International Petroleum Exhibition and Conference.
53. Motealleh, S., Bryant S. L., 2009. Permeability Reduction by Small Water
Saturation in Tight Gas Sandstones, SPE Journal, Volume 14, Number 2,
pages 252-258.
68
54. Ning, X., Holditch S.A., 1990. The measurement of gas relative permeability
for low permeability cores, Annual SCA technical conference, Dallas, Texas,
USA.
55. Northrop, D.A. and Frohne, 1990. The Multi-well Experiment: Field
Laboratory in Tight Gas Sandstone Reservoirs, Journal of Petroleum
Technology (June 1990), 42(6): 772-779
56. Racht, T. D. Van Golf, 1982. Fundamentals of fractured reservoir engineering
, 1st edition, Elsevier
57. Raible, C.J., Gall, B.L., NIPER , Laboratory Formation Damage Studies of
Western Tight Gas Sands, SPE 13903, 1985
58. Rahman M.M., Rahman S.S., Multivariate Fracture Treatment Optimization
for Enhanced Gas Production From Tight Reservoirs, SPE 75702 , 2002
59. Ravari, R.R., Wattenbarger R.A., and Ibrahim M., 2005, Gas Condensate
Damage in Hydraulically Fractured Wells, SPE 93248, Asia Pacific Oil and
Gas Conference and Exhibition, Indonesia
60. Rodgerson, J. L., 2000. Impact of Natural Fractures in Hydraulic Fracturing
of Tight Gas Sands, SPE 59540, Permian Basin Oil and Gas Recovery
Conference, Midland, Texas, USA.
61. Restrepo, D.P., Tiab, D., 2009. Multiple Fractures Transient Response, SPE
121594, Latin American and Caribbean Petroleum Engineering Conference,
Cartagena, Colombia.
62. Rezaee R., Evans B., Rasouli V., Bahrami H., Orsini, C., 2012. Whicher
Range Tight Gas Sands Study (http://www.dmp.wa.gov.au/4726.aspx)
63. Saeedi, Ali, 2012. Experimental study of multi-phase flow in porous media
during CO2 geo-sequestration processes, Springer Theses.
64. Salim P., Li J., 2009. Simulation of Liquid Unloading From a Gas Well With
Coiled Tubing Using a Transient Software, SPE 124195, SPE Annual
Technical Conference and Exhibition, New Orleans, Louisiana.
65. Schlumberger formation testing, 2005. Schlumberger Reservoir Log Analysis
training course handouts, Abu Dhabi, UAE.
66. Schrooten R.A., 2007. A case study: Using Wireline Pressure Measurements
to Improve Reservoir Characterization in Tight Formation Gas Field, IPTC
11545, International Petroleum Technology Conference, Duabi, UAE.
67. Sharif, A., Tight-gas Resources in the Western Australia, PWA Sep 2007

69
68. Teufel, L.W., Natil, Sandia, 1993. Control of Fractured Reservoir
Permeability by Spatial Temporal variations in Stress Magnitude and
Orientation, SPE 26437, SPE annual technical conference, Texas, US.
69. Teufel, L.W., Chen H.Y., Engler T. W., Hart B., 2004. Optimization of Infill
Drilling in Naturally-Fractured Tight-Gas Reservoirs, final report, by New
Mexico Institute of Mining and Technology, submitted to U.S. Department of
Energy and Industry Cooperative.
70. Tiab, D., Restrepo, D.P. and Lgbokoyi, A., 2006. Fracture Porosity of
Naturally Fractured Reservoirs, SPE 104056, First International Oil
Conference and Exhibition in Mexico, Mexico.
71. Tsar M., Bahrami H., Rezaee R., Murickan G., Mehmood S., Ghasemi M.,
Ameri A., Mehdizadeh M, 2012. Effect of Drilling Fluid (Water-Based vs
Oil-Based) on Phase Trap Damage in Tight Sand Gas Reservoirs, SPE
154652, Annual Conference & Exhibition incorporating SPE Europec held in
Copenhagen, Denmark
72. Veeken, C.A.M., Velzen J.F.G., Beukel, J.V.D., 2007. Underbalanced drilling
and completion of SandProne tight gas reservoirs in North Sea, SPE 107673,
European formation damage conference, The Netherlands.
73. Veeken, K. , Hu, B., Schiferli, W., 2009. Transient Multiphase Flow
Modelling of Gas Well Liquid Loading, SPE 123657. Offshore Europe,
Aberdeen, UK
74. Arevalo J. A., Wattenbarger R.A., Samaniego F., Pham T. T., 2001.
Production Analysis of Long-Term Linear Flow in Tight Gas Reservoirs:
Case Histories, SPE 71516, Annual Technical Conference and Exhibition
held in New Orleans, Louisiana, USA.
75. Wang, Y., 2008, Simulation of fracture fluid clean-up and its effect on long
term recovery in tight gas reservoirs, PhD thesis report, Texas A&M
University.
76. Wang Y., Holditch S. A., 2008. Simulation of Gel Damage on Fracture Fluid
Cleanup and Long-Term Recovery in Tight Gas Reservoirs, SPE 117444,
SPE Eastern Regional/AAPG Eastern Section Joint Meeting, Pennsylvania,
USA.
77. Wiprut, D., 2001. Stress, borehole stability, and hydrocarbon leakage in the
North sea, PhD thesis, Stanford University.

70
78. Yili K., Pingya L., 2000. Employing both Damage Control and Stimulation:
A Way to Successful Development for Tight Gas Sandstone Reservoirs, SPE
64707, International Oil and Gas Conference and Exhibition, Beijing, China
79. You, L., Kang, Y., 2009. Integrated Evaluation of Water Phase Trapping
Damage Potential in Tight Gas Reservoirs, SPE 122034, European Formation
Damage Conference, Scheveningen, The Netherlands


73
9 Appendices
9

74
Appendix A:
Water Blocking Damage in Hydraulically Fractured Tight Sand Gas Reservoirs, An
Example from Perth Basin, Western Australia. Journal of Petroleum Science and
Engineering

Journal of Petroleum Science and Engineering xxx (2012) xxx–xxx
PETROL-02224; No of Pages 7
Contents lists available at SciVerse ScienceDirect
Journal of Petroleum Science and Engineering
j ourna l homepage: www.e lsev ie r .com/ locate /pet ro l
Water blocking damage in hydraulically fractured tight sand gas reservoirs: Anexample from Perth Basin, Western Australia
Hassan Bahrami a,⁎, Reza Rezaee a, Ben Clennell b
a Department of Petroleum Engineering, Curtin University, Level 6, ARRC, 26 Dick Perry Ave, Kensington, Perth, Western Australia 6151, Australiab CSIRO, Australia
⁎ Corresponding author.E-mail addresses: [email protected]
[email protected] (R. Rezaee), Ben.Clennell@csiro
0920-4105/$ – see front matter. Crown Copyright © 20doi:10.1016/j.petrol.2012.04.002
Please cite this article as: Bahrami, H., et alPerth Basin, Western Australia, J. Pet. Sci. E
a b s t r a c t
a r t i c l e i n f oArticle history:Received 2 June 2011Revised 15 March 2012Accepted 2 April 2012Available online xxxx
Keywords:tight sand gas reservoirswater blocking damagephase trappinghydraulic fracturingwell productivityreservoir simulation
Tight gas reservoirs normally have production problems due to very low matrix permeability and differentdamage mechanisms during drilling, completion and stimulation operations. Therefore they may not producegas at commercial rates without production optimization and advanced completion techniques.Tight formations have small pore throat size with significant capillary pressure energy suction that imbibesand holds liquid in the capillary pores. Leak-off of liquid from the wellbore into the formation may damagenear wellbore permeability due to water blocking damage and clay swelling, and it can significantly reducewell productivity even in hydraulically fractured tight gas reservoirs.This study presents evaluation of damage mechanisms associated with water invasion and phase trapping intight gas reservoirs. Single well reservoir simulation is performed based on typical West Australian tight gasformation data, in order to understand how water invasion into the formation affects well production perfor-mance in both non-fractured and hydraulically fractured tight gas reservoirs. A field example of hydraulicfracturing in a West Australian tight gas reservoir is shown and the results are analyzed in order to showimportance of damage control in hydraulic fracturing stimulation of low permeability sand formations.The study results highlight that water blacking can be a major damage mechanism in tight gas reservoirs. Inwater sensitive tight sand formations, damage control is essential and the well productivity improvementmay not be achieved in the case of excessive water leak-off into formation during hydraulic fracturingoperations.
Crown Copyright © 2012 Published by Elsevier B.V. All rights reserved.
1. Introduction
Tight gas reservoirs normally have production problems due tovery low matrix permeability and different damage mechanismsduring well drilling, completion, stimulation and production(Fairhurst et al., 2007). The low permeability gas reservoirs can besubject to different damage mechanisms such as mechanical damageto formation rock, plugging of natural fractures by invasion of mudsolid particles, permeability reduction around the wellbore as a resultof filtrate invasion, clay swelling, liquid phase trapping, etc. (Holditch,1979; Civan, 2000).
In general, for tight sand gas reservoirs that are water-wet innature, the average pore throat radius might be very small and there-fore it may create tremendous amounts of potential capillary pressureenergy suction (Mahadevan et al., 2007). As a result, it causes liquidto be imbibed and held in the capillary pores, and may cause criticalwater saturation, the maximum water saturation below which no
du.au (H. Bahrami),.au (B. Clennell).
12 Published by Elsevier B.V. All rig
., Water blocking damage inng. (2012), doi:10.1016/j.pet
water production will occur from a formation, to be high (Bennionand Brent, 2005).
After drilling of high permeable zones, normally strongmud cake isbuilt on the wellbore wall, which stops further invasion of liquid intothe formation. However in tight zones, liquid invasion may continuefor a longer time due to the weak mud cake on the wellbore walland the strong capillary pressure suction effect. In addition, effectivematrix porosity is low, i.e. there is small pore volume, and thereforeinvaded liquid travels deeper into tight rock matrix (Schlumbergerformation testing, 2005).
In hydraulic fracturing, additional problems may be experiencedsuch as formation damage due to excessive fluid leak off, earlywater breakthrough due to fracturing into water leg, poor clean-updue to fluid incompatibility, and proppant back production causingerosion of surface facilities (Abass et al., 2009; Holditch, 1979). Asan alternative option, long horizontal wells drilled in underbalancedconditions may increase lateral reservoir exposure to the wellborewith a minimized damage (Veeken et al., 2007).
Controlling damage is important in tight gas reservoirs as the lowdeliverability and lack of connectivity between the sand bodies, makeit challenging to produce gas at commercial rates (Abass and Ortiz,
hts reserved.
hydraulically fractured tight sand gas reservoirs: An example fromrol.2012.04.002

2 H. Bahrami et al. / Journal of Petroleum Science and Engineering xxx (2012) xxx–xxx
2007; Bahrami et al., 2010). This study evaluates phase trapping andliquid blocking damage effect on gas production for different casesof hydraulically fractured tight gas reservoirs.
Fig. 2. Typical gas and water relative permeability curves, indicating how near wellborepermeability is reduced due to water invasion.
2. Water blocking damage
Tight gas reservoirs might be different in terms of initial watersaturation (Swi) compared with critical water saturation (Swc),depending on the geological time of gas migration to the reservoir.Initial water saturation might be normal, or in some cases lowerthan Swc (sub-normal initial water saturation) due to water phasevaporization into the gas phase as shown in Fig. 1 (Bennion andThomas, 1996). The initial water saturation might also be more thanSwc if the hydrocarbon trap is created during or after the gas migra-tion time. A sub-normal initial water saturation in tight gas reservoirscan provide higher relative permeability for the gas phase (effectivepermeability close to absolute permeability), and therefore relativelyhigher well productivity (Bennion and Brent, 2005).
Liquid invasion into tight formations can increase water saturationaround the wellbore from Swi to a higher value, and then as the nearwellbore zone is cleaned up by gas production, water saturation isreduced gradually, but not further than Swc (Amabeoku et al., 2006).This process as illustrated in Fig. 2, eventually results in the perme-ability at initial conditions, Kr@Swi, to be reduced to Kr@Swc in theinvaded zone. The damaging of permeability is referred as phasetrap damage. The greater difference between initial water saturationand critical water saturation results in a more serious liquid phasetrapping, causing a greater potential damage to gas permeabilityand gas production.
The invaded liquids in the reservoir during drilling or fracturing cancause water phase trapping inside rock pores, and reduce the wellproductivity (Mahadevan et al., 2007). In the case of hydraulic fractur-ing, leak-off of liquid into the formation can be severe and water dam-age may more noticeably affect the well productivity. Tight formationswith sub-normal initial water saturation are significantly sensitive todamage caused by water phase trapping, and therefore water blockingmay plague the success of hydraulic fracturing in low permeability gasreservoirs (Bennion and Brent, 2005).
Water invasionmay also causemechanical damage to the formation.The damagemechanisms such aswater phase trapping, partial blockageof open pores by water, reducing pore openings due to clay swelling,etc., can reduce effective permeability in the water invaded zone(Motealleh and Bryant, 2009). The damaging effects are all reflated ongas and water relative permeability curves and therefore they can beused for evaluation of damage mechanisms.
Water sensitive tight formations may initially have high relativepermeability (Kr@Swi), but very low relative permeability afterbeing exposed to water (Kr@Sgc), as described in Fig. 2. The effectivepermeability in the invaded area of water sensitive tight formations,may not be improved during clean-up period, since water has damagedthe formation, trapped in the invaded zone, and therefore may causesignificant reduction in well productivity.
a bGas
Water
Rock grains
Fig. 1. The concept of normal and sub-normal initial water saturation. a: Sub-normalinitial water saturation (Swi≪Swc). b: Normal initial water saturation (Swi=Swc).
Please cite this article as: Bahrami, H., et al., Water blocking damage inPerth Basin, Western Australia, J. Pet. Sci. Eng. (2012), doi:10.1016/j.pet
3. Significance of damage control in tight gas reservoirs: fieldexample from Perth Basin
The gas field is a large, low permeability tight gas reservoir inPerth Basin. The wells drilled in the tight sand formation had severewellbore instability issues during drilling, that caused wellboreenlargement up to 2–3 times larger than the bit size diameter acrossthe majority of the sandstone intervals.
The tight sandstone gas reservoir is stacks of isolated lenses ofheterogeneous sandbodies that are separated by shale layers, accordingto the field study reports. The reservoir sand bodies and the estimatedaverage water saturation by different petrophysicists for each zoneare shown in Fig. 3. The estimations for water saturation have highuncertainties since quality of petrophysical logsmay have been affectedby formation tightness and significant wellbore enlargement acrossmajority of the sand intervals. Therefore, it is not feasible to commentconfidently on initial water saturation or have evaluations regardingdepth of water invasion into the formation during drilling.
There are limited core data available in the field that were studied toevaluate production performance of the tight gas reservoir. Core porosityand core permeability at the reservoir conditions for the samples thathave core analysis tests data available are shown in Fig. 4. Among thetested cores, only one core sample has reliable relative permeability
Fig. 3. Water saturation variations along wellbore in the tight sand formation in PerthBasin (total net thickness of the porous sand intervals: 370 ft).
hydraulically fractured tight sand gas reservoirs: An example fromrol.2012.04.002

Fig. 4. Corrected permeability and porosity for the core samples of the tight sandformation, which have core analysis tests available.
3H. Bahrami et al. / Journal of Petroleum Science and Engineering xxx (2012) xxx–xxx
datameasured, which has permeability of 0.035 md and porosity of 9.6%(the core sample was taken from the zone Z3 shown in Fig. 3). Themea-sured capillary pressure and relative permeability curves for the coresample are shown in Fig. 5, which indicate critical water saturation of0.6 approximately. The relative permeability curves were measured bycore flooding test, and provided Kr data in the water saturation rangeof 0.6–1.0. For Kr data at water saturations below Swc where Kr couldnot be measured, data extrapolation was performed using the typical
Fig. 5. The relative permeability and capillary pressure curves for the tight sand coresample (core porosity of 9.6%, core permeability of 0.035 md).
Please cite this article as: Bahrami, H., et al., Water blocking damage inPerth Basin, Western Australia, J. Pet. Sci. Eng. (2012), doi:10.1016/j.pet
trend of relative permeability curves (Dacy, 2010). The relative perme-ability to water is significantly lower compared with relative permeabil-ity to gas, indicating sensitivity of formation to water damage. In otherwords, the formation cannot provide considerable production rate inthe case of high water saturation.
A well was drilled using 8.5 in. bit as over-balanced using waterbased mud in the tight sand gas reservoir, and completed as cased-hole perforated. The well produced gas from the main producer zoneafter well completion and clean-up, however gas production ratedeclined sharplywith timeas shown in Fig. 6 (gas production rate beforefracturing).
The well was hydraulically fractured using KCl based fracturingfluid, in order to improve well productivity. During the fracturingjob, approximately 2500 bbl of fracturing fluid was pumped into allthe intervals. It was estimated that about 60% of the fluids wererecovered during post fracturing production test, and 1000 bbl ofwater based treating fluids was not recovered (we believe that thiswas trapped in the reservoir, causing significant damage to reservoirpermeability).
The fracturing designs predicted fracture half length size (Xf) of150–200 ft and fracture conductivity (Kf∗Wf) of 600–700 ft. Howeverthe production tests indicated that the fracturing was not efficient andthe fracture half length size and conductivity might be significantlyless than the predictions. There are no reliablemeasured field data avail-able regarding actual size and conductivity of the hydraulic fracture.
After the hydraulic fracturing and well clean-up, the well gasproduction rate data indicated that the hydraulic fracturing failed toprovide a significant improvement of gas production rate. The post-fracturing to pre-fracturing Production Ratio (the ratio of the post-fracturing stabilized gas production rate after clean-up, to the initialgas production rate before fracturing) is 0.6 approximately, meaningthat the post-fracturing gas production rate is lower compared withthe early time production rate before fracturing, as shown in Fig. 6(gas production after fracturing).
The core samples that were tested and analyzed using X-raydiffraction detected Smectite, meaning that the formation can havemedium to strong sensitivity to fresh or KCl waters. Therefore itcould be concluded that leak-off of water into the tight sand gasreservoir during fracturing, and trapping of 1000 bbl of water insidethe reservoir (not recovered during clean-up), might be the reasonsfor the low well productivity after fracturing.
4. Damage evaluation using reservoir simulation
Water invasion damage can be modeled based on reduction of therelative permeability when water saturation is increased around the
Fig. 6. Production history of a well completed in Perth Basin (pre-fracturing and post-fracturing gas production rates comparison).
hydraulically fractured tight sand gas reservoirs: An example fromrol.2012.04.002

X Y
Z
Fig. 7. Reservoir model 3-D view (showing grid sizes in X, Y and Z directions).
4 H. Bahrami et al. / Journal of Petroleum Science and Engineering xxx (2012) xxx–xxx
wellbore by water injection. The trapping of water phase in the nearwellbore zone is controlled by capillary pressure curve that manageshow the invaded fluid is held inside the reservoir model grids aroundthe wellbore.
Reservoir simulation of the tight gas reservoir was carried out inorder to qualitatively evaluate the effect of water damage on wellproductivity for different cases of non-fractured and hydraulicallyfractured wells in tight gas reservoirs. CMG-IMEX black-oil reservoirsimulator was used to numerically model water invasion and gas pro-duction. The reservoir model 3-D view is shown in Fig. 7, and themodel input data details are reported in Table 1. The reservoirmodel is a simplified homogeneous one, since the details of reservoirheterogeneity are not available.
A vertical well is located at the center of the model, and perforatedacross all the layers. The hydraulic fractures were introduced to themodel by considering a high permeability plane perpendicular tothe wellbore. As there are no field measurements available regardinghydraulic fracture parameter values and also the fracture design pre-dictions were optimistic, some initial guess based on typical values(E&P Focus, 2011)was inputted into themodel. The fracture parameterswere then tuned during matching of the overall production history ofthewell, which resulted in fracture half length size of 75 ft and hydraulicfracture conductivity of 100 md ft approximately (Table 2).
In this simulation study, the initial gas saturation was consideredas 0.4 for the more realistic case, and 0.7 for the optimistic case. Theassumptions are base on average water saturation data from thepetrophysical evaluations shown in Fig. 3, and the irreducible watersaturation of 0.6 from the core flooding test results shown in Fig. 5.
4.1. Effect of water invasion on near wellbore permeability
Water invasion effect in the reservoir model was evaluated byinjecting water at the well location, followed by gas production. Thepreliminary simulation model results for water invasion are shownin Fig. 8‐a to c. First, the matrix grids have initial gas saturation of0.4 (Krg@Sgi=0.4=0.4) as shown in Fig. 8-a.
First, water is injected for 5 days at the rate of 1000 barrels per day(STBD), at the well location, which increases water saturation aroundwellbore. Water saturation at the end of the injection phase is shown
Table 1Details of reservoir simulation model.
No. of grids in x, yand z directions
Grid size (x and y directions)(ft)
Reservoir heig(ft)
50∗50∗71 50 370
Gas S.G. (air=1) Critical water saturation Initial water s
0.6 0.6 0.3 and 0.6
Please cite this article as: Bahrami, H., et al., Water blocking damage inPerth Basin, Western Australia, J. Pet. Sci. Eng. (2012), doi:10.1016/j.pet
in Fig. 8-b (water invasion radius: 9 ft). Afterwards, the model is puton gas production in order to clean-up the invading water, and reducewater saturation around wellbore.
Water saturation at the end of the gas production period is shownin Fig. 8-c (water invasion radius: 12 ft), indicating water saturationof 80% (Kr=0.03) in the invaded zone. During the gas productionphase not only the water saturation cannot be reduced to the criticalwater saturation, but alsowater in the nearwellbore continues invadingreservoir due to strong capillary pressure suction effects. In otherwords,even after water injection is stopped and during gas production phase,damaged zone radius (water invaded radius) increases with passageof time.
4.2. Water invasion damage impact on well gas production rate
The simulation model was run for different cases of normal andsub-normal initial water saturation, in order to understand waterdamaging effect in tight gas reservoirs. For scenario ‘A’ cases, thesimulation models consider normal initial water saturation (Swi=0.6,Swc=0.6), and for scenario ‘B’ cases, themodels have sub-normal initialwater saturation (Swi=0.3, Swc=0.6).
Different cases as detailed in Table 3 were run to understand theeffect of initial water saturation and water invasion damage on gasproduction rate in the cases that there is no liquid invasion damage(models A-1, A-2, A-3, B-1, B-2, B-3), and in the cases there is5 days of water injection with 2000 bbl/day injection rate, prior togas production (models A-4, A-5, A-6, B-4, B-5, B-6). The modelswere run, and the production predictions were plotted as shown inFigs. 9 and 10.
The well gas production rate simulation results for the effect ofinitial water saturation are shown in Fig. 9-a (gas production fornon-fractured well), Fig. 9-b (gas production rate in case of 1 hydraulicfracture) and Fig. 9-c (gas production rate in case of 5 hydraulic frac-tures), which indicate significant impact of Swi on well productivity.For all the cases, sub-normal Swi provided significantly higher gas pro-duction rate.
The simulation results for the effect of water blocking damage intight formations with normal Swi are shown in Fig. 10-a to c. In thecase of non-fractured well, water blocking damage causes significantdrop of gas production rate (Fig. 10-a). However in the cases of frac-tured well, the hydraulic fractures could reduce the negative impactsof water blocking damage (Fig. 10-b and c). With 5 hydraulic fractures,the stabilized gas production rate of the well at the late time is almostsimilar in the cases of damaged and non-damaged wells (A3 and A6),as total area of the fractures is big.
The ratio of the stabilized gas production rate in the case of ahydraulic fractured well damaged by liquid leak-off (Fig. 10, model A5),to the initial gas production rate in the case of no hydraulic fracturesand no liquid leak-off (Fig. 10, model A1) is 0.6 approximately. Thesimulation results for the fractured model to the non-fractured modelProduction Ratio (0.6) are in good agreement with the well actual post-fracturing to pre-fracturing Production Ratio (0.6) shown in Fig. 6,indicating that the simulation results can qualitatively be reliable.
The simulation results related to the significance of damage controlfor well productivity improvement are shown in Fig. 11. In the case of
ht Reservoir permeability(md)
Matrix porosity(%)
0.035 9.6
aturation Initial pressure, psia Reservoir temperature, F
5000 220
hydraulically fractured tight sand gas reservoirs: An example fromrol.2012.04.002
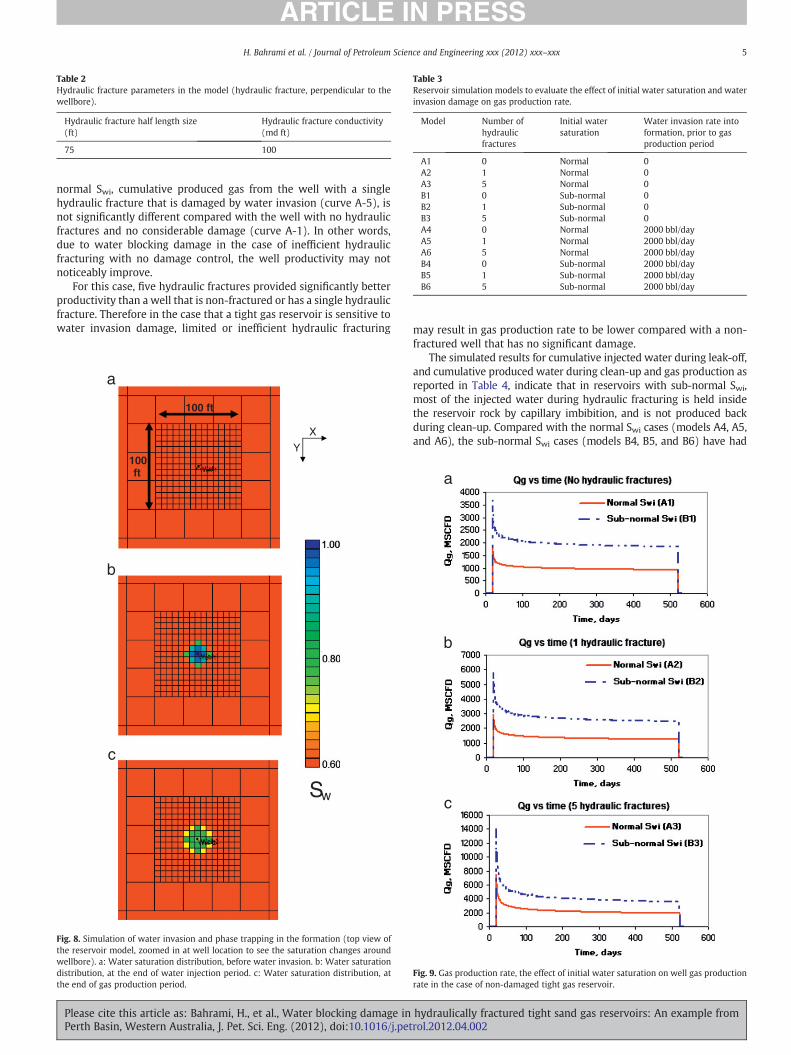
Table 2Hydraulic fracture parameters in the model (hydraulic fracture, perpendicular to thewellbore).
Hydraulic fracture half length size(ft)
Hydraulic fracture conductivity(md ft)
75 100
Table 3Reservoir simulation models to evaluate the effect of initial water saturation and waterinvasion damage on gas production rate.
Model Number ofhydraulicfractures
Initial watersaturation
Water invasion rate intoformation, prior to gasproduction period
A1 0 Normal 0A2 1 Normal 0A3 5 Normal 0B1 0 Sub-normal 0B2 1 Sub-normal 0B3 5 Sub-normal 0A4 0 Normal 2000 bbl/dayA5 1 Normal 2000 bbl/dayA6 5 Normal 2000 bbl/dayB4 0 Sub-normal 2000 bbl/dayB5 1 Sub-normal 2000 bbl/dayB6 5 Sub-normal 2000 bbl/day
5H. Bahrami et al. / Journal of Petroleum Science and Engineering xxx (2012) xxx–xxx
normal Swi, cumulative produced gas from the well with a singlehydraulic fracture that is damaged by water invasion (curve A-5), isnot significantly different compared with the well with no hydraulicfractures and no considerable damage (curve A-1). In other words,due to water blocking damage in the case of inefficient hydraulicfracturing with no damage control, the well productivity may notnoticeably improve.
For this case, five hydraulic fractures provided significantly betterproductivity than a well that is non-fractured or has a single hydraulicfracture. Therefore in the case that a tight gas reservoir is sensitive towater invasion damage, limited or inefficient hydraulic fracturing
a
b
c
Sw
100 ft
X
Y 100 ft
Fig. 8. Simulation of water invasion and phase trapping in the formation (top view ofthe reservoir model, zoomed in at well location to see the saturation changes aroundwellbore). a: Water saturation distribution, before water invasion. b: Water saturationdistribution, at the end of water injection period. c: Water saturation distribution, atthe end of gas production period.
Please cite this article as: Bahrami, H., et al., Water blocking damage inPerth Basin, Western Australia, J. Pet. Sci. Eng. (2012), doi:10.1016/j.pet
may result in gas production rate to be lower compared with a non-fractured well that has no significant damage.
The simulated results for cumulative injected water during leak-off,and cumulative produced water during clean-up and gas production asreported in Table 4, indicate that in reservoirs with sub-normal Swi,most of the injected water during hydraulic fracturing is held insidethe reservoir rock by capillary imbibition, and is not produced backduring clean-up. Compared with the normal Swi cases (models A4, A5,and A6), the sub-normal Swi cases (models B4, B5, and B6) have had
a
b
c
Fig. 9. Gas production rate, the effect of initial water saturation on well gas productionrate in the case of non-damaged tight gas reservoir.
hydraulically fractured tight sand gas reservoirs: An example fromrol.2012.04.002

a
b
c
Fig. 10. Gas production rate, the effect of water blocking damage onwell gas productionrate in the case of normal initial water saturation.
Table 4Simulation results for ‘water injection prior to gas production’ and ‘water productionduring well clean-up’.
Simulation resultsfor water production/injection
Scenarios Cumulativeinjected water(bbl)
Cumulativeproduced water(bbl)
A1, A2, A3, B1, B2, B3 No water invasionprior to gas production
– –
A4, normal Swi,no frac
2000 bbl/day waterinjection prior togas production
1829 829
A5, normal Swi, 1 frac 1872 911A6, normal Swi,5 fracs
2046 1164
B4, sub-normal Swi,no frac
4443 134
B5, sub-normal Swi,1 frac
4472 146
B6, sub-normal Swi,5 fracs
4600 192
6 H. Bahrami et al. / Journal of Petroleum Science and Engineering xxx (2012) xxx–xxx
larger leak-off of liquid into formation, and significantly smaller volumeof cumulative water produced back. In other words, water phase trap-ping damage in more significant in tight gas reservoirs that have sub-normal initial water saturation.
Fig. 11. Cumulative produced gas, comparison of ‘non-damaged and no hydraulicfracture’ with ‘damaged with hydraulic fracture’ in the tight gas reservoir.
Please cite this article as: Bahrami, H., et al., Water blocking damage inPerth Basin, Western Australia, J. Pet. Sci. Eng. (2012), doi:10.1016/j.pet
The reservoir simulation results confirm that water blockingdamage may cause well productivity to be low even after hydraulicfracturing.
5. Discussion
Tight gas reservoirs with sub-normal initial water are more sensi-tive to phase trap damage, andwater blocking can significantly reducetheir productivity. If a reservoir has normal initial water saturationand it is not sensitive to water damage, single or multiple hydraulicfracturing can improve well productivity.
In tight formations that are sensitive to the damage mechanismsassociated with water, special considerations need to be taken intoaccount in designing hydraulic fracturing since it may cause excessivefluid leak off into the formation. In hydraulic fracturing, the injectedfluid should be compatible with formation and do not cause clayswelling. If massive hydraulic fracturing cannot be performed, drillinglong horizontal/deviated wells in underbalanced conditions usingnon-aqueous drilling fluid and completing the well as open-hole maybe a more efficient option since it increases formation area open toflow into wellbore, minimizes damage, and therefore enhances gasproduction rate.
6. Conclusions
Based on the simulation results, the following conclusions can bedrawn:
(1) Water blocking is one of the major damage mechanisms intight sand gas reservoirs due to relative permeability andstrong capillary pressure suction effects.
(2) Liquid invasion into formation during drilling or fracturing oftight gas reservoirs can cause trapping of water phase in theinvaded zone around the wellbore. Due to capillary suctioneffects, water may continue invading into the formation evenduring gas production phase.
(3) Water phase trapping damage in more significant in tight gasreservoirs that have sub-normal initial water saturation.
(4) Damage control is essential in the tight sand formations that aresensitive to water damage, and leak-off of water into formationmay plague the success of hydraulic fracturing operations.
(5) Inefficient hydraulic fracturing in the tight formations that aresensitive to water invasion damage may result in gas productionrate to be lower comparedwith a non-fracturedwell that has notbeen damaged.
hydraulically fractured tight sand gas reservoirs: An example fromrol.2012.04.002

7H. Bahrami et al. / Journal of Petroleum Science and Engineering xxx (2012) xxx–xxx
(6) Multiple-stage hydraulic fracturing that significantly increasesarea of the formation open to flow can help achieving economicalgas production rate from water sensitive tight gas reservoirs.
NomenclatureSwc critical water saturation (Swc) defines the maximum water
saturation for a formation with a given permeability andporosity below which no water production will occur. Con-versely water saturations in excess of Swc will permit waterto flow from the reservoir (Tarek Ahmed, 2000)
Sw, Irr Irreducible Water Saturation is the lowest water saturationthat can be achieved in a core plug by displacing the waterby gas (Tarek Ahmed, 2000)
Sw, connate Connate Water Saturation is water trapped in the poresof a rock during formation of the rock
Swi Initial Water Saturation is water saturation at initial reservoirconditions (Tarek Ahmed, 2000)
Sgc critical gas saturationSgi initial gas saturationP pressureQ flow ratet timeK permeabilityS skinQg gas production rateQw water production ratePc capillary pressureKr relative permeabilityKf fracture permeabilityWf fracture apertureXf fracture half length sizeUB underbalancedOB overbalancedMMSCFD million standard cubic feet per day
Acknowledgments
The authors would like to appreciate CMG (Computer ModellingGroup) for use of CMG-IMEX software, and thankful to Colin Williams
Please cite this article as: Bahrami, H., et al., Water blocking damage inPerth Basin, Western Australia, J. Pet. Sci. Eng. (2012), doi:10.1016/j.pet
(Curtin University), James C. Erdle (CMG), and Po Chu Byfield (StrategyCentral) for their valuable guides and helpful discussions in this study.
References
Abass, H., Ortiz, I., 2007. Understanding stress dependant permeability of matrix, natu-ral fractures, and hydraulic fractures in carbonate formations. SPE 110973, SPESaudi Arabia Technical Symposium.
Abass, H., Sierra, L., Tahini, A., 2009. Optimizing proppant conductivity and number ofhydraulic fractures in tight gas sand wells. SPE 126159, SPE Technical Symposium,Saudi Arabia.
Ahmed, Tarek, 2000. Handbook of Reservoir Engineering, second edition. Elsevier'sScience & Technology publishing, p. 191 (Chapter 4).
Amabeoku, M.O., Kersey, D.G., BinNasser, R.H., Belowi, A.R., 2006. Relative permeabilitycoupled saturation-height models based on hydraulic flow units in a gas field. SPE102249, SPE Annual Technical Conference and Exhibition, Texas, USA.
Bahrami, H., Rezaee, M., Asadi, S., 2010. Stress anisotropy, long-term reservoir flow re-gimes and production performance in tight gas reservoirs. SPE Eastern RegionalMeeting held in Morgantown, West Virginia, USA.
Bennion, D.B., Brent, F., 2005. Formation damage issues impacting the productivity oflow permeability, low initial water saturation gas producing formations. J. EnergyRes. Technol. 127, 240–246.
Bennion, D.B., Thomas, F.B., 1996. Low permeability gas reservoirs: problems, opportu-nities and solutions for drilling, completion, stimulation and production. SPE35577, SPE Gas Technology Conference, Calgary, Canada.
Civan, Faruk, 2000. Reservoir Formation Damage. Gulf Publishing Company, Texas,USA, pp. 262–279 (chapter 12).
Dacy, John M., 2010. Core tests for relative permeability of unconventional gas reser-voirs. SPE 135427, SPE Annual Technical Conference and Exhibition, Florence, Italy.
E&P Focus newsletter, summer 2011. Creating extensive, conductive hydraulic fracturesin low permeability gas reservoir, National Energy Technology Laboratory, page 16.
Fairhurst, D.L., Indriati, S., Reynolds, B.W., 2007. Advanced technology completionstrategies for marginal tight gas sand reservoirs: a production optimization casestudy in south Texas. SPE 109863, SPE Annual Technical Conference and Exhibi-tion, California, U.S.A.
Holditch, S.A., 1979. Factors affecting water blocking and gas flow from hydraulicallyfractured gas wells. JPT J. 31 (12), 1515–1524.
Mahadevan, J., Sharma, M., Yortsos, Y.C., 2007. Capillary wicking in gas wells, SPE103229. SPE J. 12 (4), 429–437.
Motealleh, S., Bryant, S.L., 2009. Permeability reduction by small water saturation intight gas sandstones. SPE J. 14 (2), 252–258.
Schlumberger formation testing, 2005. Schlumberger Reservoir Log Analysis TrainingCourse Handouts, Abu Dhabi, UAE.
Veeken, C.A.M., Velzen, J.F.G., Beukel, J.V.D., 2007. Underbalanced drilling and comple-tion of Sand-Prone tight gas reservoirs in North Sea. SPE 107673, European forma-tion damage conference, The Netherlands.
hydraulically fractured tight sand gas reservoirs: An example fromrol.2012.04.002

75
Appendix B:
Characterizing Natural Fractures Productivity in Tight Gas Reservoirs, Journal of
Petroleum Exploration and Production Technology
ORIGINAL PAPER - PRODUCTION ENGINEERING
Characterizing natural fractures productivity in tight gasreservoirs
Hassan Bahrami • Reza Rezaee • Mofazzal Hossain
Received: 17 March 2012 / Accepted: 25 June 2012
� The Author(s) 2012. This article is published with open access at Springerlink.com
Abstract Tight formations normally have production
problems mainly due to very low matrix permeability and
various forms of formation damage that occur during
drilling completion and production operation. In naturally
fractured tight gas reservoirs, gas is mainly stored in the
rock matrix with very low permeability, and the natural
fractures have the main contribution on total gas produc-
tion. Therefore, identifying natural fractures characteristics
in the tight formations is essential for well productivity
evaluations. Well testing and logging are the common tools
employed to evaluate well productivity. Use of image log
can provide fracture static parameters, and welltest analysis
can provide data related to reservoir dynamic parameters.
However, due to the low matrix permeability and com-
plexity of the formation in naturally fractured tight gas
reservoirs, welltest data are affected by long wellbore
storage effect that masks the reservoir response to pressure
change, and it may fail to provide dual-porosity dual-per-
meability models dynamic characteristics such as fracture
permeability, fracture storativity ratio and interporosity
flow coefficient. Therefore, application of welltest and
image log data in naturally fractured tight gas reservoirs for
meaningful results may not be well understood and the data
may be difficult to interpret. This paper presents the esti-
mation of fracture permeability in naturally fractured tight
gas formations, by integration of welltest analysis results
and image log data based on Kazemi’s simplified model.
Reservoir simulation of dual-porosity and dual-permeabil-
ity systems and sensitivity analysis are performed for dif-
ferent matrix and fracture parameters to understand the
relationship between natural fractures parameters with
welltest permeability. The simulation results confirmed
reliability of the proposed correlation for fracture perme-
ability estimation. A field example is also shown to dem-
onstrate application of welltest analysis and image log data
processing results in estimating average permeability of
natural fractures for the tight gas reservoir.
Keywords Fracture permeability � Tight gas reservoirs �Natural fractures characterisation � Welltest analysis
List of symbols
P Pressure
K (Perm) Permeability
Q Flow rate
C Compressibility
t Time
h Layer thickness
r Radius
u (Poro) Porosity
a Fracture spacing
b Fracture aperture
d Shape factor
k Interporosity flow coefficient
x Fracture storativity
l Viscosity
B Formation volume factor
H. Bahrami (&) � R. Rezaee � M. Hossain
Department of Petroleum Engineering, Curtin University,
Level 6, ARRC, 26 Dick Perry Ave, Kensington, Perth 6151,
Australia
e-mail: [email protected]
R. Rezaee
e-mail: [email protected]
M. Hossain
e-mail: [email protected]
123
J Petrol Explor Prod Technol
DOI 10.1007/s13202-012-0026-x

NFR Naturally fractured reservoirs
TGR Tight gas reservoirs
Subscripts
f Fracture
m Matrix
Introduction
A naturally fractured reservoir is mainly a network of
natural fractures and matrix which are randomly distrib-
uted. Characterization of the natural fractures generally
includes estimating the dynamic parameters such as frac-
ture permeability, and determining the static parameters
such as fracture spacing (matrix block size), fracture
aperture and fracture porosity (Racht and Golf 1982).
The most common geometrical representations of frac-
tured reservoirs are the models introduced by Warren-Root
and Kazemi as shown in Fig. 1, assuming that discrete
matrix blocks are separated by an orthogonal system of
continuous and uniform fractures. The matrix blocks are
assumed to be isotropic and homogeneous identical rect-
angular parallelepipeds with no direct communication
between them (Kazemi et al. 1976). The simplified models
have been introduced to simulate flow through naturally
fractured reservoirs. The double porosity domain assumes a
continuous uniform fracture network oriented parallel to
the principal axes of permeability.
In many of the naturally fractured reservoirs, fracture
permeability can be the major controlling factor of the flow
of fluids. Fracture permeability in a dual-porosity and dual-
permeability reservoir is the permeability that is associated
with the secondary porosity created by open natural frac-
tures (Racht and Golf 1982). The main dynamic parameters
commonly used to describe matrix and interconnecting
fracture network are interporosity flow coefficient (k) and
fracture storativity ratio (x) that are defined as follows
(Tiab et al. 2006):
k ¼ dKm
Kfr2
w ð1Þ
x ¼uf � Cf
uf � Cf þ um � Cmð2Þ
Where Km is matrix permeability, Kf is fracture
permeability, rw is wellbore radius, uf is fracture porosity,
um is matrix porosity, Cf is fracture compressibility, Cm is
matrix compressibility, and d is shape factor and it is
defined as follows:
d ¼ 4 1�
a2X þ 1
�a2
Y þ 1�
a2Z
� �ð3Þ
In Eq. (3), ax, ay and az are matrix block size
respectively in x, y and z directions (Reiss 1980). In the
case of Kazemi model (ax � az and ay � az), the shape
factor, d, is considered to be 4�
a2. The smaller value of k(higher fracture permeability) and/or the larger value of x(higher fracture porosity) result in higher well productivity.
The dual-porosity and dual-permeability reservoirs’
dynamic parameters can be estimated using welltest analy-
sis. As illustrated in Fig. 2, a Semi-Log plot of pressure
build-up data results in two parallel lines, which the slope
gives average permeability, the vertical separation between
the parallel lines (DPx) can provide fracture storativity ratio,
and the DP at mid-point of the transition period (DPk) can
estimate interporosity flow coefficient (Saeidi Ali 1987).
The main input parameters required to model fluid flow
through a naturally fractured formation are fracture per-
meability, fracture porosity and shape factor (Kazemi et al.
1976). The matrix block size (fracture spacing) to compute
the shape factor is primarily obtained from borehole ima-
ges. The fracture spacing can be attained using results of
any type of borehole images (regardless of the drilling mud
system used). However, in the case of water-based mud
imaging (e.g., FMI), image log processing can also provide
fracture aperture and porosity as an additional output of
fracture analysis (Dashti and Bagheri 2009; Luthi 1990).
Integrating the welltest results with image log process-
ing results for fracture spacing, and core data for matrix
porosity, permeability and compressibility, can be used to
estimate fracture permeability and fracture porosity from
Eqs. (1) and (2) (Tiab et al. 2006):
uf ¼ um
Cm
Cf
x1� x
ð4Þ
Kf ¼ dKm
kr2
w ð5Þ
Equations (4) and (5) can determine fracture
permeability and fracture porosity, in the case that the
dual-porosity response is clearly observed on pressure
build-up diagnostic plots, and x and k values can be
estimated certainly. Fracture compressibility in the fracture
porosity estimation [Eq. (4)] may have uncertainties
(maybe 1–100 folds higher than matrix compressibility)
and might be estimated using well testing (Tiab et al. 2006).Fig. 1 Dual porosity–dual permeability system (Warren-Root and
Kazemi simplified models)
J Petrol Explor Prod Technol
123

The image log porosity can be used to verify accuracy of
average fracture porosity estimated from welltest analysis.
In tight reservoirs, the very low matrix permeability,
complexity of the formation, and long wellbore storage
effect may mask the reservoir response to the pressure
change during transient testing. Although one can estimate
the average permeability value from welltest data in tight
reservoirs using advanced welltest interpretation tech-
niques (Bahrami et al. 2010), estimating fracture storativity
and interporosity flow coefficient from such welltest data
might not be feasible since the dual-porosity response may
not clearly be observed on pressure build-up diagnostic
plots. The conventional approaches might fail to charac-
terize fracture parameters in naturally fractured tight gas
reservoirs, especially in complicated cases such as
hydraulically fractured or horizontally drilled wells (Rest-
repo and Tiab 2009), and therefore application of welltest
and image log data in the reservoirs may not be well
understood and is proved to be difficult to interpret for
meaningful results.
Natural fractures characterisation in tight gas
reservoirs
Analysis of acquired data from a tight gas reservoir may
provide limited information about the formation character-
istics, due to some restrictions such as type of the drilling
fluid, complicated and slow response of reservoir, not long
enough testing time, etc. (Garcia et al. 2006). Hence, a simple
model needs to be used that requires minimum data inputs in
determining fracture parameters. The model introduced by
Kazemi as shown in Fig. 3 can be used to build a simple
dual-porosity and dual-permeability system of naturally
fractured tight gas reservoirs. Considering Kazemi model
that assumes parallel layers of matrix and fracture in a
uniform fracture network model, similar fracture perme-
ability and aperture for the fracture layers and similar matrix
permeability and block size for the matrix layers, then
average reservoir permeability based on thickness of matrix
and fracture layers (Bourdarot 1998) can be expressed as
follows:
K � haverage ¼Xm¼1;...;n
matrix
ðKm � aÞ þXf¼1;...;n
fracture
ðKf � bÞ ð6Þ
h ¼ ðn � aÞ þ ðn � bÞ ð7Þ
where Kf is permeability of a natural fracture, b is average
fracture aperture, a is average matrix block thickness, K is
welltest permeability, Km is average permeability of the
matrix blocks, h is reservoir thickness, n is number of
fractures intersecting the wellbore across the reservoir, uf
is fracture porosity (fraction), n*a is cumulative matrix
block thickness, and n*b is cumulative fracture aperture.
Combining Eqs. (6) and (7) results in the following
simplified equation [Eq. (8)], using the assumption of
a � b, Kf � Kwelltest and Kf � Km for tight gas reservoirs:
Kf ¼ Kwelltest �a
bð8Þ
Fig. 2 Pressure transient
behavior in naturally fractured
reservoirs
Fig. 3 Kazemi model parameters for naturally fractured reservoirs
J Petrol Explor Prod Technol
123

Since Eq. (8) is based on simplified models and
assumptions, using some correction factors might provide
more realistic relationship between fracture dynamic
parameters. Considering the correction factor, fracture
permeability can be expressed in the following generalized
form:
Kf ¼ C1 � Kwelltest �a
b
� �C2
ð9Þ
The constants C1 and C2 in Eq. (9) are the correction
factors that need to be determined from numerical simulation
and sensitivity analysis. Using the Eq. (9), natural fractures
permeability can be estimated as function of average
permeability 9 thickness (from welltest analysis) and
average fracture spacing and aperture (from image log
processing results). Once the natural fracture parameters are
estimated, then using Eqs. (1) and (2) fracture storativity
ratio and interporosity flow coefficient can be estimated for
welltest design applications, well productivity evaluation,
and gas production rate forecasting.
Effect of natural fracture parameters on welltest
response
To evaluate natural fracture parameters in tight gas reser-
voirs, reservoir simulation is performed based on the field
data from a tight gas reservoir, using the widely used
commercial CMG (Computer Modeling Group of Calgary)
numerical reservoir simulation software. The model is fully
implicit in its basic formulation, and the nonlinear equa-
tions in the software are solved by Newtonian iteration
with the derivatives of the Jacobian matrix evaluated
numerically (Odeh and Aziz 1981).
Reservoir simulation model for dual-porosity and dual-
permeability systems is developed by considering matrix
layers that have been separated by fracture layers as
described in Fig. 3. A well is considered at the center of the
model, which has been completed in all the matrix and
fracture layers with no flow boundary. The reservoir model
has been shown in Fig. 4 and the input data used in the
reservoir simulation are provided in Table 1.
Different simulation models are run with different
fracture parameters to analyse sensitivity of pressure build-
up response outputs to each fracture parameter. The sen-
sitivity analysis is performed for different matrix and
fracture parameters to understand the relationship between
natural fractures static and dynamic parameters. The sim-
ulation model scenarios are provided in Table 2. Each
simulation run consists of a production period with gas
production rate of 500 MSCFD, followed by pressure
build-up period. The pressure build-up data are analysed to
estimate welltest permeability for each dual-porosity dual
permeability system, and then determine the relationship
between each fracture parameter and welltest analysis
results.
First, the model is run for different fracture aperture
values of 0.1, 1 and 10 mm. Analysis of pressure draw-
down data from the simulation runs is shown in Fig. 5. The
early time data are affected by wellbore storage effect and
Fig. 4 Reservoir model 3D view, 50 grids in X direction, 50 grids in
Y direction and 71 girds in Z direction (36 horizontal matrix layers, 35
horizontal fracture layers)
Table 1 Input data to the simulation base model
No of grids in X direction 50 – Matrix compressibility 4E-06 1/psia
No of grids in Y direction 50 – Fracture compressibility 4E-06 1/psia
No of matrix layers 36 – Fracture layer porosity 100 %
No of fracture layers 35 – Matrix layer porosity 8 %
Grid size in X direction 70 ft Gas S.G. 0.65 –
Grid size in Y direction 70 ft Reservoir pressure 3000 psia
Fracture layer thickness 1 mm Reservoir temperature 180 F
Fracture spacing 5 ft Net thickness 180 ft
Matrix permeability 0.1 md Wellbore radius 0.25 ft
Fracture permeability 50000 md Gas production rate 500 MSCFD
J Petrol Explor Prod Technol
123

the typical dual-porosity response that is then followed by
infinite acting radial flow zero slope line. The late time data
are affected by no flow boundary effect, that in the case of
higher fracture permeability, its response is reached earlier.
Fracture aperture of 0.1, 1 and 10 mm resulted in welltest
Table 2 Input data to the simulation base model
Sensitivity analysis simulation scenarios
Fracture aperture mm 0.1, 1, 10
Fracture spacing ft 5, 10, 20
Permeability of fracture layer Darcies 10, 50, 100
Porosity of fracture layer fraction 0.6, 0.8, 1
Matrix compressibility 1/psia 4E-5, 4E -6, 4E-7
Fracture compressibility 1/psia 4E-5, 4E-6, 4E-7
Matrix permeability md 0.005, 0.1, 2
Fig. 5 Effect of fracture aperture (b) on welltest permeability
Fig. 6 Effect of fracture permeability (Kf) on welltest permeability
Fig. 7 Effect of matrix permeability (Km) on welltest permeability
Fig. 8 Effect of matrix compressibility (Cm) on welltest permeability
Fig. 9 Effect of fracture compressibility (Cf) on welltest
permeability
J Petrol Explor Prod Technol
123

permeability of 2.7, 29.4, and 316 md, respectively.
Similarly, the effect of fracture permeability, matrix per-
meability, matrix compressibility, fracture compressibility,
matrix porosity, fracture porosity and fracture spacing are
shown in Figs. 6, 7, 8, 9, 10, 11 and 12.
Among the parameters examined in the sensitivity
analysis, it is observed that only fracture aperture, fracture
permeability and matrix block size (fracture spacing) have
posed significant impact on welltest permeability, and the
effect of other parameters such as matrix permeability,
compressibility of matrix and fracture, and porosity of
matrix and fracture can be disregarded. Figure 13 shows
the relationship between welltest permeability and each of
the main fracture parameters. The observations on the
reservoir simulation results are in good agreement with the
derived Eq. (8):
• Fracture permeability is mainly function of welltest
permeability, fracture aperture and fracture spacing.
• Fracture permeability has linear relationship with
matrix block size and welltest permeability, and inverse
relationship with fracture aperture (i.e., if Kf is
increased, to match the welltest permeability, b should
be reduced).
Combining the curve fitting functions shown in Fig. 13
results in the following equation [Eq. (10)]:
Kf ¼ 0:795 � Kwelltest �a
b
� �1:04
ð10Þ
where Kf is fracture permeability in md, b is fracture
aperture in ft and a is fracture spacing in ft. The plot of
estimated welltest permeability [from Eq. (10)] versus
model welltest permeability has been shown in Fig. 14.
Comparing the actual simulation outputs and the results
from the Eq. (10), it can be observed that the average error
is around 5 %, indicating that the multi-variable regression
results for the constants C1 and C2 are reliable.
The proposed method [Eq. (10)] is based on Kazemi
dual-porosity dual-permeability model that has a layered
formation, and therefore this approach may perform rea-
sonably well in the formations with high density low angle
fracture network, more specifically in the range of the
fracture parameters used in sensitivity analysis. The
approach is fairly simple, and deeply rooted in the simpli-
fied vision of the fractured rock of the Kazemi model, and
may provide good first guess values for fracture parameters.
The estimated fracture parameters can be considered as
initial guess in reservoir simulation models for naturally
fractured tight gas reservoirs, and then be tuned during
history matching to get more reliable results for natural
fractures productivity and their contribution on total gas
production.
Fig. 10 Effect of matrix porosity (PoroM) on welltest permeability
Fig. 11 Effect of fracture porosity (PoroF) on welltest permeability
Fig. 12 Effect of fracture spacing (a) on welltest permeability
J Petrol Explor Prod Technol
123

Field example: fracture characterization
For a well completed in a naturally fractured tight gas
reservoir (with average matrix permeability of 0.1 md),
results of welltest data, core analysis, and image log in
water-based mud processing are studied and integrated to
characterize fracture parameters.
Pressure fall-off test was performed in this well by
injecting water for a period of time, followed by pressure
fall-off test. Pressure transient data analysis results are
shown in Fig. 15, in which the results showed average
permeability of 75 md for the naturally fractured forma-
tion. The Formation Micro Imaging (FMI) Log data
acquired after the well drilling using water-based mud was
also studied. The results for fracture distribution, fracture
aperture and fracture porosity are shown in Table 3 and
Figs. 16, 17 and 18. The data processing results in this
well-showed average fracture porosity of 0.3 %, average
matrix block size of 0.93 ft, and average fracture aperture
of 0.1 mm. Using welltest permeability and image log
fracture spacing and aperture as input data into Eq. (10), it
resulted in fracture permeability of 174,000 md.
It should be noted that in this case, the image log frac-
ture parameters might be different compared with fracture
parameters during the pressure transient testing. Injection
of water prior to pressure fall-off test may have increased
aperture of natural fractures in the water invaded reservoir
zone around wellbore (over estimating actual fracture
Fig. 13 Relationship between
fracture parameters and welltest
permeability
Fig. 14 Welltest permeability from the model, versus welltest
permeability calculated from Eq. (10)Fig. 15 Pressure transient testing analysis and results
J Petrol Explor Prod Technol
123

permeability from welltest data). In the case of pressure
drawdown followed by pressure build-up, the results for
fracture permeability might be different.
Conclusions
• Natural fractures in the tight formations make signifi-
cant contribution on production, and therefore it is
essential to estimate their dynamic characteristics.
• In tight formations, due to the weak reservoir response
to pressure disturbance, the interporosity flow coeffi-
cient and fracture storativity coefficients might not be
possible.
• Welltesting analysis in tight gas reservoirs has uncer-
tainties and may not directly provide characterisation of
fracture dynamic parameters such as fracture storativity
and interporosity flow coefficient.
• Welltest permeability is mainly controlled by fracture
permeability, matrix block size and fracture aperture,
and it is not very sensitive to matrix permeability,
matrix and fracture compressibilities, and matrix and
fracture porosities.
• In addition to petrophysical evaluation, results that
provide important input for welltest analysis of con-
ventional reservoirs, image log data are needed in
welltest analysis of naturally fractured tight gas
reservoirs.
Table 3 Natural fractures data summary
Image log processing results
Average fracture density 1/ft 1.04
Number of open fractures (n) – 57
Average matrix block size (a) ft 0.97
Average Fracture Aperture (b) mm 0.1
Average Fracture Porosity (uf) % 0.3
Fracture permeability from Eq. (10)
Estimated fracture permeability (Kf) md 174,000
Fig. 16 Fracture distribution data from Image Log processing results
(Net reservoir thickness 57 ft)
Fig. 17 Fracture porosity data from Image Log processing results
Fig. 18 Fracture aperture data from Image Log Processing Results
J Petrol Explor Prod Technol
123
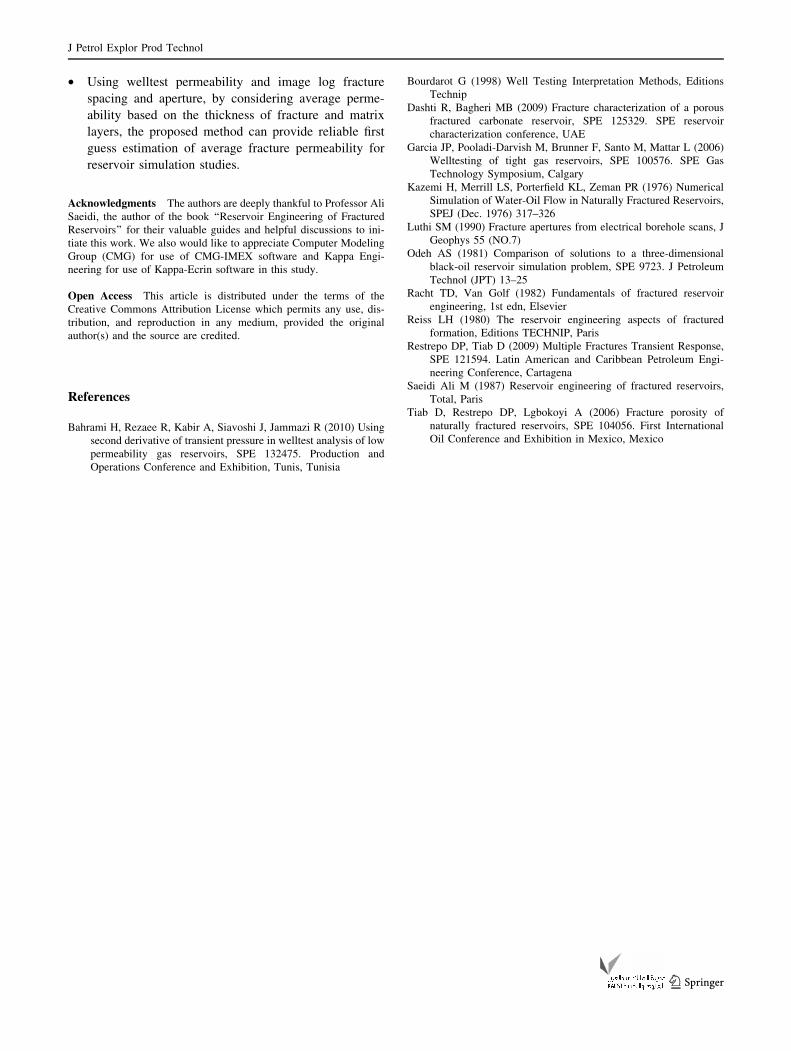
• Using welltest permeability and image log fracture
spacing and aperture, by considering average perme-
ability based on the thickness of fracture and matrix
layers, the proposed method can provide reliable first
guess estimation of average fracture permeability for
reservoir simulation studies.
Acknowledgments The authors are deeply thankful to Professor Ali
Saeidi, the author of the book ‘‘Reservoir Engineering of Fractured
Reservoirs’’ for their valuable guides and helpful discussions to ini-
tiate this work. We also would like to appreciate Computer Modeling
Group (CMG) for use of CMG-IMEX software and Kappa Engi-
neering for use of Kappa-Ecrin software in this study.
Open Access This article is distributed under the terms of the
Creative Commons Attribution License which permits any use, dis-
tribution, and reproduction in any medium, provided the original
author(s) and the source are credited.
References
Bahrami H, Rezaee R, Kabir A, Siavoshi J, Jammazi R (2010) Using
second derivative of transient pressure in welltest analysis of low
permeability gas reservoirs, SPE 132475. Production and
Operations Conference and Exhibition, Tunis, Tunisia
Bourdarot G (1998) Well Testing Interpretation Methods, Editions
Technip
Dashti R, Bagheri MB (2009) Fracture characterization of a porous
fractured carbonate reservoir, SPE 125329. SPE reservoir
characterization conference, UAE
Garcia JP, Pooladi-Darvish M, Brunner F, Santo M, Mattar L (2006)
Welltesting of tight gas reservoirs, SPE 100576. SPE Gas
Technology Symposium, Calgary
Kazemi H, Merrill LS, Porterfield KL, Zeman PR (1976) Numerical
Simulation of Water-Oil Flow in Naturally Fractured Reservoirs,
SPEJ (Dec. 1976) 317–326
Luthi SM (1990) Fracture apertures from electrical borehole scans, J
Geophys 55 (NO.7)
Odeh AS (1981) Comparison of solutions to a three-dimensional
black-oil reservoir simulation problem, SPE 9723. J Petroleum
Technol (JPT) 13–25
Racht TD, Van Golf (1982) Fundamentals of fractured reservoir
engineering, 1st edn, Elsevier
Reiss LH (1980) The reservoir engineering aspects of fractured
formation, Editions TECHNIP, Paris
Restrepo DP, Tiab D (2009) Multiple Fractures Transient Response,
SPE 121594. Latin American and Caribbean Petroleum Engi-
neering Conference, Cartagena
Saeidi Ali M (1987) Reservoir engineering of fractured reservoirs,
Total, Paris
Tiab D, Restrepo DP, Lgbokoyi A (2006) Fracture porosity of
naturally fractured reservoirs, SPE 104056. First International
Oil Conference and Exhibition in Mexico, Mexico
J Petrol Explor Prod Technol
123

76
Appendix C:
Welltest analysis of hydraulically fractured tight gas reservoirs: An Example from
Perth Basin, Western Australia. APPEA Journal

APPEA Journal 2012—1second proof—bahrami 6 mar 12
H. Bahrami, V. Jayan, R. Rezaee and M. Hossaindepartment of petroleum engineeringcurtin University 613 (rear), Level 6, arrc26 dick perry ave, Kensingtonperth Wa [email protected]
abstract
Welltest interpretation requires the diagnosis of reservoir flow regimes to determine basic reservoir characteristics. In hydraulically fractured tight gas reservoirs, the reservoir flow regimes may not clearly be revealed on diagnostic plots of transient pressure and its derivative due to extensive well-bore storage effect, fracture characteristics, heterogeneity, and complexity of reservoir. Thus, the use of conventional welltest analysis in interpreting the limited acquired data may fail to provide reliable results, causing erroneous outcomes. To overcome such issues, the second derivative of transient pressure may help eliminate a number of uncertainties as-sociated with welltest analysis, and provide a better estimate of the reservoir dynamic parameters.
This paper describes a new approach regarding welltest interpretation for hydraulically fractured tight gas reser-voirs—using the second derivative of transient pressure. Reservoir simulations are run for several cases of non-fractured and hydraulically fractured wells to generate different type curves of pressure second derivative, and for use in welltest analysis.
A field example from a Western Australian hydraulically fractured tight gas welltest analysis is shown, in which the radial flow regime could not be identified using standard pressure build-up diagnostic plots. Therefore, it was not pos-sible to have a reliable estimate of reservoir permeability. The proposed second derivative of pressure approach was used to predict the radial flow regime trend based on the generated type curves by reservoir simulation, to estimate the reservoir permeability and skin factor. Using this analysis approach, the permeability derived from the welltest was in good agree-ment with the average core permeability in the well, thus confirming the methodology’s reliability.
KeyWords
Tight gas reservoir, welltest analysis, reservoir permeability, hydraulic fractures, flow regimes.
introdUction Pressure-transient testing has long been recognised as a tool
to characterise reservoir dynamic parameters, using an analysis of pressure transient response caused by a change in produc-tion rate. Welltest analysis results are the overall response of reservoir to dynamic disturbances made to the formation at the testing time. A pressure transient test can encompass several
flow regimes, each seeing deeper into the reservoir than the last. Depending on well completion type, completion configu-ration, and reservoir geological and geometric attributes, dif-ferent flow regimes may be revealed in pressure transient data (Bourdarot, 1998).
The early portion of welltest data during pressure build-up tests is controlled by wellbore storage and skin effects. A sufficiently long enough test to overcome wellbore storage is necessary to reveal the reservoir response on the pressure transient data. In the case of tight formations, reservoir flow regimes might be distorted or even masked by an extended wellbore storage effect. Furthermore, hydraulic fractures add to the complexity of the near wellbore region, making reser-voir flow regime identification and welltest analysis challenging (Restrepo, 2009).
In hydraulically fractured wells (Fig. 1), the main flow re-gimes observed in pressure build-up diagnostic plots are:• a linear flow regime towards the hydraulic fracture wings in
the vicinity of the fractures;• an elliptical flow regime towards the drainage area surround-
ing the hydraulic fractures; and,• a pseudo radial flow regime established at a late time when
the pressure disturbance propagates deep enough into the reservoir.Diagnosing the pseudo radial-flow regime is critical to quan-
titative welltest interpretation. This is because during this re-gime, reliable values for permeability × thickness and skin fac-tor for the formation layers that contributed to the test can be calculated using standard methods (Badazhkov, 2008).
For tight gas reservoirs with hydraulic fractures, it would typically take a relatively long pressure build-up time to reach the radial flow regime, and this is often impractical. This study presents a welltest analysis of hydraulically fractured tight gas reservoirs where reservoir characteristics cannot be estimated using standard pressure build-up diagnostic plots. An alterna-tive welltest analysis technique is proposed for radial flow re-gime prediction to determine reservoir permeability and skin factor.
derivative of transient pressUre
The diffusivity equation solution that describes the radial flow regime in a homogeneous porous medium for a pressure build-up test is expressed in field units as follows (Kappa En-gineering, 2011):
(1)
The above equation can be simplified to the following gen-eral form:
(2)
Taking the derivative of Equation 2 with respect to the loga-rithm of the time function gives:
Welltest analysis of HydRaulically fRactuRed tigHt gas ReseRVoiRs:
a field exaMple fRoM peRtH Basin, WesteRn austRalia
Lead authorHassan
Bahrami
Pressure-transient testing has long been recognized as a tool to characterize reservoir dynamic parameters, using analysis of pressure
transient response caused by a change in production rate. Welltest analysis results are the overall response of reservoir to dynamic
disturbances made to the formation at the testing time. A pressure transient test can encompass several flow regimes, each seeing
deeper in reservoir than the last. Depending on well completion type, completion configuration, reservoir geological and geometric
attributes, different flow regimes might be revealed on pressure transient data (Bourdarot, 1998).
The early portion of welltest data during pressure build-up tests is controlled by wellbore storage and skin effects. A long enough test
to overcome wellbore storage is required in order to reveal the reservoir response on the pressure transient data. In the case of tight
formations, reservoir flow regimes might be distorted or even be masked by an extended wellbore storage effect. Furthermore, hydraulic
fractures add to the complexity of the near wellbore region, making reservoir flow regimes identification and welltest analysis challenging
(Restrepo, 2009).
In hydraulically fractured wells as shown in Figure 1, the main flow regimes observed on pressure build-up diagnostic plots are linear
flow regime towards the hydraulic fracture wings in the vicinity of the fractures, elliptical flow regime towards the drainage area
surrounding the hydraulic fractures, and at late time when pressure disturbance propagates deep enough into the reservoir, a pseudo
radial flow regime is established. Diagnosing the pseudo radial-flow regime is critical to quantitative welltest interpretation, since during
this regime, reliable values for permeability*thickness and skin factor for the formation layers that contributed to the test can be
calculated using standard methods (Badazhkov, 2008).
Insert Figure 1 hereabouts
For tight gas reservoirs with hydraulic fractures, it would typically require a relatively long pressure build-up time to reach the radial flow
regime, and this is often not practical. This study presents welltest analysis in hydraulically fractured tight gas reservoirs where reservoir
characteristics cannot be estimated using standard pressure build-up diagnostic plots. An alternative welltest analysis technique is
proposed for radial flow regime prediction in order to determine reservoir permeability and skin factor.
DERIVATIVE OF TRANSIENT PRESSURE
The diffusivity equation solution that describes the radial flow regime in a homogeneous porous medium for a pressure build-up test is
expressed in field units as follows [Kappa Engineering, 2011]:
(1)
The above equation can be simplified to the following general form:
(2)
By taking derivative of Equation (2) with respect to the logarithm of the time function:
(3)
The above equation can be written as follows:
(4)
Equation (4) indicates that for the pressure build-up data related to the radial flow regime, Log-Log plot of pressure derivative, P’:
d[ΔP]/d[-Log((tp+Δt)/Δt)], versus the time function, (tp+Δt)/Δt, it results in a zero-slope line, that intersects the vertical axis at “m”, as
shown in Figure 2.
Insert Figure 2 hereabouts
Using the value of intercept “mRF” on the Radial Flow diagnostic Log-Log plot, permeability and skin values in field units calculated
(Kappa Engineering, 2011):
Permeability: (5)
Skin if tp is large enough: (6)
The pressure derivative data can provide useful information about the reservoir characteristics and flow regimes. Based on the
derivations of fluid flow and diffusivity equations, on the pressure derivative curve, the slope of +1 shows wellbore storage effect, and
the slopes -0.5 (-1/2), +0.5 (+1/2), +0.25 (+1/4) and +0.36 (∼1/3) indicate spherical, linear, bi-linear and elliptical flow regimes
respectively (Badazhkov, 2008; Bourdarot 1998). The typical flow regimes on pressure derivative curve for a hydraulic fractured well in
tight formations have been shown in Figure 3: wellbore storage effect, linear flow regime, elliptical flow regime, and late time radial flow
regime.

2—APPEA Journal 2012 second proof—bahrami 6 mar 12
H. Bahrami, V. Jayan, R. Rezaee and M. Hossain
(3)
The above equation can be written as follows:
(4)
Equation 4 indicates that for the pressure build-up data re-lated to the radial flow regime, a log-log plot of pressure de-rivative—P’: d[DP]/d[-Log((tp+Dt)/Dt)]—versus the time func-tion—(tp+Dt)/Dt—results in a zero-slope line that intersects the vertical axis at m, as shown in Figure 2.
Using the value of intercept mRF
on the radial flow diagnostic log-log plot, permeability and skin values in field units can be calculated (Kappa Engineering, 2011):
Permeability: (5)
Skin if tp is large enough:
(6)
The pressure derivative data can provide useful information about the reservoir characteristics and flow regimes. Based on the derivations of fluid flow and diffusivity equations, on the pressure derivative curve the slope of +1 shows the wellbore storage effect, and the slopes -0.5 (-½), +0.5 (+½), +0.25 (+¼) and +0.36 (~⅓) indicate spherical, linear, bi-linear and elliptical flow regimes, respectively (Badazhkov, 2008; Bourdarot 1998). The typical flow regimes on a pressure derivative curve for a hy-draulically fractured well in tight formations have been shown in Figure 3, that is: wellbore storage effect, linear flow regime, elliptical flow regime, and late time radial flow regime.
Welltest interpretation requires a diagnosis of the reservoir flow regimes. To calculate permeability from the derivative plot, reservoir response should be significant, and the test should be long enough to have the radial flow regime established in the formation and observe a reliable zero-slope line on the pressure derivative curve data.
In pressure transient testing, there are instances where the radial flow regime may not be clearly revealed on diag-nostic plots of pressure build-up and its derivative, for ex-ample—incomplete pressure build-up tests, low-permeability reservoirs and multi-phase producing wells. In hydraulically fractured tight gas reservoirs, due to the wellbore storage ef-fect, heterogeneity and complexity of reservoir response, the use of a conventional welltest analysis may fail to provide reli-able results. Consequently, the reservoir flow regimes may not clearly be revealed on diagnostic plots of transient pressure and its derivative, which may result in erroneous welltest analysis outcomes.
second derivative of the transient pressUre
Transient analysis techniques that use higher order deriva-tives have recently been developed to reduce uncertainties as-sociated with welltest analysis (Bahrami and Siavoshi, 2005). The method is based on taking the second derivative of the diffusivity equation solution, with respect to the logarithm of time function.
Taking the derivative of Equation 3 results in:
The above equation can be simplified to the following general form:
(2)
By taking derivative of Equation (2) with respect to the logarithm of the time function:
(3)
The above equation can be written as follows:
(4)
Equation (4) indicates that for the pressure build-up data related to the radial flow regime, Log-Log plot of pressure derivative, P’:
d[ΔP]/d[-Log((tp+Δt)/Δt)], versus the time function, (tp+Δt)/Δt, it results in a zero-slope line, that intersects the vertical axis at “m”, as
shown in Figure 2.
Insert Figure 2 hereabouts
Using the value of intercept “mRF” on the Radial Flow diagnostic Log-Log plot, permeability and skin values in field units calculated
(Kappa Engineering, 2011):
Permeability: (5)
Skin if tp is large enough: (6)
The pressure derivative data can provide useful information about the reservoir characteristics and flow regimes. Based on the
derivations of fluid flow and diffusivity equations, on the pressure derivative curve, the slope of +1 shows wellbore storage effect, and
the slopes -0.5 (-1/2), +0.5 (+1/2), +0.25 (+1/4) and +0.36 (∼1/3) indicate spherical, linear, bi-linear and elliptical flow regimes
respectively (Badazhkov, 2008; Bourdarot 1998). The typical flow regimes on pressure derivative curve for a hydraulic fractured well in
tight formations have been shown in Figure 3: wellbore storage effect, linear flow regime, elliptical flow regime, and late time radial flow
regime.
Time function
dPressure
derivative
Pressure
Unit slopewellborestorage
1.5 cycles
Figure 2. Conventional pressure derivative technique using the first derivative of transient pressure.
Early time linear �ow
Middle time elliptical �ow
Late time pseudo-radial �ow
Figure 1. Typical flow regimes in tight gas reservoirs.
The above equation can be simplified to the following general form:
(2)
By taking derivative of Equation (2) with respect to the logarithm of the time function:
(3)
The above equation can be written as follows:
(4)
Equation (4) indicates that for the pressure build-up data related to the radial flow regime, Log-Log plot of pressure derivative, P’:
d[ΔP]/d[-Log((tp+Δt)/Δt)], versus the time function, (tp+Δt)/Δt, it results in a zero-slope line, that intersects the vertical axis at “m”, as
shown in Figure 2.
Insert Figure 2 hereabouts
Using the value of intercept “mRF” on the Radial Flow diagnostic Log-Log plot, permeability and skin values in field units calculated
(Kappa Engineering, 2011):
Permeability: (5)
Skin if tp is large enough: (6)
The pressure derivative data can provide useful information about the reservoir characteristics and flow regimes. Based on the
derivations of fluid flow and diffusivity equations, on the pressure derivative curve, the slope of +1 shows wellbore storage effect, and
the slopes -0.5 (-1/2), +0.5 (+1/2), +0.25 (+1/4) and +0.36 (∼1/3) indicate spherical, linear, bi-linear and elliptical flow regimes
respectively (Badazhkov, 2008; Bourdarot 1998). The typical flow regimes on pressure derivative curve for a hydraulic fractured well in
tight formations have been shown in Figure 3: wellbore storage effect, linear flow regime, elliptical flow regime, and late time radial flow
regime.

APPEA Journal 2012—3second proof—bahrami 6 mar 12
Welltest analysis of hydraulically fractured tight gas reservoirs: a field example from perth basin, Western australia
(7)
The above Equation can be written as follows:
(8)
Equation 8 shows that for a pressure build-up test, a plot of the second derivative of pressure—P’’: -d2[DP]/d[Log(Dt)]2—versus the log of time function—(tp+Dt)/Dt—results in a zero-slope straight line with an intercept of zero (semi-log plot). A typical second derivative curve for a pressure transient test has been shown in Figure 4, which shows that the curve has two extremum points, t
EP1 and t
EP2, and the beginning of radial flow
regime around tRF
. The first extremum point (tEP1
) may roughly indicate wellbore storage end.
The second derivative can validate the existence of the radi-al-flow regime on the first derivative, where there is uncertainty in radial flow regime identification using the standard diagnos-tic plots. Compared with the first derivative, the advantage of the second derivative of pressure is that its intercept is certain (zero); thus the second derivative curve trend might be pre-dictable.
To predict the radial flow regime, the approximate time at which the beginning of radial flow regime is expected must be known. As a rule of thumb, the beginning time of the radial flow regime (t
RF) is approximately 1.5 log cycles after the pure
wellbore storage effect is ended (tEP1
). Depending on the well/reservoir parameters, however, the beginning of the radial flow regime may be more or less than 1.5 log cycles after wellbore storage end.
In the case of an insufficiently long pressure build-up test, the radial flow regime can be predicted using the second deriv-ative trend from its second extremum point (t
EP2) to the begin-
ning of the radial flow regime (tRF
). This is done by interpolation between data points after the second extremum point and a zero value on the x-axis, where it is roughly the start time of the radial flow regime (~1.5 log cycles after the end of the wellbore pure storage effect).
Once the second derivative curve is determined, the first derivative curve can be back-calculated from the predicted sec-ond derivative trend, which eventually provides more reliable permeability and skin values. It should be noted that since the second derivative is more sensitive to the downhole pressure changes, data smoothing should also be applied on the second derivative curve.
It is predicted that using both the first and second deriva-tive plots simultaneously in a welltest software package with smoothing functions would improve the quality of well test interpretations. For short transient tests where the first de-rivative fails to detect a conclusive radial flow regime from the zero-slope line, the second derivative would help to detect or estimate the radial flow with its zero intercept.
radiaL fLoW regime prediction
In predicting the radial flow regime, an important param-eter is the estimation of the time when the radial flow regime is started. The KAPPA welltest design software was used to per-form sensitivity analysis using the single phase flow reservoir simulation approach, for several cases with different values of permeability, skin, and hydraulic fracture half-length sizes. The objective is to relate well and reservoir parameters to the time for the end of the wellbore storage effect (t
EP1), time duration
of transition period from wellbore storage effect to radial flow
(tRF
–tEP1
), and the beginning of radial flow regime (tRF
).The results as shown in Figures 5–7 indicate the well/
reservoir parameters can have a significant influence on the duration of the wellbore storage effect, and the time period between the pure wellbore storage effect and the radial flow regime. The effect of permeability, skin, and fracture half-length size on the time durations for different cases are sum-marised as follows:• Effect of permeability (in a zero-skin, non-fractured well)—
the lower permeability of reservoir may result in a longer duration of the wellbore storage effect (t
EP1); however, the
permeability may not have a significant effect on the tran-sition time duration from wellbore storage to radial flow (t
RF–t
EP1).
• Effect of skin factor (in a reservoir with a permeability of 0.1 md, in the case of a non-fractured well)—changing skin factor does not affect the time radial flow is started (t
RF);
however, the higher skin factor makes the wellbore storage effect (t
EP1) longer, which results in a shorter transition time
period (tRF
–tEP1
).• Effect of hydraulic fractures (in a reservoir with a perme-
ability of 0.1 md, in the case of zero skin)—hydraulic frac-ture size does not affect the time radial flow is started (t
RF);
however, larger fractures can increase the initial gas flow rate and therefore reduce the wellbore storage effect duration (significantly shorter t
RF), which means a longer transition
time period (tRF
–tEP1
). The outputs of the sensitivity analysis suggest the time peri-
od can vary from 1.0–2.5 cycles depending on the different well-
Insert Figure 3 hereabouts
Welltest interpretation requires diagnosis of the reservoir flow regimes, and to calculate permeability from the derivative plot, reservoir
response should be significant and the test should be long enough to have the radial flow regime established in the formation and
observe a reliable zero slope line on the pressure derivative curve data.
In pressure transient testing, there are instances where the radial flow regime might not clearly be revealed on diagnostic plots of
pressure build-up and its derivative, for example: incomplete pressure build-up tests, low permeability reservoirs and multi-phase
producing wells. In hydraulically fractured tight gas reservoirs, due to wellbore storage effect, heterogeneity and complexity of reservoir
response, use of conventional welltest analysis may fail to provide reliable results. Consequently, the reservoir flow regimes may not
clearly be revealed on diagnostic plots of transient pressure and its derivative, which results in erroneous welltest analysis outcomes.
SECOND DERIVATIVE OF THE TRANSIENT PRESSURE
The transient analysis techniques that utilize higher order derivatives have recently been developed to reduce uncertainties associated
with welltest analysis (Bahrami and Siavoshi, 2005). The method is based on taking the second derivative of diffusivity equation
solution, with respect to logarithm of time function.
Taking the derivative of Equation 3 results in:
(7)
The above Equation can be written as follows:
(8)
Equation 8 shows that for a pressure build-up test, plot of the second derivative of pressure, P’’: -d2[ΔP]/d[Log(Δt)]2, versus the log of
time function, “(tp+Δt)/Δt", results in a zero-slope straight line with intercept of zero (Semi-Log plot). A typical second derivative curve
for a pressure transient test has been shown in Figure 4, which shows that the curve has two extremum points: tEP1 and tEP2, and the
beginning of radial flow regime around tRF. The first extremum point (tEP1) might approximately indicate wellbore storage end.
Insert Figure 4 hereabouts
The second derivative can validate the existence of radial-flow regime on first derivative, where there is uncertainty in radial flow regime
½slope
Radial �ow
Elliptical�ow
Linear�ow
⅓slope
Figure 3. Typical flow regimes on a diagnostic plot of pressure build-up in hydrauli-cally fractured tight gas reservoirs.
Pressurederivative
Pressuresecond
derivative
DT, timeFigure 4. The first and second pressure derivative diagnostic plot.
Insert Figure 3 hereabouts
Welltest interpretation requires diagnosis of the reservoir flow regimes, and to calculate permeability from the derivative plot, reservoir
response should be significant and the test should be long enough to have the radial flow regime established in the formation and
observe a reliable zero slope line on the pressure derivative curve data.
In pressure transient testing, there are instances where the radial flow regime might not clearly be revealed on diagnostic plots of
pressure build-up and its derivative, for example: incomplete pressure build-up tests, low permeability reservoirs and multi-phase
producing wells. In hydraulically fractured tight gas reservoirs, due to wellbore storage effect, heterogeneity and complexity of reservoir
response, use of conventional welltest analysis may fail to provide reliable results. Consequently, the reservoir flow regimes may not
clearly be revealed on diagnostic plots of transient pressure and its derivative, which results in erroneous welltest analysis outcomes.
SECOND DERIVATIVE OF THE TRANSIENT PRESSURE
The transient analysis techniques that utilize higher order derivatives have recently been developed to reduce uncertainties associated
with welltest analysis (Bahrami and Siavoshi, 2005). The method is based on taking the second derivative of diffusivity equation
solution, with respect to logarithm of time function.
Taking the derivative of Equation 3 results in:
(7)
The above Equation can be written as follows:
(8)
Equation 8 shows that for a pressure build-up test, plot of the second derivative of pressure, P’’: -d2[ΔP]/d[Log(Δt)]2, versus the log of
time function, “(tp+Δt)/Δt", results in a zero-slope straight line with intercept of zero (Semi-Log plot). A typical second derivative curve
for a pressure transient test has been shown in Figure 4, which shows that the curve has two extremum points: tEP1 and tEP2, and the
beginning of radial flow regime around tRF. The first extremum point (tEP1) might approximately indicate wellbore storage end.
Insert Figure 4 hereabouts
The second derivative can validate the existence of radial-flow regime on first derivative, where there is uncertainty in radial flow regime

4—APPEA Journal 2012 second proof—bahrami 6 mar 12
H. Bahrami, V. Jayan, R. Rezaee and M. Hossain
bore and reservoir parameters, or even more than four cycles in the cases of very large hydraulic fractures (the assumption of 1.5 log cycles duration may not always be valid). Therefore, for radial flow regime prediction based on the second derivative curve, a sensitivity analysis needs to be performed regarding the effect of well and reservoir parameters.
fieLd exampLe: WeLLtest anaLysis in a tight gas reservoir
A pressure build-up test was performed in a hydraulically fractured well in a WA tight gas reservoir to evaluate well pro-ductivity and estimate reservoir permeability. Figure 8 shows
Sensitivity on K (�rst derivative)
DT, time
Figure 5a. Sensitivity of pressure build-up response to permeability (pressure and pressure first derivative).
Sensitivity on K (second derivative)
DT, time
Figure 5b. Sensitivity of pressure build-up response to permeability (pressure second derivative).
DT, time
Sensitivity on S
Sensitivity on S
DT, time
Figure 6a. Sensitivity of pressure build-up response to skin (pressure and pressure first derivative).
Figure 6b. Sensitivity of pressure build-up response to skin (pressure second derivative).
Figure 7a. Sensitivity of pressure build-up response to hydraulic fracture half-length (pressure and pressure first derivative).
Sensitivity on Xf (ft)
DT, time
Figure 7b. Sensitivity of pressure build-up response to hydraulic fracture half length (pressure second derivative).

APPEA Journal 2012—5second proof—bahrami 6 mar 12
Welltest analysis of hydraulically fractured tight gas reservoirs: a field example from perth basin, Western australia
the standard log-log diagnostic plot of pressure and pressure derivative for the pressure build-up period. The derivative curve shows a significant effect of wellbore storage on pressure data (unit slope line), followed by a linear flow regime towards the hydraulic fracture wings (+½ slope line). The diagnostic plot indicates the test duration is not long enough to reach the late time radial flow regime, and therefore permeability and skin factor cannot be reliably estimated.
To predict the radial flow regime, the first and second de-rivative data were first plotted on a semi-log scale, as shown in Figure 9. Based on the sensitivity analysis results on the num-ber of log cycles, the beginning of the radial flow regime was considered to be roughly 2.5 log cycles after the end of pure wellbore storage region. Using this assumption, the beginning of the radial flow regime was estimated at the time function—(tp+dt)/dt—of 1,000.
Using available second derivative data, a curve fit was per-formed from the second extremum point on the second deriva-tive curve (at a time function of 100) to the zero-value point
where the beginning of the radial flow regime is expected (at time function of 1,000). The first derivative of pressure data was the determined from the fitted curve on the second derivative points, as shown in Figure 10.
The value of pressure derivative in radial flow region was estimated as 3.7E+8 psi2/cp, which corresponds to the perme-ability of 0.0060 mD and skin of -4.3. By considering the K and S values, the match of pressure and pressure derivative curves on the diagnostic plot (as shown in Fig. 11) resulted in a frac-ture half-length size of 55 ft. This indicates that the hydraulic fracture size is small and the fracturing operations were prob-ably inefficient.
A consistency check of the results was also performed by considering the beginning of the infinite acting radial flow (t
RF)
at the time function values of 700 and 3,000 hrs. This resulted in a permeability of 0.0058 mD and 0.0063 mD for the different cases, respectively. The results highlight a good convergence of the permeability values, considering the different time values for the beginning of the radial flow regime compared to the es-
Log-log diagnostic plot
Time function
Figure 8. Conventional diagnostic plot for pressure build-up data in a WA tight gas reservoir.
Semi-log plot
Time function
Figure 9. The first and second pressure derivative curves for the pressure build-up in the WA tight gas reservoir.
Time function
Figure 10. Radial flow regime prediction using the second derivative of pressure.
Pseu
do p
ress
ure
and
its
deri
vati
ve
Time function
Figure 11. Welltest analysis and match of pressure build-up data for the tight gas well.
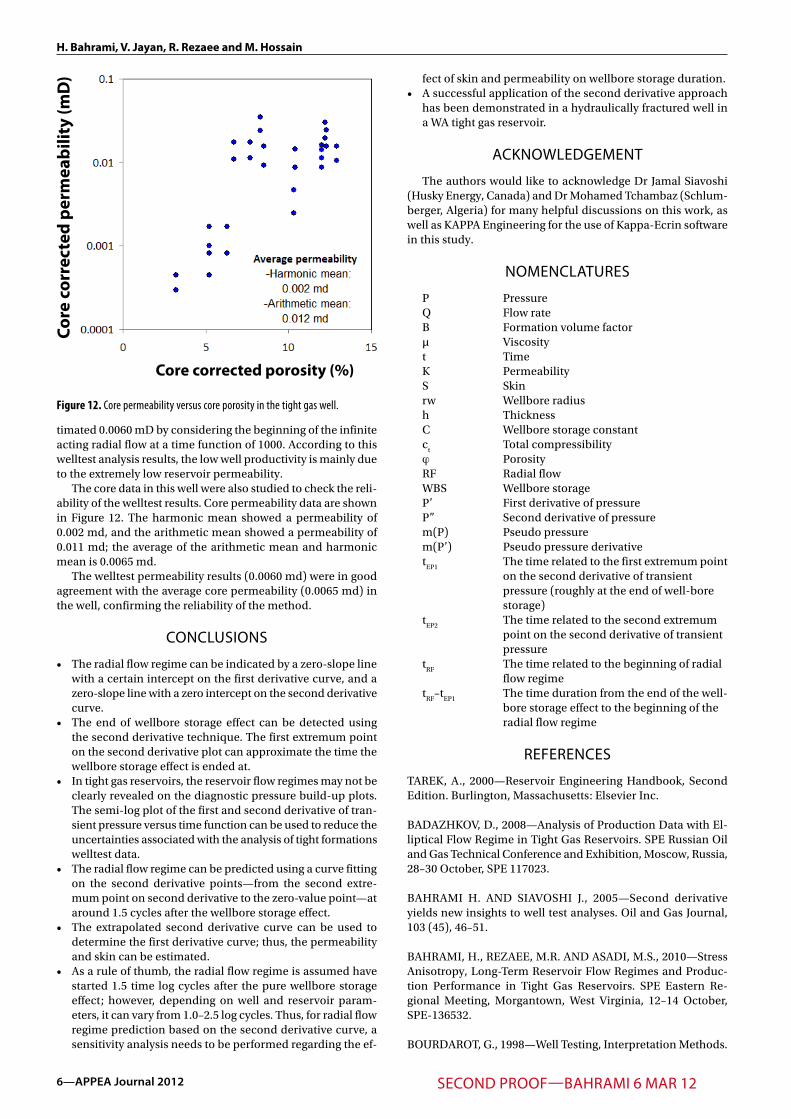
6—APPEA Journal 2012 second proof—bahrami 6 mar 12
H. Bahrami, V. Jayan, R. Rezaee and M. Hossain
timated 0.0060 mD by considering the beginning of the infinite acting radial flow at a time function of 1000. According to this welltest analysis results, the low well productivity is mainly due to the extremely low reservoir permeability.
The core data in this well were also studied to check the reli-ability of the welltest results. Core permeability data are shown in Figure 12. The harmonic mean showed a permeability of 0.002 md, and the arithmetic mean showed a permeability of 0.011 md; the average of the arithmetic mean and harmonic mean is 0.0065 md.
The welltest permeability results (0.0060 md) were in good agreement with the average core permeability (0.0065 md) in the well, confirming the reliability of the method.
concLUsions
• The radial flow regime can be indicated by a zero-slope line with a certain intercept on the first derivative curve, and a zero-slope line with a zero intercept on the second derivative curve.
• The end of wellbore storage effect can be detected using the second derivative technique. The first extremum point on the second derivative plot can approximate the time the wellbore storage effect is ended at.
• In tight gas reservoirs, the reservoir flow regimes may not be clearly revealed on the diagnostic pressure build-up plots. The semi-log plot of the first and second derivative of tran-sient pressure versus time function can be used to reduce the uncertainties associated with the analysis of tight formations welltest data.
• The radial flow regime can be predicted using a curve fitting on the second derivative points—from the second extre-mum point on second derivative to the zero-value point—at around 1.5 cycles after the wellbore storage effect.
• The extrapolated second derivative curve can be used to determine the first derivative curve; thus, the permeability and skin can be estimated.
• As a rule of thumb, the radial flow regime is assumed have started 1.5 time log cycles after the pure wellbore storage effect; however, depending on well and reservoir param-eters, it can vary from 1.0–2.5 log cycles. Thus, for radial flow regime prediction based on the second derivative curve, a sensitivity analysis needs to be performed regarding the ef-
fect of skin and permeability on wellbore storage duration.• A successful application of the second derivative approach
has been demonstrated in a hydraulically fractured well in a WA tight gas reservoir.
acKnoWLedgement
The authors would like to acknowledge Dr Jamal Siavoshi (Husky Energy, Canada) and Dr Mohamed Tchambaz (Schlum-berger, Algeria) for many helpful discussions on this work, as well as KAPPA Engineering for the use of Kappa-Ecrin software in this study.
nomencLatUres
P PressureQ Flow rateB Formation volume factorµ Viscosityt TimeK PermeabilityS Skinrw Wellbore radiush ThicknessC Wellbore storage constantc
t Total compressibility
j PorosityRF Radial flowWBS Wellbore storageP’ First derivative of pressureP’’ Second derivative of pressurem(P) Pseudo pressurem(P’) Pseudo pressure derivativet
EP1 The time related to the first extremum point
on the second derivative of transient pressure (roughly at the end of well-bore storage)t
EP2 The time related to the second extremum
point on the second derivative of transient pressure t
RF The time related to the beginning of radial
flow regimet
RF–t
EP1 The time duration from the end of the well-
bore storage effect to the beginning of the radial flow regime
references
TAREK, A., 2000—Reservoir Engineering Handbook, Second Edition. Burlington, Massachusetts: Elsevier Inc.
BADAZHKOV, D., 2008—Analysis of Production Data with El-liptical Flow Regime in Tight Gas Reservoirs. SPE Russian Oil and Gas Technical Conference and Exhibition, Moscow, Russia, 28–30 October, SPE 117023.
BAHRAMI H. AND SIAVOSHI J., 2005—Second derivative yields new insights to well test analyses. Oil and Gas Journal, 103 (45), 46–51.
BAHRAMI, H., REZAEE, M.R. AND ASADI, M.S., 2010—Stress Anisotropy, Long-Term Reservoir Flow Regimes and Produc-tion Performance in Tight Gas Reservoirs. SPE Eastern Re-gional Meeting, Morgantown, West Virginia, 12–14 October, SPE-136532.
BOURDAROT, G., 1998—Well Testing, Interpretation Methods.
Core
cor
rect
ed p
erm
eabi
lity
(mD
)
Core corrected porosity (%)
Figure 12. Core permeability versus core porosity in the tight gas well.

APPEA Journal 2012—7second proof—bahrami 6 mar 12
Welltest analysis of hydraulically fractured tight gas reservoirs: a field example from perth basin, Western australia
Editions Technip: Paris.
KAPPA ENGINEERING, 2011—Dynamic Data Analysis.
EARLOUGHER, R.C. Jr, 1977—Advances in Well Test Analysis, Monograph Series, Volume 5. New York: SPE.
GUO, B. AND GHALAMBOR, A., 2005—Natural Gas Engineer-ing Handbook. Houston: Gulf Publishing Company.
LAKOVLEV, S.V., 2000—Multi-Phase Flow in Several Layers Limits the Applicability of Conventional Buildup Analysis. SPE/AAPG Western Regional Meeting, Long Beach, California, 19–22 June, SPE-62854.
RESTREPO, D.P., 2009—Multiple Fractures Transient Response. Latin American and Caribbean Petroleum Engineering Confer-ence, Cartagena, Colombia, 31 May–3 June, SPE 121594.
tHe autHoRs
Hassan Bahrami is a phd candidate in the department of petroleum engi-neering at curtin University, and is now focused on tight sand gas reservoirs’ damage and productivity. prior to cur-tin University, he worked for schlum-berger data and consulting services (dcs) as a borehole reservoir engineer (2003–2009), and at tehran energy
consultants as a reservoir engineer (2001–2003). hassan holds a bsc in chemical engineering from persian gulf University, and an msc in reservoir engineering from sharif University of technology, tehran, iran.
Vineeth Jayan is a petroleum engineer from curtin University in perth, Wa. he is now working for santos Limited in the gLng project, based in brisbane. before joining santos in september 2011, he completed his masters degree in petroleum engineering at curtin University. prior to this, he worked for tata consultancy services, india as an
assistant systems engineer (2006–2009). vineeth also holds a bachelor degree in mechanical engineering from University of Kerala, india.
Reza Rezaee is an associate professor at curtin University’s department of petroleum engineering, and has a phd in reservoir characterisation. he has more than 20 years’ experience in aca-demia and industry. during his career he has been engaged in several research projects supported by national and international oil companies. With his su-
pervisory work at various universities, these commissions have involved a wide range of achievements. he has supervised more than 50 msc and phd students during his university career to date. his research has been focused on integrated solutions for reservoir characterisation, formation evaluation, and petrophysics. he has used expert systems such as artificial neural networks and fuzzy logic, and has introduced several new approaches to estimate rock properties from log data where conventional methods have failed to succeed. he is now focused on unconventional gas, including gas shale and tight gas sand studies, and is the lead scientist for the Wa:era (eis) tight gas and shale gas research projects.
dr Mofazzal Hossain is a senior lecturer, postgraduate course coordinator, and spe faculty advisor at the department of petroleum engineering at curtin University. he has more than 14 years of experience in teaching, research and consulting work, with a major focus in the areas related to well technology and petroleum production technology.
he worked with the University of adelaide and UnsW in australia, saudi aramco and King saud University in saudi arabia, and reservoir engineering research institute, palo alto, in the Usa. his research works encompass: reservoir stimulation by hydraulic fracturing for improved production from unconventional tight/shale gas reservoirs; completion optimisation; rock fracture mechanics; and, wellbore stability. dr hossain received his phd in petroleum engineering from UnsW. member: spe and iea.

8—APPEA Journal 2012 second proof—bahrami 6 mar 12
H. Bahrami, V. Jayan, R. Rezaee and M. Hossain
this page Left bLanK intentionaLLy.

77
Appendix D:
Evaluation of damage mechanisms and skin factor in tight gas reservoirs. APPEA
Journal

APPEA Journal 2011—1THIRD PROOF—BAHRAMI 14 FEB 11
H. Bahrami, R. Rezaee, D. Nazhat and J. OstojicDepartment of Petroleum EngineeringCurtin University of Technology613 (Rear), Level 6, ARRC26 Dick Perry Ave, KensingtonPerth WA [email protected]@[email protected]@postgrad.curtin.edu.au
ABSTRACT
Tight gas reservoirs normally have production problems due to very low matrix permeability and significant damage during well drilling, completion, stimulation and produc-tion. Therefore, they may not flow gas at optimum rates without advanced production improvement techniques.
The main damage mechanisms and the factors that have significant influence on total skin factor in tight gas reservoirs include: mechanical damage to formation rock; plugging of natural fractures by mud solid particle invasion; relative permeability reduction around wellbore as a result of filtrate invasion; liquid leak-off into the formation during fracturing operations; water blocking; skin due to wellbore breakouts; and the damage associated with perforation. Drilling and fracturing fluids invasion mostly occurs through natural fractures and may also lead to serious permeability reduction in the rock matrix that surrounds the natural or hydraulic fractures.
This study represents an evaluation of different dam-age mechanisms in tight gas formations, and examines the factors that can have significant influence on total skin factor and well productivity. Reservoir simulation was carried out based on a typical West Australian tight gas reservoir to understand how well productivity is affected by each of the damage mechanisms, such as natural frac-ture plugging, mud filtrate invasion, water blocking and perforation. Furthermore, some damage prevention and productivity improvement techniques are proposed, which can help improve well productivity in tight gas reservoirs.
KEYWORDS
Tight gas reservoir, damage mechanisms, well produc-tivity, skin factor, reservoir simulation.
INTRODUCTION
Tight gas reservoirs normally have production problems due to very low matrix permeability and different damage mechanisms during well drilling, completion, stimulation and production. Wellbore instability while drilling due to stress regimes is also a common issue in tight sand forma-tions, which can result in large wellbore breakouts (Dus-seault, 1993). The severe stress anisotropy in tight sand reservoirs can result in higher permeability in the conduits perpendicular to maximum stress direction (Bahrami et al, 2010). In reservoir geometry, the tight sand formations are normally stacks of isolated lenses of sand bodies, vertically separated by shale layers. The tight sand reservoir’s low deliverability, geometry and lack of connectivity between the sand bodies makes it challenging to produce gas at commercial rates (Abass et al, 2007).
Stress regimes and the effective stress (the difference between total stress and pore pressure) can also affect well productivity in low permeability gas reservoirs, since the wells normally produce with a large pressure drawdown. Therefore, the effective stress is highest especially near the wellbore, causing further permeability reduction in addition to the damage and skin effect near the wellbore (Abass et al, 2007; Teufel et al, 1993).
The tight sand matrix is primarily composed of micro-pores where the average pore throat aperture might be less than 1 micron in diameter. In such formations, the initial water saturation (Sw,i) might be significantly less than criti-cal water saturation (Swc) due to water phase vaporisation into the gas phase (Bennion et al, 1996). The sub-normal saturation and small pore size creates tremendous amounts of potential capillary pressure energy suction, which can potentially imbibe and hold a liquid saturation in the po-rous media (Brant and Brent, 2005). The low initial water saturation provides relative permeability for the gas phase close to absolute permeability. Figure 1 shows capillary pressure and relative permeability curves for a typical tight gas reservoir (Holditch, 1979; Ward, 1987; Abass, 2009). Presence of liquid in such pore systems can result in the significant reduction of gas relative permeability.
Low permeability gas reservoirs can be subject to a number of different damage mechanisms during drilling, completion and production operations. The main damage mechanisms and the factors that have significant influence on total skin factor in tight gas reservoirs include: mechani-cal damage to formation rock; plugging of natural fractures
EVALUATION OF DAMAGE MECHANISMS AND SKIN FACTOR IN
TIGHT GAS RESERVOIRS
Lead authorHassan
Bahrami
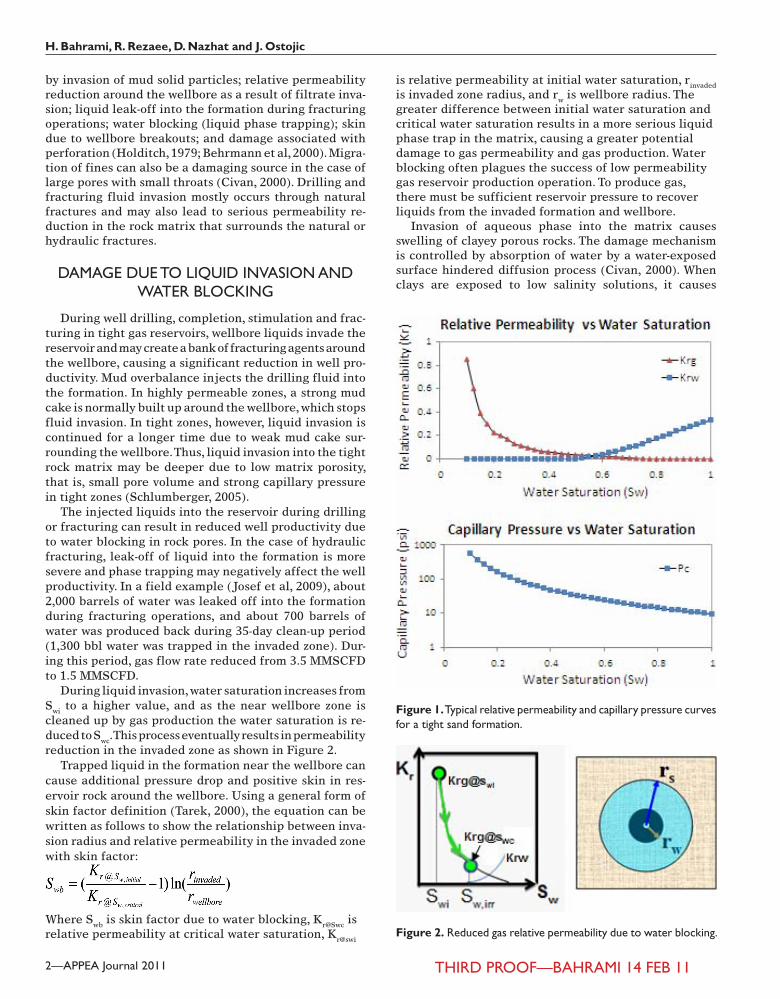
2—APPEA Journal 2011 THIRD PROOF—BAHRAMI 14 FEB 11
H. Bahrami, R. Rezaee, D. Nazhat and J. Ostojic
by invasion of mud solid particles; relative permeability reduction around the wellbore as a result of filtrate inva-sion; liquid leak-off into the formation during fracturing operations; water blocking (liquid phase trapping); skin due to wellbore breakouts; and damage associated with perforation (Holditch, 1979; Behrmann et al, 2000). Migra-tion of fines can also be a damaging source in the case of large pores with small throats (Civan, 2000). Drilling and fracturing fluid invasion mostly occurs through natural fractures and may also lead to serious permeability re-duction in the rock matrix that surrounds the natural or hydraulic fractures.
DAMAGE DUE TO LIQUID INVASION ANDWATER BLOCKING
During well drilling, completion, stimulation and frac-turing in tight gas reservoirs, wellbore liquids invade the reservoir and may create a bank of fracturing agents around the wellbore, causing a significant reduction in well pro-ductivity. Mud overbalance injects the drilling fluid into the formation. In highly permeable zones, a strong mud cake is normally built up around the wellbore, which stops fluid invasion. In tight zones, however, liquid invasion is continued for a longer time due to weak mud cake sur-rounding the wellbore. Thus, liquid invasion into the tight rock matrix may be deeper due to low matrix porosity, that is, small pore volume and strong capillary pressure in tight zones (Schlumberger, 2005).
The injected liquids into the reservoir during drilling or fracturing can result in reduced well productivity due to water blocking in rock pores. In the case of hydraulic fracturing, leak-off of liquid into the formation is more severe and phase trapping may negatively affect the well productivity. In a field example (Josef et al, 2009), about 2,000 barrels of water was leaked off into the formation during fracturing operations, and about 700 barrels of water was produced back during 35-day clean-up period (1,300 bbl water was trapped in the invaded zone). Dur-ing this period, gas flow rate reduced from 3.5 MMSCFD to 1.5 MMSCFD.
During liquid invasion, water saturation increases from Swi to a higher value, and as the near wellbore zone is cleaned up by gas production the water saturation is re-duced to Swc. This process eventually results in permeability reduction in the invaded zone as shown in Figure 2.
Trapped liquid in the formation near the wellbore can cause additional pressure drop and positive skin in res-ervoir rock around the wellbore. Using a general form of skin factor definition (Tarek, 2000), the equation can be written as follows to show the relationship between inva-sion radius and relative permeability in the invaded zone with skin factor:
Where Swb is skin factor due to water blocking, Kr@Swc is relative permeability at critical water saturation, Kr@swi
is relative permeability at initial water saturation, rinvaded is invaded zone radius, and rw is wellbore radius. The greater difference between initial water saturation and critical water saturation results in a more serious liquid phase trap in the matrix, causing a greater potential damage to gas permeability and gas production. Water blocking often plagues the success of low permeability gas reservoir production operation. To produce gas, there must be sufficient reservoir pressure to recover liquids from the invaded formation and wellbore.
Invasion of aqueous phase into the matrix causes swelling of clayey porous rocks. The damage mechanism is controlled by absorption of water by a water-exposed surface hindered diffusion process (Civan, 2000). When clays are exposed to low salinity solutions, it causes
Figure 1. Typical relative permeability and capillary pressure curves for a tight sand formation.
Figure 2. Reduced gas relative permeability due to water blocking.

APPEA Journal 2011—3THIRD PROOF—BAHRAMI 14 FEB 11
Evaluation of damage mechanisms and skin factor in tight gas reservoirs
formation damage as swelling clays imbibe water into their crystalline structure, enlarge them in size, and hence plug the pore space. Mobilisation, migration, and deposition of clays can also plug the pore throats.
Damage due to liquid invasion can be minimised by choosing the proper base fluid for fracture treatments. Wellbore heating is also a treatment that can remove aque-ous phase traps around the wellbore. Electrical heaters can be used to elevate downhole temperatures high enough such that water is vaporised into the gas phase, resulting in reduced water saturation around the wellbore (Bennion et al, 1996).
MECHANICAL DAMAGE
Mechanical damage refers to solid particle invasion into natural fractures, tight formation matrix surrounding the wellbore or hydraulic fracture face during overbalanced drilling, completion, or fracturing operations. Natural fractures in tight formations are very sensitive to solid invasion damage as the natural fractures generally have small aperture. In sandstone reservoirs, since acidising is normally impractical, the damage may not be removed (Araujo et al, 2005).
Drilling fluids invasion into tight formation occurs through permeable matrix pores, which leads to solid plugging of matrix rock next to the wellbore. Formation testing tools can help for evaluation of the mechanical damage caused by plugging the near wellbore formation pores by solid particles. Two tests were performed using a cased-hole dynamics tester (CHDT) formation testing tool to drill a hole into the formation and test its dynamic characteristics by creating a pressure drawdown, followed by a pressure build-up in the tested point (Bonner and Saljooghi, 2007). In test A, the CHDT formation tester was run in a cased-hole well. Figure 3 shows bit penetration and reservoir pressure response during the formation testing. According to the data, the tool bit first drilled through cas-ing and cement (1” penetration), then started to penetrate through the formation. When bit penetration reached 2.5” (1.5” penetration through formation), formation response and a pressure increase in the tool flow-line was detected by pressure sensors. In other words, the formation mechani-cal damage radius was about 1.5” at the tested point in this well (Bonner and Saljooghi, 2007).
In test B, the CHDT formation tester was run in an open-hole well. Figure 4 shows bit penetration and res-ervoir pressure response during the formation testing. First, conventional formation testing (no bit penetration) was performed on an open-hole wellbore wall using the tool probe. The pressure drawdown and pressure build-up tests (time period 3–10 minutes) showed very weak reservoir response to transient pressure, and the build-up of pressure did not stabilise. In the next test (time period 10–15 minutes), the tool bit penetrated 0.6” through for-mation, prior to formation testing. The formation testing after drilling the hole showed improvement in reservoir response to pressure drawdown and build-up in the test. The tool bit then penetrated 1.2” through the formation
(time period 15–25 minutes), and formation testing was repeated. The pressure response during the pressure draw-down and build-up indicated that the rock damaged radius had been passed since pressure build-up stabilised in a short period of time (Bonner and Saljooghi, 2007). In the above cases, the mechanical damage extent into formation was estimated to be around 1” in the tested points. These tests showed the importance of passing the damaged zone in open-hole wells.
In open-hole completed wells in tight sand formations, although the mechanical damage is highly localised and solids normally penetrate a very short distance into the tight reservoir rocks, optimum productivity may not be achieved if the wellbore is not connected to the undam-aged formation rock.
Mechanical damage to the formation matrix can also occur during hydraulic fracturing jobs in which the frac-turing fluids transport solids through the fractures and into deeper parts of the reservoir. The fracturing fluid invasion into tight formations can lead to solid plugging of the formation pores next to fracture wings and also causes water trapping and clay mineral impairments (Abass, 2009).
Figure 3. Field example of running cased hole dynamic tester in a cased-hole well to evaluate mechanical damage.
Figure 4. Field example of running cased hole dynamic tester in an open-hole well to evaluate mechanical damage.

4—APPEA Journal 2011 THIRD PROOF—BAHRAMI 14 FEB 11
H. Bahrami, R. Rezaee, D. Nazhat and J. Ostojic
WELLBORE BREAKOUTS AND SKIN FACTOR
Tight sand formations have severe wellbore instability during drilling due to large horizontal and vertical stress anisotropy, which leads to large wellbore breakouts across the tight sandstone sections. The wellbore breakouts occur in the direction of minimum stress and cause enlargement of the wellbore in that direction. Drilling perpendicular to the maximum stress direction results in fewer wellbore instability issues.
Figure 5 shows caliper and gamma ray (GR) readings for tight gas well XX-01 in Western Australia. The well was drilled using an 8.5” sized bit. The caliper log indicates an increase of wellbore diameter up to 20” due to breakouts across the tight sandstone intervals. The tight zones with low shale content (low GR readings) have severe wellbore instability issues, which are expected to have high strength, whereas in the shale intervals (high GR reading), no sig-nificant wellbore enlargement is observed.
In the case of open-hole completion in tight gas wells, the wellbore breakouts can affect well productivity posi-tively by causing an enlargement of wellbore diameter and therefore reducing total skin factor. The effect of wellbore enlargement on skin factor can be estimated by using the following equation (Ahmed, 2000):
Where rbreakout is wellbore radius in the intervals with wellbore breakouts, rw is wellbore radius in stable inter-vals, and S is skin factor. The above equation shows the relationship between skin factor and radius of wellbore breakouts. The larger the wellbore breakouts, the lower the total skin factor. An open-hole completion system in gas wells with large wellbore breakouts can provide sig-nificantly higher initial gas production rates compared to a cased-hole completion system.
PERFORATION AND SKIN FACTOR
In perforating tight formations, the perforating jet pen-etration into the reservoir rock is significantly reduced due to the high strength of the formation rock. Therefore, the formation penetration in tight formations with high rock uniaxial compressive strength (UCS) may be significantly shallow. Moreover, the wellbore breakouts may have a nega-tive impact on perforation and clean-up efficiency due to the large cement volume behind the casing in the intervals with enlarged wellbore, which reduces accessibility to the formation via perforation tunnels (Behrmann et al, 2000; Halleck et al, 1998).
To understand the effect of wellbore breakouts on perfo-ration results in tight formations, Schlumberger perforation modelling software (SPAN version 7.02) was run based on tight gas well XX-01 data. The model was used to predict
perforation efficiency using two different gun systems: • 2 1/8” conventional phased gun with API 19-B standard
penetration of about 23”; and,• 4 1/2” deep penetrating gun with API 19-B standard
penetration of about 60”.The penetration values under reservoir conditions were
modelled for the intervals where, due to wellbore insta-bility, the wellbore diameter was 10” in the direction of maximum stress, and 20” in the direction of minimum stress. Damaged zone radius was assumed as 5”and the ratio of damaged zone permeability to virgin zone permeability (Kd/K) was assumed to be 0.2. The model input data are reported in Table 1.
The perforation model results are displayed in Figure 6, and indicate that the perforating jet penetration into the formation rock is significantly reduced in the direction that wellbore breakouts occur.
Table 2 shows estimated skin and productivity values for each of the perforation scenarios. Using the 4 1/2” gun, the model predicted jet penetration of 13.3” into the formation (skin value of −0.6) in the direction of maximum stress, and 11.5” penetration (skin value of +0.1) for perforation tunnels in the direction of minimum stress where wellbore breakouts occur. Using a 2 1/8” gun, the model predicted jet penetration of 6.0” into formation (skin value of +2.3) in the direction of maximum stress, and 4.2” penetration (skin value of +11.5) for perforation tunnels in the direc-tion of minimum stress where the wellbore had breakouts.
The wellbore breakouts have a negative effect on the perforation efficiency and consequently may cause the well
Figure 5. Wellbore breakouts in a tight gas reservoir (GR and calliper logs).

APPEA Journal 2011—5THIRD PROOF—BAHRAMI 14 FEB 11
Evaluation of damage mechanisms and skin factor in tight gas reservoirs
productivity to be reduced, especially with the use of short perforating guns with shallow penetration. Therefore, as a perforation strategy in tight gas wells, using 180-degree phased deep penetrating guns (oriented perforation) that can shoot perforating jets in the maximum stress direction can provide optimum productivity and minimum perfora-tion skin.
To achieve higher well productivity, open-hole comple-tion in tight gas wells may be more effective than cased-hole completion, because enlarged wellbore diameter due to wellbore breakouts can further reduce skin factor and significantly increase initial gas production rate (Bahrami et al, 2010). Open-hole perforation using deep penetrating charges run with shock absorbers may help in passing the damaged zone and effectively connect the wellbore to the virgin formation.
CORE SCALE SIMULATION FORDAMAGE EVALUATION
The modelling studies and simulation runs were based on data acquired in a West Australian tight gas reservoir. The typical tight sand capillary pressure and relative perme-ability curves shown in Figure 1 (initial water saturation of 0.2 and critical water saturation of 0.5) were used as input into the simulation model. Reservoir simulation runs were carried out to understand how well productivity is affected by each of the damage mechanisms.
Flow efficiency (FE) for a core was defined as the ratio of the pressure drop between core inlet and core outlet for a zero skin virgin homogeneous core, to the pressure drop from core inlet to core outlet for a perforated and/or damaged core (FE of original clean core equal to 1). To understand the effect of different damage mechanisms on
core flow efficiency, numerical simulation was performed using commercial reservoir simulation software to model flow through the core and evaluate damage and productiv-ity for different scenarios. The model details are outlined in Table 3 and Figure 7. The model consists of 13*13 grids in x and y directions (horizontal), and 59 grids in z direc-tion (vertical). The top two (layer numbers 58 and 59) and bottom two layers (1 and 2) in z direction were considered as core holder caps with high permeability of 10,000 md, and the matrix grids in layer numbers 3–57 as core matrix with permeability of 0.1 md in the original model. A single well in layer 1 and another well in layer 59 were defined for injection and production purposes in the core.
Effect of mechanical damage on core flowefficiency
The simulation model was first run by considering the first 12 layers of core in z direction as a damaged zone (damaged permeability for girds in layer numbers 3–14). The model was run for core virgin matrix permeability of 0.1 md, then the test was repeated for a core with a matrix permeability of 1 md. In the model, damaged zone radius was assumed as 1.2”, and Kd/K values of 0.9, 0.75, 0.5 and 0.1 were used for sensitivity analysis. The simulation model was also run for different damaged zone radii (rd) of 0”, 0.6”, 1.2” and 1.8”. The results are shown in Figure 8, which indicates the effect of damaged zone permeabil-ity and damaged zone radius on flow efficiency in tight and conventional cores. According to the results, flow ef-ficiency in tight cores is more sensitive to damaged zone permeability and damaged zone radius, compared with conventional cores. This indicates the importance of dam-age mitigation in tight gas reservoirs.
Reservoir Well Perforation top depth, ft
Perforation thickness, ft
Wellbore fluid Lithology Porosity % Permeability
mdTight gas Vertical 11,000 160 Water Sandstone 10 0.1
Kd/K Damage radius, in Fluid Gas gravity UCS, psia Overburden
stressReservoir pressure,
psiaReservoir temp, F
0.2 5 Gas 1 21,000 11,500 5,100 220
Table 1. Input parameters in perforation model.
Table 2. Model predictions for perforation jet penetration and skin
Casing Gun type API RP19-B penetration, inches
Perforation tunnel
Average actual formation penetration, inches
Perforation skin
7” 29 lb/ft L80
4.5” gun 60A 13.3 -0.6
B 11.5 0.1
2 1/8” gun 23C 6.0 2.3
D 4.2 11.5

6—APPEA Journal 2011 THIRD PROOF—BAHRAMI 14 FEB 11
H. Bahrami, R. Rezaee, D. Nazhat and J. Ostojic
Effect of perforation on core flow efficiency
The simulation model was built for non-perforated and perforated cores, with virgin zone matrix permeability of 0.1 md for the tight sand core and 1 md for the conventional core. A sensitivity analysis was performed by simulating single phase gas flow through perforation tunnels, with different perforation tunnel lengths of 0.5”, 1”, 1.5” and 2”.
The model details for the undamaged core model are given in Figure 9 and the simulation results are shown in Figure 10. The outcomes indicate the effect of perforation tunnel length on flow efficiency in tight and conventional undamaged cores. As expected, perforation resulted in an increase of core flow efficiency. The improved productiv-ity due to perforation is more noticeable in tight cores compared with conventional cores. This is because the
tight sands have deliverability problems and require pro-duction enhancement to flow gas, whereas conventional gas reservoirs in normal cases can naturally flow gas with commercial rates without a need for stimulation.
For the damaged core scenario, the model Kd/K was
Figure 6. Perforation jet penetration prediction for wells with wellbore breakout.
Figure 7. Core flood simulation model details.
Figure 8. Effect of damaged zone permeability and radius on flow efficiency.
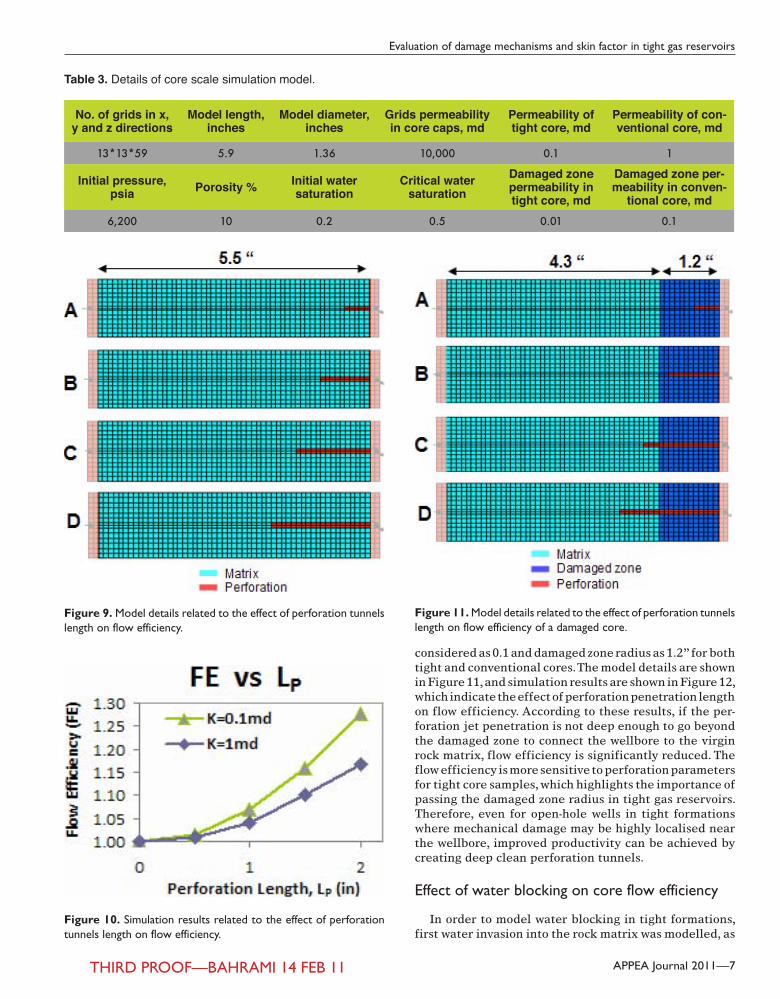
APPEA Journal 2011—7THIRD PROOF—BAHRAMI 14 FEB 11
Evaluation of damage mechanisms and skin factor in tight gas reservoirs
considered as 0.1 and damaged zone radius as 1.2” for both tight and conventional cores. The model details are shown in Figure 11, and simulation results are shown in Figure 12, which indicate the effect of perforation penetration length on flow efficiency. According to these results, if the per-foration jet penetration is not deep enough to go beyond the damaged zone to connect the wellbore to the virgin rock matrix, flow efficiency is significantly reduced. The flow efficiency is more sensitive to perforation parameters for tight core samples, which highlights the importance of passing the damaged zone radius in tight gas reservoirs. Therefore, even for open-hole wells in tight formations where mechanical damage may be highly localised near the wellbore, improved productivity can be achieved by creating deep clean perforation tunnels.
Effect of water blocking on core flow efficiency
In order to model water blocking in tight formations, first water invasion into the rock matrix was modelled, as
Table 3. Details of core scale simulation model.
No. of grids in x, y and z directions
Model length, inches
Model diameter, inches
Grids permeability in core caps, md
Permeability of tight core, md
Permeability of con-ventional core, md
13*13*59 5.9 1.36 10,000 0.1 1
Initial pressure, psia Porosity % Initial water
saturationCritical water
saturationDamaged zone permeability in tight core, md
Damaged zone per-meability in conven-
tional core, md6,200 10 0.2 0.5 0.01 0.1
Figure 9. Model details related to the effect of perforation tunnels length on flow efficiency.
Figure 10. Simulation results related to the effect of perforation tunnels length on flow efficiency.
Figure 11. Model details related to the effect of perforation tunnels length on flow efficiency of a damaged core.

8—APPEA Journal 2011 THIRD PROOF—BAHRAMI 14 FEB 11
H. Bahrami, R. Rezaee, D. Nazhat and J. Ostojic
shown in Figure 13. After that, water (W) was injected at the injection well, while gas (G) was simultaneously pro-duced at the production well. Once the time step reached 364, water injection and gas production were stopped. The water injection well was then changed to a gas producer (the well produced both gas and water during clean-up), and the gas production well was changed to a gas injector to model the flow of gas from reservoir towards wellbore during the clean-up phase.
The results shown in Figure 13 depict that during the simulation runs, water saturation changed from initial water saturation (0.2) to its maximum value in the water invaded cells. Then, during the clean-up, the water satura-tion in the invaded zone was reduced to 0.5 (critical water saturation) and did not drop further even with very long gas production time. This is due to capillary and relative permeability effects. The simulation results showed that the water phase was trapped in grid layers 2–6 in the z direction.
The simulation run was repeated for a longer period of water injection time (until time step 453) as shown in Figure 14, to understand the effect of cumulative water injected volume and water invasion radius on flow effi-ciency. The simulation results are displayed in Figure 15, which shows a considerable reduction of flow efficiency for higher water injection volume and deeper water inva-sion radius.
Water invasion during overbalanced, balancedand underbalanced drilling
To evaluate water invasion during drilling, layers 1 and 2 were considered as wellbore grids with 100% water satu-ration, and layers 3–57 as reservoir matrix grids. Differ-ent pressure values were assigned to the wellbore grids compared with the reservoir grids to model overbalanced, balanced and underbalanced drilling conditions.
The liquid invasion was modelled for the following cases, assuming the wellbore was exposed to wellbore fluid for
about four days. As shown in Figure 17, the simulation results are as follows: • 500 psia overbalanced pressure (wellbore pressure of
6,700 psia), resulted in 0.5” liquid invasion into matrix;• balanced pressure conditions (wellbore pressure of 0
psia) resulted in 0.4” liquid invasion into matrix;• 400 psia underbalanced (wellbore pressure of 5,800
psia) resulted in 0.3” liquid invasion into matrix; and,• 1,000 psia underbalanced (wellbore pressure of 5,200
psia) resulted in 0.3” liquid invasion into matrix.The simulation runs showed deeper liquid invasion for
overbalanced conditions. For underbalanced conditions, however, although the pressure within the wellbore was less than reservoir pressure, water still invaded through matrix rock due to strong capillary suction, which caused an increase in water saturation and liquid phase trapping around the wellbore. According to the results, water in-vaded the matrix even in highly underbalanced conditions in the wellbore. Considering the fact that during drilling in tight formations a weak mud cake is built and matrix rock is exposed to wellbore fluid for a long time, the capil-lary suction even in underbalanced conditions can cause water blocking of the rock matrix around the wellbore.
RESERVOIR SIMULATION FORDAMAGE EVALUATION
To understand the effect of different damage mecha-nisms on gas recovery from tight gas reservoirs, a reservoir
Figure 12. Simulation results related to the effect of perforation tunnels length on flow efficiency of a damaged core.
Figure 13. Numerical simulation of water blocking effect on flow efficiency (364 time steps of water injection duration).
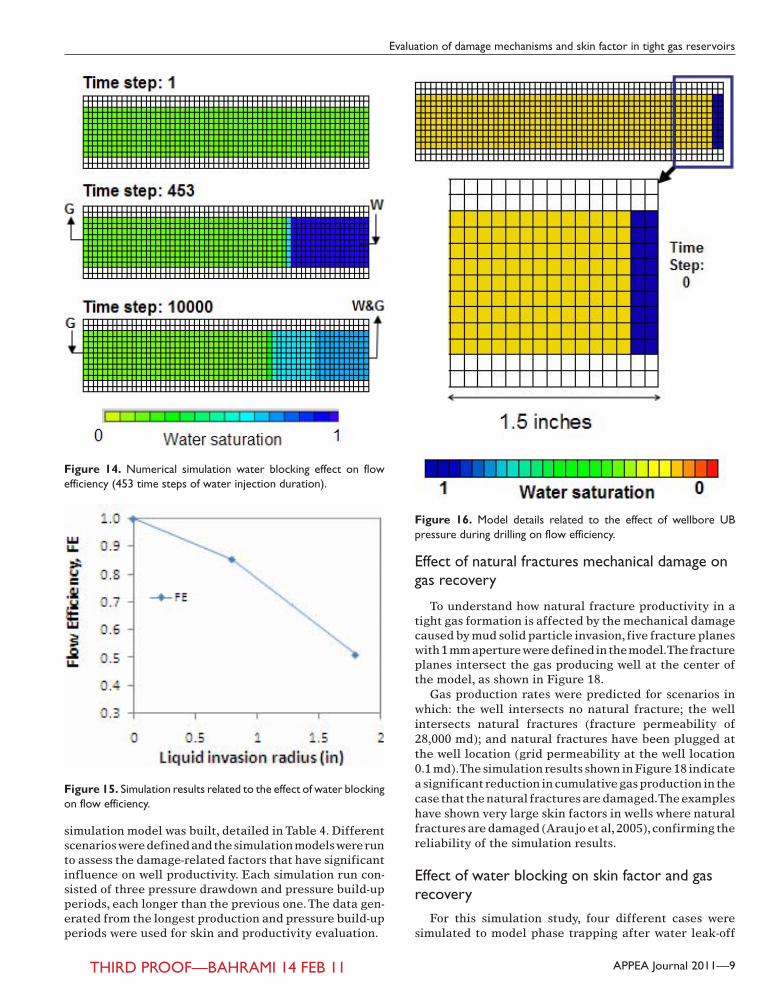
APPEA Journal 2011—9THIRD PROOF—BAHRAMI 14 FEB 11
Evaluation of damage mechanisms and skin factor in tight gas reservoirs
simulation model was built, detailed in Table 4. Different scenarios were defined and the simulation models were run to assess the damage-related factors that have significant influence on well productivity. Each simulation run con-sisted of three pressure drawdown and pressure build-up periods, each longer than the previous one. The data gen-erated from the longest production and pressure build-up periods were used for skin and productivity evaluation.
Effect of natural fractures mechanical damage ongas recovery
To understand how natural fracture productivity in a tight gas formation is affected by the mechanical damage caused by mud solid particle invasion, five fracture planes with 1 mm aperture were defined in the model. The fracture planes intersect the gas producing well at the center of the model, as shown in Figure 18.
Gas production rates were predicted for scenarios in which: the well intersects no natural fracture; the well intersects natural fractures (fracture permeability of 28,000 md); and natural fractures have been plugged at the well location (grid permeability at the well location 0.1 md). The simulation results shown in Figure 18 indicate a significant reduction in cumulative gas production in the case that the natural fractures are damaged. The examples have shown very large skin factors in wells where natural fractures are damaged (Araujo et al, 2005), confirming the reliability of the simulation results.
Effect of water blocking on skin factor and gasrecovery
For this simulation study, four different cases were simulated to model phase trapping after water leak-off
Figure 14. Numerical simulation water blocking effect on flow efficiency (453 time steps of water injection duration).
Figure 15. Simulation results related to the effect of water blocking on flow efficiency.
Figure 16. Model details related to the effect of wellbore UB pressure during drilling on flow efficiency.

10—APPEA Journal 2011 THIRD PROOF—BAHRAMI 14 FEB 11
H. Bahrami, R. Rezaee, D. Nazhat and J. Ostojic
into the formation. The water leak-off was followed by gas production during clean-up. In case A, no leak-off oc-curred. In case B, C and D about 215,770 and 1,400 barrels of water leaked off into the formation, respectively. In each of the models after the liquid leak-off, the well was put on a production followed by pressure build-up test. The pressure transient data was generated to analyse skin caused by phase trapping.
The cumulative injected volume of water during leak-off (Wi) and the simulated results for cumulative produced water (Wp) during clean-up and gas production are reported in Figure 19. Due to water leak-off, the phase trap caused a significant reduction in the gas production rate and gas recovery from the tight gas reservoir.
To quantitatively understand how phase traps can influ-
ence skin factor, the generated pressure build-up data was analysed to estimate skin value for the tight gas reservoir, as shown in Figure 20. The water blocking increased skin factor. In the case of no leak-off of liquid into the formation, the water blocking skin is zero, and in the case of 1,400 bbl of water leak-off into the formation, water blocking damage resulted in skin value of +9.7 in this well.
CONCLUSION
According to the simulation and modelling results per-formed in the study for gas wells in tight sand reservoirs, the following conclusions can be drawn:• Tight gas reservoirs have severe in situ stress anisot-
Table 4. Details of reservoir scale simulation model.
No. of grids in x, y and z directions
Reservoir size in x and y directions, ft Reservoir height, ft Reservoir permeability,
mdFracture permeability,
md
50*50*71 2,500 177.5 0.1 28,000
Initial pressure, psia Matrix porosity % Initial water saturation Critical water saturation Reservoir temperature, F
6,200 8 0.2 0.5 220
Figure 17. Simulation results related to the effect of wellbore underbalanced (UB) pressure during drilling on flow efficiency. Figure 18. Simulation results related to the effect of mechanical
damage to natural fractures on gas recovery.

APPEA Journal 2011—11THIRD PROOF—BAHRAMI 14 FEB 11
Evaluation of damage mechanisms and skin factor in tight gas reservoirs
ropy that results in large wellbore breakouts across the wellbore during drilling.
• In cased-hole completion in tight formations, perforation jet penetration into the formation may be significantly shallow due to the high strength of the rock matrix. In addition, severe wellbore instability and the large ce-ment volume behind the casing in the intervals with enlarged wellbore may greatly reduce the efficiency
of perforation in tight sand reservoirs. Therefore, the wellbore breakouts have a negative impact on produc-tivity of cased-hole perforated wells.
• In open-hole completion systems in tight gas wells, since the large wellbore breakouts can affect well productivity positively by enlarging the wellbore and reducing total skin factor, it may be more efficient than a cased-hole perforated system. To avoid wellbore collapse, slotted liner can be run across the open-hole section.
• Water blocking (liquid phase trap) is one of the major damage mechanisms in tight sand reservoirs due to relative permeability and capillary pressure effects. Liquid invasion during drilling or fracturing can result in trapping of the water phase inside the formation and clay swelling around the wellbore. Therefore, it causes positive skin factor and a noticeable reduction of ef-fective permeability within the invaded radius.
• Due to the strong capillary suction effect in tight for-mations and the presence of weak mud cake across the wellbore in tight formations, even in underbalanced drilling water can invade the nearby wellbore formation. Use of non-aqueous liquids for drilling and stimulation can help mitigate formation damage.
• Minimised damage to tight formations may be achieved by: using drilling long deviated wells perpendicular to the maximum horizontal stress; underbalanced drilling using non-aqueous drilling fluids; open-hole completion systems; and open-hole perforation using oriented deep penetrating charges.
NOMENCLATURE
P PressureQ Flow rateID Internal diametert TimeK PermeabilityS SkinL LengthWi Cumulative injected waterWp Cumulative produced waterrd damage radiuskd damaged zone permeabilityri invaded radiusPc Capillary pressureKr Relative permeabilitySwi Initial water saturationSwc Critical water saturation (the maximum water saturation at which the water phase will remain immobile)FE Flow efficiency Swb Damage due to water block and phase trapGR Gamma rayLp Perforation tunnel lengthUB UnderbalancedOB OverbalancedMMSCFD Million standard cubic feet per day
Figure 19. Simulation results related to the effect of water blocking on gas recovery.
Figure 20. Pressure build-up analysis for skin values created by different volumes of water leak-off into formation.

12—APPEA Journal 2011 THIRD PROOF—BAHRAMI 14 FEB 11
H. Bahrami, R. Rezaee, D. Nazhat and J. Ostojic
REFERENCES
ABASS, H., AND ORTIZ, I., 2007—Understanding Stress Dependant Permeability of Matrix, Natural Fractures, and Hydraulic Fractures in Carbonate Formations. SPE Saudi Arabia Section Technical Symposium, Dhahran, Saudi Arabia, 7–8 May, SPE 110973.
ABASS, H., 2009—Optimizing Proppant Conductivity and Number of Hydraulic Fractures in Tight Gas Sand Wells. SPE Saudi Arabia Section Technical Symposium, AlKhobar, Saudi Arabia, 9–11 May, SPE 126159.
AHMED, T., 2001—Reservoir Engineering Handbook (2nd ed.). Amsterdam: Elsevier.
ARAUJO, H., LACENTRE, P., ZAPATA, T., DZELALIJA, F., GILMAN, J., MENG, H.Z., KAZEMI, H. AND OZKAN, E., 2005—Identifying Wellbore Damage Components Through Discrete Fracture Network (DFN) models. SPE Annual Conference, Madrid, Spain, 13–16 June, SPE 94513.
BAHRAMI, H., REZAEE, M.R. AND ASADI, M.S., 2010—Stress Anisotropy, Long-Term Reservoir Flow Regimes and Production Performance in Tight Gas Reservoirs. SPE Eastern Regional Meeting, Morgantown, West Virginia, 12–14 October, SPE 136532.
BEHRMANN, L., 2000—Perforating practices that optimize productivity. Oilfield Review, 12 (1), 52–74.
BENNION, D.B. AND THOMAS, F.B., 1996—Low Permeabil-ity Gas Reservoirs: Problems, Opportunities and Solutions for Drilling, Completion, Stimulation and Production. SPE Gas Technology Symposium, Calgary, Canada, 28 April–1 May, SPE 35577.
BENNION, D.B. AND BRENT, F., 2005—Formation damage issues impacting the productivity of low permeability, low initial water saturation gas producing formations. Journal of Energy Resources Technology, 127 (3), 240–8.
BONNER, A. AND SALJOOGHI, A., 2007—Improvement of MDT success ratio. Schlumberger Reservoir Symposium, Abu Dhabi, UAE, 15–19 April.
CIVAN, F., 2000—Reservoir Formation Damage. Texas: Gulf Publishing Company.
DUSSEAULT, M.B., 1993—Stress Changes in Thermal Operations. SPE International Thermal Operations Sym-posium, Bakersfield, California, 8–10 February, SPE 25809.
FAIRHURST, D.L., INDRIATI, S. AND REYNOLDS, B.W., 2007—Advanced Technology Completion Strategies for Marginal Tight Gas Sand Reservoirs: A Production Optimization Case Study in South Texas. SPE Annual Technical Conference and Exhibition, Anaheim, California,
11–14 November, SPE 109863.
HOLDITCH, S.A., 1979 —Factors affecting water blocking and gas flow from hydraulically fractured gas wells. Journal of Petroleum Technology, 31 (12), 1515–24.
JOSEF R.S. AND DE KONING, J., 2009—Successful Mod-elling of Post-Fracture Cleanup in a Layered Tight Gas Reservoir. 8th European Formation Damage Conference, Scheveningen, The Netherlands, 27–29 May, SPE 122021.
SCHLUMBERGER FORMATION TESTING TRAINING COURSE, 2005—Abu Dhabi, United Arab Emirates.
SIYAVASH M., 2007—Quantitative Mechanism for Per-meability Reduction by Small Water Saturation in Tight Gas Sandstones. Rocky Mountain Oil & Gas Technology Symposium, Denver, Colorado, 16–18 April, SPE 107950.
TEUFEL, L.W., 1993—Control of Fractured Reservoir Per-meability by Spatial and Temporal variations in Stress Mag-nitude and Orientation. SPE Annual Technical Conference and Exhibition, Houston, Texas, 3–6 October, SPE 26437.
WARD, J.S., 1987—Capillary pressures and gas relative permeabilities of low-permeability sandstone. SPE Forma-tion Evaluation, 2 (3), 345–56.

APPEA Journal 2011—13THIRD PROOF—BAHRAMI 14 FEB 11
Evaluation of damage mechanisms and skin factor in tight gas reservoirs
THE AUTHORS
Hassan Bahrami is a PhD Candidate in the Department of Petroleum Engineering at Curtin University in Perth, Australia. He has recently focused on tight gas sand reservoirs damage and productivity. Prior to Curtin University, he worked for Sch-lumberger Data and Consulting Services as a borehole reservoir engineer (2003–9) and for Tehran Energy Consultants as a
reservoir engineer (2001–3). Hassan holds a BSc in chemical engineering from Persian Gulf University, and an MSc in reservoir engineering from Sharif University of Technology in Tehran, Iran.
Delair Nazhat is an MSc petroleum engineering candidate in the Depart-ment of Petroleum Engineering at Curtin University in Perth, Western Australia. He worked on core flood simulation for tight gas reservoirs as his thesis project. He pursued engineering experiences as a mechanical maintenance engineer at Bazian Cement Company in 2008 in Iraq, and as
a PVT Analyst at Core Laboratory in 2008–9. He was granted a BSc in mechanical engineering from Al-Mustansiria University in Baghdad, Iraq.
Jakov Ostojic is a Masters candidate with the Department of Petroleum Engineering at Curtin University in Perth, Western Australia. Prior to enrolling in the Master’s course at Curtin University he completed his Bachelor’s degree in Petroleum En-gineering at the University of Western Australia. His present focus is on tight gas reservoirs production performance.
Reza Rezaee is an Associate Professor in Curtin’s Department of Petroleum Engineering and has a PhD in Reservoir Characterisation. He has over 20 years experience in academia and industry. During his career he has been engaged in several research projects supported by national and international oil companies. These commissions, together with his
supervisory work at various universities, have involved a wide range of achievements. He has supervised more than 50 MSc and PhD students during his university career to date. His research has been focused on integrated solutions for reservoir charac-terisation, formation evaluation and petrophysics. He has used expert systems such as artificial neural networks and fuzzy logic, and has introduced several new approaches to estimate rock properties from log data where conventional methods failed to succeed. He is presently focused on unconventional gas includ-ing gas shale and tight gas sand studies, and is the lead scientist for the WA:ERA (EIS) Tight Gas and shale gas research projects.

14—APPEA Journal 2011 THIRD PROOF—BAHRAMI 14 FEB 11
H. Bahrami, R. Rezaee, D. Nazhat and J. Ostojic
THIS PAGE LEFT BLANK INTENTIONALLY.

78
Appendix E:
Using relative permeability curves to evaluate phase trapping damage caused by
water-based and oil-based drilling fluids in tight gas reservoirs. APPEA Journal
APPEA Journal 2012—1second proof—murickan 23 apr 12
G. Murickan, H. Bahrami, R. Rezaee, A. Saeedi, and P.A. Tsar Mitcheldepartment of petroleum engineering613 (rear), level 6, arrccurtin university26 dick perry avenue kensington Wa [email protected]
abstract
Low matrix permeability and significant damage mecha-nisms are the main signatures of tight-gas reservoirs. During the drilling and fracturing of tight formations, the wellbore liquid invades the tight formation, increases liquid saturation around the wellbore, and eventually reduces permeability at the near wellbore zone. The liquid invasion damage is mainly controlled by capillary pressure and relative permeability curves.
Due to high critical water saturation, relative permeability effects and strong capillary pressure, tight formations are sensitive to water invasion damage, making water blocking and phase trapping damage two of the main concerns with using a water-based drilling fluid in tight-gas reservoirs.Therefore, the use of an oil-based mud may be preferred in the drilling or fracturing of a tight formation. Invasion of an oil filtrate into tight formations, however, may result in the introduction of an immiscible liquid-hydrocarbon drilling or completion fluid around the wellbore, causing the entrap-ment of an additional third phase in the porous media that would exacerbate formation damage effects.
This study focuses on phase trapping damage caused by liquid invasion using a water-based drilling fluid in com-parison with the use of an oil-based drilling fluid in water-sensitive, tight-gas sand reservoirs. Reservoir simulation approach is used to study the effect of relative permeability curves on phase trap damage, and the results of laboratory experiments of core flooding tests in a West Australian tight-gas reservoir are shown, where the effect of water injection and oil injection on the damage of core permeability are studied. The results highlight the benefits of using oil-based fluids in drilling and fracturing of tight-gas reservoirs in terms of reducing skin factor and improving well productivity.
keyWords
Tight-gas reservoirs, relative permeability, phase trap dam-age, oil-based drilling fluids, water-based drilling fluids.
introduction
Tight-gas reservoirs normally have production problems due to very low matrix permeability and different damage mechanisms during well drilling, completion, stimulation and production (Dusseault, 1993). The low-permeability gas res-ervoirs can be subject to different damage mechanisms such as mechanical damage to formation rock, plugging of natural
fractures by invasion of solid mud particles, permeability re-duction around the wellbore as a result of filtrate invasion, clay swelling, and liquid phase trapping (Holditch, 1979).
In general, for tight-gas sand reservoirs, the average pore throat radius might be very small and, therefore, it may create tremendous amounts of potential capillary-pressure energy suction. As a result, it causes liquid to be imbibed and held in the capillary pores (Bennion and Brent, 2005), and causes sig-nificantly high critical water saturation (Bennion et al, 2006). Tight-gas reservoirs might be different in the case of initial water saturation (S
wi) compared with critical water saturation
(Swc
), depending on the geological time of gas migration to the reservoir. Initial water saturation might be normal, or in some cases sub-normal (S
wi less than S
wc) due to water phase
vaporisation into the gas phase (Bennion and Thomas, 1996). The initial water saturation might also be more than S
wc if the
hydrocarbon trap is created during or after the gas migration time. A sub-normal initial water saturation in tight-gas res-ervoirs can provide a higher relative permeability for the gas phase (effective permeability close to absolute permeability), and therefore, relatively higher well productivity (Bennion and Brent, 2005).
Liquid invasion into tight formations can increase water saturation around the wellbore and then, as the near wellbore zone is cleaned up by gas production, water saturation is re-duced gradually but no more than the critical water satura-tion (Amabaoku et al, 2006). This process eventually results in the reduction of near wellbore permeability. The damaging of permeability is referred to as phase trapping damage. Phase trapping was found to be related to capillary pressure and relative permeability, which both are direct functions of pore system geometry, interfacial tension between the invading trapped fluid, and the produced (or injected) reservoir fluid, wettability, fluid saturation levels, depth of invading fluid pen-etration, reservoir pressure, temperature, and drawdown po-tential (Bennion et al, 2006). The greater difference between initial water saturation and critical water saturation results in a more serious liquid phase trapping, causing a greater poten-tial damage to gas permeability and gas production in tight formations with sub-normal initial water saturation (Bennion and Brent, 2005).
evaluation of liquid invasion damage using relative permeability curves
Damage mechanisms such as water phase trapping, partial blockage of open pores by water, and reducing pore openings due to clay swelling can reduce effective permeability in the wa-ter-invaded zone (Motealleh, 2007). The damaging effects are all reflected on gas and water relative permeability curves and therefore, these curves can be used for the evaluation of dam-age mechanisms. Damage of permeability by water invasion and the effect on relative permeability curves are shown in Figure 1.
Water-sensitive tight formations may initially have a high relative permeability (K
r at S
wi), but very low relative permea-
bility after being exposed to water (Kr at S
gc). The effective per-
uSinG RelATive PeRMeABiliTy cuRveS To evAluATe PHASe TRAPPinG dAMAGe
cAuSed By wATeR-BASed And oil-BASeddRillinG fluidS in TiGHT-GAS ReSeRvoiRS
Lead authorGeeno
Murickan

2—APPEA Journal 2012 second proof—murickan 23 apr 12
G. Murickan, H. Bahrami, R. Rezaee, A. Saeedi, and P.A. Tsar Mitchel
meability in the invaded area of water-sensitive tight forma-tions may not be improved during the clean-up period, since water has already damaged the formation, and been trapped in the invaded zone, and therefore, may cause significant reductions in well productivity. Tight sandstone formations that have a strong sensitivity to fresh or sodium chloride wa-ters (for example where Smectite is present in the formation) might be severely damaged by water invasion when they are exposed to water-based drilling or fracturing fluid.
Phase trapping can also cause damage when an oil-based drilling fluid is used. The invasion of an oil filtrate into tight formations may result in the introduction of an immiscible liquid-hydrocarbon drilling or completion fluid around the wellbore, causing the entrapment of an additional third phase in the porous media that would exacerbate formation damage effects (Bennion et al, 2006). The relative permeability curves illustrated in Figure 2 (Bennion et al, 2006) show the reduced effective permeability due to water-filtrate invasion into the formation (Fig. 2a), compared with damage to permeability with oil invasion (Fig. 2b).
Various different correlations have been proposed to esti-mate the representative relative permeability curves of a hy-drocarbon reservoir for drainage and imbibition processes. Using correlations such as the ones explained in the following sections, measured relative permeability data from core flood-ing experiments can be smoothed, and be used for reservoir simulation studies.
corey’s formula
In Equations 1–3, Sw
is water saturation, Sw,irr
is irreduc-ible water saturation, K
rw is relative permeability to the wet-
ting phase, and Krnw
is relative permeability to the non-wetting phase.
K Srw w=+
[ ]*2 3λ
λ (1)
K S Srnw w w= − −+
[ ] [ ]* *1 122 λ
λ (2)
S S S Sw w w irr w irr*
, ,[ ]/[ ]= − −1 (3)
Corey observed that a log-log plot of S*w
against Pc results in
a straight line and slope, which is the characteristic of the pore structure (Wells and Amaefule, 1985).
ibrahim, bassiouni and desbrandes method
This method is based on combining the tortuosity model of Wyllie and Grander with capillary pressure data. This method proposes a normalised method of relative permeability estima-tion using capillary pressure data. The relationship between water saturation and capillary pressure is given in Equation 4.
Pc=a / S
wb (4)
Equation 4 indicates that a log-log plot of Pc versus S
w results
in a straight line. From its slope and intercept, the coefficients a (the entry capillary pressure) and b (the inverse of the pore throat distribution index) can be estimated. The theory is based on Purcell’s theoretical expression relating relative permeability and capillary pressure. It is said to be based on the analogy be-tween Darcy’s empirical law for the sand packs and Poiseuille’s
Figure 1. Reduced gas relative permeability due to water blocking.
Figure 2a. Illustration of phase trap damage effect of water-based fluids in low-permeability, sub-normally water-saturated gas reservoirs (Bennion et al, 2006).
Figure 2b. Illustration of phase trap damage effect of oil-based fluids in low-permeability, sub-normally water-saturated gas reservoirs (Bennion et al, 2006).

APPEA Journal 2012—3second proof—murickan 23 apr 12
using relative permeability curves to evaluate phase trapping damage caused by water-based and oil-based drilling fluids in tight-gas reservoirs
formula, which models the reservoir as a bundle of capillary tubes with the same length, but different diameter. Wyllie and Grander modified Purcell’s model to simulate the probability of the interconnection of pores by cutting the bundle of tubes into a large number of thin slices, and reassembling them in a random way. This accommodated tortuosity into the model. The relative permeability correlations for drainage process are presented in Equations 5–8.
Krw
= S*w
2[Sw
c - Swirr
c]/[1 - Swirr
c] (5)
Krnw
= [1 - S*w
]2[1 - Sw
c]/[1 - Swirr
c] (6)
S*w
= [Sw
- Sw,irr
]/[1 - Sw,irr
] (7)
c = 2b + 1 (8)
Krw
is the relative permeability of the wetting phase (water), K
rnw is the relative permeability of the non-wetting phase (gas),
and Sw,irr
is irreducible water saturation (Ibrahim, Bassiouni and Desbrandes, 1992).
naar and Henderson model
This model addresses the entrapment of the non-wetting phase during the imbibition process, and estimates imbibition relative permeability using drainage relative permeability data. Naar and Henderson related the drainage and imbibition satu-ration for equal values of non-wetting relative permeability as Equation 9.
S S R Sw w w*( )
*( )
*( )[ ]Imb drg drg= − 2 (9)
Sw*( )Imb and Sw drg
*( ) are effective water saturation for imbibi-
tion and drainage respectively, and R is the residual saturation of the non-wetting phase. It is empirically related to porosity (φ) by Equation 10.
R = 0.617 - 1.28φ (10)
For tight-gas sands, Ibrahim, Bassiouni and Desbrandes de-veloped the wetting phase relative permeability as Equation 11.
kk
S
aSrwt
bw
w=1
23σ
φ( * )* (11)
K is the absolute permeability, σ is the interfacial tension, and ϕ is the reduced porosity defined as Equation 12.
ϕ* = ϕ(1 - Swi
) (12)
The saturation values during calculation are normalised using the following relationships (Eqs 13 and 14) and the nor-malisation factor.
xSwi
=− −log ( )
(log ( )
2 Sgc Swi (13)
Swi normalized = − −[ ] ( )S
SSw
wiwi
x 1 (14)
ibrahim and koederitz method
Ibrahim and Koederitz correlations are based on regression models, which are reliable for a particular range of the data (Ibrahim and Koederitz, 2001). For a water-gas system, the regres-
sion model suggests the following correlations (Eq. 15 and 16).
k = 1.3046802 S * 8.159598 S *+ 25.50978 S
rgw g g2
g
−** 31.53754 S *
+ 13.883828 S *
3g
4
g4
−
(15)
k = 0.9455537 S * 1.2967293 S *+ 1.69592185 S
rw 1 12−
113
gc a3
15
wc1.5
* 0.0424518 S (lnk ) S *145.83028S (
−− φSS *) + .02764389(k S ) S *l
2a gc
41
4
(16)
Sg* and S
1* are defined in Equations 17 and 18.
SS S
S Sgg gc
gc lc
*( )
=−
− +1 (17)
SS
Sg
lc1 1
1* ( )= −
− (18)
Sg is gas saturation, S
gc is critical gas saturation, S
l is liquid
saturation, Slc
is the total of critical liquid saturations present in the system, S
w is water saturation, S
wc is critical (connate) water
saturation, Swi
is initial water saturation, ka
is absolute perme-ability, k
rgw is the relative permeability of gas with respect to wa-
ter, and krw
is the relative permeability of water. The saturation data from the capillary pressure data is used in this regression model to find the relative permeability.
reservoir simulation fordamage evaluation
Invasion damage can be modelled based on the reduction of the relative permeability when liquid saturation is increased around the wellbore by liquid injection. The trapping of the wa-ter phase in the near wellbore zone is controlled by relative per-meability and capillary pressure curves that manage how the invaded liquid is held inside the reservoir model grids around the wellbore. Reservoir simulation of tight-gas reservoirs was carried out to qualitatively evaluate the effect of water and oil invasion damage on well productivity.
To build a reservoir model, different field data were reviewed to gather the required data. The reservoir data from tight-gas sandstones in Western U.S. basins (Department of Energy, 2011) and the Perth Basin in WA were studied to determine an estimation of the parameters that are required for build-ing a reservoir simulation model. The available data related to the in situ critical gas saturation and critical water satura-tion distribution for different in situ porosity, routine porosity, and permeability values are reported in Figures 3a–3d. The WA field data from the productive sandstone sections showed an average porosity and absolute permeability of 9% and 0.1 mD, respectively.
A set of gas-water relative permeability data (measured un-der 4,000 psia effective pressure) was also available for the WA field, which were smoothed using the Ibrahim, Bassiouni and Desbrandes relative permeability correlations (Eqs 5 and 6). For the oil-gas system, there was no core flood test data available, and therefore, published typical oil-gas relative permeability data in a tight-gas reservoir simulation study (Ravari et al, 2005) was used. The relative permeability data for gas-water and gas-oil systems are shown in Figures 4a and 4b, respectively.
CMG’s (Computer Modelling Group) IMEX black-oil reser-voir simulator was used to numerically model liquid invasion and gas production. The model is block sized, with a grid sys-tem of 22 × 22 × 20 grids in an x-, y- and z-direction. The size of each grid block is 1 m. The reservoir model 3D view is shown in Figure 5, and the model input data details are reported in Table 1. The reservoir model is simplified and homogeneous since the details of reservoir heterogeneity were not available.

4—APPEA Journal 2012 second proof—murickan 23 apr 12
G. Murickan, H. Bahrami, R. Rezaee, A. Saeedi, and P.A. Tsar Mitchel
The data summarised above was used to build the reservoir simulation model, and evaluate phase-trap damage for differ-ent cases of water-based versus oil-based drilling fluid. The model was run for the following scenarios:• no liquid invasion prior to gas production (no damage);• injection of water in the well to model water invasion, then
gas production from the model to clean-up the water from the invaded area (water damage); and,
• injection of oil in the well to model oil invasion, then gas production from the model to clean-up the oil from the invaded area (oil damage).The operational constraint for the injection well is a constant
liquid injection rate (oil or water) and that of the producer is a constant bottom hole pressure. This is supposed to simulate the invasion of fluids during drilling. The water damage model
Figure 3a. Critical gas saturation versus porosity in tight-gas reservoirs.
Figure 3b. Critical water saturation versus porosity in tight-gas reservoirs.
Figure 3c. Critical gas saturation versus permeability in tight-gas reservoirs.
Figure 3d. Critical water saturation versus permeability in tight-gas reservoirs.
Figure 4a. Capillary pressure and relative permeability for a gas-water system.
Figure 4b. Capillary pressure and relative permeability for a gas-oil system.

APPEA Journal 2012—5second proof—murickan 23 apr 12
using relative permeability curves to evaluate phase trapping damage caused by water-based and oil-based drilling fluids in tight-gas reservoirs
is a two phase water-gas system, and the oil damage model is a three phase water-oil-gas system.
The effect of phase trapping damage can be seen from the in-vading liquid saturation distribution (water or oil) in the model after the injection period, compared with the saturation distri-bution at the end of the gas production period. The phase trap damage in the cases of water invasion followed by gas produc-tion, and oil invasion followed by gas production are shown in Figures 6 and 7, respectively. Figures 6a and 6b, respectively, show water saturation distribution around the wellbore after the water injection time (at the end of water invasion), and after the gas production period (at the end of clean-up), in the case of water damage. Figures 7a and 7b, respectively, show gas satu-ration distribution around the wellbore after the oil injection time (at the end of oil invasion), and after the gas production period (at the end of clean-up). As seen in Figure 7, there is trapped water as well as oil in the model, which has not been removed from the invaded zone, even after 90 days of gas pro-duction in both cases.
To evaluate the oil and water phase trapping effects on well productivity, the cumulative production rate for the three mod-els were plotted in Figure 8. The results highlighted that both oil and water invasion reduces well productivity. The model is more sensitive to water invasion damage, and injection of
water has caused the cumulative gas produced from the water-damaged model, to be significantly lower compared with the no-damage model. In the case of oil injection, the damaging effect is significantly less than water damage, and therefore, in the case of oil injection, the model produced more gas than the water-damaged model.
laboratory experiments:oil versus Water invasion damage
Laboratory experiments on the WA core samples were per-formed to compare damage to the core permeability caused by water invasion versus oil invasion. Absolute permeability of each core sample was measured at 100% gas saturation. The characteristics of the core samples that were tested for damage evaluation are reported in Table 2. For water damage evalua-tion, the core samples were saturated with water, followed by flooding of gas into the core samples until water saturation was reduced to the minimum of residual water saturation, then core effective permeability was measured (K
rg at S
wr). Similarly, for
oil damage evaluation, the core samples were saturated with oil, then gas was flooded into the core sample until oil satura-tion was reduced to the minimum of residual oil saturation to measure core effective permeability (K
rg at S
or). The core testing
conditions were 5,800 psia pore pressure and a temperature of 109°C.
Figure 5. Reservoir model, 3D view (x and y are horizontal, and z is vertical).
Figure 6b. Water saturation distribution at the end of the gas production and clean-up period (water damage).
Figure 6a. Water saturation distribution at the end of the water invasion period (water damage).
Table 1. input parameters in the simulation model.
Reservoir Tight-gas
Well Vertical
Porosity 9%
Permeability 0.1 mD
Reservoir pressure 41,368.5 KPa
Reservoir temperature 100°C
Wellbore fluid Water or oil
Fluid Gas
Gas gravity 0.62
Critical water saturation 0.5
Critical gas saturation 0.1
BHP, flowing 25,000 KPa

6—APPEA Journal 2012 second proof—murickan 23 apr 12
G. Murickan, H. Bahrami, R. Rezaee, A. Saeedi, and P.A. Tsar Mitchel
The core flooding test results are shown in Table 3. As il-lustrated in the case of oil damage, the core samples’ effective permeability is reduced from 1 to 0.41–0.51, and in the case of water damage, it is reduced to 0.22–0.35. The tight formation is subjected to invasion damage in both cases of oil injection and water injection into the core. Severity of the damage is less, however, in the case of oil damage compared to water damage. For damage caused by oil and water invasion (the severity of oil damage being less than water damage), the core flooding experiment results confirm the validity of reservoir simulation runs.
conclusions
• Phase trapping is one of the main damage mechanisms in tight-gas reservoirs, which significantly reduces the well productivity in the cases of water or oil invasion.
• In the case of drilling with water-based fluids, tight forma-tions might be sensitive to water invasion, water phase may get trapped in the reservoir, and their permeability to gas may markedly drop during exposure to water.
• In the case of drilling with oil-based fluids, invasion of oil filtrate into tight formations may result in the introduction of an immiscible liquid hydrocarbon drilling or comple-tion fluid around the wellbore, causing the entrapment of
an additional third phase in the porous media that would exacerbate formation damage effects.
• Severity of damage is less in the case of oil-based drilling fluids compared with water-based drilling fluids. The use of oil-based mud fluid instead of water-based mud in the drill-ing of tight formations may reduce damage to the formation, and therefore, provide improvement in gas production and ultimate recovery.
acknoWledgments
The authors wish to acknowledge Dr Ben Clennell (CSIRO), Dr Ahmad Jamili (University of Oklahoma), Sultan Mehmood, Mohsen Ghasemi Ziarani, Mahna Mehdizadeh Dasjerd and Abolfazl Ameri Sianaki (Curtin University) for their technical support and help regarding this study. The authors would also like to thank CMG (Computer Modelling Group) and Strategy Central for use of CMG-IMEX reservoir simulation software.
nomenclature
φ PorosityP
c Capillary pressure
krw
Wetting phase relative permeabilityk
rnw Non-wetting phase relative permeability
Figure 7a. Gas saturation distribution at the end of the oil invasion period (oil damage).
Figure 7b. Gas saturation distribution at the end of the gas production and clean-up period (oil damage).
Core sample flooded by water, cleaned up with gasEnd point
methane Kr at SwrSample A1: 0.224 Sample A2: 0.353 Sample A3: 0.219
Core was flooded by oil, cleaned up with gasEnd point
methane Kr at SorSample B1: 0.507 Sample B2: 0.413 –
Table 3. core flooding experiment results.
Coresample
Coreporosity, %
Core absolute permeability, mD
Sample A1 6.7 0.003Sample A2 9.6 0.034Sample A3 11.4 0.026Sample B1 4.6 0.034Sample B2 5.4 0.032
Table 2. details of the core samples’ characteristics.
Figure 8. Cumulative gas production, no-damage compared with oil-based and water-based drilling fluid damage.

APPEA Journal 2012—7second proof—murickan 23 apr 12
using relative permeability curves to evaluate phase trapping damage caused by water-based and oil-based drilling fluids in tight-gas reservoirs
Swr
Residual wetting phase saturationλ Slope of the linear relation between natural logarithm of P
c and S
w*
a , b Coefficients reflecting the formation pore size distributionK
rw Relative permeability of the wetting phase
Krnw
Relative permeability of the non-wetting phase (here, gas)c Coefficient S
w* Effective water saturation
Swi
Irreducible water saturationSw
*( )Imb Effective water saturation for imbibition
Sw drg*( ) Effective water saturation for drainage
R Residual saturation of the non-wetting phaseS
g Gas saturation
Sgc
Critical gas saturationS
l Liquid saturation
Slc
Total of critical liquid saturations present in the systemS
w Water saturation
Swc
Critical (connate) water saturationS
or Residual oil saturation
ka Absolute permeability, mD
krg
Relative permeability of gask
rgw Relative permeability of gas with respect to water
krlg
Relative permeability of liquid with respect to gask
rw Relative permeability of water
references
BENNION, D.B., AND BRENT, F., 2005—Formation damage issues impacting the productivity of low permeability, low initial water saturation gas producing formations. In: Journal of Energy Resources Technology, 127 (3), 240–6.
BENNION, D.B, THOMAS, F.B., AND BIETZ, R.F., 1996—Low Permeability Gas Reservoirs: Problems, Opportunities and Solutions For Drilling, Completion, Stimulation and Pro-duction. SPE Gas Technology Symposium, Calgary, Alberta, 28 April–1 May, SPE 35577.
BENNION, D.B., THOMAS, F.B., SCHULMEISTER, B., AND ROMANOVA, U.G., 2006—Water and Oil Base Fluid Retention in Low Permeability Porous Media – an Update. 7th Canadian International Petroleum Conference (57th Annual Technical Meeting), Calgary, Alberta, June 13–15.
DEPARTMENT OF ENERGY 2011—Well data > Mesaverde tight gas sandstones. Accessed November 2011. <http://www.discovery-group.com/projects_doe_welldata.htm>.
HOLDITCH, S.A., 1979—Factors affecting water blocking and gas flow from hydraulically fractured gas wells. In: Journal of Petroleum Technology, 31 (12), 1515–24.
IBRAHIM, A., BASSIOUNI, Z., AND DESBRANDES, R., 1992—Determination of relative permeability curves in tight gas sands using log data. SPWLA 33 Annual Logging Symposium, Oklahoma City, Oklahoma, 14–17 June, 1992-SS.
IBRAHIM, M.N.M., AND KOEDERITZ, L.F., 2001—Two Phase Steady State and Unsteady State Relative Permeability Predic-tion Models. SPE Middle East Oil Show, Bahrain, 17–20 March, SPE 68065.
MOTEALLEH, S., AND BRYANT, S.L., 2007—Quantitative Mechanism for Permeability Reduction by Small Water Satu-ration in Tight Gas Sandstones. SPE Rocky Mountain Oil and Gas Technology Symposium, Denver, Colorado, 16–18 April, SPE 107950.
RAVARI, R.R., WATTENBARGER, R.A., AND IBRAHIM, M., 2005—Gas Condensate Damage in Hydraulically Fractured Wells. Asia Pacific Oil and Gas Conference and Exhibition, Jakarta, Indonesia, 5–7 April, SPE 93248.
Wells J.D., and Amaefule, J.O., 1985—Capillary Pressure and Permeability Relationships in Tight Gas Sands. SPE/DOE Low Permeability Gas Reservoirs Symposium, Denver, Colorado, 19–22 March, SPE/DOE 13879.
Authors' biographies next page.

8—APPEA Journal 2012 second proof—murickan 23 apr 12
G. Murickan, H. Bahrami, R. Rezaee, A. Saeedi, and P.A. Tsar Mitchel
THe AuTHoRS
Geeno Murickan is a petroleum engineer who graduated from curtin university (perth). prior to this, geeno had worked for larsen & toubro, india, as a design engineer (2007–10). geeno holds a bachelor degree in mechanical engineering from cochin university of science and technology, india.
Hassan Bahrami is a phd candidate in the department of petroleum engi-neering at curtin university (perth). at present, he is focused on tight-gas sand reservoir damage and productivity. as a member of curtin university’s uncon-ventional gas research group, Hassan has been involved in the projects relat-ed to tight-gas reservoirs, and provides
technical support to the studies. prior to curtin university, Hassan worked as a reservoir engineer for schlumberger (2003-2009) and tehran energy consultants (2001–03). Has-san holds a b.sc degree in chemical engineering, and a m.sc degree in reservoir engineering.
Assoc. Professor Reza Rezaee of curtin university’s department of petroleum engineering has a phd in reservoir characterisation. He has more than 20 years’ experience in academia and industry. during his career, reza has been engaged in several research projects supported by national and international oil companies and these commissions,
together with his supervisory work at various universities, have involved a wide range of achievements. reza has supervised more than 50 m.sc and phd students during his university career to date. His research has been focused on integrated solutions for reservoir characterisation, formation evaluation, and petrophysics. He has used expert systems such as artificial neural networks and fuzzy logic, and has introduced several new approaches to estimate rock properties from log data where conventional methods fail to succeed. at present, he is focused on unconventional gas including gas shale and tight gas sand studies, and is the lead scientist for the Wa:era (eis) tight gas and shale gas research projects.
Ali Saeedi is a research fellow with the petroleum engineering department at curtin university (perth). ali’s main research interest is the multiphase flow and general reservoir engineering aspects of ccs, and he has been exten-sively involved in experimental analysis of multiphase flow in porous media for both eor (enhanced oil recovery) and
ccs (carbon capture and storage) processes. He holds an m.sc and a phd in petroleum engineering.
Tsar Mitchel is, at present, pursuing a master’s degree in petroleum engineering from curtin university (perth). He had a brief stint with kenya electricity generating company ltd as an exploration geophysicist before joining the national oil corpoation of kenya as a petroleum geophysicist. He holds a bachelor’s degree in geophysics.

79
Appendix F:
Hydraulic fracture productivity performance in tight gas sands – A Numerical
Simulation Approach. Journal of Petroleum Science and Engineering

Journal of Petroleum Science and Engineering xxx (2012) xxx–xxx
PETROL-02127; No of Pages 7
Contents lists available at SciVerse ScienceDirect
Journal of Petroleum Science and Engineering
j ourna l homepage: www.e lsev ie r .com/ locate /pet ro l
Production performance of hydraulic fractures in tight gas sands, a numericalsimulation approach
J. Ostojic ⁎, R. Rezaee, H. BahramiDepartment of Petroleum Engineering, Curtin University, Australia
⁎ Corresponding author.E-mail address: [email protected] (J. Ostoji
0920-4105/$ – see front matter © 2011 Published by Eldoi:10.1016/j.petrol.2011.11.002
Please cite this article as: Ostojic, J., et al., PrJ. Pet. Sci. Eng. (2012), doi:10.1016/j.petrol
a b s t r a c t
a r t i c l e i n f oArticle history:Received 8 June 2011Accepted 25 November 2011Available online xxxx
Keywords:Production performanceHydraulic fracturesTight gas sandsNumerical simulation approach
Hydraulically fractured tight gas reservoirs are one of the most common unconventional gas sources beingproduced today, and will be a regular source of gas in the future. The extremely low permeability of tightgas sands leads to inaccuracy of conventional build-up and draw-down well test results. This is primarilydue to the increased time required for transient flow in tight gas sands to reach pseudo-steady state condi-tion. To increase accuracy, well tests for tight gas reservoirs must be run for longer periods of time whichis in most cases not economically viable. The large amount of downtime required to conduct well tests intight sands makes them far less economical than conventional reservoirs, which leads to the need for accu-rate simulation of tight gas reservoir well tests.This paper presents simulation results of a 3-D hydraulically fractured tight gas model created using Eclipsesoftware. The key aims are to analyze the effect of differing fracture orientation, number and length. Thefocus of the simulation runs will be on the effect of hydraulic fracture orientation and length. The resultswill be compared to simulation runs without the abovementioned factors to determine their effects on pro-duction rates and well performance analysis. All results are plotted alongside an un-fractured tight gas sce-nario in order to put the hydraulic fracture performance in perspective.Key findings from this work include an approximately linear relationship between initial gas rate and thenumber of hydraulic fractures intersecting the wellbore. In addition, fracture length is found to have less ofan impact on initial gas rate compared to number of fractures intersecting the wellbore, for comparabletotal fracture volumes.
© 2011 Published by Elsevier B.V.
1. Introduction
The increasing global demand for energy along with the reductionin conventional gas reserves has lead to the increasing demand andexploration of unconventional gas sources. Tight gas sands are oneof the most commonly produced unconventional gas resourcesaround the world, but the low productivity and permeability providefurther challenges in meeting economic production (Pankaj andKumar, 2010). Tight gas sands are most commonly defined as a reser-voir system with low permeability, generally less than 0.1 mD, andlow porosity, generally less than 10%, (Pankaj and Kumar, 2010).More recent definitions outline the importance of reservoir stimula-tion by hydraulic fracturing in modern tight gas production. Tightgas sands have been defined by Holditch, 2006 “a reservoir that can-not be produced at economic flow rates nor recover economic vol-umes of natural gas unless the well is stimulated by a largehydraulic fractures.” Addis and Yassir (2010) also defined tight gas
c).
sevier B.V.
oduction performance of hyd.2011.11.002
sands as requiring “man-made” permeability systems for economicproduction.
Due to the extremely low permeability, and subsequently low res-ervoir flow of tight gas sands, many conventional well tests and anal-ysis methods are not economically viable (Manrique and Poe, 2007).This is partly due to the fact that tight gas sands require much longertime periods to reach stable reservoir pressure for conventionalbuild-up tests. Similar issues arise with determining hydraulic frac-ture performance, the inherently low reservoir permeability increasestime required to determine fracture performance (Garcia et al., 2006).
There are many documented studies regarding optimization ofvarious fracture properties, such as fracture length and aperture, toimprove performance. For example, Pankaj and Kumar (2010), ana-lyzed various studies conducted on the impact of initial reservoirpressure (2100–2500 psi), reservoir permeability (0.01–0.1 mD) andfracture half length (100–500 ft). However, fracture orientation withrespect to the wellbore is not covered by the simulation analysis. Ini-tial reservoir pressure was found to have a minimal impact on initialproduction rate compared to reservoir permeability. Shah et al.(2010), discusses the theoretical difference between hydraulic frac-ture performance based on orientation, comparing fractures perpen-dicular and along the wellbore. Hydraulic fractures formed along
raulic fractures in tight gas sands, a numerical simulation approach,

Fig. 1. Contact area with wellbore for perpendicular (bottom) and along the wellbore(top) fractures, Shah et al. (2010).
Table 1Model description and properties.
Unit Value Unit Value
Number of cells x, y, z 50, 50, 71 Reservoir constraint Gas rate, MSCF 500Cell size x, y, z (ft) 75, 75, 2.5 Production and buildup tests 3 consecutive Varying time intervalPorosity % 8 Fracture half length ft 275–575Permeability mD 0.1 Number of hydraulic fractures – 0–12Reservoir pressure psia 4000 Fracture porosity % 80Well type – Vertical, single well Fracture permeability mD 28,000Reservoir thickness ft 177.5 Perforation length ft 177.5
2 J. Ostojic et al. / Journal of Petroleum Science and Engineering xxx (2012) xxx–xxx
the wellbore can be expected to have a greater impact on productionperformance due to the increased contact area of the hydraulic frac-ture and wellbore. In addition, the reduced contact area provides asmaller flow path into the wellbore, increasing fluid velocity there-fore resulting in more turbulent flow.
Jamiolahmady et al. (2009), modified the Unified Fracture Designmethod (UFD), originally proposed by Valko and Michael (1998), toaccount for coupling and internal effects.
Addis and Yassir (2010), take the approach of optimizing hydrau-lic fracture design via intersecting already existing natural fractures.The idea of intersecting natural fractures is economically advanta-geous as overall reservoir permeability and sweep is increased byboth the new hydraulic fractures, and by increased connectivitywith high permeability natural fractures.
Rushing and Blasingame (2003), used a combination of declinecurve analysis and simulation of long production periods to deter-mine the stimulation effectiveness of hydraulically fractured gaswells. A combination of Material Balance Decline Type Curve(MBDTC) methodology and different type curve plotting functionswere used to match results against real tight gas reservoir data.Rietman (1998) also used decline curves to analyze the sensitivityof optimum fracture length under different reservoir parameters.The findings showed that reservoir porosity and pay thickness aremore influential on performance than permeability and drainagearea.
The aim of this paper is to generate common trends between frac-ture size, fracture spacing and fracture orientation on initial tight gasreservoir response. Using post hydraulic fracture production data, al-ready calculated on most fields, to analyze early time reservoir re-sponse. As previously discussed, reducing time required for analysisis a major challenge for tight gas reservoirs; therefore the use ofearly time data is the key focus of this paper.
The approach is to use a 3-D reservoir model to analyze impacts ofthe abovementioned facture parameters on a single vertical wellcompleted in tight gas sands. Overall fracture volume between com-parable hydraulic fracture scenarios will be similar, with an overalldifference less than 10% (not equal due to the size of cells withinthe model). The variables varied for this investigation are, fracturenumber, fracture length and fracture orientation. The results will aidin determining the most efficient hydraulic fracture layout with com-parable proppant volume used (as per fracture volume). Comparisonswill be made between 1150 ft fractures and 550 ft fractures; more550 ft fractures are simulated to obtain similar overall fracture vol-ume. Gas production rates and cumulative gas production data willbe used to analyze the impact of additional 1150 ft and 550 ft frac-tures on production performance.
Fracture orientation with respect to the wellbore is also simulatedand analyzed. Similar to the previous comparison, the comparable hy-draulic fracture models have equal overall fracture volume. Onemodel has the hydraulic fracture created along the wellbore, whilethe other model has the hydraulic fracture perpendicularly intersect-ing the wellbore. This comparison aims to determine the productionperformance of hydraulic fractures orientation with respect to thewellbore; hence the results should be comparable for horizontallycompleted wells.
Please cite this article as: Ostojic, J., et al., Production performance of hydJ. Pet. Sci. Eng. (2012), doi:10.1016/j.petrol.2011.11.002
The findings from this analysis can be used in conjunction withother optimization techniques to improve overall hydraulic fracturedesign.
2. Model description
Commercial simulation software is used to create a 3-D homoge-neous model with tight gas properties, the properties of the modelare outlined in Table 1. Commercial reservoir simulation software,Eclipse, is used for all simulations. Eclipse 100 is a numerical 3-D sim-ulator capable of simulating various types of oil and gas reservoir pro-duction including tight gas reservoirs (Schlumberger GeoQuest,2008). A single vertical well is created in the center of the reservoirto ensure symmetrical depletion throughout the production periods.Numerous simulations are completed examining fracture orientation,size and fracture number effects on well test response in terms ofearly time production rate and cumulative production.
To analyze the effect of fracture orientation, two simulations withfractures perpendicular to one another are created, both having equalfracture volume. One model contains a single fracture perpendicularto the wellbore, and the other model with a single fracture alongthe wellbore, Fig. 1 shows a schematic of the two cases for a verticalwell. The hydraulic fracture along the wellbore model is created towith the expectation to achieve greater production. The
raulic fractures in tight gas sands, a numerical simulation approach,

Fig. 2. Schematic of 550 ft and 1150 ft fracture sizes (not to scale).
3J. Ostojic et al. / Journal of Petroleum Science and Engineering xxx (2012) xxx–xxx
“perpendicular fracture” is simulated in the center of the perforatedsection of the box model intersecting the wellbore perpendicularly.
The impact of fracture size vs. fracture number is conducted witheach comparative model containing almost equal total fracture vol-ume but with a different number of fractures. The fracture volumesare not exactly equal between the models due to the size of thegrid-blocks used for simulation, however the difference is negligible(less than 10%) compared to the overall fracture volume. Havingvery similar fracture volume ensures that the overall increased per-meability of the model is equal, leaving only the fracture size andspacing as the variables. One scenario compares one 1150 ft horizon-tal fracture to four 550 ft horizontal fractures; with the single fractureand four fracture models having equal fracture volume. This analysisaims to determine which hydraulic fracture method is more benefi-cial in terms of production performance, numerous smaller fracturesor fewer larger fractures.
3. Results and discussion
For all scenarios two sets of plots are discussed, gas productionrate vs. time and cumulative gas production vs. time. Both the frac-ture size vs. number of fractures, and perpendicular vs. along thewellbore fracture cases are compared to a no fracture scenario, inorder to put the increased production performance in perspective.This is achieved by making the production rate vs. time plots dimen-sionless with respect to the un-fractured model. In other words, theproduction rates of all fractured models are divided by the no fractureproduction rate to emphasize the benefit with respect to an un-fractured tight gas reservoir. The production period is 12,000 h(~500 days), however only the early time gas production rate results(first 72 h) along with cumulative production after 500 days areanalyzed.
The gas production rate results are plotted on a semi-log plot, withtime displayed on a logarithmic scale; this creates clarity for earlytime production rate behavior analysis.
3.1. Fracture size vs. number of fractures
As discussed, this analysis is conducted to compare the productionperformance of generating large fractures (1150 ft) or smaller frac-tures (550 ft), all with comparable overall fracture volume.
The fractures simulated are symmetrical and have equal lengthand width, with all fractures also having equal aperture of 1 mm(Fig. 2). The equal length and width of the fractures means that 1
Table 2Fracture spacing, initial gas rate and volume for different fracture number models.
Fracture number and size 1×1150 ft 2×
Fracture volume (ft^3) 4338 867Delta initial gas rate per additional fracture (MSCF/day) – 929Fracture spacing (ft) 90 6
Please cite this article as: Ostojic, J., et al., Production performance of hydJ. Pet. Sci. Eng. (2012), doi:10.1016/j.petrol.2011.11.002
single fracture with a length, and width, of 1150 ft has approximatelyfour times the fracture volume of a single 550 ft fracture (Table 2).Hence, the results of a 1×1150 ft, 2×1150 ft and 3×1150 ft fracturemodels are compared to 4×550 ft, 8×550 ft and 12×550 ft fracturemodels, respectively. As stated previously, the production rates inFig. 3 are dimensionless with respect to the un-fractured model.
From Fig. 4 it is evident that increasing the number of fracturesintersecting the wellbore drastically impacts the initial flow rate ofa tight gas reservoir. In addition, initial production rate increases sim-ilarly with fracture number regardless of fracture volume. Simulationresults show that the 4×550 ft fracture model produces initially at ahigher rate than the 3×1150 ft fracture model although it has only30% of the total fracture volume (Table 3). In terms of immediatedrainage of tight gas formations, numerous smaller fractures will in-crease productivity more per volume of fracture, compared to fewerlonger fractures.
This is due to the initial gas being produced only from sands nearthe wellbore and hence within the drainage radius of both the simu-lated fracture sizes. The key difference between the different fracturelength models is that the 1150 ft fractures maintain the initial pro-duction for a longer period of time, whereas the 550 ft fractures expe-rience a drastic reduction in production rate within the first few days(Fig. 4).
These simulation results show that the initial production rate of asingle hydraulic fracture can be used to determine efficiency of subse-quent fractures created. The results show that each additional frac-ture created should increase initial gas production by a similar valuecompared to the previous fracture over the first 24 h (Fig. 5). This rel-atively linear increase in initial production rate is created as a result ofthe increased permeability near wellbore by hydraulic fractures.Therefore, the effectiveness of a fracture job can theoretically be esti-mated within 24 h of first production, based on post shut-in initial gasrate.
In terms of assessing the performance of a hydraulic fracture jobson real tight gas reservoirs, this form of analysis could serve as imme-diate feedback of additional fracture performance after shut-in. Alower increase in initial production rate (compared to the previousfracture) could be a result of near wellbore damage caused by poorclean-up post hydraulic fracture.
There is minimal difference in cumulative gas production betweenthe 550 ft fracture cases, particularly between the 8 and 12 fracturecases after 500 days, overall difference of less than 2% (Fig. 6). Thisis due to the fact that with increased fracture number, fracture spac-ing is reduced as a result of the reservoir size remaining constant(Table 2). Reduced fracture spacing can result in several fractures po-tentially producing from the same drainage area. With this in mind, itcan be assumed that the 12×550 ft fracture model is not directlycomparable to the 3×1150 ft model in terms of cumulative produc-tion performance. Similarly the 8×550 ft model is likely to produceless cumulative gas than the 2×1150 ft fracture model due to multi-ple fractures producing from a common drainage area. Thereforethe 1×1150 ft and 4×550 ft is the only comparable pair in terms ofcumulative production based on similar fracture volume.
As both scenarios have almost equal fracture volume, and fracturespacing is sufficient to ensure individual drainage area for each frac-ture, it can be expected that individual fracture drainage area isequal between the two cases. The single 1150 ft fracture produces~10% less cumulative gas and therefore can be said to be less effective
1150 ft 3×1150 ft 4×550 ft 8×550 ft 12×550 ft
6 13,013 3969 7938 11,9064 7223 10,979 8189 81870 45 36 20 14
raulic fractures in tight gas sands, a numerical simulation approach,

Fig. 3. Gas production rate vs. time for all simulated 1150 ft and 550 ft fracture cases.
Fig. 4. Average gas production rates for first three 24 h periods for all simulated 1150 ft and 550 ft fracture models.
4 J. Ostojic et al. / Journal of Petroleum Science and Engineering xxx (2012) xxx–xxx
compared to 4 smaller fractures. Another of the mitigating factors canbe explained by the theoretical findings of Shah et al. (2010) regard-ing perpendicular fractures having more turbulent flow than fracturesalong the wellbore. With only one fracture providing flow for the1150 ft model (compared to four 550 ft fractures), the majority ofproduction comes from the single flow path via the hydraulic frac-ture, thus causing highly turbulent and flow and reducing productionperformance.
However, the cost of additional hydraulic fractures would have tobe determined individually for all tight gas reservoirs prior to reach-ing any conclusions regarding fracture job planning and design. Forinstance, a highly faulted or discontinuous tight gas reservoir forma-tion can have substantially less benefit from additional fracturesthan large homogenous tight gas reservoir.
Table 3Increase in initial gas production rate per subsequent fracture.
2×Frac–1×FRac 3×Frac–2
Delta initial gas rate (MSCF/day) 9294 7223Delta initial gas rate per fracture (MSCF/day) 9294 7223
Please cite this article as: Ostojic, J., et al., Production performance of hydJ. Pet. Sci. Eng. (2012), doi:10.1016/j.petrol.2011.11.002
3.2. Perpendicular versus along the wellbore fracture
Two models with equal fracture volume (identical fracture lengthand width) are simulated, one fracture model intersecting the verticalwellbore perpendicularly, and the other intersecting parallel alongthe wellbore. Dimensionless production rate and cumulative gasrate vs. time plots are created and analyzed (Figs. 7 and 8).
The facture along the wellbore produces ~60% more cumulativegas after 500 days of production, and doesn't drop below the perpen-dicular fracture production rate at any stage of production. This in-crease in production is due to the higher surface area of wellborethat the fracture along the wellbore intersects if compared to the per-pendicular fracture (Shah et al., 2010). The increase in contact areabetween the wellbore and hydraulic fracture increases average
×FRac 4×Frac–3×FRac 8×Frac–4×FRac 12×Frac–8×FRac
10,979 32,756 32,74610,979 8189 8187
raulic fractures in tight gas sands, a numerical simulation approach,

Fig. 5. Average gas rate after 1 day vs. number of hydraulic fractures.
Fig. 6. Cumulative gas production vs. time for all simulated 1150 ft and 550 ft fracture cases.
Fig. 7. Gas production rate for single perpendicular and along the wellbore fracture models.
5J. Ostojic et al. / Journal of Petroleum Science and Engineering xxx (2012) xxx–xxx
Please cite this article as: Ostojic, J., et al., Production performance of hydraulic fractures in tight gas sands, a numerical simulation approach,J. Pet. Sci. Eng. (2012), doi:10.1016/j.petrol.2011.11.002

Fig. 8. Cumulative gas production for single perpendicular and along the wellbore fracture models.
Fig. 9. Gas production rate vs. time for perpendicular and along wellbore hydraulic fracture models.
Fig. 10. Cumulative gas production rate vs. time for perpendicular and along wellbore hydraulic fracture models.
6 J. Ostojic et al. / Journal of Petroleum Science and Engineering xxx (2012) xxx–xxx
Please cite this article as: Ostojic, J., et al., Production performance of hydraulic fractures in tight gas sands, a numerical simulation approach,J. Pet. Sci. Eng. (2012), doi:10.1016/j.petrol.2011.11.002

7J. Ostojic et al. / Journal of Petroleum Science and Engineering xxx (2012) xxx–xxx
permeability near the wellbore and hence inflow performance. Simi-lar to the multiple 550 ft fracture model results, the parallel fracturemodel experiences a large decrease in production rate for the firstday of production.
As further investigation, 2, 3 and 4 perpendicular fracture modelsare plotted against the single fracture along the wellbore to determinethe number of perpendicular fractures required to achieve similar ini-tial gas production rates and cumulative production (Figs. 9–10).
The simulation results show that only the 4 perpendicular frac-tures achieve a higher cumulative production over the simulatedtime interval (Fig. 10). Based on these results, and assuming symmet-rical drainage, fractures along the wellbore have a significantly in-creased ultimate recovery compared to perpendicular fractures.Therefore it is suggested that whenever possible, hydraulic fracturesshould be created along the wellbore, rather than intersecting it per-pendicularly. As discussed by (Shah et al., 2010), the fractures createdalong the wellbore have a higher contact area between the hydraulicfracture and wellbore. This increase in contact area increases the per-meability, and therefore production performance, of the near well-bore section. For tight gas formations, this increase in near wellborepermeability has a significant impact on production performance,which makes the reservoir more economically viable. However, itmust be noted that fracture propagation is dependent on the in-situstresses within the reservoir, and the most productive fracture orien-tation may not be achievable in all tight gas sands.
4. Conclusions
Based on the analysis of all simulation results the following con-clusions can be reached regarding the impact of fracture length, spac-ing and orientation on tight gas production performance:
– Fracture number has more significant impact on well productivity(initial production rate/capacity) than fracture length, in the caseswith equal total fracture volume. This is due to the smaller frac-tures having a larger contact area with the wellbore and subse-quently increased production performance.
– However, fracture length has a larger impact on cumulative gas re-covery than fracture number. This is primarily a result of the larger
Please cite this article as: Ostojic, J., et al., Production performance of hydJ. Pet. Sci. Eng. (2012), doi:10.1016/j.petrol.2011.11.002
fracture spacing of longer fractures in this model, hence the longerfractures are not producing from the same zone as other fracturesand accessing new portions of the reservoir.
– When possible, fractures should be completed along the wellboreto increase contact area between the wellbore and hydraulicfracture.
– Fractures along the wellbore are far more effective than perpen-dicular fractures, based on simulation results, 4 perpendicularfractures are required to better the along the wellbore fractureperformance.
– After the initial hydraulic fracture, each subsequent fracture in-creases the initial gas production rate (within first 24 h) by a sim-ilar amount, and is independent of fracture length.
References
Addis, M.A., Yassir, N., 2010. An overview of geomechanical engineering aspects oftight gas sand developments. SPE/DGS Saudi Arabia Section Technical Symposiumand Exhibition. Al-Khobar, Saudi Arabia.
ECLIPSE 100 Reference Manual 2008.2, Schlumberger GeoQuest, 2008Garcia, J.P., Pooladi-Darvish, M., Brunner, F., Santo, M., Mattar, L., 2006. Well testing of
tight gas reservoirs. SPE Gas Technology Symposium. Calgary, Alberta, Canada.Holditch, S.A., 2006. Tight gas sands. SPE J. Pet. Technol. 58.Jamiolahmady, M., Sohrabi, M., Mahdiyar, H., 2009. Optimization of Hydraulic Fracture
Geometry. Offshore Europe, Aberdeen, UK.Manrique, J.F., Poe, B.D., 2007. Evaluation and optimization of low conductivity frac-
tures. SPE Hydraulic Fracturing Technology Conference. College Station, Texas,U.S.A.
Pankaj, P., Kumar, V., 2010. Well testing in tight gas reservoir: today. SPE Oil and GasIndia Conference and Exhibition. Mumbai, India.
Valko, P.V., Michael, J.E., 1998. Heavy crude production from shallow formations: longhorizontal wells versus horizontal fractures. SPE International Conference on Hor-izontal Well Technology. Calgary, Alberta, Canada.
Rietman, N.D., 1998. An integrated method for optimizing hydraulic fracture design fortight gas wells. SPE Rocky Mountain Regional/Low-Permeability Reservoirs Sym-posium. Denver, Colorado.
Rushing, J.A., Blasingame, T.A., 2003. Integrating short-term pressure buildup testingand long-term production data analysis to evaluate hydraulically-fractured gaswell performance. SPE Annual Technical Conference and Exhibition. Denver,Colorado.
Shah, S.N., Vincent, M.C., Rodriquez, R.X., Palisch, T.T., 2010. Fracture orientation andproppant selection for optimizing production in horizontal wells. SPE Oil and GasIndia Conference and Exhibition. Mumbai, India.
raulic fractures in tight gas sands, a numerical simulation approach,

80
Appendix G:
Liquid loading in wellbore and its effect on well clean-up period and well
productivity in tight gas reservoirs, APPEA Journal, Brisbane, Australia
APPEA Journal 2010 50th ANNIVERSARY ISSUE—1FINAL PROOF—BAHRAMI 5 MAR 10
LIQUID LOADING IN WELLBORES AND ITS EFFECT ON CLEANUP PERIOD
AND WELL PRODUCTIVITYIN TIGHT GAS SAND RESERVOIRS
Lead authorHassan
Bahrami
H. Bahrami, M. Reza Rezaee, V. Rasouli and A. HosseinianDepartment of Petroleum EngineeringCurtin University of Technology613 (Rear), Level 6, ARRC26 Dick Perry Ave, KensingtonPerth WA [email protected]@[email protected]@postgrad.curtin.edu.au
ABSTRACT
Tight gas reservoirs normally have production prob-lems due to very low matrix permeability and significant damage during well drilling, completion, stimulation and production. Therefore they might not flow gas to surface at optimum rates without advanced production improve-ment techniques.
After well stimulation and fracturing operations, in-vaded liquids such as filtrate will flow from the reservoir into the wellbore, as gas is produced during well cleanup. In addition, there might be production of condensate with gas. The produced liquids when loaded and re-circulated downhole in wellbores, can significantly reduce the gas pro-duction rate and well productivity in tight gas formations.
This paper presents assessments of tight gas reservoir productivity issues related to liquid loading in a wellbore using numerical simulation of multiphase flow in devi-ated and horizontal wells. A field example of production logging in a horizontal well is used to verify reliability of the numerical simulation model outputs. Well production performance modelling is also performed to quantitatively evaluate water loading in a typical tight gas well, and test the water unloading techniques that can improve the well productivity.
The results indicate the effect of downhole liquid load-ing on well productivity in tight gas reservoirs. It also shows how well cleanup will speed up with the improved well productivity when downhole circulating liquids are lifted using the proposed methods.
KEYWORDS
Tight rock gas reservoir, liquid loading in wellbore, well productivity, production improvement.
INTRODUCTION
In gas producing wells, different downhole flow regimes might be present in a wellbore depending on gas and liquids velocities, and their relative amounts in the wellbore (Guo and Ghalambor, 2005). Under multiphase flow conditions, the light phase moves with a velocity different than the heavier one by a magnitude known as slippage velocity (Kappa Engineering Team, 2005). In a deviated wellbore, the lighter phase flows at the top side of the wellbore, and water as the heaver phase stays at the bottom side. The typical velocity profiles in horizontal wells in different deviations are shown in Figure 1. The density difference of coexisting fluids, the hold-up of liquid (YL: the ratio of a given pipe cross section occupied by liquid), and well deviation can control the slippage velocity and flow regimes in multiphase flow in oil and gas wells.
The basic flow regimes that usually represent multiphase flow in a gas well are shown in Figure 2. During progres-sion of a typical gas well from initial production to end of life, one or more of these regimes might be encountered (Lea et al, 2008). In initial conditions, gas flow rate is high and the flow regime is in mist flow, and therefore the produced gas can carry the wellbore liquids to the surface. Then as the reservoir pressure drops, the gas veloc-ity in the wells is declined, causing the carrying capacity of gas to decrease. When the gas velocity is less than a critical level, liquids begin to accumulate and be loaded in the wellbore. The liquid loading can gradually change the downhole flow regimes in a wellbore to annular flow and later to slug flow. Eventually, the well will undergo bubbly flow regime, with no economical production rates (Guo and Ghalambor, 2005).
Liquid loading is a common problem in gas wells, and can be in the form of liquid water and/or condensate. The liquids are loaded in the wellbore and cannot be lifted when the flow rate is less than the minimum gas flow rate and gas velocity is not high enough. As a result, the well’s productivity is affected due to the additional drop of pressure in the wellbore where the circulating liquids are present. The liquid circulation makes the well downhole operating conditions unstable.
The carrying capacity of the gas to lift liquid in gas wells depends on the tubular sizes, pressure losses across the wellbore, the surface pressure, the amount of liquids being produced with the gas, wellbore deviation, and the gas composition (Lea et al, 2008; Veeken et al, 2009). A
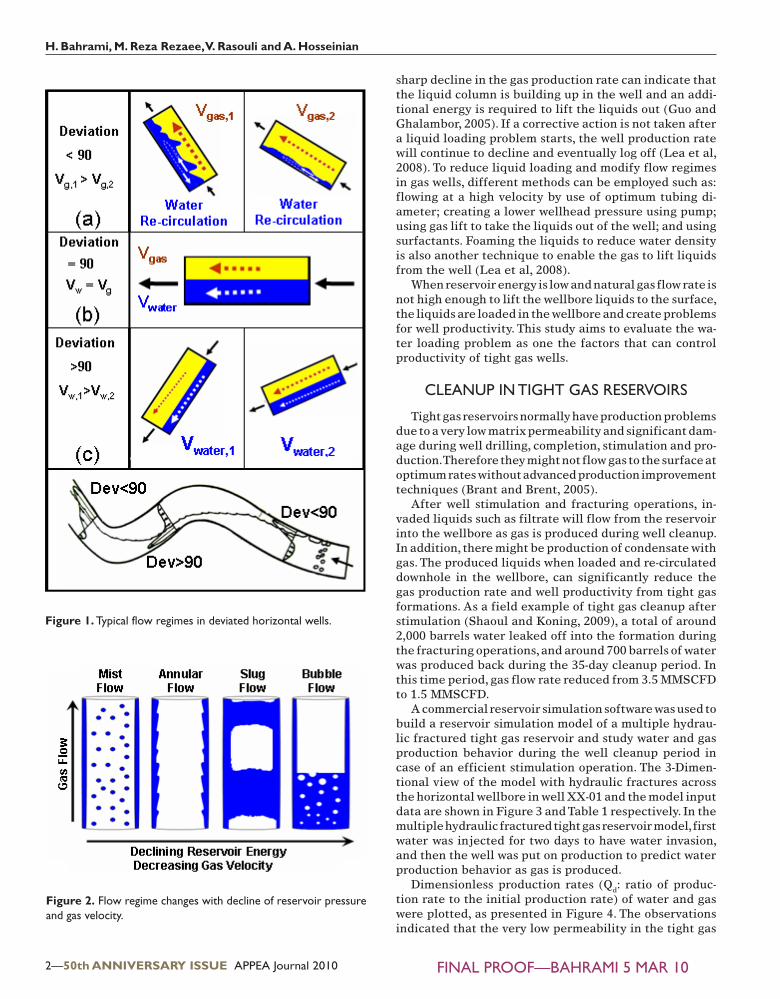
2—50th ANNIVERSARY ISSUE APPEA Journal 2010 FINAL PROOF—BAHRAMI 5 MAR 10
H. Bahrami, M. Reza Rezaee, V. Rasouli and A. Hosseinian
sharp decline in the gas production rate can indicate that the liquid column is building up in the well and an addi-tional energy is required to lift the liquids out (Guo and Ghalambor, 2005). If a corrective action is not taken after a liquid loading problem starts, the well production rate will continue to decline and eventually log off (Lea et al, 2008). To reduce liquid loading and modify flow regimes in gas wells, different methods can be employed such as: flowing at a high velocity by use of optimum tubing di-ameter; creating a lower wellhead pressure using pump; using gas lift to take the liquids out of the well; and using surfactants. Foaming the liquids to reduce water density is also another technique to enable the gas to lift liquids from the well (Lea et al, 2008).
When reservoir energy is low and natural gas flow rate is not high enough to lift the wellbore liquids to the surface, the liquids are loaded in the wellbore and create problems for well productivity. This study aims to evaluate the wa-ter loading problem as one the factors that can control productivity of tight gas wells.
CLEANUP IN TIGHT GAS RESERVOIRS
Tight gas reservoirs normally have production problems due to a very low matrix permeability and significant dam-age during well drilling, completion, stimulation and pro-duction. Therefore they might not flow gas to the surface at optimum rates without advanced production improvement techniques (Brant and Brent, 2005).
After well stimulation and fracturing operations, in-vaded liquids such as filtrate will flow from the reservoir into the wellbore as gas is produced during well cleanup. In addition, there might be production of condensate with gas. The produced liquids when loaded and re-circulated downhole in the wellbore, can significantly reduce the gas production rate and well productivity from tight gas formations. As a field example of tight gas cleanup after stimulation (Shaoul and Koning, 2009), a total of around 2,000 barrels water leaked off into the formation during the fracturing operations, and around 700 barrels of water was produced back during the 35-day cleanup period. In this time period, gas flow rate reduced from 3.5 MMSCFD to 1.5 MMSCFD.
A commercial reservoir simulation software was used to build a reservoir simulation model of a multiple hydrau-lic fractured tight gas reservoir and study water and gas production behavior during the well cleanup period in case of an efficient stimulation operation. The 3-Dimen-tional view of the model with hydraulic fractures across the horizontal wellbore in well XX-01 and the model input data are shown in Figure 3 and Table 1 respectively. In the multiple hydraulic fractured tight gas reservoir model, first water was injected for two days to have water invasion, and then the well was put on production to predict water production behavior as gas is produced.
Dimensionless production rates (Qd: ratio of produc-tion rate to the initial production rate) of water and gas were plotted, as presented in Figure 4. The observations indicated that the very low permeability in the tight gas
Figure 1. Typical flow regimes in deviated horizontal wells.
Figure 2. Flow regime changes with decline of reservoir pressure and gas velocity.
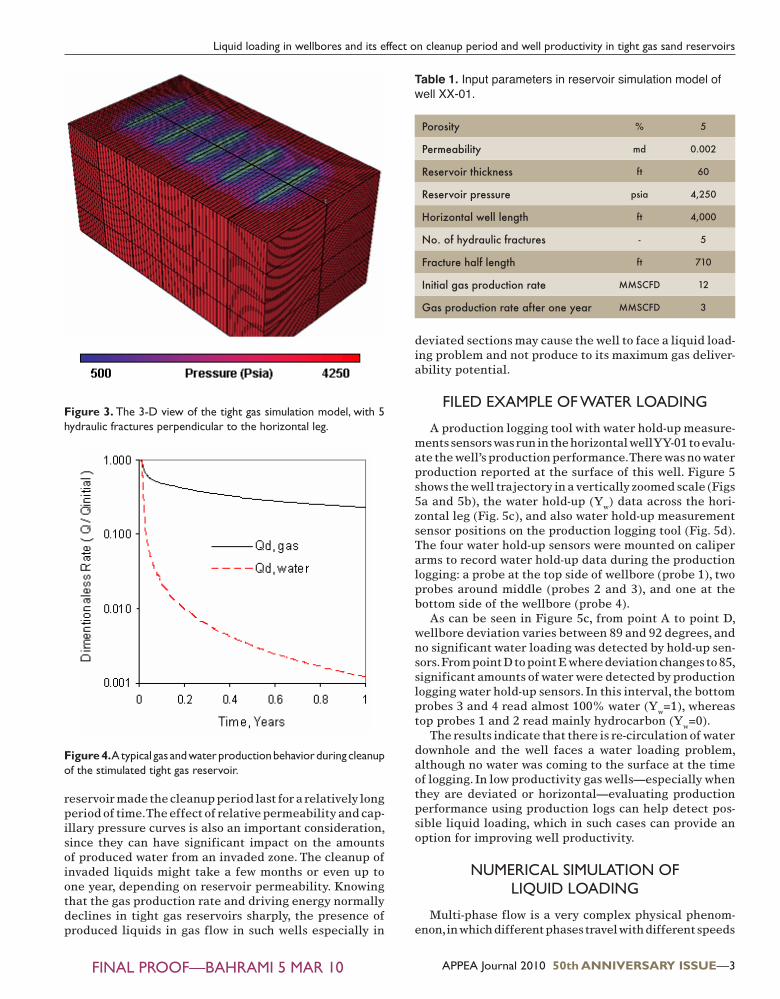
APPEA Journal 2010 50th ANNIVERSARY ISSUE—3FINAL PROOF—BAHRAMI 5 MAR 10
Liquid loading in wellbores and its effect on cleanup period and well productivity in tight gas sand reservoirs
reservoir made the cleanup period last for a relatively long period of time. The effect of relative permeability and cap-illary pressure curves is also an important consideration, since they can have significant impact on the amounts of produced water from an invaded zone. The cleanup of invaded liquids might take a few months or even up to one year, depending on reservoir permeability. Knowing that the gas production rate and driving energy normally declines in tight gas reservoirs sharply, the presence of produced liquids in gas flow in such wells especially in
deviated sections may cause the well to face a liquid load-ing problem and not produce to its maximum gas deliver-ability potential.
FILED EXAMPLE OF WATER LOADING
A production logging tool with water hold-up measure-ments sensors was run in the horizontal well YY-01 to evalu-ate the well’s production performance. There was no water production reported at the surface of this well. Figure 5 shows the well trajectory in a vertically zoomed scale (Figs 5a and 5b), the water hold-up (Yw) data across the hori-zontal leg (Fig. 5c), and also water hold-up measurement sensor positions on the production logging tool (Fig. 5d). The four water hold-up sensors were mounted on caliper arms to record water hold-up data during the production logging: a probe at the top side of wellbore (probe 1), two probes around middle (probes 2 and 3), and one at the bottom side of the wellbore (probe 4).
As can be seen in Figure 5c, from point A to point D, wellbore deviation varies between 89 and 92 degrees, and no significant water loading was detected by hold-up sen-sors. From point D to point E where deviation changes to 85, significant amounts of water were detected by production logging water hold-up sensors. In this interval, the bottom probes 3 and 4 read almost 100% water (Yw=1), whereas top probes 1 and 2 read mainly hydrocarbon (Yw=0).
The results indicate that there is re-circulation of water downhole and the well faces a water loading problem, although no water was coming to the surface at the time of logging. In low productivity gas wells—especially when they are deviated or horizontal—evaluating production performance using production logs can help detect pos-sible liquid loading, which in such cases can provide an option for improving well productivity.
NUMERICAL SIMULATION OF LIQUID LOADING
Multi-phase flow is a very complex physical phenom-enon, in which different phases travel with different speeds
Figure 3. The 3-D view of the tight gas simulation model, with 5 hydraulic fractures perpendicular to the horizontal leg.
Figure 4. A typical gas and water production behavior during cleanup of the stimulated tight gas reservoir.
Porosity % 5
Permeability md 0.002
Reservoir thickness ft 60
Reservoir pressure psia 4,250
Horizontal well length ft 4,000
No. of hydraulic fractures - 5
Fracture half length ft 710
Initial gas production rate MMSCFD 12
Gas production rate after one year MMSCFD 3
Table 1. Input parameters in reservoir simulation model of well XX-01.

4—50th ANNIVERSARY ISSUE APPEA Journal 2010 FINAL PROOF—BAHRAMI 5 MAR 10
H. Bahrami, M. Reza Rezaee, V. Rasouli and A. Hosseinian
depending on the difference between density of phases, hold-up of each phase, and the wellbore deviation. In multi-phase flow, the liquid-gas contact line is not stable due to the presence of a disturbed interfaces (e.g. surface waves on a falling film, or large, highly deformable drops or bubbles) and since there is transition between different gas-liquid flow regimes. The difficult physical laws and mathemati-cal treatment of phenomena occurring in the presence of the two phases (the interface dynamics, drag, etc.) are still largely undeveloped, causing some uncertainties in results of simulation models (Ghorai, 2008). In this study, the numerical simulation approach was used to qualita-tively model water loading in a gas well.
A series of simulation runs were carried out using a com-mercial computational fluids dynamics (CFD) simulation software, which solved continuity and momentum equa-tions for a deviated horizontal wellbore with two phase flow
of gas-water. The input data into the model are presented in Table 2. The data similar to well YY-01 were input to have a model that is calibrated with an actual case and therefore have appropriate selection of equations in the software. Figure 6 shows qualitative results from the simula-tion model of 20 MMSCFD gas flow with 0.99 gas fraction. The results indicate water loading in deviations below 90 degrees. Section B-C with deviation of 89.5° showed very small amounts of water loaded in the lower side of the wellbore. In section D-E with deviation of 85°, significant amounts of water loading was observed in wellbore. The results from the simulation were approximately in agree-ment with observations in well YY-01 water loading condi-tions, confirming the reliability of the model in terms of water loading prediction. This model was used as the base model, to perform sensitivity analysis.
Figures 7a and 7b show water loading when the gas flow rate is reduced to 4 MMSCFD and 1 MMSCFD, which indicates the well will have more severe water loading problem in lower gas flow rates. Based on simulation re-sults, in addition to the sharp decline of drive energy and gas flow rate with time in tight gas sand reservoirs, when there is water re-circulation downhole in wellbore, the loading of the considerable amounts of water can cause more deterioration of well productivity with passage of time. Therefore in addition to the declining production rate, liquid loading can cause further reductions in pro-ductivity of tight gas wells.
PRODUCTIVITY IMPROVEMENT BY WATER UNLOADING
Well production performance modelling was performed using a commercial multiphase flow simulator software to evaluate water loading in the typical tight gas well ZZ-01, and to test the water unloading techniques and improve the well productivity. Table 3 shows model input data. First, several cases were run as sensitivity analysis
Horizontal well length in the model ft 600
Wellbore ID Inches 6.2
Operating pressure psia 5,000
Downhole gas density kg/m3 140
Downhole gas viscosity cp 0.0204
Downhole water density kg/m3 1,006
Downhole water viscosity cp 0.3
Primary fluid in wellbore - Water
No. of cells in the model - 236,000
No. of nodes in the model - 248,000
No of iterations in each simulation run - 5,000
Table 2. Input data to the CFD simulation model of fluid flow in wellbore, based on well YY-01 data.
Figure 5. Production logging tool water holdup readings in the horizontal well YY-01.
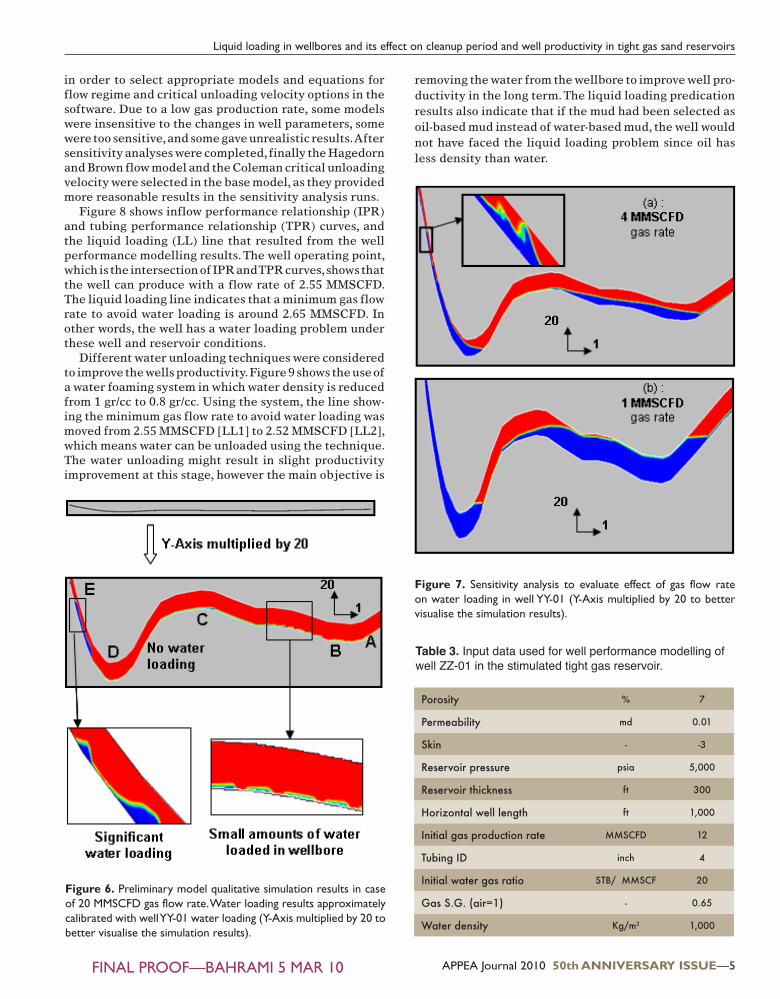
APPEA Journal 2010 50th ANNIVERSARY ISSUE—5FINAL PROOF—BAHRAMI 5 MAR 10
Liquid loading in wellbores and its effect on cleanup period and well productivity in tight gas sand reservoirs
in order to select appropriate models and equations for flow regime and critical unloading velocity options in the software. Due to a low gas production rate, some models were insensitive to the changes in well parameters, some were too sensitive, and some gave unrealistic results. After sensitivity analyses were completed, finally the Hagedorn and Brown flow model and the Coleman critical unloading velocity were selected in the base model, as they provided more reasonable results in the sensitivity analysis runs.
Figure 8 shows inflow performance relationship (IPR) and tubing performance relationship (TPR) curves, and the liquid loading (LL) line that resulted from the well performance modelling results. The well operating point, which is the intersection of IPR and TPR curves, shows that the well can produce with a flow rate of 2.55 MMSCFD. The liquid loading line indicates that a minimum gas flow rate to avoid water loading is around 2.65 MMSCFD. In other words, the well has a water loading problem under these well and reservoir conditions.
Different water unloading techniques were considered to improve the wells productivity. Figure 9 shows the use of a water foaming system in which water density is reduced from 1 gr/cc to 0.8 gr/cc. Using the system, the line show-ing the minimum gas flow rate to avoid water loading was moved from 2.55 MMSCFD [LL1] to 2.52 MMSCFD [LL2], which means water can be unloaded using the technique. The water unloading might result in slight productivity improvement at this stage, however the main objective is
removing the water from the wellbore to improve well pro-ductivity in the long term. The liquid loading predication results also indicate that if the mud had been selected as oil-based mud instead of water-based mud, the well would not have faced the liquid loading problem since oil has less density than water.
Figure 6. Preliminary model qualitative simulation results in case of 20 MMSCFD gas flow rate. Water loading results approximately calibrated with well YY-01 water loading (Y-Axis multiplied by 20 to better visualise the simulation results).
Figure 7. Sensitivity analysis to evaluate effect of gas flow rate on water loading in well YY-01 (Y-Axis multiplied by 20 to better visualise the simulation results).
Porosity % 7
Permeability md 0.01
Skin - -3
Reservoir pressure psia 5,000
Reservoir thickness ft 300
Horizontal well length ft 1,000
Initial gas production rate MMSCFD 12
Tubing ID inch 4
Initial water gas ratio STB/ MMSCF 20
Gas S.G. (air=1) - 0.65
Water density Kg/m3 1,000
Table 3. Input data used for well performance modelling of well ZZ-01 in the stimulated tight gas reservoir.
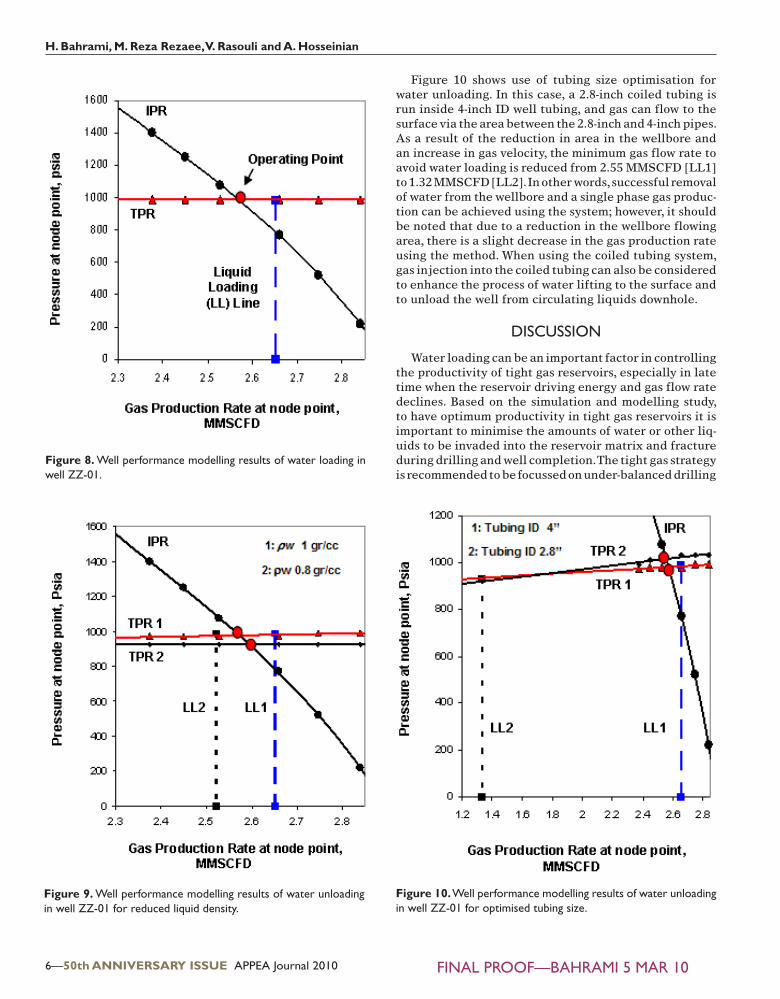
6—50th ANNIVERSARY ISSUE APPEA Journal 2010 FINAL PROOF—BAHRAMI 5 MAR 10
H. Bahrami, M. Reza Rezaee, V. Rasouli and A. Hosseinian
Figure 10 shows use of tubing size optimisation for water unloading. In this case, a 2.8-inch coiled tubing is run inside 4-inch ID well tubing, and gas can flow to the surface via the area between the 2.8-inch and 4-inch pipes. As a result of the reduction in area in the wellbore and an increase in gas velocity, the minimum gas flow rate to avoid water loading is reduced from 2.55 MMSCFD [LL1] to 1.32 MMSCFD [LL2]. In other words, successful removal of water from the wellbore and a single phase gas produc-tion can be achieved using the system; however, it should be noted that due to a reduction in the wellbore flowing area, there is a slight decrease in the gas production rate using the method. When using the coiled tubing system, gas injection into the coiled tubing can also be considered to enhance the process of water lifting to the surface and to unload the well from circulating liquids downhole.
DISCUSSION
Water loading can be an important factor in controlling the productivity of tight gas reservoirs, especially in late time when the reservoir driving energy and gas flow rate declines. Based on the simulation and modelling study, to have optimum productivity in tight gas reservoirs it is important to minimise the amounts of water or other liq-uids to be invaded into the reservoir matrix and fracture during drilling and well completion. The tight gas strategy is recommended to be focussed on under-balanced drilling
Figure 8. Well performance modelling results of water loading in well ZZ-01.
Figure 9. Well performance modelling results of water unloading in well ZZ-01 for reduced liquid density.
Figure 10. Well performance modelling results of water unloading in well ZZ-01 for optimised tubing size.

APPEA Journal 2010 50th ANNIVERSARY ISSUE—7FINAL PROOF—BAHRAMI 5 MAR 10
Liquid loading in wellbores and its effect on cleanup period and well productivity in tight gas sand reservoirs
to reduce the damage to near wellbore region by liquid invasion, and also lessen the significant amounts of water filtrate production during cleanup.
Tubing size optimisation can help in production at op-timum gas velocity. During the cleanup period of tight gas wells, a coiled tubing can be temporarily run in the wellbore through the well tubing to lessen the wellbore area and increase gas velocity to lift the circulating liq-uids downhole. Partially injection of the produced gas to the bottom of the well via the coiled tubing can further improve the water unloading process. After the cleanup process is completed, the coiled tubing can be removed and the well can continue with normal production.
The use of an oil-based mud system can also help re-duce the detrimental impact of liquid loading on tight gas wells’ productivity. As shown for well ZZ-01, the well could have no liquid loading problem if the invaded liquid was oil (density of 0.8 gr/cc), instead of water filtrate (1 gr/cc filtrate density). Use of the oil-based mud system can also reduce the problems related to shale intervals.
To further reduce damages to formation and avoid any liquid loading, feasibility of drilling using foam or gas needs to be studied for tight gas reservoirs. Theoretically, this approach can help the well to produce to its maximum potential, since near wellbore reservoir region is exposed to the lowest damage and there will be no liquid in the wellbore.
CONCLUSION
According to the simulation modelling results performed in the study for stimulated gas wells in tight sand reser-voirs, there might be significant production of filtrate with gas during the cleanup period, which can cause a water loading problem. The very low permeability in the tight gas reservoirs result in a long clean-up period.
A tight gas well might have a water loading problem downhole, although no water may come to the surface. Production logging in tight gas wells can help detect pos-sible liquid loading in the wellbore.
Water loading can have a negative impact on the pro-ductivity of gas wells in tight formations, especially in late time when gas flow rate declines. Therefore in addition to the decline of production rate in late time production history of a gas well, the liquid loading can cause a further reduction in a well’s productivity.
The use of an oil-based mud system instead of water-based mud during the drilling of tight sand formations can help reduce liquid loading problems in a wellbore, since oil has less density than water.
Tubing size optimisation and the use of foaming agents can help unload re-circulating liquids. As a result, the cleanup period will speed up and productivity is improved.
NOMENCLATURE
P PressureYw Water hold-upYg Gas hold-up
Q Flow rateρw Water densityρg Gas densityµ ViscosityV VelocityID Internal diametert TimeK PermeabilityS SkinL LengthWGR Water gas ratioMMSCFD Million standard cubic feet per day
REFERENCES
BRANT B. AND BRENT, F., 2005—Formation damage issues impacting the productivity of low permeability, low initial water saturation gas producing formations. In: Journal of Energy Resources Technology, 127, 240–7.
GHORAI, S. AND NIGAM, K.D.P., 2006—CFD modeling of flow profiles and interfacial phenomena in two-phase flow in pipes. In: (editor) Chemical Engineering and Processing Journal, 45, 55–65.
GUO, B. AND GHALAMBOR, A., 2005—Natural Gas En-gineering Handbook. Houston: Gulf Publishing Company.
KAPPA ENGINEERING TEAM, 2005 —Production Logging Technical Reference, Emeraude 2 (42), Section E-04, 1–8.
LEA, J., NICKENS, H. AND WELLS, M., 2003—Gas well deliquification. Burlington, MA, USA: Elsevier.
SHAOUL, J.R., KONING, J., CHAPUIS, C. and ROCHON, J., 2009—Successful modelling of post-fracture cleanup in a layered tight gas reservoir. The 8th European Formation Damage Conference, Scheveningen, The Netherlands 27–9 May, SPE 122021.
VEEKEN, K., HU, B. AND SCHIFERLI, W., 2009—Transient multiphase flow modeling of gas well liquid loading. SPE 123657.

8—50th ANNIVERSARY ISSUE APPEA Journal 2010 FINAL PROOF—BAHRAMI 5 MAR 10
H. Bahrami, M. Reza Rezaee, V. Rasouli and A. Hosseinian
THE AUTHORS
Hassan Bahrami is a PhD candidate in the Department of Petroleum Engineer-ing at Curtin University of Technology in Perth, Australia. He has focussed on tight gas sand reservoirs damage and productivity. Prior to Curtin University, he worked for Schlumberger Data and Consulting Services (DCS) as a borehole reservoir engineer (2003–9) and Tehran
Energy Consultants as a reservoir engineer (2001–3). Hassan holds a BSc in chemical engineering from Persian Gulf University, and a MSc in reservoir engineering from Sharif University of Technology, Tehran, Iran.
Vamegh Rasouli is a Chartered Professional Engineer (CPEng) and is a registered engineer with the National Professional Engineers Register (NPER) of Australia. After completing his PhD in 2002 from Imperial College, London, Vamegh took up the position of as-sistant professor in the Department of Petroleum Engineering at Amirkabir
University of Technology (Iran). In 2006 Vamegh joined the Department of Petroleum Engineering at Curtin University as a senior lecturer to add support to the delivery of the Depart-ment’s Master of Petroleum Well Engineering degree, and to carry out research in his specialist area of wellbore stability, sanding, hydraulic fracturing, etc. He established the Curtin Petroleum Geomechanics Group (CPGG), and he supervises five PhD stu-dents and number of Masters students. CPGG has completed a number of successful research and consulting projects. Vamegh is also a consulting engineer on various geomechanics related projects with Schlumberger’s Data and Consulting Services (DCS) in Perth.
M. Reza Rezaee is an associate pro-fessor in the Petroleum Engineering Department of Curtin University of Technology. He has a PhD degree in reservoir characterisation (Adelaide University) and has over 20 years experi-ence in academia and industry. During his career he has been engaged in several research projects supported by national
and international oil companies and these commissions, together with his supervisory work at various universities, have involved a wide range of achievements. His research has been focussed on integrated solutions for reservoir geological characterisation. He has utilised expert systems such as artificial neural networks and fuzzy logic and has introduced several new approaches to estimate rock properties from log data where conventional methods fail to succeed. He has focussed on unconventional gas including gas shale and tight gas sand studies.
Armin Hosseinian is a PhD candi-date in the Department of Petroleum Engineering at Curtin University of Technology in Perth, Australia. He has focussed on fluid flow simulation in natural fractures. Prior to Curtin Uni-versity, he worked for National Iranian Oil Company as a well engineer and Tehran Metro Company as a mining
engineer. Armin holds a MSc in mining engineering from Azad University, and a BSc in mining engineering from Shahid Bahonar University, Kerman, Iran.
Top Related