


Languages
Pages
Legal


Copyright Garry Bulmer 2008
Erlang-DTraceGarry Bulmer
Team DTrace: Tim Becker

Copyright Garry Bulmer 2008
What I'm going to talk about
• Introduction to DTrace & DTrace Architecture
• Demo of DTrace with ‘one liners’
• Erlang + Dtrace = ?
• Erlang VM Architecture
• Current Erlang DTrace Scope
• Erlang-DTrace Demo
• Questions
Copyright Garry Bulmer 2008
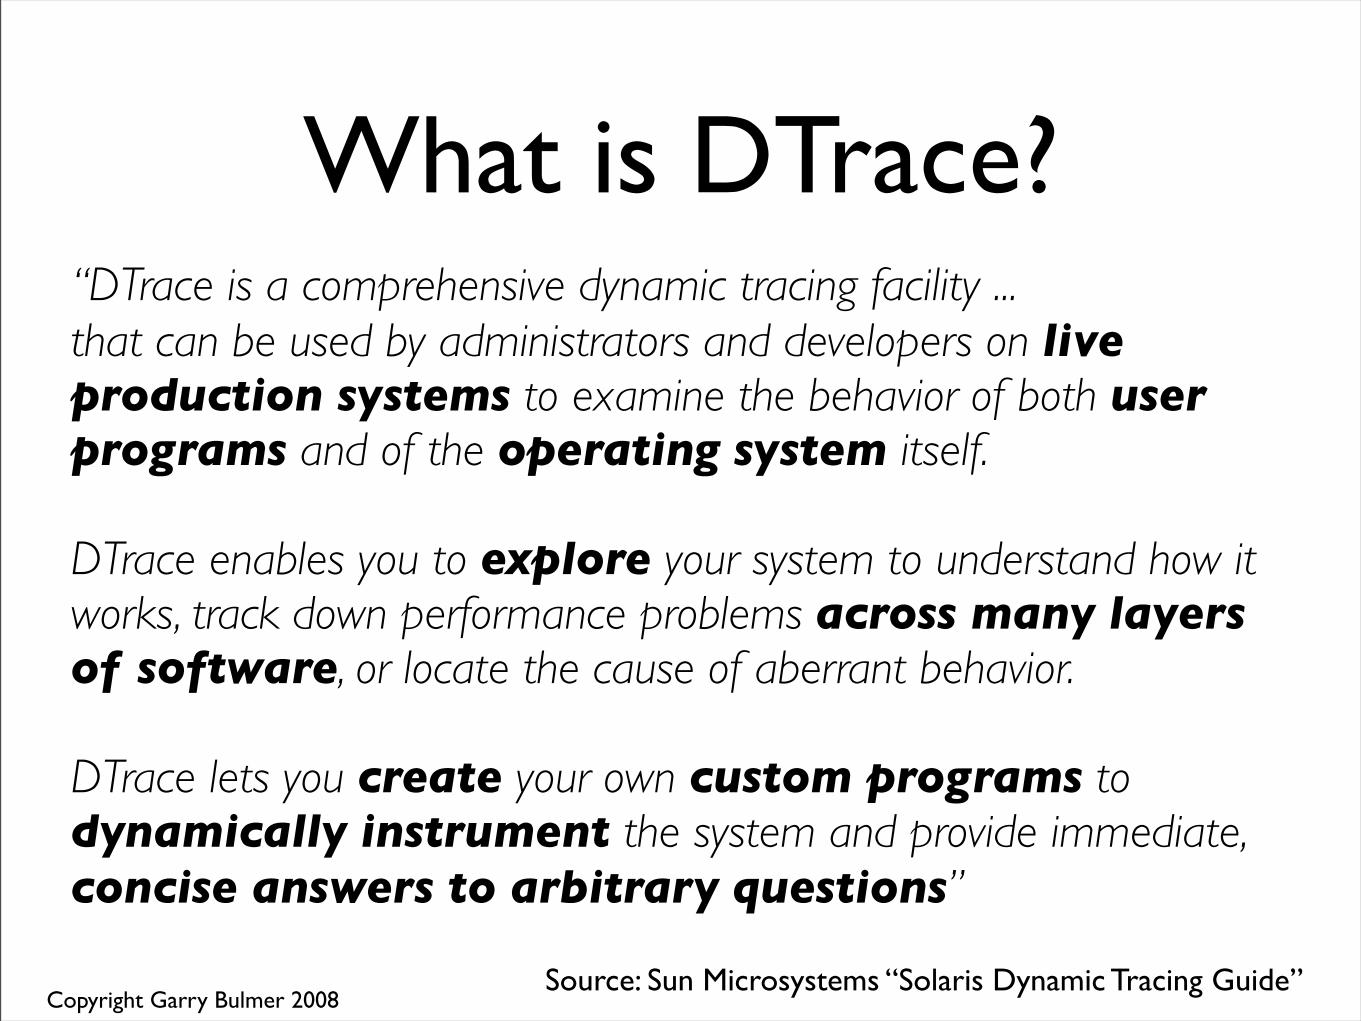
What is DTrace?“DTrace is a comprehensive dynamic tracing facility ... that can be used by administrators and developers on live production systems to examine the behavior of both user programs and of the operating system itself. DTrace enables you to explore your system to understand how it works, track down performance problems across many layers of software, or locate the cause of aberrant behavior.
DTrace lets you create your own custom programs to dynamically instrument the system and provide immediate, concise answers to arbitrary questions”
Source: Sun Microsystems “Solaris Dynamic Tracing Guide”
Copyright Garry Bulmer 2008
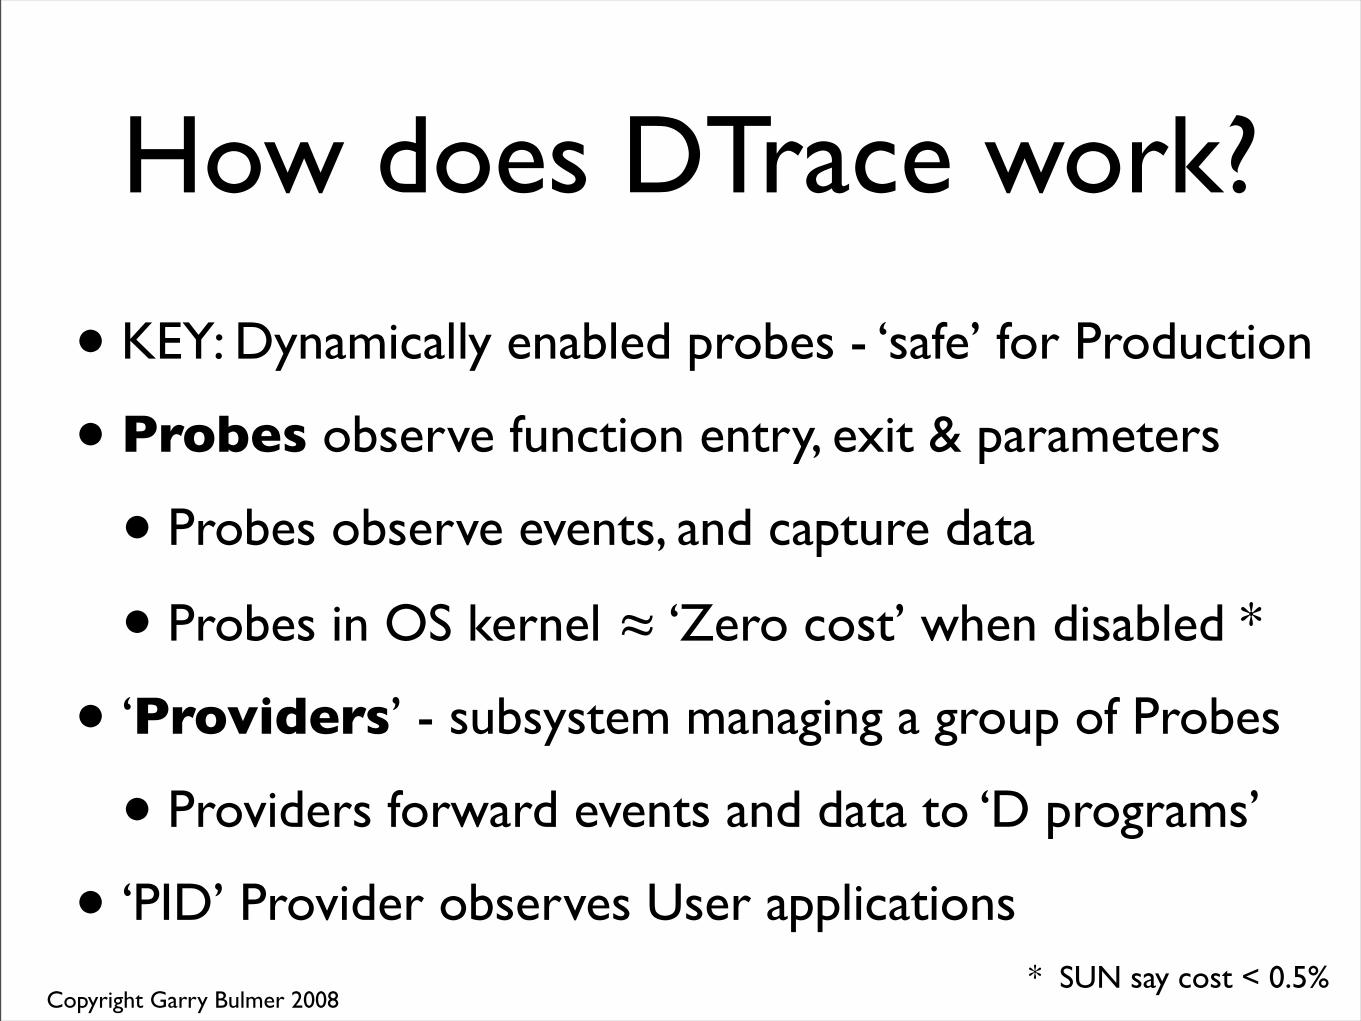
How does DTrace work?
• KEY: Dynamically enabled probes - ‘safe’ for Production
• Probes observe function entry, exit & parameters
• Probes observe events, and capture data
• Probes in OS kernel ≈ ‘Zero cost’ when disabled *
• ‘Providers’ - subsystem managing a group of Probes
• Providers forward events and data to ‘D programs’
• ‘PID’ Provider observes User applications* SUN say cost < 0.5%
Copyright Garry Bulmer 2008
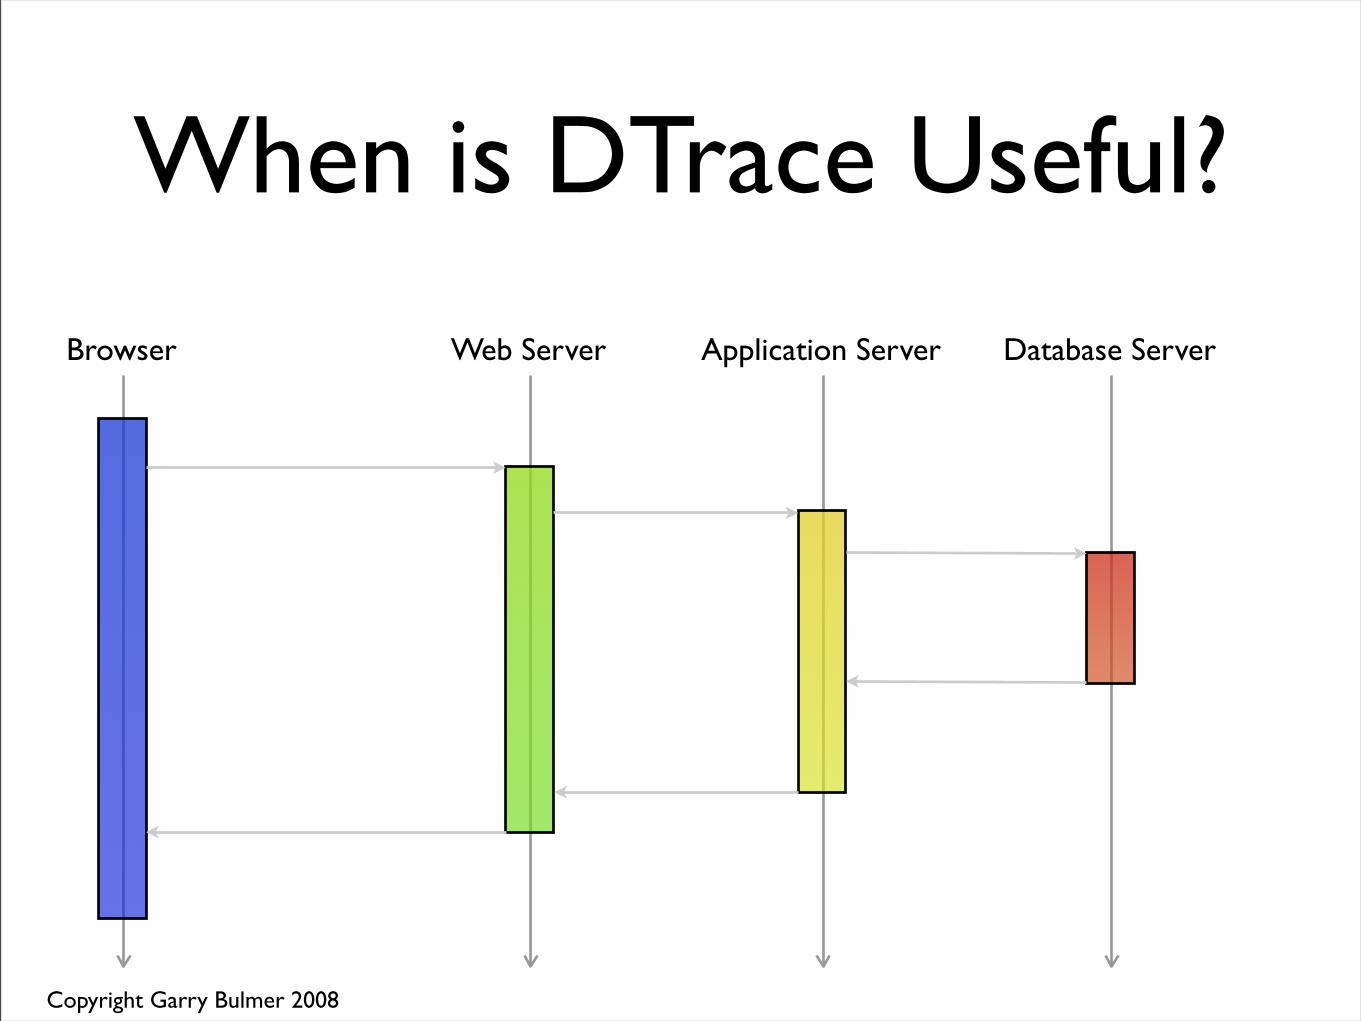
When is DTrace Useful?
Browser Web Server Application Server Database Server

Copyright Garry Bulmer 2008
Apache
DTrace End-to-End
libdtrace
dtrace
myprog.d
Kernel
syscall
profile fbt
pid
proc
sched
io
vminfo
sysinfo
sdt
Firefox
DTrace
dtrace
myprog.d
JVM MySQL
Javascript

Copyright Garry Bulmer 2008
Provider:Module:Function:Name
DTrace D-Scriptsprobe / optional predicates /{
optional action statements;}
syscall:::entry / pid == 660 /{
printf(%-15s\n”, probefunc);}
Provider = syscallModule = *Function = *Name = entry
Copyright Garry Bulmer 2008
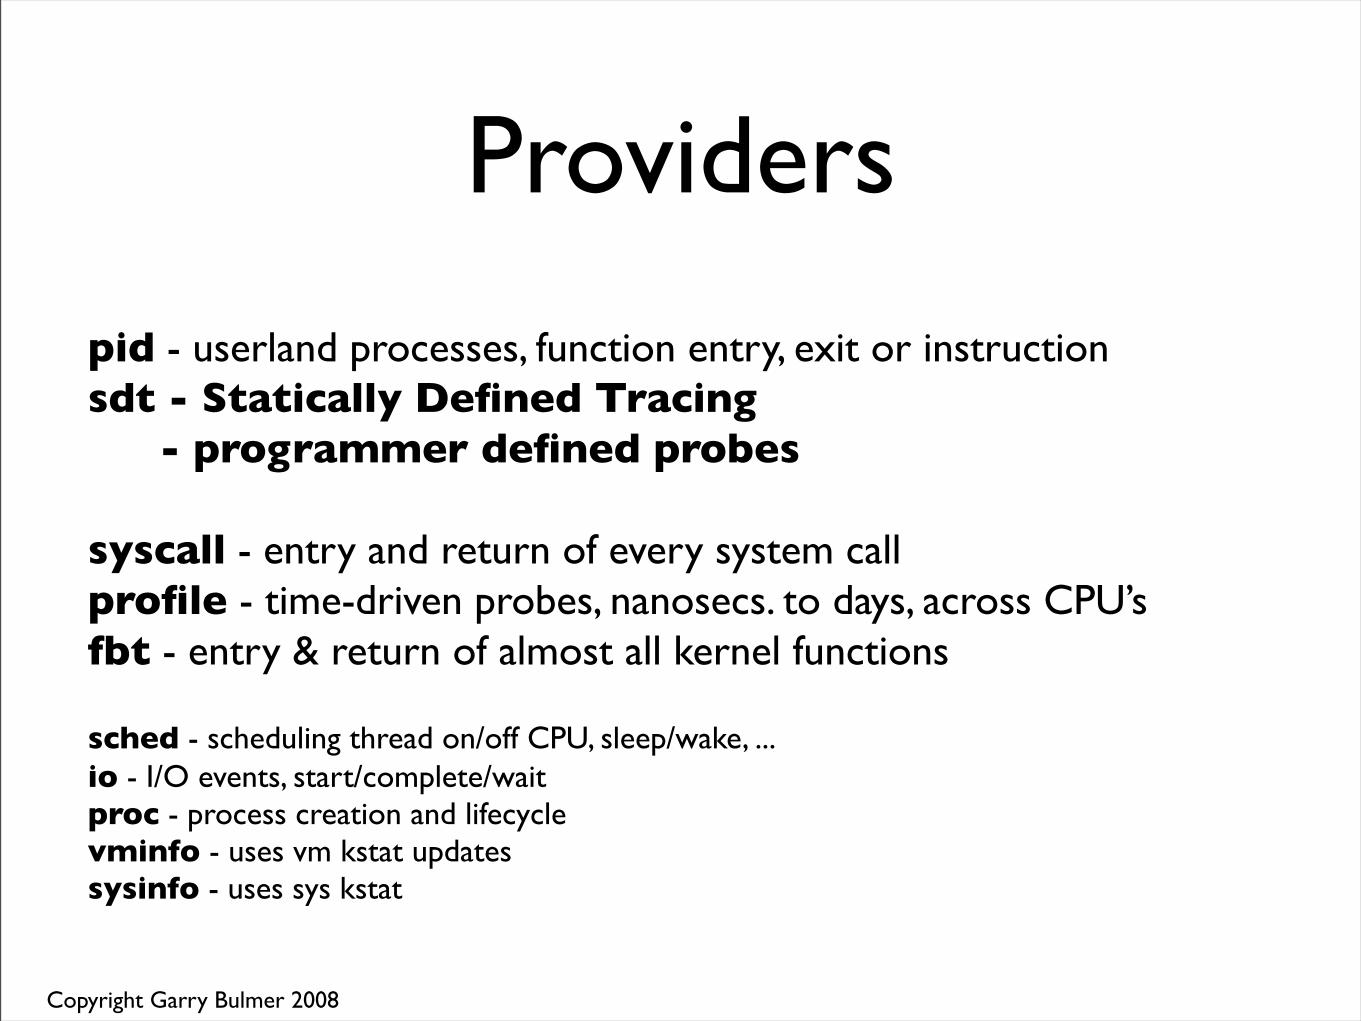
Providers
pid - userland processes, function entry, exit or instructionsdt - Statically Defined Tracing
- programmer defined probes
syscall - entry and return of every system callprofile - time-driven probes, nanosecs. to days, across CPU’sfbt - entry & return of almost all kernel functions
sched - scheduling thread on/off CPU, sleep/wake, ...io - I/O events, start/complete/waitproc - process creation and lifecyclevminfo - uses vm kstat updatessysinfo - uses sys kstat

Copyright Garry Bulmer 2008
DTrace - ‘one liners’
dtrace -n 'syscall:::entry { @num[execname] = count(); }'
dtrace -n 'syscall:::entry /execname == "beam.smp"/{ @num[probefunc] = count(); }'
Question: Which applications are making the most system calls?
Question: Which system calls is the Erlang VM making?
dtrace -n 'pid*::malloc*:entry /execname == "beam.smp"/ { @num[probefunc] = sum(arg0); }'
Question: How much memory is beam.smp allocating?
dtrace -n 'pid*:::entry /execname == "beam.smp"/ { @num[probefunc] = count(); }'
Question: What functions is the erlang VM calling?

Copyright Garry Bulmer 2008
dtrace
Apache JVMFirefox MySQL
Javascript
Erlang(Yaws)
Kernel
Erlang-DTrace End-to-End
syscall
profile fbt
pid
proc
sched
io
vminfo
sysinfo
DTrace
libdtrace
dtrace
myprog.d
sdt
myprog.d
Erlang(App.)

Copyright Garry Bulmer 2008
fib(0) ->fib(N) ->fib([H|T]) ->
module(fibn)
tag("<") ->tag([H|T]) ->body(">) -> ...
module(xml)
Erlang code
C code
Erlang VM Architecture
Erlang VM (Node)syscall
Erlang Processes
TraceMemory
Allocation & GC
Messaging & Process 'EXIT'
Process Spawn &
Scheduling
Dynamic Code
Update
Built in Functions
(BIFs)
GlobalState

Copyright Garry Bulmer 2008
Erlang’s DTrace ‘Fit’• DTrace ‘PID’ Provider can observe C programs
• Good: Erlang VM is C
• Bad: user needs to understand Erlang VM internals !
• Erlang VM-managed, Fine-Grain ‘Process’
• Erlang Process ≈ ‘opaque data’ ∴ invisible to DTrace
• Erlang data is dynamically typed
• DTrace uses static ‘C-style’ data types
• Erlang scripts are ‘opaque data’ to DTrace

Copyright Garry Bulmer 2008
Erlang has Dynamic Tracing
• Aim: to complement Erlang Tracing, not replace it
• DTrace is system-wide including OS kernel
• Longer term integrate Erlang tracing and Erlang-DTrace
• Provide Erlang-DTrace interface functions
• First cut - erlang:dtrace() ‘bif ’
Copyright Garry Bulmer 2008
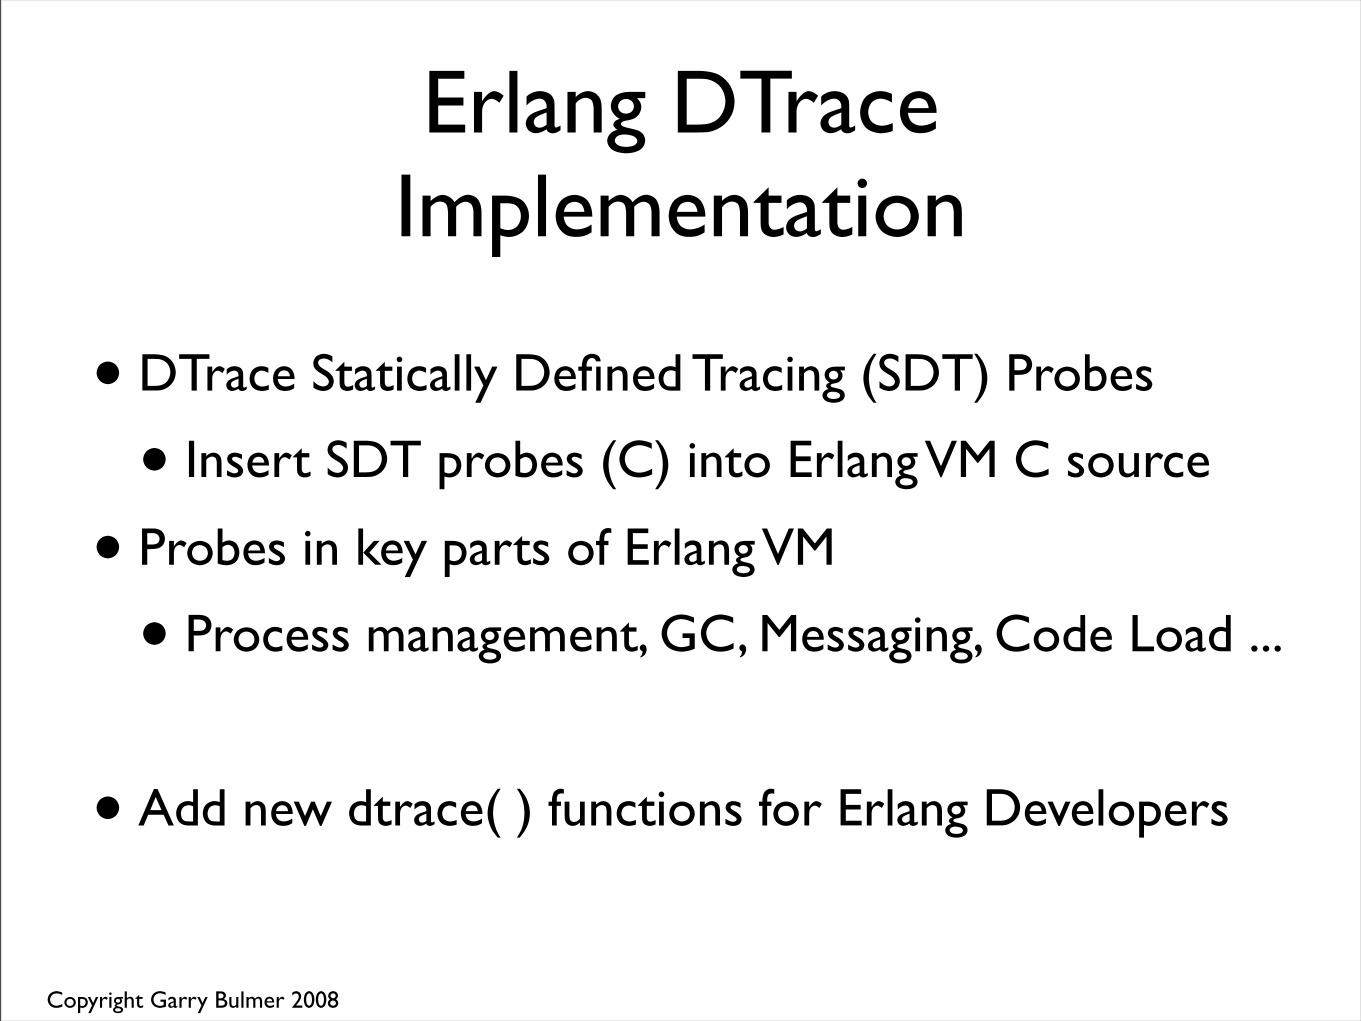
Erlang DTrace Implementation
• DTrace Statically Defined Tracing (SDT) Probes
• Insert SDT probes (C) into Erlang VM C source
• Probes in key parts of Erlang VM
• Process management, GC, Messaging, Code Load ...
• Add new dtrace( ) functions for Erlang Developers
Copyright Garry Bulmer 2008
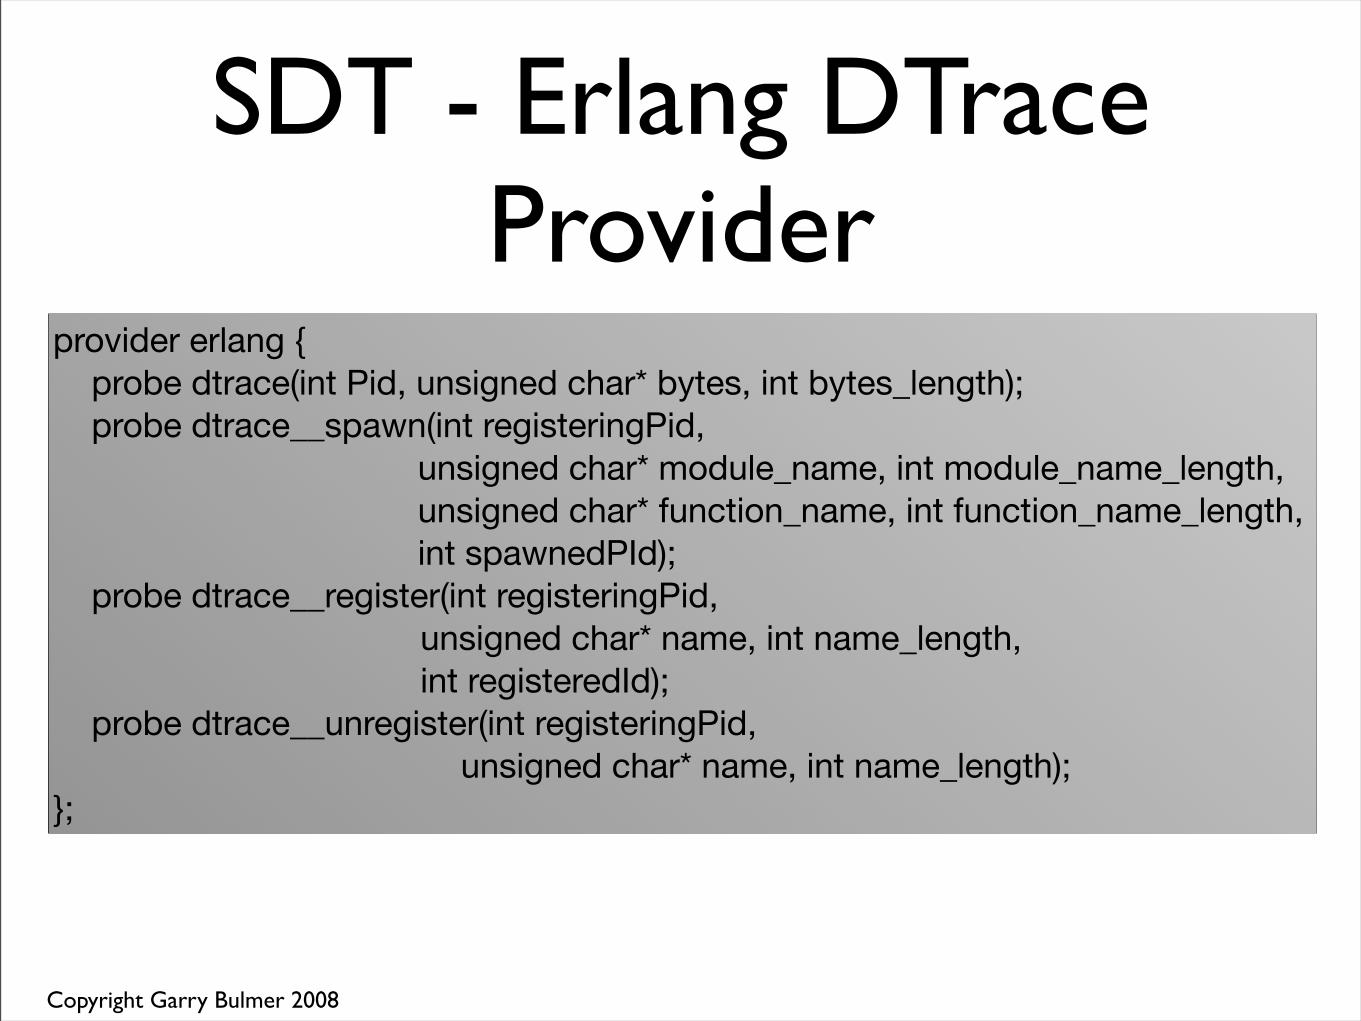
SDT - Erlang DTrace Provider
provider erlang { probe dtrace(int Pid, unsigned char* bytes, int bytes_length); probe dtrace__spawn(int registeringPid,
unsigned char* module_name, int module_name_length, unsigned char* function_name, int function_name_length, int spawnedPId);
probe dtrace__register(int registeringPid, unsigned char* name, int name_length, int registeredId);
probe dtrace__unregister(int registeringPid, unsigned char* name, int name_length);
};

Copyright Garry Bulmer 2008
SDT - Erlang Source addition
.... register.c * ...
if ((res == 1) && ERLANG_DTRACE_REGISTER_ENABLED()) { /* registered process successfully as name */ Atom* ap = atom_tab(atom_val(name)); if (rp->p && rp->p->id == id) { ERLANG_DTRACE_REGISTER(c_p->id,
(unsigned char*)ap->name, (int)ap->len, rp->p->id);
} }
...
* source is trimmed down from the original for readability
Copyright Garry Bulmer 2008
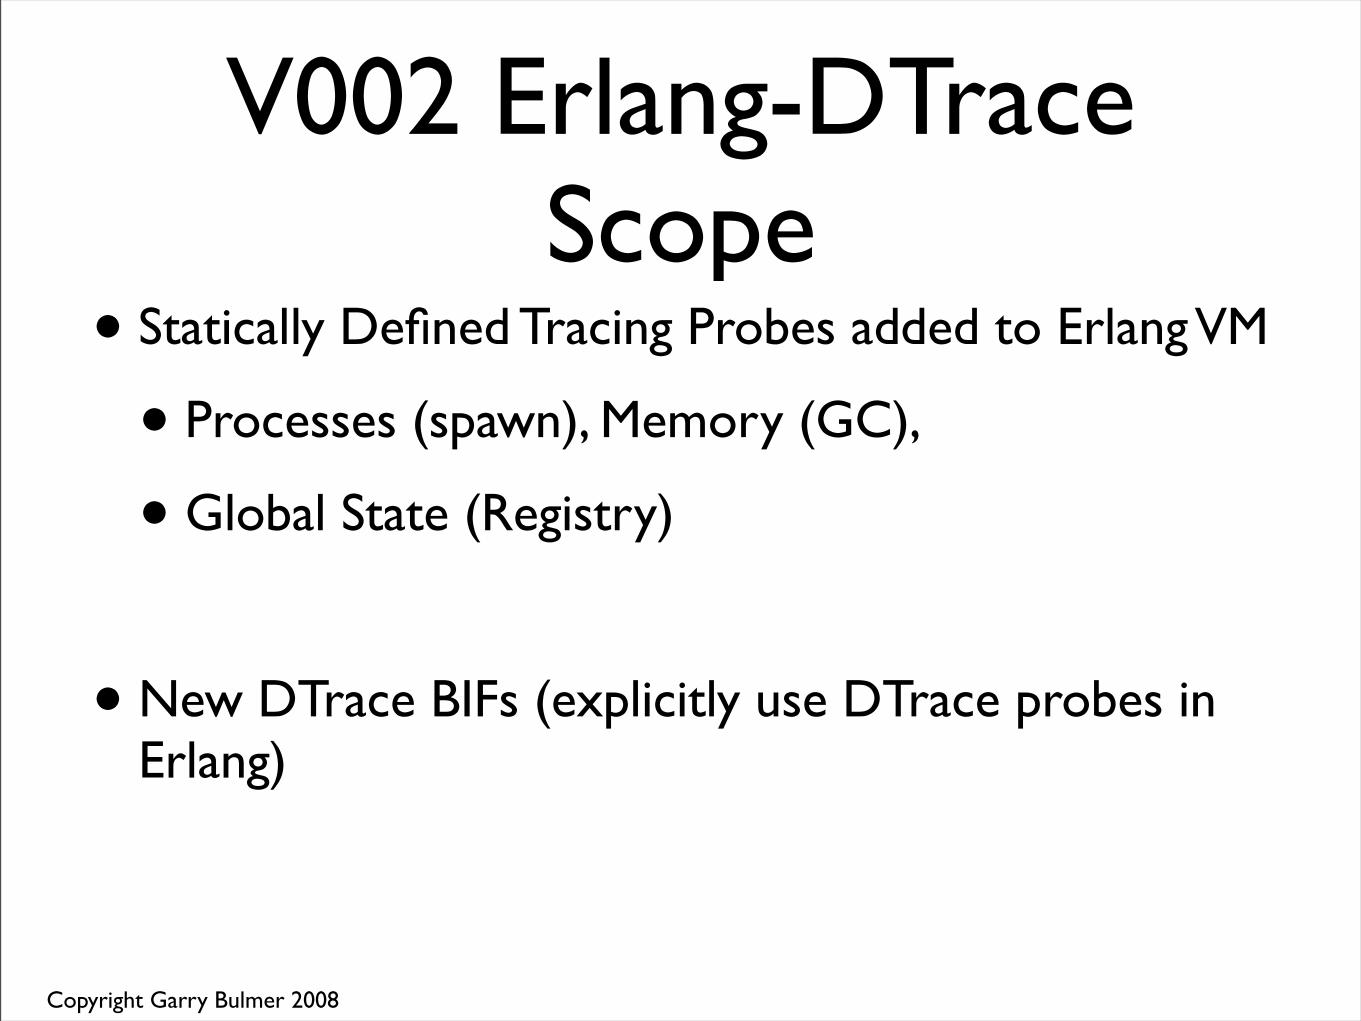
V002 Erlang-DTrace Scope
• Statically Defined Tracing Probes added to Erlang VM
• Processes (spawn), Memory (GC),
• Global State (Registry)
• New DTrace BIFs (explicitly use DTrace probes in Erlang)

Copyright Garry Bulmer 2008
Erlang-Dtrace Demo
Erlang VM'Proxy'
AdiumJabber/XMPP
Client
ejabberdJabber/XMPP
Server
DTrace
Copyright Garry Bulmer 2008
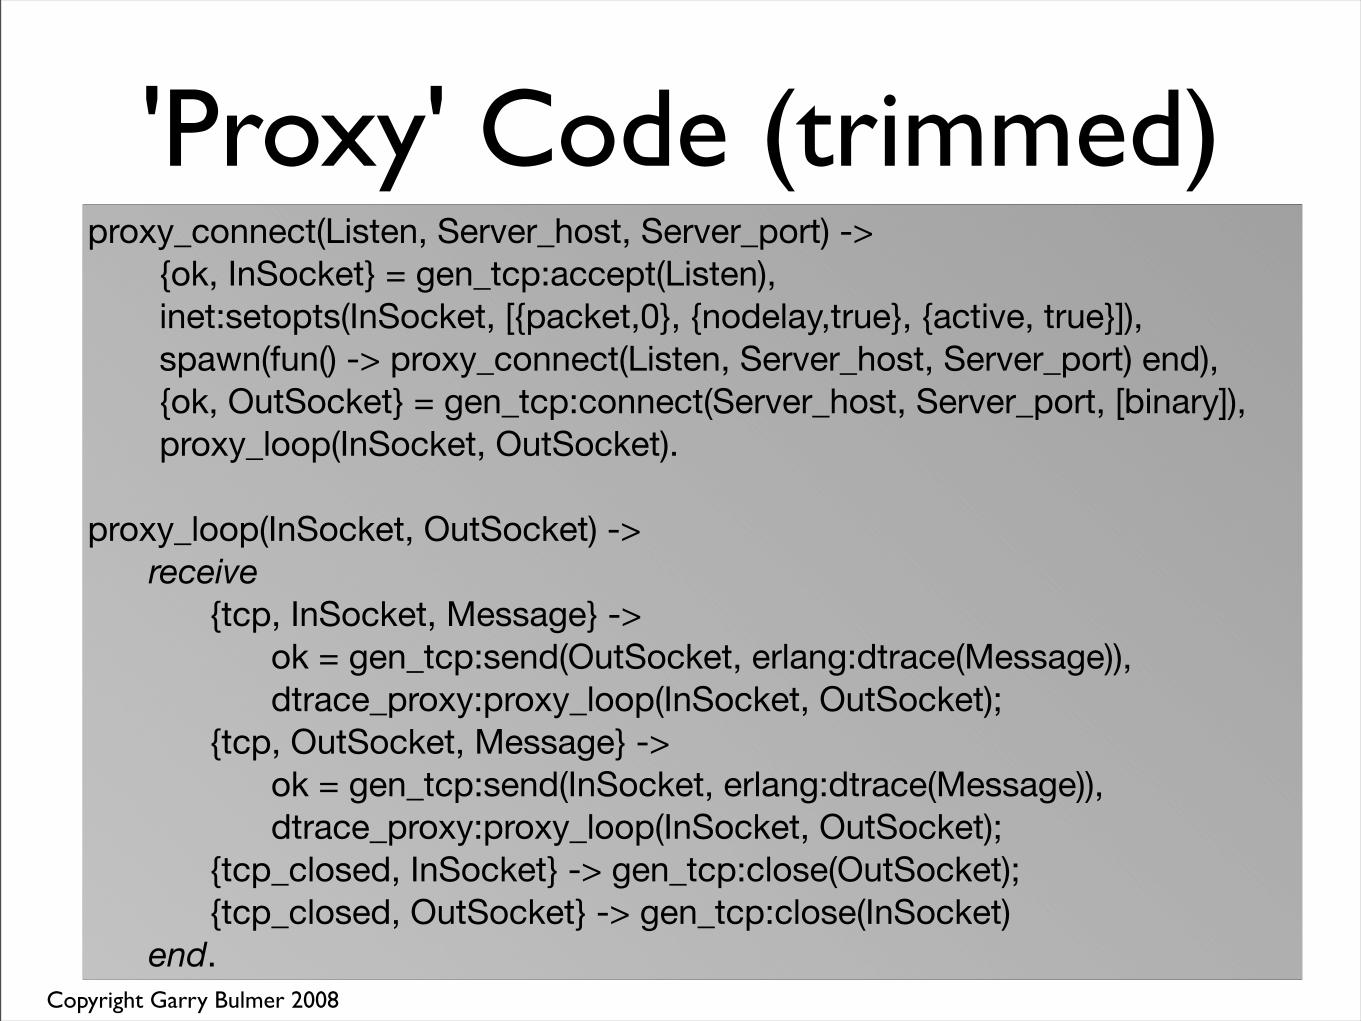
'Proxy' Code (trimmed)proxy_connect(Listen, Server_host, Server_port) ->
{ok, InSocket} = gen_tcp:accept(Listen),inet:setopts(InSocket, [{packet,0}, {nodelay,true}, {active, true}]),spawn(fun() -> proxy_connect(Listen, Server_host, Server_port) end),{ok, OutSocket} = gen_tcp:connect(Server_host, Server_port, [binary]),proxy_loop(InSocket, OutSocket).
proxy_loop(InSocket, OutSocket) -> receive {tcp, InSocket, Message} -> ok = gen_tcp:send(OutSocket, erlang:dtrace(Message)), dtrace_proxy:proxy_loop(InSocket, OutSocket); {tcp, OutSocket, Message} -> ok = gen_tcp:send(InSocket, erlang:dtrace(Message)), dtrace_proxy:proxy_loop(InSocket, OutSocket); {tcp_closed, InSocket} -> gen_tcp:close(OutSocket); {tcp_closed, OutSocket} -> gen_tcp:close(InSocket) end.
Copyright Garry Bulmer 2008
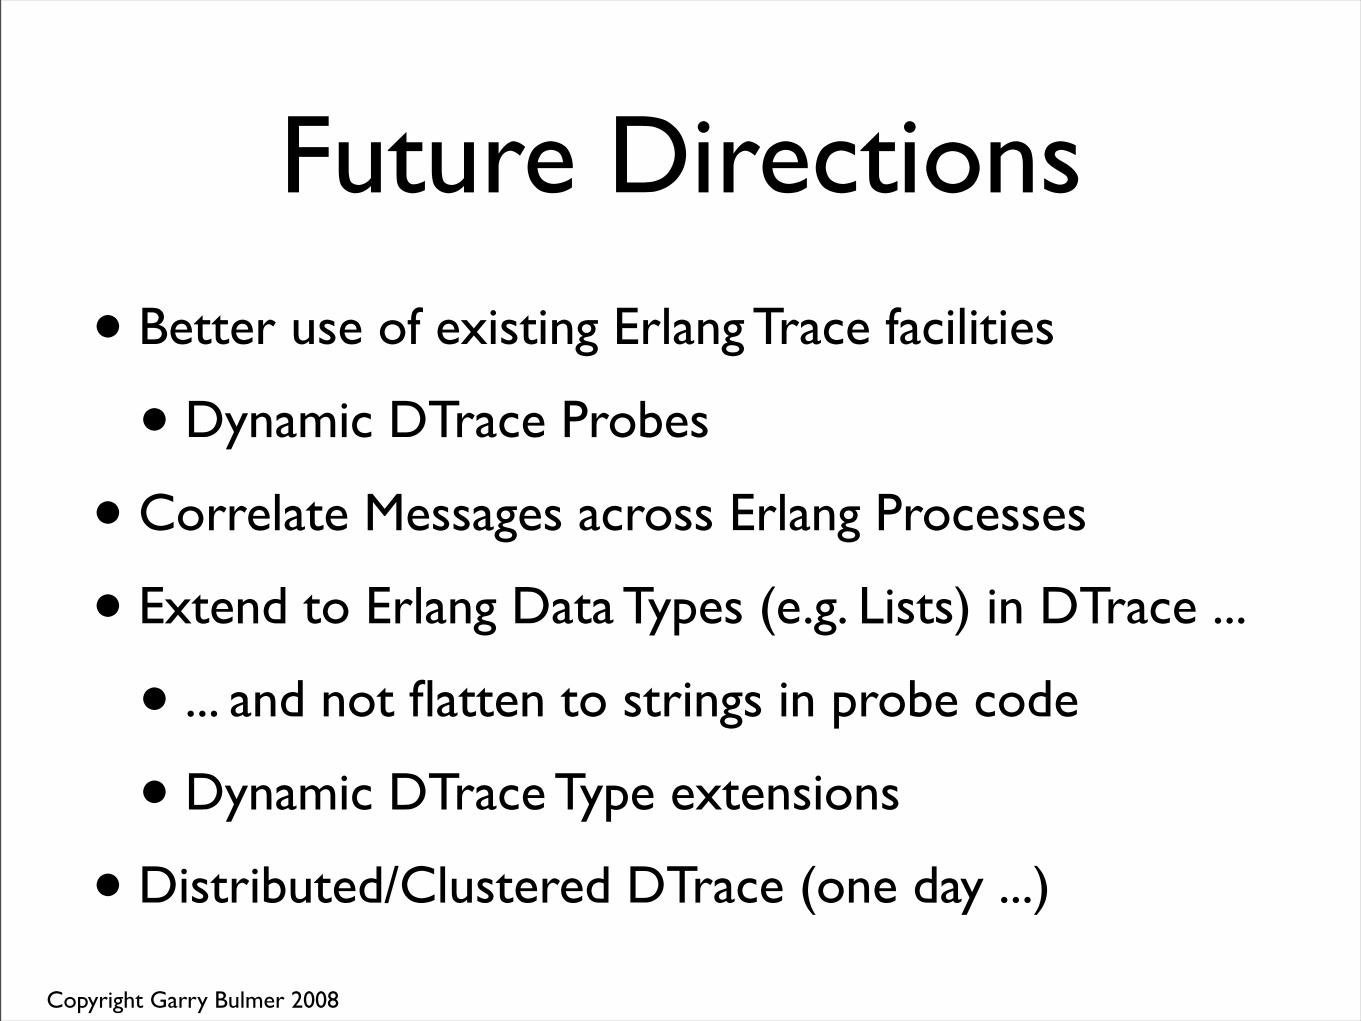
Future Directions
• Better use of existing Erlang Trace facilities
• Dynamic DTrace Probes
• Correlate Messages across Erlang Processes
• Extend to Erlang Data Types (e.g. Lists) in DTrace ...
• ... and not flatten to strings in probe code
• Dynamic DTrace Type extensions
• Distributed/Clustered DTrace (one day ...)
Copyright Garry Bulmer 2008
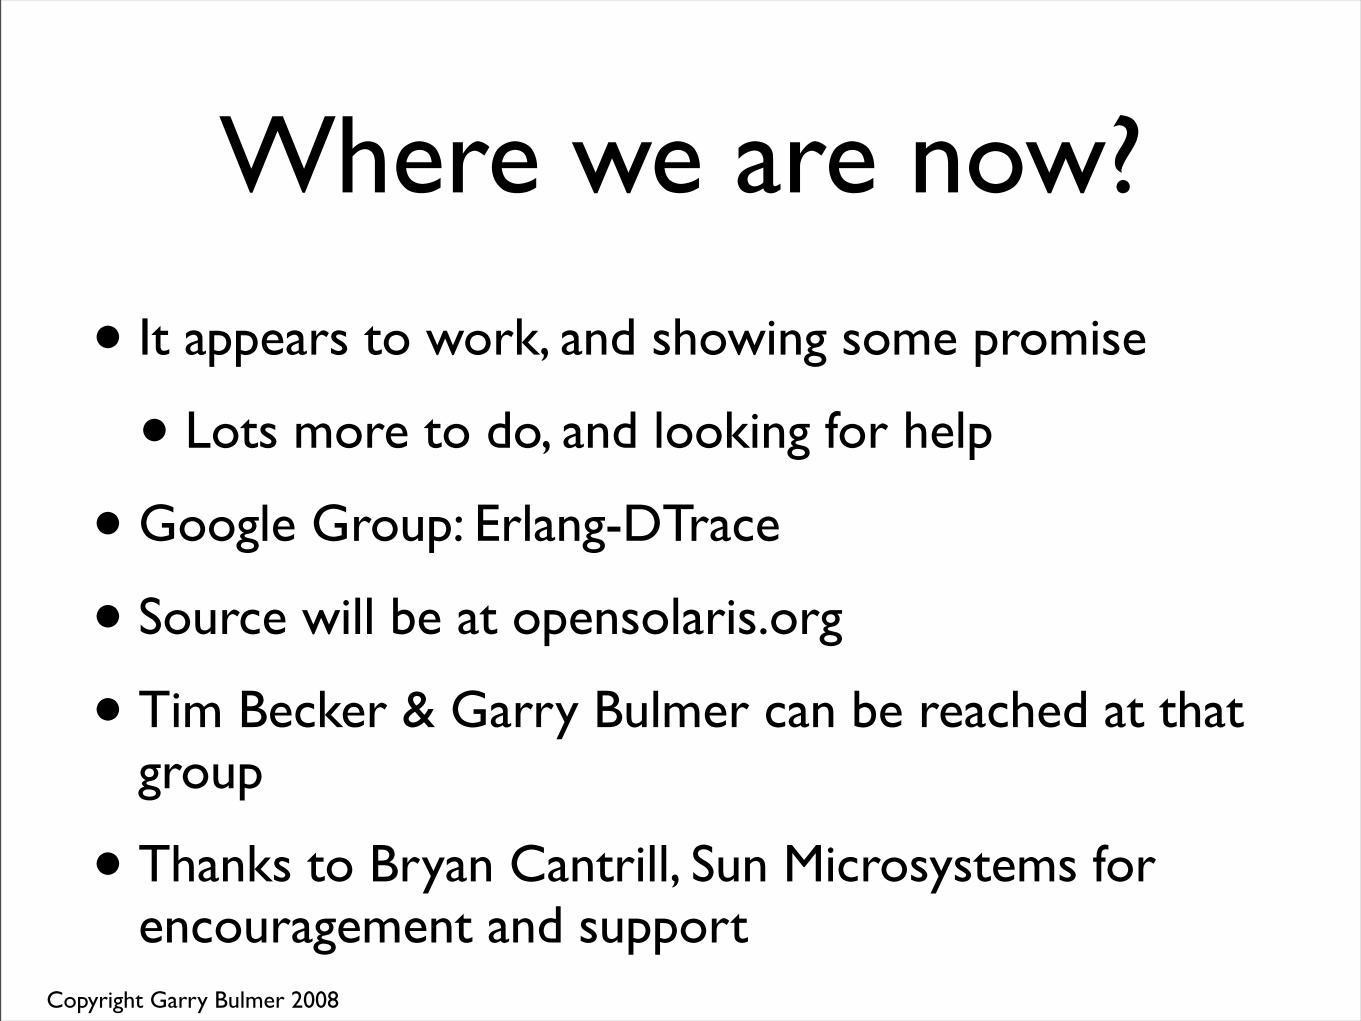
Where we are now?
• It appears to work, and showing some promise
• Lots more to do, and looking for help
• Google Group: Erlang-DTrace
• Source will be at opensolaris.org
• Tim Becker & Garry Bulmer can be reached at that group
• Thanks to Bryan Cantrill, Sun Microsystems for encouragement and support
Copyright Garry Bulmer 2008
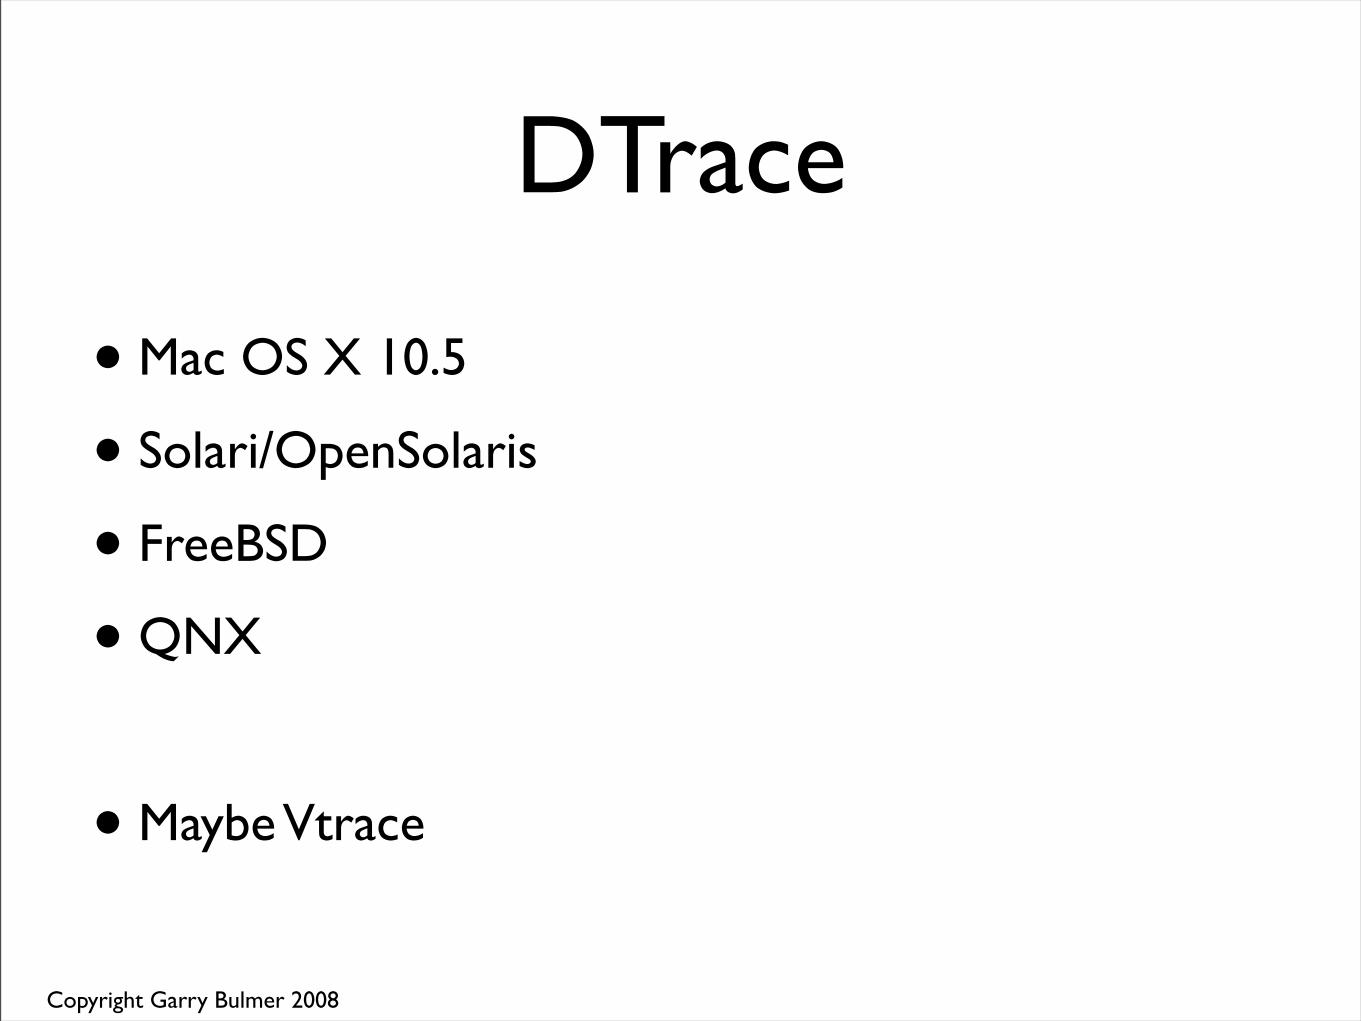
DTrace
• Mac OS X 10.5
• Solari/OpenSolaris
• FreeBSD
• QNX
• Maybe Vtrace

Questions or Feedback?
Top Related