


Languages
Pages
Legal


ENVIRONMENTAL IMPACT ASSESSMENT REPORT FOR ANTALYA- TURKEY POWER PLANT
DECEMBER 2007
ENERGY AND ENVIRONMENTAL INVESTMENT AND CONSULTING
LIMITED COMPANY ANKARA TURKEY
ISTANBUL TECHNICAL UNIVERSITY
MASLAK-ISTANBUL
TURKEY
ISTANBUL TECHNICAL UNIVERSITY
MASLAK-ISTANBUL
TURKEY

This report is produced by EN-ÇEV and technically reviewed and evaluated by ITU
Environmental Engineering Department and Chemical and Metallurgical Engineering
Department Working Groups.
Prof. Dr. Orhan İNCE Prof. Dr. Hasancan OKUTAN
Prof. Dr. Derin ORHON Prof. Dr. Ekrem EKİNCİ
Prof. Dr. Seval SÖZEN Dr.Volkan ARINCI
Eng. Senem TEKSOY

i
CONTENT N0 1. EXECUTIVE SUMMARY 1 1.1 Project Description 2 1.2 Project Impacts 2 1.3 Recommendations 3 2. POLICY, LEGAL AND ADMINISTRATIVE FRAMEWORK 4 2.1 Policies 4 2.1.1 National Environmental Impact Assessment Regulation 4 2.1.2 World Bank Policy on Environmental Assessment (OP 4.01) 5 2.2. Legal and Regulatory Framework 5 2.3 Institutions 7 3. PROJECT DESCRIPTION 8 4. ENVIRONMENTAL BASELINE DATA 15 4.1. Physical Environment 15 4.1.1 Geology and Geomorphologic Characteristics 15 4.1.1.1. General Geological Structure 15 4.1.1.2. Stratigraphy 15 4.1.2. Soil Characteristics 25 4.1.3. Climatology 25 4.1.4. Topography 29 4.1.5. Ambient Air Quality 33 4.1.6. Noise 36 4.1.7. Flora and Fauna 36 4.1.8. Archaeological and Cultural Resources 42 4.1.9. Land Use 42 4.1.10. Sensitive Zones 42 4.2. Biological Environment 42 4.2.1. Wetlands 42 4.2.2. Vegetation 42 4.2.3. Wildlife 43 4.2.4. Social Environment 43
5. POTENTIAL ENVIRONMENTAL IMPACTS 44 5.1. Construction Phase 44 5.1.1. Physical and Chemical 44 5.1.1.1. Geology and Soils 44 5.1.1.2.Topography and Landforms 44

ii
5.1.1.3. Climate and Meteorology 44 5.1.1.4. Air Quality 45 5.1.1.5. Noise 45 5.1.1.6. Hydrology 45 5.1.1.7. Water Quality 46 5.1.1.8. Solid Waste 46 5.1.2. Biological 47 5.1.2.1. Flora and Fauna 47 5.1.2.2. Ecosystems 47 5.1.3. Socio-economic 47 5.1.3.1. Demographic 47 5.1.3.2. Land Use 48 5.1.4. Occupational Health and Safety 48 5.2. Operation Phase 48 5.2.1. Physical and Chemical 49 5.2.1.1 Geology and Soils 49 5.2.1.2. Topography and Landforms 49 5.2.1.3. Climate and Meteorology 49 5.2.1.4. Air Emissions 49 5.2.1.5 Noise 54 5.2.1.6. Hydrology 55 5.2.1.7 Water Quality 55 5.2.1.8. Solid Waste 56 5.2.2. Biological 56 5.2.2.1. Flora and Fauna 56 5.2.2.2. Ecosystems 57 5.2.3. Socio-economic Structure 58 5.2.3.1. Demographic 58 5.2.3.2. Land Use 58 5.1.4. Occupational Health and Safety 59 6. MITIGATION MEASURES 60
7. ANALYSIS OF ALTERNATIVES 63 7.1. Site 63 7.2. Fuel Types 63 7.3. Technology 63 7.4. The "Do Nothing" Scenario 64 8. ENVIRONMENTAL MANAGEMENT PLAN (EMP) 65 ANNEX 1 ANNEX 2

ENVIRONMENTAL IMPACT ASSESSMENT REPORT FOR ANTALYA-TURKEY POWER PLANT 1
1. EXECUTIVE SUMMARY
AKSA ENERJİ ÜRETİM A.Ş. is proposing to construct a 566 MW natural gas driven power plant
in Antalya in order to meet the increasing power demand in the region. However, considering the
site conditions the actual output will be 525,2 MW. The Company acquired approximately 120 ha
of land neighboring the organized industrial district of Antalya.
This Environmental Impact Assessment (EIA) is to provide information on the potential negative
and positive environmental and social impacts of the project. It also aims to make
recommendations for the mitigation of the potential negative impacts and enhancement of the
positive ones. A field survey of the project site was conducted and potential environmental
impacts of project activities were identified, assessed, and documented. The EIA Team carried
out consultations with various stakeholders, particularly lead agencies, local authorities and the
affected people.
Both the Turkish and World Bank's social safeguard policies have been considered during the
assessment. The EIA study has been carried out according to requirements of the current EIA
Regulation of Turkish Government (Official Gazette, No: 25318, 16.12.2003) and the
Environmental Assessment Policies and Procedures of the World Bank OP 4.01 Environmental
Assessment (Annex B - Content of EA and Annex C - Environmental Management Plan).
Aim of the EIA study is to meet both the requirements of the Turkish EIA Legislation and World
Bank for a "Category A" Environmental Assessment Study (OP 4.01 Annex B Content of an EA
Category A Report). For this purpose, EIA has been prepared according to the special EIA
format regarding the requirements of the World Bank and Turkish Ministry of Environment and
Forestry.
This EIA study has been conducted by ENÇEV and ITU Environmental Engineering Department
and Chemical and Metallurgical Engineering Department Working Group.

ENVIRONMENTAL IMPACT ASSESSMENT REPORT FOR ANTALYA-TURKEY POWER PLANT 2
1.1 Project Description
The intended power plant will comprise 2 units of 283 MW SIEMENS SGT5-4000F gas turbines
yielding a total capacity of 566 MW, which will be operated as simple cycle turbines that will be
driven by natural gas only, with an actual output of 525,2 MW at site conditions. The plant will be
constructed near the organized industrial district of Antalya.
The plant will cover a land of 100,000 m2. The land is registered as agricultural land in the land
registry.
1.2 Project Impacts
The potential ecological impacts identified in the operation of the power plant are: (i) water
pollution related to disposal of domestic solid wastes generated by the personnel and domestic
wastewater generated by the personnel, (ii) water pollution from oil type wastes and/or spills
used for the maintenance of equipment (iii) noise pollution resulting from the operation of
turbines and other equipment (iv) air pollution resulting from the stack emissions during energy
generation.
All those wastes with potential impacts on the environment will be treated with most recent
technology available in accordance with the relevant national and international legal framework.
The positive impacts that will be benefited from the project are basically the additional power
availability and reliability in the region which is currently experiencing frequent power outages.
The impact of power reliability will improve infrastructural conditions for further investments,
basically related to tourism sector, in the area.
Accordingly, this will enable increased employment opportunities to the youth in the area and
hence help to improve the social well being also with improved life standards due to satisfactory
electricity supply.

ENVIRONMENTAL IMPACT ASSESSMENT REPORT FOR ANTALYA-TURKEY POWER PLANT 3
1.3 Recommendations A number of mitigation measures are recommended against the adverse activities during the
construction and operation phases of the project. Measures recommended during the
construction phase include control of noise pollutions from heavy equipment and vehicles
through proper inspection and maintenance, and use of noise suppressors or mufflers for heavy
equipment, control of air pollution from construction works and movement of vehicles through
proper inspection and maintenance to reduce exhaust emissions, watering of unpaved roads,
control of adverse impacts from construction debris by proper handling and immediate removal,
control of water pollution through proper storage and handling of oil wastes and treatment of
wastewaters at site, control of solid wastes through sanitary storage and frequent collection for
sanitary disposal. Quality of air and water will be monitored on a regular basis where noise will
be measured periodically.
While during the operation phase, emphasis has been on the control of; emission levels which
will be treated with the use of gas turbine equipped with dry low-NOx technology, noise pollution
(particularly for the workers) which will be treated with building a noise insulated power room and
satisfactory maintenance of related equipment, possible water pollution from oil wastes which
will be treated with employing proper handling and storage of oils/oil wastes and stringent
management of oil spills, all of which will be assured with periodic monitoring of noise and
emission levels and drinking water quality. All precautions against fire accidents and
electrocution will also be taken.
In all phases occupational health and safety will be carefully considered and controlled through
continuous inspection to prevent disease and accidents, and workers will undergo an
environmental and safety briefing on safety, sanitation measures, and emergency rescue
procedures before development begins. Adequate sanitary facilities, potable water, and garbage
bins will be provided.
From the study findings, it has been concluded that the impacts of the proposed project are
minor and easily mitigable. The developer is strongly advised to implement the
recommendations made by the EIA Team.

ENVIRONMENTAL IMPACT ASSESSMENT REPORT FOR ANTALYA-TURKEY POWER PLANT 4
2. POLICY, LEGAL AND ADMINISTRATIVE FRAMEWORK
2.1 Policies This chapter discusses the policy, legal and institutional arrangement/ framework within which
this EIA was drawn.
2.1.1 National Environmental Impact Assessment Regulation
The Turkish Environmental Impact Assessment (EIA) Regulation (Regulation of December 16,
2003, Official Gazette No. 25318) was enacted in view of the national environmental policies as
a result of the accepted need of identifying environmental impacts of the defined types of plants,
before they are realized.
The EIA process in Turkey starts with applying to the Ministry of Environment and Forestry
(MoEF) with a file prepared according to the General Project Presentation Format given in the
Annex III of the EIA Regulation, designed for projects under the categories defined in Annex I of
the regulation. Following the receipt of the format specific to the project form MoEF, the EIA
study has to be completed and submitted to MoEF in one year time.
For the projects that fall under the categories defined in Annex II of the EIA regulation, the
Project Presentation file has to be prepared and application has to be made to MoEF and/or the
Governorship. The specific format for the EIA study will be given after the public involvement,
scope and identification of the specific format meetings.
Thermal power plants which require an EIA report are specified in Annex I of the EIA regulation
as:
Article 2- Thermal power plants
a) Thermal power plants and incineration systems with a total thermal power of 200 MWt and
over.
This EIA has been prepared in strict compliance with the requirements of the Turkish
environmental regulations.

ENVIRONMENTAL IMPACT ASSESSMENT REPORT FOR ANTALYA-TURKEY POWER PLANT 5
2.1.2 World Bank Policy on Environmental Assessment (OP 4.01)
The World Bank requires EIA of projects proposed for Bank financing to help ensure that they
are environmentally sound and sustainable in order to improve decision making of the Bank on
the project. The Environment Strategy outlines the Bank’s approach to address the
environmental challenges and ensures that Bank projects and programs integrate principles of
environmental sustainability.
This study is in line with the Bank's requirements. The Bank's guideline regarding the conduct of
an EIA has been adequately followed by the EIA Team.
2.2. Legal and Regulatory Framework The relevant laws that promote environmental management in Turkey have been adequately
reviewed and applied by the EIA Team including the following:
Regulation on Prevention and Control of Industrial Air Pollution (Date: 22.07.2006, No: 26230)
Regulation on Assessment and Management of Environmental Noise Pollution (Date:
01/07/2005, No: 25682)
Water Pollution Control Regulation (Date: 31.12.2004, No: 25687)
Regulation on Water for Human Consumption (Date: 17.02.2005, No: 22730)
Solid Waste Control Regulation (Date: 14.03.1991, No: 20814)
Environmental Impact Assessment regulation (Date: 16.12.2003, No: 25318)
Regulation on Control of Hazardous Wastes (Date: 14.03.2005, No: 25755)
Regulation and Guidelines on Occupational Health and Safety (Work Law No: 4857)
Regulation on Control of Waste Oils (Date: 21.01.2004, No: 25353)
Groundwater Law (Date: 23.12.1960, No: 10688)
Electricity Market Law (Date: 20.2.2001, No: 4628)
Natural Gas Market Law (Date: 18.4.2001, No: 4646)

ENVIRONMENTAL IMPACT ASSESSMENT REPORT FOR ANTALYA-TURKEY POWER PLANT 6
Environment Law (Date: 9.8.1983, No: 2872)
Regulation on Control of Excavation Soil, Construction and Debris Waste (Date:
18.03.2004; No: 25406)
Related EU Directives
Related International Conventions (as summarized below)
Bern Convention on Protection of Wildlife and Natural Habitats
This convention aims to protect the wild plant and animal species together with their natural
living environments, putting special emphasis on the endangered species. Turkey has become a
party to the Convention on 1984.
Convention on International Trade in Endangered Species of Wild Fauna and Flora (CITES)
CITES Convention has developed a system which set up a condition of government permission
for the trading of endangered species of wild fauna and flora. Turkey has become a party to the
Convention on 1996.
Ramsar Convention on Wetlands
The basic aim of the Convention is to emphasize the fact that ‘wetlands are important economic,
cultural, scientific and social resources and their loss is irreversible’. Turkey has become a party
to the Convention on 1994.
Biodiversity Convention (Rio Conference)
The Convention establishes three main goals: the conservation of biological diversity, the
sustainable use of its components, and the fair and equitable sharing of the benefits from the
use of genetic resources. Turkey has become a party to the Convention on 1997.
Convention Concerning the Protection of the World Cultural and Natural Heritage Paris
The convention considers adoption of new provisions in the form of a convention establishing an
effective system of collective protection of the cultural and natural heritage of outstanding
universal value, organized on a permanent basis and in accordance with modern scientific
methods. Turkey has become a party to the Convention on 1983.

ENVIRONMENTAL IMPACT ASSESSMENT REPORT FOR ANTALYA-TURKEY POWER PLANT 7
The Protocol for the Protection of the Mediterranean Sea against Pollution
The Convention aims to protect the Mediterranean Sea against all sorts of pollution by the
Mediterranean countries. Turkey has become a party to the Convention on 1981.
Convention on Control of Transboundary Movements of Hazardous Wastes and their Disposal
The convention aims to protect human health and the environment against the adverse effects
resulting from the generation, management, transboundary movements and disposal of
hazardous and other wastes. Turkey has become a party to the Convention on 1994.
Convention on Long-Range Transboundary Air Pollution
To create an essential framework for controlling and reducing the damage to human health and
the environment caused by transboundary air pollution. Turkey has become a party to the
Convention on 1994.
2.3 Institutions The related institutions related to the installation of a new natural gas driven power plant are
listed as below:
• Ministry of Environment and Forestry
• Ministry of Energy and Natural Resources
• Ministry of Labor and Social Security
• Ministry of Industry and Trade
• Electricity Market Regulation Authority
• State Planning Organization
• General Directorate of Petroleum Works
• General Directorate of Petroleum Transmission Lines Co.
• Power Resources Development Administration
• General Directorate of Turkish Electricity Transmission Lines Co.
• General Directorate of Turkish Electricity Distribution Lines Co.
These institutions listed above are actually the stakeholders that form the framework conditions
for encouragement and support of power market.

ENVIRONMENTAL IMPACT ASSESSMENT REPORT FOR ANTALYA-TURKEY POWER PLANT 8
3. PROJECT DESCRIPTION
The proposed plant consists of 2 units of 283 MW SIEMENS SGT5-4000F model gas turbine
with a total capacity of 566 MW, which will be operated as simple cycle turbines. The power
plant will be operated with natural gas fuel only.
The plant will be installed in Antalya city, Selimiye village, Surutme district covering a total of
120000 m2 on surveyed land, neighboring the Antalya Organized Industrial District. The general
location of the power plant is illustrated in Figure 1.
The nearest residential area is at approximately 3 km distance from the power plant. The project
site is identified as agricultural land in the land registry. The plant layout, road map and the
1/25000 scaled map showing the plant site is shown in Figure 2.
Figure1. Location of the Power Plant

ENVIRONMENTAL IMPACT ASSESSMENT REPORT FOR ANTALYA-TURKEY POWER PLANT 9
Figure 2. Plant Layout

ENVIRONMENTAL IMPACT ASSESSMENT REPORT FOR ANTALYA-TURKEY POWER PLANT 10
The land registries show that the land is owned by AKSA ENERJİ ÜRETİM A.Ş.
The system will consist of the following units:
Gas Turbines 2 Units of SGT 5-4000F Model and Auxiliaries
Raw Water Tank for Fire Fighting, and Fire Pumps
Gas Pressure Reduction Station
Main Power and Auxiliary Transformer
Switchyard
The process profile of the power plant is shown in Figure 3. It shows the flow of natural gas and
the energy production.
Figure 3. Process Profile of the Power Plant
The plant will burn natural gas at 33 bars to produce electrical energy. The units are classified as
industrial type gas turbines.
The natural gas will be taken from the national natural gas transmission lines at a 4 km distance
from the plant. The natural gas will be piped directly to the system with branching from the main
line without intermittent storage.

ENVIRONMENTAL IMPACT ASSESSMENT REPORT FOR ANTALYA-TURKEY POWER PLANT 11
Natural gas is a mixture of light molecular weight hydrocarbons (C1-C5) such as methane (CH4),
ethane (C2H6), and propane (C3H8). A major portion of natural gas is methane. It may be found
in underground alone, or as gas on top of petroleum reservoirs, or as dissolved in petroleum.
Like petroleum, natural gas is present in the microscopic pores of rocks and it reaches the
production wells flowing through the rocks. Natural gas is separated from the heavy
hydrocarbons on surface. Natural gas is the cleanest fossil fuel that is used for domestic
purposes. When natural gas is burnt, CO2, water vapor and NOx are formed. The compositions
of natural gas and petroleum are given in Table 1.
Natural gas is an odorless, smokeless, economical, high efficiency, clean and environmental
friendly gas which is free from toxic materials.
The utilization of natural gas has been increasing among other energy resources and it is
anticipated that it will continue to be an alternative energy resource in the 21. Century. The
share of natural gas grown to 22,5 % in 1982 from 16 % in 1960s, whereas the share of solid
fossil fuels dropped to 32 % from 52 % in the same time interval. This trend is likely to be
followed in the future.
Table 1. Components of Natural Gas and Petroleum
Component Molar Fraction of Natural Gas
Molar Fraction of Petroleum
Methane (CH4) 0.90 0.44 Ethane (C2H6) 0.05 0.04 Propane (C3H8) 0.03 0.04 Butane (C4H10) 0.01 0.03 Pentane (C5H12) 0.01 0.02 Hexane and heavier (>C6H14) << 0.01 0.43
The plant will not consume water for its operation as the gas turbine has a dry low NOx control
and all cooling operations will be performed by air. Water consumption will only be in the form of
domestic water consumption by the plant’s personnel. The water will be supplied from wells to
be drilled on and around the site.

ENVIRONMENTAL IMPACT ASSESSMENT REPORT FOR ANTALYA-TURKEY POWER PLANT 12
Wastewater generated will not be discharged to any sewerage system. An independent
wastewater treatment plant will be designed to treat the domestic wastewater discharges. The
treatment system will be designed to meet the criteria defined for Sensitive Zones under the EU
Council Directive Concerning Urban Wastewater Treatment (91/271/EEC) considering the
potential sensitive character of the project area. The treated wastewater will be reused for
irrigation purposes in the project area which is in line with the policies related to rational use of
water resources.
New storm water drains will be constructed at the site which will be used together with the
existing drains to direct storm water to the main drainage system.
The site is reached by land road which takes approximately 25 km from the Antalya City center
and it is right next to the Antalya-Burdur highway.
The construction works will be completed in 1,5 years. The economical life of the plant is
estimated as 30 years. The project time table is given in Table 2.
The numbers of workers to be employed during the construction and operation phases are given
in Table 3. In the operation phase personnel will be a total of 200 workers.
It is planned to work in 3 shifts. In the operation phase 100 people will work in the plant. In the
operation phase it is planned to arrange the working hours as 667 hours per month and for 12
months a year. Hence the plant will be able to work in full capacity.

ENVIRONMENTAL IMPACT ASSESSMENT REPORT FOR ANTALYA-TURKEY POWER PLANT 13
Tabl
e 2.
Pro
ject
Tim
etab
le o
f the
Pow
er P
lant

ENVIRONMENTAL IMPACT ASSESSMENT REPORT FOR ANTALYA-TURKEY POWER PLANT 14
Table 3. Number of Workers per Activity
Activity # of Workers Construction
Phase Operation
Phase Construction 60 30 Mechanics 60 30 Electrical 40 20
Administration 40 20 Total 200 100
The proposed power plant will not use materials that are classified as hazardous or toxic during
the construction and operational phases of the project.
Oil tanks will be isolated with concrete lining to prevent any leakage and the waste oils,
generated less than 10 m3/year, will be removed by a licensed hauler.
National Occupational Health and Safety Regulation will be strictly complied during the
construction and operation phases of the Project.

ENVIRONMENTAL IMPACT ASSESSMENT REPORT FOR ANTALYA-TURKEY POWER PLANT 15
4. ENVIRONMENTAL BASELINE DATA
This chapter provides information on the physical, biological and socio-economic elements of the
environment, which shall be used as benchmarks for future monitoring. The area considered for
assessment of baseline conditions span the whole Antalya region which will be large enough in
extent to include all potential impacts from the proposed project. Data were obtained as a result
of literature and field surveys.
4.1. Physical Environment 4.1.1 Geology and Geomorphologic Characteristics 4.1.1.1. General Geological Structure
Stratigraphic and formational characteristics have been identified, the 1/25000 scale maps have
been partially completed and the 1/100000 scale geological map of the region has been
prepared. There have been hundreds of naming studies conducted in the West and Middle
Taurus Mountains.
In order to form a uniform legend, the naming for similar rock types of similar ages have been
unified in an appropriate approach and this has sometimes led to exceptions. The study area
placed in the Antalya gulf (West Taurus Mountains) houses Antalya nappes and the Myocene-
quaternary ranged plant covers that cover the Antalya nappes stratigraphically.
4.1.1.2. Stratigraphy
Beydagları Formation which represent the autochthonic rock units are placed in the north of the
region. Beydağları and Antalya Miocene basins are developed partly independent of each other,
and Antalya Upper Miocene-Pliocene basin which is developed totally independent from the
others make up the main Antalya Neogene basin.

ENVIRONMENTAL IMPACT ASSESSMENT REPORT FOR ANTALYA-TURKEY POWER PLANT 16
The rock units of the Beydağları Miocene basin of Western Taurus start with; the Aquitanian
Karabayır Formation which consists mainly of limestons with Rhodophyta and continue with the
Burdigalian and Langhian Karakuş Formation consisting of flysch type sediments and the
overlying deltaic conglomerate. This formation, which fills the basin, has been developed during
the Middle Miocene while the Lycian nappes were thrusting.
The Antalya Miocene basin in the west of Middle Taurus lies between the Beydağları and
Anamas-Akseki platforms. The basin consists of the Aksu Formation which includes terrigenous
conglomerate-siltstone, marine; conglomerate-sandstone and reef limestone lenses; the
Oymapınar Limestone of mainly reef limestone; the Çakallar Formation consisting of limestone
breccia and packstone alternated with clayey limestone; the Geceleme Formation of limy
claystone -sandstone alternation; and the Karpuzçay Formation which is composed of shale-
sandstone-conglomerate alternation with occasional volcanic tuff interbeds.
This sedimentation period started in Upper Oligocene and ceased in Upper Tortonian as the
basin was compressed first towards the-west and later towards the south by the Aksu phase. In
the area elevated by this compression, the Taşlık Formation consisting of clayey limestone -
limestone-blocky conglomerate (some are gypsum) has been deposited locally in Lower
Messinian.
The Antalya Upper Miocene and Pliocene basin lies in the west of Middle Taurus. It appears in
the south of the Aksu valley and along the Mediterranean coast as a post-tectonic unit. The
Messinian Eskiköy Formation of conglomerate-sandstone, the Gebiz Limestone sometimes
reefal showing lateral gradation into the Eskiköy Formation, the Yenimahalle Formation of Lower
and Upper Pliocene age including limy claystone -sandstone, and the Upper Pliocene Alakilise
Formation which consists of sandstone with volcanic tuff and conglomerate make up the rock
succession of this basin.
Geological map of the project area and its close vicinity of 1/100 000 scale is given in Figure 4.

ENVIRONMENTAL IMPACT ASSESSMENT REPORT FOR ANTALYA-TURKEY POWER PLANT 17
Figu
re 4
. Geo
logi
cal M
ap o
f the
Pro
ject
Are
a (1
/100
000
)

ENVIRONMENTAL IMPACT ASSESSMENT REPORT FOR ANTALYA-TURKEY POWER PLANT 18
Beydagları autochthons
Beydağları which represent the autochthons of the West Taurus mountains, are generally
composed of platform-type sediments. The study area consists of, from bottom to top, Upper-
Middle Triassic aged Kuyubası dolomite, Beydaglari formation that is composed of Jura-Kretase
aged neritic limestones, danien aged Camlıdere olistostrom, Upper Lutessian-Prabonien aged
limestone, Karakustepe formation formed from sandstone, claystone and silt stones.
TRIASSIC
Kuyubası Dolomite
The Upper- Middle Triassic aged formation form from old thick dolomites was named by Gunay
et al. (1982). The surface mostrals of the Kuyubasi dolomite correspond partially to the Mentese
dolomites and Leylek limestones on-bserved in the northeast and east. The unit consists of
massive, middle thickness, dark grey colored, coarse particle and sometimes fine-middle
particle, spread dolomites. Dolomite limestones can also be observed spead in these dolomites.
The unit is transitive to Beydagi formation on the top side. The unit has been observed to be
2200 m thick. Involutina sp. was identified in the dolomite exploration along with the Megalodon
sp. on the upper levels. Kuyubasi dolomite sedimented on shallow carbonate self environment.
JURA-CRESTACEOUS
Beydağları Formation
Upper Cretaceous carbonates of the middle-northern part of the Bey Dağları autochthon
(between Elmalı and Çamlıdere) show important sedimentary breaks and facies changes with
respect to evolution of the platform. Biostratigraphic studies on the Upper Cretaceous
carbonates indicate deposition in neritic, hemipelagic and pelagic environments.
The Upper Cretaceous sequence of the middle-northern part of the autochthon is represented by
two formations. The Bey Dağları Formation comprises thick neritic limestones at the base and
thin hemipelagic limestones at the top. Approximately 700 m thick, middle Cenomanian-
Coniacian neritic part consists of shallow water platform limestones, which deposited in peritidal
environment. 26 m thick, Coniacian-Santonian hemipelagic limestones gradually overlie the
neritic limestones. Thin to middle bedded cherty pelagic limestones of the Akdağ Formation

ENVIRONMENTAL IMPACT ASSESSMENT REPORT FOR ANTALYA-TURKEY POWER PLANT 19
reach to the total thickness of 100 m and disconformably overlie the different stratigraphic levels
of the underlying Bey Dağları Fromation. The pelagic marls of the Paleogene, which locally
begin with a pelagic conglomerate levels, disconformably overlie the different stratigraphic levels
of the Upper Cretaceous sequence. Two rudist formations have been observed in the neritic
limestones. The lower rudist level observed in the eastern slope of the Katran Dağ is mainly
composed of caprinids (caprinid-radiolitid lithosome). The rudist fauna comprises
Ichthyosarcolites bicarinatus (Gemmellaro), Ichthyosarcolites triangularis Desmartes, Caprina
schiosensis Boehm, Neocaprina gigantea Plenicar, Schiosia cf. schiosensis Boehm,
Sphaerucaprina woodwardi Gemmellaro, Durania sp., Radiolites sp., Sauvagesia sp. and
unidentified radiolitids, which indicate Middle-Late Cenomanian. Corals and gastropods
accompany the rudist fauna.
Upper rudist level is dominated by hippuritids and found near the top of the platform limestones
(hippuritid-radiolitid lithosome). The fauna is represented by the dominance of Vaccinites
praegiganteus (Toucas), which is accompanied by rare Vaccinites inferus (Douvillé), Hippurites
socialis Douvillé, Hippuritella resecta (Defrance) and radiolitids.
87Sr/86Sr values of well-preserved low-Mg calcite of the shells of V. praegiganteus show that the
age of this level is of Late Turonian. The upper rudist level, which prominently occurs in the
Korkuteli area, is observed in the stratigraphic sections measured in Büyükköy, Kızılağaç and
Peçenek Boğazı throughout the northern part of the platform. Pseudorhapydionina dubia-
Pseudorhapydionina laurinensis, Chrysalidina gradata-Pseudolituonella reicheli and
Nezzazatinella picardi-Psudonummoloculina heimi biozones have been identified, which
correspond to Middle-Upper Cenomanian, uppermost Cenomanian-lowermost Turonian and
Middle- Upper Turonian respectively
PALEOCENE
Camlıdere Olistostrom (Tpc)
The formation was named by Poisson (1977). It consists of limestone marn, claystone and
sandstone on the bottom and olistolite particles of various sizes on the top. The base of the unit
has rock types such as middle-thin, beige, cream, gray, yellow, pink colored limestone, marn,
claystone, siltstone, kalkarenite, and sandstone. On top of it there is the Antalya nappes and
turmis olsitostrom of the Beydaglari formation. This high level matrix has a caotic character on

ENVIRONMENTAL IMPACT ASSESSMENT REPORT FOR ANTALYA-TURKEY POWER PLANT 20
the upper levels which is sometimes sandstone-claystone and sometimes conglomerate. The
thickness ranges between 0 -200 m. The unit is assumed as Danien aged. The formation
sedimented in the active basin environment on the front of the Antalya nappes.
EOCENE
Kucukkoy Formation
The formation was named by Poisson (1977). It consists of claystone marn, siltstone, sandstone,
clayey-sandstone and limestone. It is hard to distinguish the Kucukkoy formation due to the
similarity to the Paleocene-Sub Eocene aged rocks and tectonics. The formation consist of
middle thin, thick layered, white, yellow, grey, beige, greenish grey, pink and red colored
calcarenite, sandstone, limestone and middle level claystone, siltstone, marn, and clayey-
limestone rock types. Conglomerates can be observed on the bottom layers. The thickness of
the unit ranges between 0-500 m. The formation is Upper- Lutessian-Priabonien aged. It
sedimented in slope-basin environment.
MYOCENE
Karabayır Formation
The formation forming from algae limestone was named by Poisson and Poignot (1974). The
formation can be observed also in the Antalya nappes on the South of Sutculer. The unit
consists of middle-thick layered, grey, beige, cream, yellow, and dark gren algae limestones.
Conglomera or conglomeratic limestones can be observed on the bottom. Coral masses are
observed in parts where algae are less dense. The formation ends with clayey limestones on the
top. Its maximum thickness is 400 m. The formation is Akitanies Sub Burdigalien aged. It
sedimented in shallow carbonate self environment.
Karakustepe Formation
The formation generally forming from consequtive lining of sandstone, claystone and siltstone
was named by Poisson (1977). The formation can be observed also in the Antalya nappes on
the South of Sutculer, where it is dominated by claystone. The unit consists of consecutive thin-
middle-thick layered, grey, gren, beige, light Brown sandstone, claystone and siltstone. Clayey-
sandy limestone, conglomer, marn types can also be observed in the unit. The maximum

ENVIRONMENTAL IMPACT ASSESSMENT REPORT FOR ANTALYA-TURKEY POWER PLANT 21
thickness is 600 m. It is Burdigaliyen aged and also corresponding to Sub Langien. It
sedimented on slope-basin environment with heavy turbid streams.
ANTALYA NAPPES
Antalya nappes were identified by Lefevre (1967). It was categorized as Lower Nap (Cataltepe
unit), and Upper nap (Tahtalıdağ unit) and then re-categorized as Cataltepe nap, Alakırcay nap,
Tahtalıdağ nap ve Tekirova ofiyolit nap by Senel et al. (1992,1996). In the study area, the
Alakırcay nap, Tahtalıdağ nap ve Tekirova ofiyolit napa are surfaced. The Alakırcay nap formed
from Alakırcay and Kumluca units, is structurally located on Cataltepe nap and below the
Tahlalıdag nap. The Alakırcay nap named by Senel et al. (1981) is Anissien-Norien aged. It
consists of overlaying Halobiali micrite, radyolarite, cort, planty sandstone and pillow shaped
basalt, spilite type of rocks on vertical and horizontal directions. It has a chaotic structure due to
fractures, which hardens identification of formations within the unit. It is Upper Anissien-Norien
aged. It sedimented on basin environment. It consists of the Gokdere, Candir and Tesbihli
formations.
Gökdere formation
This formation occupies an area of 35 km2. In many parts of the area the formation occurs in the
uppermost levels of the Triassic rhythmic series. The formation consists of platy limestones
containing silica nodules. Thickness of the formation is between 400-600 m. Limestones, which
are whitish to milky-white-colored or pinkish to gray-colored, contain silica lenses; in places
radiolarite layers can be observed within these limestones. This formation—which horizontally or
vertically grades into radiolarites in the lower part—shows gradual transition into sandy
limestones in the Körler Mahallesi, situated in the north of the area. In the eastern part of the
area, in the vicinity of Gökdere, Deveboynu Geçidi, platy limestones which show lateral transition
and are interbedded with radiolarites were observed. The radiolarites contain abundant Halobia,
Daonella and small Ammonites and are overlain by marly limestones and sediments with plant
remains; the contact is abnormal since the formation is thrust here over the Upper Cretaceous
and limestone beds.

ENVIRONMENTAL IMPACT ASSESSMENT REPORT FOR ANTALYA-TURKEY POWER PLANT 22
Thin sections of fine-grained limestones with silica nodules were examined and the presence of
the following fossils was established: Nodosaria sp., Glomospira sp., Duostominidae, Radiolaria
sp., spicules, and pelagic lamellibranch fragments. Erol Öngüç, who determined these fossils,
assigned them to a Triassic age. Macrofossils, such as Halobia, Daonella, and Ammonites
(Ceratites sp.), were also found.
Sedimentological study of the thin sections of some samples showed that the rock is
biocalcilutite (or aphanitic limestone). Biomicrite is generally well sorted and contains Radiolaria,
Nodosaria and other small, deep-sea Foraminifera scattered in an orthochem consisting of thick
calcareous ooze.
Dolomitization is very slight and secondary calcite mosaic and stylolite structures, which do not
change the original texture of the rocks, are also observed. Study of the rocks shows that calm
marine conditions predominated in this area. Alternations of thin limestone, radiolarite and
sandstone beds reach sometimes several hundred meters of thickness. The Gökdere formation
appears here as an anticline which is overlain by the white-colored and semicrystalline Karadağ
limestones; the contact between the two formations is slightly faulted.
Going upward the boundary between the sandstone facies and the limestones is characterized
by a gradual transition. This is a somewhat different form of rhythmic series. The area is
characterized by numerous minor faults. In the limestone blocks, occurring within the lower
portion of the limestone strata, silicified and brecciated parts are observed. Sedimentological
study of the thin sections showed that the rock is mainly unconsolidated biomicrite containing
radiolaria and pelagic lamellibranch fragments. Irregular calcite veins of various thicknesses are
encountered in this formation.
Çandır formation.
The Çandır formation covers an area of about 27 km2. Going from the west, exposures of this
formation are also observed at the northern and western flanks of Erendağ, in the vicinity of
Çandır Mahallesi, between Çınarcık and Armutçuk, north of Menekişler, east and west of Girevit
Dağ, in Gedeller Mahallesi, north of Sivridağ, west of Tahtacı and Körler Mahallesi, and on the
coastline west of Dinek Çeşme.

ENVIRONMENTAL IMPACT ASSESSMENT REPORT FOR ANTALYA-TURKEY POWER PLANT 23
Çandır formation overlies conformably the Permian limestones and is overlain, in turn, by a
radiolarite-bearing chert formation. No fossils were found in the Çandır formation; it contains
numerous sills of extrusive submarine lavas. Although plant remains were encountered in some
of the layers they could not be determined.
The formation is generally thick-bedded and grades into sandy limestone beds. In some
localities, this formation alternates with radiolarite beds, while in the upper parts it gradually
alternates with platy limestone beds. It occurs in the lower part of the thick Triassic rhythmic
series, and its thickness varies between 300-600 meters. In the middle part of the formation
alternations of marls and limestones are observed.
Çandır formation, which generally occurs on the flanks of the hills, consists of sandstone, sandy
limestones and marls. Sandstone, which is dominant, occurs in the form of beds attaining some
100 cm in thickness. However it is thin-bedded when occurring in alternation with green-colored
marls and silicified layers. The beds are generally yellowish, brown or sometimes gray-colored.
The sandstone layers, which overlie the Permian limestones and dolomites west of Dinek
Çeşme along the coastline, are hard,-yellowish in color, and contain plant remnants; ripple
marks are also observed. Sandstone layers are conformable with the Permian dolomites and are
overlain by Cretaceous limestones.
Sandstones observed south of Gedeller Mahallesi are also found in the valley between Sivridağ
and Karıncalı Dağ, but contact with the Permian layers is not normally observed due to thrusting.
Further to the west, in the Sivridağ area, they are thrust over the Upper Cretaceous limestones.
The boundary between the two formations is faulted.
In the lower levels of the Çandır formation, radiolarite and limestone layers, as well as
crystallized limestone blocks, 20-30 meters in length, are observed in places; these do not show
continuity and grade horizontally into the sandstones.
Tesbihli formation
This formation occupies an area of approximately 8 km2. It is encountered in many places in
various levels of the Triassic rhythmic series, but its greatest thickness occurs in the middle part

ENVIRONMENTAL IMPACT ASSESSMENT REPORT FOR ANTALYA-TURKEY POWER PLANT 24
of the Triassic. Exposures of this formation are observed in the following localities: On both sides
of Sinan Değirmeni located north of the area; in the area between Erendağ and Karadağ; in the
Çukurardıç locality; south of Çalbalı Dere; in the area between Akadamlar Korler Mahallesi and
Sekli Tepe; to the south of the studied area, between Çınarcık-Filler Mahallesi, and between
Akçaisa-Armutluk; between Palaz Mevki -Şalbalı Dağ (in thin bands); east and west of Girevit
Dağ; and south of Gökdere. In these areas the formation grades vertically or laterally into
sandstones and limestones. The formation is mainly red-colored; in places, green, gray or black
color can also be observed.
The Tesbihli formation concordantly and gradually passes into the Çandır and Gökdere
formations in the lower and upper parts, respectively. Its lithology is represented by cherts,
radiolarites, radiolarite-bearing cherts, green and brown-colored, thin bedded marls and clays,
pink-colored and thin-bedded limestone, as well as grayish marly limestones.
The thickness of radiolarites varies between 40 to 60 meters. Total thickness of the formation
including other rocks encountered in the area amounts to approximately 200 meters. However,
thickness of the formation shows some local changes. Abundant Daonella and Halobia are
found in various parts of the area under investigation. Particularly rich in fossils are the following
localities: Deveboynu -Çınarcık Mahallesi, Palamut Gediği and southern part of Tesbihli Tepe.
Fossils collected from the strongly folded and fractured red radiolarites, located south of Tesbihli
Tepe, were identified by Mrs. Suzanne Freneix from the Paleontological Institute of France, who
attributed this formation to Ladinian, based on the presence in these beds of Daonella indica
Bittner.
The Tesbihli formation within the Triassic rhythmic series is tectonically the most affected
formation in the area; in places it is fractured, folded and strongly deformed. The formation is not
represented by continuous beds but is in the form of lenses, which attain sometimes 1 to 3 km in
length. The general strike is in the NE-SW direction. Within this formation bituminous horizons
and manganese ore beds are encountered.

ENVIRONMENTAL IMPACT ASSESSMENT REPORT FOR ANTALYA-TURKEY POWER PLANT 25
4.1.2. Soil Characteristics
Extensive soil classes have been formed in Antalya with the effects of the topography, climate,
main materials, land cover and time. In addition, some land types devoid of soil cover and profile
improvements are also observed.
The largest area of the Antalya basin is covered by red Mediterranean soil. It covers a land of
574332 ha in Antalya. It is common in especially north and central part of the basin and it
extends to the north of Lake Egridir in the south. It is observed in northern direction beyond this
point. It is mostly seen in combination with Red-Brown Mediterranean soil which is common in
mid basin areas. These soils are in certain parts cut through with alluvial and colluvial soil.
The second prevailing soil type is Antalya basin is the Brown-Forest large soil type. It covers a
land of 326.246 ha. It extends through the basin from one end to other, starting from Alanya in
the south east of the basin, to northwest between Mediterranean land and Rendzinas. In
addition, it is observed in combination with chestnut color land in the west and north (Lake
Egridir) of the basin.
4.1.3. Climatology Ambient Temperature As the project site falls within the borders of Antalya city, meteorological data of Antalya city
obtained from the State Meteorological Institute of years 1996-2005 were considered in this
study. Monthly average ambient air temperatures recorded in Antalya are given in Table 4.
Precipitation Annual average precipitation in Antalya was measures as 1286.4mm, where the maximum daily
rainfall was measured as 227.6 mm in December (Table 5).

ENVIRONMENTAL IMPACT ASSESSMENT REPORT FOR ANTALYA-TURKEY POWER PLANT 26
Table 4. Monthly Temperature Variations in Antalya
Months Average Temperature (oC)
Max Average Temperature (oC)
Min Average Temperature (oC)
January 10.1 15.2 6.3 February 10.6 15.9 6.4 March 12.7 18.2 8.0 April 15.9 21.2 11.2 May 21.3 26.9 16.0 June 26.2 32.2 20.4 July 29.2 35.1 23.8 August 28.5 34.5 23.4 September 24.8 31.2 19.7 October 20.3 27.0 15.6 November 15.3 21.8 11.1 December 11.6 16.7 8.0 Annual 18.9 24.7 14.2
Measured Station: Antalya, Altitude: 51 m, Latitude: 36o53’, Longitude: 30o42’
Table 5. Precipitation in Antalya
Months Average Total Precipitation (mm)
Max Daily Precipitation (mm)
Average Number of Snowy Days
January 249.1 164.1 0.1 February 115.9 111.9 0.2 March 106.5 161.1 0.1 April 105.1 142.4 May 42.1 73.0 June 6.1 12.3 July 5.6 32.5 August 4.3 27.8 September 15.9 52.2 October 57.5 102.3 November 205.2 179.1 December 373.1 227.6 Annual 1286.4 227.6 0.4
Measured Station: Antalya, Altitude: 51 m, Latitude: 36o53’, Longitude: 30o42’

ENVIRONMENTAL IMPACT ASSESSMENT REPORT FOR ANTALYA-TURKEY POWER PLANT 27
Cloudiness The annual average number of cloudless days in Antalya was 158.7, whereas the average
number of cloudy days was recorded as 26.3 (Table 6).
Humidity
Annual average relative humidity in Antalya is 61 % and the minimum relative humidity is 3 %
(Table 7).
Wind The annual average wind speed in Antalya is 2.7 m/s. The maximum wind speed is 43.2m/s in
the SSE direction. The prevailing wind direction is NNW with an average wind speed of 3.5m/s
and a frequency of 2311 blows (Table 8). The wind rose for Antalya according to blow
frequencies and average wind directions are given in Figure 5 and Figure 6, respectively.
Table 6. Average Number of Clear, Cloudy and Closed-out Days in Antalya
Months Average Number of Clear Days (0.0 – 1.9)
Average Number of Cloudy Days
(2.0 – 8.0)
Average Number of Closed-out Days
(8.1 – 10.0) January 8.7 4.5 5.9 February 8.1 4.3 3.6 March 8.3 4.2 3.9
April 7.4 4.3 2.5 May 9.5 3.2 0.9 June 19.6 1.6 July 23.0 1.2 August 21.4 1.3 September 18.8 1.7 0.1 October 15.4 2.6 1.0 November 10.9 3.6 2.6 December 7.6 4.8 5.8 Annual 158.7 3.1 26.3 Measured Station: Antalya, Altitude: 51 m, Latitude: 36o53’, Longitude: 30o42’

ENVIRONMENTAL IMPACT ASSESSMENT REPORT FOR ANTALYA-TURKEY POWER PLANT 28
Table 7. Monthly Relative Humidity in Antalya
Months Min. Relative Humidity (%) Avr.Relative Humidity (%) January 7 63 February 8 60 March 4 62 April 6 67 May 6 64 June 7 57 July 6 57 August 3 60 September 5 59 October 3 59 November 4 63 December 11 66 Annual 3 61
Measured Station: Antalya, Altitude: 51 m, Latitude: 36o53’, Longitude: 30o42’
Table 8. Wind conditions in Antalya
Months Average Wind Speed
(m/s)
Maximum Wind Average Number of
Stormy Days
Average Number of Strong Wind Days
Direction Speed (m/s) January 3.1 SSE 43.2 2.9 6.2
February 3.3 SSE 30.8 2.6 7.1
March 3.1 S 27.8 1.7 7.7
April 2.6 NNW 24.5 0.9 6.0
May 2.3 N 16.1 3.8
June 2.7 N 17.0 4.4
July 2.5 N 19.1 0.4 6.1
August 2.4 WNW 21.8 0.4 2.9
September 2.5 NNW 19.5 0.3 3.4
October 2.5 N 21.3 0.6 2.8
November 2.4 S 25.0 1.4 3.6
December 2.7 SE 4.8 2.3 5.8
Annual 2.7 SSE 43.2 13.5 59.8

ENVIRONMENTAL IMPACT ASSESSMENT REPORT FOR ANTALYA-TURKEY POWER PLANT 29
Figure 5. Wind Rose of Antalya according to the Blow Frequencies
Figure 6. Wind Rose of Antalya according to Average Wind Speeds 4.1.4. Topography An average of 77,2 % of Antalya’s land is mountainous, 10,2 % is plateau and 12 % is
undulating land. The Taurus Mountains which cover ¾ of the city, are higher than 2500 – 3000
m at several points. There are wide plateaus and basins in the western Teke region. The
majority of these mountains and plateaus are formed from limestone. There are many caves,
water springs and such structures in the regions formed from the melting of limestone structures.
The topographic variety of the region creates different environments in terms of climate,
agriculture, demography and residency.
The different areas can be distinguished as coastal and upland. The average elevation of the
coastal sites range between 5-44 m, where as the elevation in upland regions range between
900-1000m.

ENVIRONMENTAL IMPACT ASSESSMENT REPORT FOR ANTALYA-TURKEY POWER PLANT 30
Major water bodies
Rivers and Streams
Rivers and streams in Antalya collect water from the southern slopes of the Taurus Mountains
and they are basically observed like creeks. They have irregular regimes and dry-out towards
the end of hot and dry summer months.
The major streams can be listed as:
Manavgat Creek: Originating from the mountains on the east of Gembos basin, the Manavgat
Creek flows down to Manavgat falls. It has a very regular flowing regime. It is one of the streams
with largest capacity in the South Anatolian region, other than the Seyhan and Ceyhan rivers. It
has a greenish color.
Aksu Creek: It enters Antalya from the Isparta border. The velocity of stream is very fast along
the Antalya basin following a rather narrow path. It is supplemented from an area of 3000 km2.
The stream loses its strength after entering the basin. It is highly susceptible to the changes in
the precipitation. It sometimes causes flooding on the both sides of the stream. It is used for
transport of woods.
Kopru Creek: It enters Antalya from the Isparta border. The elevations in water level are more
regular than Aksu creek. It becomes a river between November and May, carrying water at 100
m3/s and higher speeds. It generally has clear water.
Duden Creek: It originates 30 km away from the north of Antalya, flows through the underground
and surface on its way and finally falls to sea. The flow regime is regular supplemented by the
underground waters. The water level does not show much variance between summer and winter
months.
Dim Creek: It passes through the Antalya basin. It carries a large amount of water supplemented
by springs.

ENVIRONMENTAL IMPACT ASSESSMENT REPORT FOR ANTALYA-TURKEY POWER PLANT 31
Kargı Creek: It originates from the Akdağ Mountain. It is formed from the combination of Derince
and Tasatan creeks. It has a strong flow but it almost dries out in summer months.
Alara Creek: It is supplemented from an area of 1000 km2. It carries large amount of water. The
flow rate of water does not go below 20 m3/s between December and June. It passes through
narrow passages until it flows near the flat plains near the sea.
Karpuz Creek: It forms from the combination of the Cengel Creek from the east and the
Ahmetler Creek from the north. It has a strong flow during winter but very dry in summer moths
hardly reaching to the sea.
Alağır Creek: It is formed from a few strong springs. It carries a large amount of water although it
is short. It has a weaker flow during summer unlike winter.
Boğa Creek: This creek flows from the slopes of Bey Mountains where the Antalya basin starts.
Turgut ve Cumalı creeks also flow into Boğa creek. It flows to the sea.
Buyuk Arapsuyu: It originates from the flat plains a few km away from the Boğa Creek and flows
to the sea after running for 2 km.
Kucuk Arapsuyu: It originates 2 km away from the east of Buyuk Arapsuyu and flows to the sea
after running for 1 km.
Lakes, Artificial Lakes, Reservoirs and Dams
There are no lakes of significant volume in Antalya.
Lake Soğut: It is in a cavity surrounded by the mountains on the Antalya-Burdur border at an
altitude of 1 345 m. The length of the lake is approximately 13 km extending in the east-west
direction, and 5 km in the south-north direction. It is supplemented basically by Karasu, Bozcay,
Kocapınar ve Cığlık Creeks. The surface area of the lake is 40 km2. It dries significantly in
summer months. It is covered with marshes and island of reeds. It freezes in winter months.
ENVIRONMENTAL IMPACT ASSESSMENT REPORT FOR ANTALYA-TURKEY POWER PLANT 32
Karagol Reed: It is located a few km away from the Elmali district. The surface area of the lake is
10 km2. It is indeed looks like a large swamp and reed. It is supplemented by Koca Creek and
Cengel Spring. There are islands of reeds.
Lake Avlan: It is located in the south of Elmali district. The surface area of the lake is 10 km2. It
is supplemented by Koca Akcay river.
There are also the Oymapınar, Alakır ve Korkuteli dam lakes in Antalya.
Oymapınar Dam: It is constructed on the Manavgat Creek and it is in operation since 1980. The
dept is 185 m and the surface area of the lake is 470 ha. The storage volume is 300 million m3. It
produces 102 Million kW of electrical power per year.
Alakır Dam: It is constructed on the Alakır Creek and it is in operation since 1973. The dept is
185 m and the surface area of the lake is 49,3 ha. The storage volume is 80 million m3. It
protects an area of 1940 ha from flooding.
Korkuteli Dam: It is constructed on the Korkuteli stream and it is in operation since 1976. The
dept is 70,2 m and the surface area of the lake is 670 ha. The storage volume is 4,5 million m3. It
is used for the irrigation of an area of 5986 ha.
The springs of Antalya are listed below:
Demre Spring: It is in 5 km south of Demre. There are two springs on either side of the valley in
Cayagazi area. Their hydrous are close to each other. The one on the East slope is named
Burguc water and known as the spring by the locals. The other spring comes to surface from
three points on a plain surrounded by concrete walls. Temperature of the water is 15˚C. It is a
slightly sulfurous spring water.
Korkuteli Spring: It is at a 9 km distance from Korkuteli. It comes to surface from a number of
points. It has a brackish nature and hard to drink. Temperature of the water is 18˚C.

ENVIRONMENTAL IMPACT ASSESSMENT REPORT FOR ANTALYA-TURKEY POWER PLANT 33
Sarisu Spring: It comes to surface at a slope a few km away from Ilıcakoy. The water is rich in
carbon dioxide with a temperature of 16,5 ˚C.
Sınat Creek Thermal Waters: It is in Ilıca village in the Gazipasa district. It is an open pool
surrounded by rocks. The pool is filled up with the stones brought by floods in winter. It is
cleared in summer and allowed for usage. Temperature of the water is 24,5 ˚C.
Surface and Groundwaters
The major factor in the formation of groundwater in Antalya is the geological formation. There is
Mediterranean Sea in the South, Beydağları of Taurus Mountains in the West, Aksu Valley in the
East, and Taurus Mountains in the North. The groundwater formations are comprised of
limestone and travertine formations.
Kırkgoz Springs Arapsuyu I
Gurkavak Spring Arapsuyu II
Mağara Spring Boğacayı Keson Wells
Duraliler Spring Duden Selalesi Wells
Iskele Spring (Mescit Alanı) Meydan Wells
Hurma Springs Water Usage
The drinking water supply of Antalya is supplied from groundwater resources. The water supply
system consists of 45 deep wells, 9 pumping stations, 13 storage tanks and a transmission line
of 2 km and the water distribution system.
4.1.5. Ambient Air Quality All data relevant to assessment of existing ambient air quality have been gathered as shown in
Table 9 and Table 10. These data is based on the basic environmental parameters of concern,
which are SO2 and PM10 concentrations (Table 10).

ENVIRONMENTAL IMPACT ASSESSMENT REPORT FOR ANTALYA-TURKEY POWER PLANT 34
Table 9. Air Pollution Monitoring Data of Antalya (Ministry of Environment and Forestry) Date
PM10 (µg/m3)
Wind speed (m/s)
Wind Direction
Deg
Am. Temp (°C)
Rel. Hum (%)
Atm. Pres. (mbars)
SO2 (µg/m3)
2.9.2007 4 197 34 45 1027 0
3.9.2007 4 222 32 58 1027 0
4.9.2007 5 235 31 69 1029 0
5.9.2007 5 203 30 81 1030 3
6.9.2007 4 199 29 75 1028 2
7.9.2007 4 171 29 65 1029 2
8.9.2007 75 5 192 31 49 1028 0
9.9.2007 49 5 167 29 58 1026 0
10.9.2007 47 5 232 27 66 1029 0
11.9.2007 56 5 172 27 48 1034 0
12.9.2007 71 5 198 27 56 1034 0
13.9.2007 68 4 172 26 63 1031 0
14.9.2007 84 4 204 26 65 1030 0
15.9.2007 68 5 178 29 35 1033 0
16.9.2007 54 5 188 28 45 1033 0
17.9.2007 65 4 169 27 60 1031 0
18.9.2007 60 4 196 29 35 1032 0
19.9.2007 80 4 194 28 41 1032 0
20.9.2007 97 4 196 27 52 1030 1
21.9.2007 80 4 157 26 69 1032 0
22.9.2007 78 4 161 26 75 1033 0
23.9.2007 80 4 176 26 70 1033 0
24.9.2007 64 4 186 26 71 1032 0
25.9.2007 49 5 169 28 51 1032 0
26.9.2007 80 5 167 28 45 1036 0
27.9.2007 76 5 157 27 62 1039 0
28.9.2007 89 4 162 25 62 1033 0
29.9.2007 113 4 149 27 52 1032 1
30.9.2007 95 4 153 31 36 1031 3
1.10.2007 64 5 184 30 47 1033

ENVIRONMENTAL IMPACT ASSESSMENT REPORT FOR ANTALYA-TURKEY POWER PLANT 35
Table 10. Environmental Situation Report for Antalya- SO2 and PM Measurements (1995-2004)
AVERAGE MINIMUM MAXIMUM MONTHS # of STATIONS
# of DAYS RECORDED SO2 PM SO2 PM SO2 PM
JANUARY’01 4 31 73 98 57 79 85 119 FEBRUARY’01 4 28 72 97 62 85 87 125 MARCH’01 4 31 64 85 55 79 72 112 APRIL’01 4 30 57 74 37 45 70 91 MAY’01 4 31 35 45 22 34 43 58 JUNE’01 4 30 27 37 20 29 33 48 JULY’01 4 31 23 34 17 28 30 47 AUGUST’01 4 31 23 35 19 29 28 41 SEPTEMBER’01 4 30 23 36 19 30 28 42 OCTOBER’01 4 31 27 41 21 34 34 56 NOVEMBER’01 4 30 44 64 35 54 57 80 DECEMBER’01 4 31 70 92 36 79 88 132 JANUARY’02 4 31 71 98 61 85 82 116 FEBRUARY’02 4 28 70 96 63 87 86 111 MARCH’02 4 31 62 84 56 73 73 99 APRIL’02 4 30 54 78 41 50 74 98 MAY’02 4 31 34 44 26 56 45 56 JUNE’02 4 30 26 37 22 32 33 45 JULY’02 4 31 23 36 19 29 28 41 AUGUST’02 4 31 23 35 20 31 28 40 SEPTEMBER’02 4 30 24 37 20 31 28 42 OCTOBER’02 4 31 25 39 20 32 34 53 NOVEMBER’02 4 30 38 57 31 46 51 73 DECEMBER’02 4 31 71 96 54 76 86 127 JANUARY’03 4 31 69 93 83 81 99 109 FEBRUARY’03 4 28 63 84 54 74 72 95 MARCH’03 4 31 52 72 41 61 67 92 APRIL’03 4 30 43 60 34 45 51 70 MAY’03 4 31 29 39 21 30 38 49 JUNE’03 4 30 24 34 18 27 30 42 JULY’03 4 31 25 36 19 29 30 41 AUGUST’03 4 31 23 34 18 27 27 39 SEPTEMBER’03 4 30 24 35 19 30 28 42 OCTOBER’03 4 31 26 38 20 30 36 54 NOVEMBER’03 4 30 37 56 30 46 49 72 DECEMBER’03 4 31 62 85 48 70 72 97 JANUARY’04 4 31 58 79 48 69 68 90 FEBRUARY’04 4 29 63 84 52 71 75 98 MARCH’04 4 31 58 77 49 66 66 88 APRIL’04 4 30 40 52 30 40 50 66 MAY’04 4 31 28 37 21 30 37 48 JUNE’04 4 30 24 32 19 25 30 40 JULY’04 4 31 22 26 17 20 27 34 AUGUST’04 4 31 22 27 18 21 26 33 SEPTEMBER’04 4 30 23 28 16 22 27 35 OCTOBER’04 4 31 26 38 21 28 31 45 NOVEMBER’04 4 30 - - - - - - DECEMBER’04 4 31 - - - - - -

ENVIRONMENTAL IMPACT ASSESSMENT REPORT FOR ANTALYA-TURKEY POWER PLANT 36
4.1.6. Noise The area proposed for the construction of the power plant close to the Antalya Organized
Industrial district. The closest residential area is 3 km away from the plant site.
Currently, the national noise standards of 70 dBA for day and 60 dBA for night conditions given
for commercial/residential areas are not exceeded.
4.1.7. Flora and Fauna Flora According to the grid system made by Davis (flora of Turkey and the East Aegen Islands), the
project land is located in C-3 square in the South Anatolia and it is under the influence of
Mediterranean Phytogeographic Region.
The identification of the flora of the project site and its surroundings was made mainly based on
the observations at the site (Project Description Report, 2007). The flora lists were prepared
based on site observations along with considering the 10 Volumes of the reference namely, the
‘Flora Of Turkey And The East Aegean Island’. The flora lists are given in Table 11.
Fauna The identification of the fauna of the project site and its surroundings was made mainly based on
the observations at the site (Project Description Report, 2007). Data have been gathered from
the local people as well. The fauna lists were formed based on the data which was supported by
literature reviews.
The fauna lists were prepared in a format including the species of Amphibians, Reptiles, Birds
and Mammals and considering the national and international conventions in act (Bern
Convention and decisions of the Central Hunting commission). The fauna lists are given in Table
12.
There are no endangered fauna identified in the proposed project site. The project impact area
does not constitute a special living and breeding habitat for the fauna species.

ENVIRONMENTAL IMPACT ASSESSMENT REPORT FOR ANTALYA-TURKEY POWER PLANT 37
Table 11. List of Flora in the Area
FAMILY SPECIE Turkish
Name Local Name
Phytogeograph. region
Locality BERN Conv.
Meth. of Ident.
HABITAT Cover/ Abundance
(Braun-Balanquet Method)
END.
1 2 3 4 5 6 7 8 1 2 3 4 5 L B Y
RANUNCULACEAE Delphinium staphisagria Mevzek otu Kokar ot Mediterranean 0-250 m X X X
PAPAVERACEAE Fumaria parviflora Şahtere otu Mediterranean 0-900 m X X
PAPAVERACEAE Roemeria hybrida Cin haşhaşı 0-1300 m L X X
PAPAVERACEAE Papaver gracile Gelincik Mediterranean 0-1300 m X X X
CRUCIFERAE Cardaria draba ssp draba Kedi otu Europa-Siberia 0-1300 m
CRUCIFERAE Erophilla verna sp vera Çırçır otu 0-2300 m L X X
CRUCIFERAE Rapistrum rugosum 0-1000 m L X X
CISTACEAE Cistus creticus Pamuk otu Karağı Mediterranean 0-1000 m L X X X
CARYOPHYLLACEAE Silene vulgaris var vulgaris
Gıvışgan otu Europa-Siberia 0-3000 m X X X
POLYGONACEAE rumex pulcher Labada Europa-Siberia 0-1300 m X X CHENOPODIACEAE Atriplex lasiantha Sakız Europa-Siberia 0-1800 m X x X ANACARDİACEAE Pistacia lenticus Zivircik Mediterranean 0-200 m X X LEGÜMİNOSAE Anagyris foetida Mediterranean 0-1000 m X x X LEGÜMİNOSAE Calicotome vilosa Mediterranean 0-900 m X X X
LEGÜMİNOSAE Dorycnium hirsutum Mediterranean 0-900 m X X X X
LEGÜMİNOSAE Lens ervoides Mediterranean 20-610 m X x X LEGÜMİNOSAE Medicago rigidula Europa-Siberia 0-1800 m X X X IRIDACEAE Gladiolus illyricus Mediterranean 0-1200 m L X X X X X

ENVIRONMENTAL IMPACT ASSESSMENT REPORT FOR ANTALYA-TURKEY POWER PLANT 38
DIOSCOREACEAE Tamus communis ssp communis Sarmaşık Karaasma 20-1600
m L X X X
GRAMINEAE Aegilops triuncialis ssp triuncialis
Europa-Siberia 0-1900 m L X X X X
GRAMINEAE Briza maxima Europa-Siberia 0-320 m L X X X X X
GRAMINEAE Bromus japonicus ssp japonicus Europa-Siberia 0-2300 m L X X X X
GRAMINEAE Hordeum bulbosum Europa-Siberia 0-2250 m L X X X
GRAMINEAE Poa trivialis Europa-Siberia 0-2210 m L X X X X
HABITAT CLASSES 1. Forest 2. Maquis 3. Frigana 4. Cultural land (Garden, etc.) 5. Pasture 6. Humid grass, Swamp and Wetland 7. Steppe 8. Rocky place Locality : Full address of the plant and height
DANGER CLASS EX: Extinct Endemic species Ex: Extinct in nature CR: Critic Endemic Species EN: Non-Endemic species under danger VU: Vulnerable species LR: Plants under Low Risk cd: Species that require protection nt: Species that may be under danger lc: Least considered for danger DD: It is more important to gather information about the plant than considerations for being under danger NE: Not evaluated
COVER/ABUNDANCY CLASS 1. Very rare 2. Rare 3. Middle Degree Abundance 4. Abundant 5. Very Abundant or forms pure populations
END./ENDEMISM L: Local endemic B: Regional Endemic Y: widespread Endemic
METHODOLOGY OF IDENTIFICATION * : Site study L : Literature Screening *L: literature Screening and Site study

ENVIRONMENTAL IMPACT ASSESSMENT REPORT FOR ANTALYA-TURKEY POWER PLANT 39
Table 12. List of Fauna in the Area List of Bird Species
Name in Latin English Name Turkish Name PDi PDo EVRDB IUCN END BERN Convention
AVL (2006-2007)
Reference
ORDER: FALCONIFORMES Doğanlar FAM: FALCONIDAE Doğangiller Sp : Falco tinnunculus Kestel Kerkenez - - A-4 V - Annex- II Sp: Falco biarmicus Bıyıklıdoğan ORDER: GALLIFORMES Tavuklar FAM: PHASIANIDAE Tavuksular Sp: Coturnix coturnix Quail Bıldırcın - - A-4 V - - List -III O ORDER : COLUMBIFORMES Güvercinler FAM : PTEROCLIDAE Steptavukları Sp : Pterocles orientalis Black-Bailled
Sandgrouse Bağırtlak A-3 E Annex-II List-II L
FAM : COLUMBIDAE Güvercinler Sp : Columba livia Domestis Pigeon Kaya güvercini A-4 List-III Q Sp : Streptopelia decaocto Collarede Dove Kumru A-4 List-II Q ORDER : STRIGIFORMES Gece Yırtıcıları FAM : STRIGID Baykuşgiller Sp : Athena noctua Little Owl Kukumav A-4 E,V Annex-II List-I L Sp : Otus scops Scops Owl Cüce Baykuş A-3 E,V Annex -II List-I L Sp : Strix aluco Tawny Owl Alaca Baykuş A-3 E Annex -I List-I L FAM : TYTONIDAE Peçeli , Baykuşgiller Sp : Tyto alba Barn Owl Peçeli Baykuş A-2 E Annex -I List-I L AVES BIRDS Ötücü kuşlar ORDER : PASSERIFORMES Tarlakuşugiller FAM : ALAUDIDAE Kulaklı tarlakuşu Sp : Eremophila alpestris Shore Lark Ardıçkuşugiller A-4 E,V Annex -II List-I L FAM : TURDIDAE Taş kuşu Sp : Saxicola torquata Stonechat Kargagiller O Annex -II List-I L FAM : CORVIDAE Saksağan Sp : Pica pica Magpie Küçük karga O List-III L Sp: Corvus monedula Jackdaw O List-III L Sp :Corvus corone cornix Hooded Leş Kargası O List-III L FAM : STURNIDAE Sığırcıkgiller Sp : Sturnus vulgaris Starling Sığırcık O List-II O FAM : PASSERIDAE Serçegiller Sp : Passer domesticus House Sparrow Ev serçesi O List-III L PDi: Population Density in and around the project site PDo: Population Devsity outside the Project site EVRDB: European Vertabrate Red Data Book IUCN: The World Conservation Unit AVL (2006-2007): Central Hunting Comission Decision END: Endeimic References: Q: Questionnaire (Data from local people); O: Observation; H: Suitability of Habitat; L: Literature
Table 12. List of Fauna in the Area (cont.)

ENVIRONMENTAL IMPACT ASSESSMENT REPORT FOR ANTALYA-TURKEY POWER PLANT 40
List of Reptiles, Mamals Latin Name Turkish Name ERL END IUCN BERN
Convention AVL (2006-2007)
Reference HABITAT Observation Station
MAMMALIA MEMELILER ORDER : INSECTIVORA Böçekçiller FAM : SORICIDAE Sivrifareler GENERA : Neomys Sp : Neomys anomalus Bataklık
siviifaresi Nt - Nt Annex -III Swamp, humid grass
FAM : TALPIDAE Köstebekler GENERA : Talpa Sp : Talpa levantis levantis Körköstebek Nt Nt L Prefer sandy, loose,
humid soil
ORDER : CHIROPTERA Yarasalar SUB-ORDER : MICROCHIROPTERA
Böcekçil yarasalar
FAM : VESPERTILIONIDAE Düzburun yarasa
GENERA : Myotis Sp : Myotis capaccinii Uzunayaklı
yarasa V V Annex -II List-I Caves and dikes
GENERA : Pipistrellus Sp : Pipistrellus pipistrellus
Cüce yarasa V V Annex -III L Forests, close to residential areas
REPTILIA Sürüngenler ORDER : SQUAMATA Kertenkeleler SUB-ORDER : LACERTILIA Kertenkeleler FAM : SCINCIDAE Parlak
Kertenkeleler
GENERA : Mabuya Sp : Mabuya vittata Şeritli
Kertenkele Nt Nt Annex -III List-I L Open lands, woods,
under rocks
REPTILIA
Kertenkeleler
ORDER : SQUAMATA Kertenkeleler SUB- ORDER : LACERTILIA Asıl
Kertenkeleler
FAM : LACERTIDAE GENERA : Lacerta Toros
kertenkelesi
Sp : Lacerta danfordi Nt Nt Annex -III List-I Forests, woods,

ENVIRONMENTAL IMPACT ASSESSMENT REPORT FOR ANTALYA-TURKEY POWER PLANT 41
pelesgiana rocky lands, walls SUB- ORDER : OPHIDIA Yılanlar
Yılanlar
FAM : COLUBRIDAE GENERA : Elaphe
Sp : Elaphe quartuorlineta sauromates
Sarı yılan Nt Nt Annex -II List-I L Stoney lands, gardens, crop fields
GENERA : Coluber Sp : Coluber najadum Ok yılanı Nt Nt Annex -II List-I L Hot places, rocky,
woods, dry biota
GENERA : Natrix Sp : Natrix natrix persa Küpeli su
yılanı Nt Nt List-I L Rocky places and
woods near water
AMPHIBIA Amfibiler ORDER : ANURA Kuyruksuz
kurbalar
SUB-ORDER : PROCOELA FAM : BUFONIDAE Kara kurbaları GENERA : Bufo Sp : Bufo bufo Siğili kurbalar Nt Nt Annex -III A On land, under rocks,
in soil
Observation station : The Points and Areas where the species are identified in site studies in and around the Project site HABITAT : Specific characteristics of the living area of identified species ERL : European Red List PDi: Population Density in and around the project site PDo: Population Devsity outside the Project site EVRDB: European Vertabrate Red Data Book IUCN: The World Conservation Unit AVL (2006-2007): Central Hunting Comission Decision END: Endeimic References: Q: Questionnaire (Data from local people); O: Observation; H: Suitability of Habitat; L: Literature
ENVIRONMENTAL IMPACT ASSESSMENT REPORT FOR ANTALYA-TURKEY POWER PLANT 42
4.1.8. Archaeological and Cultural Resources There are no archeological sites or recreational areas in or near the project site. 4.1.9. Land Use The power plant is planned to be constructed in the Antalya city, Merkez District. The intended
project area is neighboring the Antalya Organized Industrial District. The map showing the site of
1/25000 scale is given in Figure 1.
The proposed project site is agricultural land according to the Land Registry. The scanned
copies of land registry documents are given in Annex 1.
4.1.10. Sensitive Zones The project site and its surroundings, upon investigation also considering the Annex-V (List of
Sensitive Zones) of the EIA Regulation, is not classified as ‘Protection Zones as required by
national regulation’ according to the Article 1 of the list, not classified as ‘Protection Zones as
required by the conventions ratified by Turkey’ according to the Article 2 of the list, and not
classified as ‘Protection Zones’ according to the Article 3 of the list.
4.2. Biological Environment 4.2.1. Wetlands There are no wetlands in or around the project area. 4.2.2. Vegetation The project site neighbors the Antalya Organized district on one side. The land located in the
north and west part of the plant consists of short plantation.
The remaining side is devoid of any vegetation of conservation concern.
The project land is unimproved agricultural land.

ENVIRONMENTAL IMPACT ASSESSMENT REPORT FOR ANTALYA-TURKEY POWER PLANT 43
4.2.3. Wildlife The land proposed for the project is highly modified by human activities that there is no wildlife of
major conservation concern in the area.
4.2.4. Social Environment The selected location for the plant is near the Antalya Organized Industrial District, and there are
no residential areas in the 3 km radius of the plant.
Demography According to the 2000 census the population of Antalya is 1726205 of which 933847 live in
urban region and 792358 live in rural sites. Population data is shown in Table 13 The population
has grown by approximately 44 % in the last decade and it is anticipated that it will be growing at
a similar rate in the future due to several facts. The major motive of population growth is the
migration to the city as a result of developing tourism sector, which is already the main income
source of the city.
Table 13. Urban and Rural Population Development in Antalya
Total Urban Rural 1990 2000 % + 1990 2000 % + 1990 2000 % + Centre 448 773 714 129 46,44 378 208 603 190 46,67 70 565 110 939 45,23 Akseki 36 137 42 467 16,14 11 023 10 563 -4,26 25 114 31 904 23,92 Alanya 129 396 257 671 68,86 52 460 88 346 52,11 76 936 169 325 78,86 Elmalı 35 324 40 041 12,53 12 384 14 561 16,19 22 940 25 480 10,50 Finike 34 576 42 087 19,65 6 700 9 746 37,46 27 876 32 341 14,85 Gazipaşa 40 840 44 541 8,67 13 697 16 536 18,83 27 143 28 005 3,13 Gündoğmuş 20 119 21 513 6,70 4 554 5 021 9,76 15 565 16 492 5,78 İbradi 8 052 10 826 29,59 4 215 6 991 50,58 3 837 3 835 -0,05 Kale 20 880 22 170 5,99 13 793 13 900 0,77 7 087 8 270 15,43 Kaş 40 245 47 519 16,61 4 560 6 361 33,28 35 685 41 158 14,26 Kemer 23 268 55 092 86,17 8 449 17 255 71,39 14 819 37 837 93,71 Korkuteli 46 115 51 580 11,20 13 381 16 521 21,07 32 734 35 059 6,86 Kumluca 44 834 61 370 31,39 17 166 25 081 37,91 27 668 36 289 27,12 Manavgat 118 897 199 385 51,68 38 498 71 679 62,14 80 399 127 706 46,26 Serik 84 755 109 360 25,48 23 106 30 579 28,01 61 649 78 781 24,51 Total 1 132 211 1 719 751 41,79 602 194 936 330 44,13 530 017 783 421 39,07

ENVIRONMENTAL IMPACT ASSESSMENT REPORT FOR ANTALYA-TURKEY POWER PLANT 44
5. POTENTIAL ENVIRONMENTAL IMPACTS 5.1. Construction Phase 5.1.1. Physical and Chemical
This section of the report describes the potential environmental impacts, both negative and
positive, that are likely to result from the construction and operation of the thermal-power plant in
Antalya. The possible mitigation measures identified for the significant negative impacts are
presented in the next section of this report.
Physical and chemical impacts of power plant construction may include those on geology, soils,
topography, landforms, and meteorology, climate, air and water quality, and noise. Potential
environmental impacts on each are presented as the following:
5.1.1.1. Geology and Soils There will be no significant soil disturbances and no significant impacts on local geology since
the site will not need any preparation activities such as drilling, blasting. The whole system will
be brought to site as a compact unit requiring no heavy construction at site. There will be minor
work in the construction of the site which will cause insignificant amount of excavation soil,
construction and debris waste, which will be handled according to the Regulation on excavation
soil, construction and debris waste.
5.1.1.2.Topography and Landforms Local topography will not be altered.
5.1.1.3. Climate and Meteorology Impacts on the microclimate and meteorology of the local area will be negligible. There will be no
changes in surface albedo and no aerodynamic disturbances.

ENVIRONMENTAL IMPACT ASSESSMENT REPORT FOR ANTALYA-TURKEY POWER PLANT 45
5.1.1.4. Air Quality Air quality emissions problems resulting from the construction activities will be limited to fugitive
windblown dust, internal combustion engines in heavy equipment and onsite power generators.
These impacts will be low and short-lived.
There will be no burning of vegetation and/or other refuse.
5.1.1.5. Noise Noise impacts may occur as a result of operation of heavy equipment, pile drivers, and onsite
power generation.
Estimated noise level outputs were obtained from equipment manufacturers and the impacts are
assessed to be insignificant since the national and World Bank standards will not be exceeded.
The article of national ‘Evaluation and Management of Environmental Noise Regulation’ (Date:
1.7.2005, and No: 25862) will be considered and complied.
5.1.1.6. Hydrology Groundwater Fresh water required by the personnel will be supplied from the wells to be dug at and/or around
the site with necessary permissions taken from the State Hydraulic Works as required by the
Groundwater Law (Date: 23.12.1960, No: 10688). The daily discharges from the well will not
have any adverse affect on the local hydrology.
The water demand is estimated based on the assumption of 75 l/cap/day consumption. The
number of workers together with possible visitors is estimated as 250 people. Hence the water
demand is calculated as:
250 x 75 lt/cap/day= 18 750 lt/day
ENVIRONMENTAL IMPACT ASSESSMENT REPORT FOR ANTALYA-TURKEY POWER PLANT 46
Surface Water There will be no surface water use. There will be no discharges to a receiving surface body. The
wastewater generated at the site will be treated by independent compact treatment units and the
treated wastewater will be used for irrigation.
5.1.1.7. Water Quality Water quality issues associated with power plant construction are often minor. In this particular
case, there will be no liquid or solid wastes generated from the plant which will be disposed
directly to cause any adverse affect on environment.
The amount of domestic wastewater generated by the plant’s personnel is assumed to be equal
to the estimated amount of water usage, which is approximately 20 m3/day. The wastewaters
generated at the plant will be treated with individual treatment units to give an effluent
appropriate for irrigational purposes.
Use of treated wastewater for irrigation and the possible percolation will not be a problem since
the treatment unit will ensure safe use for irrigation pursuant to the Article 28 of the Water
Pollution Control Regulation (Date: 21.12.2004, no: 25687) and the standards set out in
Technical Procedures Notification (Date: 7.1.1991, No: 20748).
Storm water will be channeled and removed through the storm drains.
5.1.1.8. Solid Waste Solid waste during the construction phase will be minimal since the system will be installed as a
whole unit. Solid wastes such as rejected components and materials, packing and shipping
materials (pallets, crates, Styrofoam®, plastics, etc.), and human garbage will be disposed
properly to sanitary landfills as required by the national Solid Waste Control Regulation (Date:
14.3.1991, No: 20814).
The amount of solid was generated by the personnel is estimated based on 1 kg/cap/day solid
waste generation assumption. Hence the generated solid waste is calculated as:
250 x 1 kg/cap/day= 250 kg/day

ENVIRONMENTAL IMPACT ASSESSMENT REPORT FOR ANTALYA-TURKEY POWER PLANT 47
5.1.2. Biological The presence of local flora and fauna were determined and evaluation of construction impacts
was made.
5.1.2.1. Flora and Fauna There are no endangered flora and fauna determined on the project site; therefore, construction
should have no adverse affects on endangered flora and fauna.
The plant patterns in the project site will be removed from as a result of clearance for
construction. The project site is near the industrial zone, therefore there will be no concerns for
wild life disturbance as there is no suitable habitat in terms of suitable natural flora cover and
related fauna. There are no endangered species present at the project site. There will be very
minor impacts on fauna due to the construction of the plant.
5.1.2.2. Ecosystems Impacts of construction on ecosytem will be negligible since there will be:
• No removal or interference with prey of predatory animals;
• No effluent discharges;
• No significant siltation from run-off, altering aquatic and marine flora and fauna populations and
hence population dynamics of dependent organisms;
•No noises disrupting breeding behavior or use of breeding grounds, resulting in shifts in
population dynamics; and
• No removal of predatory animals resulting in increased prey populations that exceed the
carrying capacity of the local environment.
5.1.3. Socio-economic 5.1.3.1. Demographic The construction of plant will have limited effects on the demographic conditions since the
number of workers in the construction phase will be 200 people. There will be no permanent
ENVIRONMENTAL IMPACT ASSESSMENT REPORT FOR ANTALYA-TURKEY POWER PLANT 48
living quarters associated with this power plant. Hence there will be no increased demand on
local infrastructure, such as utilities, housing, medical facilities, schools, water, and food.
The project will not cause any displacement of individuals whose livelihood depends on the land
that will be occupied by the Project.
The labor force for the construction of the plant will be supplied also from Antalya, which will
result in increased disposable income of plant employees.
5.1.3.2. Land Use The primary changes in land use during the construction will be basically at the plant site, which
is currently registered agricultural land. However, the project site is in the close vicinity of
Antalya Organized Industrial District and unimproved agricultural land devoid of any agricultural
plantation.
Outside the project site, change in land use will be limited to infrastructures that will be installed
to support the plant such as the road access and storm water collection system.
5.1.4. Occupational Health and Safety Health and safety impacts of the project on workers and communities in the area of influence of
the project will be reasonably managed according to the national Occupational Health and
Safety Regulation (Date:9.12.2003, No: 25311) in order to reduce the likelihood of accidents and
work-related illnesses on the job as well as accidents occurring between construction-related
equipment and local vehicles. Since the project site is near the industrial district and minimum 3
km away from the nearest residential area possible impacts on local people and pedestrians are
assumed to be negligible.
5.2. Operation Phase
Environmental impacts from the power plant operation that will be quantified and reported
include those on existing air, water, and soil quality, and the disposal of solid wastes. Long and
short-term impacts on flora, fauna, human populations, and the health and safety of workers in
the surrounding community were evaluated.

ENVIRONMENTAL IMPACT ASSESSMENT REPORT FOR ANTALYA-TURKEY POWER PLANT 49
5.2.1. Physical and Chemical Physical and chemical impacts of thermal power plant operation typically include those on
geology, soils, topography, landforms, meteorology, climate, air and water quality, and noise.
These impacts for this particular case are estimated as follows.
5.2.1.1 Geology and Soils Soil impacts consist of negligible effects of windblown fugitive dust. Since the plant will run on
natural gas only, and the plant will be equipped with dry low NOx technology hence deposition of
sulphates, nitrates and metals from the stack plume, as adsorbed or incorporated into particles,
will cause negligible effects.
5.2.1.2. Topography and Landforms Local topography will not be altered and there will be no possible effects on landforms such as
swamps and shorelines.
5.2.1.3. Climate and Meteorology There will be no significant impact on the microclimate and meteorology of the local area caused
by changes in surface albedo and aerodynamic disturbances. There will be no significant impact
on precipitation patterns by increased availability of condensation nuclei downwind of the power
plant as there will be no particulates in the stack plume.
5.2.1.4. Air Emissions Air quality impacts during operation of a thermal power plant consist primarily of stack gases
emitted following fuel combustion. Emissions will be comprised of particulate matter (PM),
sulphur dioxide (SO2), oxides of nitrogen (NOX), carbon monoxide (CO), the greenhouse gases
(GHGs), carbon dioxide (CO2), and methane (CH4), trace amounts of various metals, and trace
amounts of organic and inorganic compounds.
The proportions and amounts of pollutants emitted depend on the fuel quality and combustion
strategy.

ENVIRONMENTAL IMPACT ASSESSMENT REPORT FOR ANTALYA-TURKEY POWER PLANT 50
In this particular case, the plant will operate on natural gas only, which proves the advantages of
low carbon dioxide and NOx emissions, negligible release of SO2 and TSPM (Total Suspended
Particulate Matter), and no ash or other hazardous wastes.
Emission levels of SIEMENS SGT5-4000F gas turbine obtained from the manufacturer together
with the relevant limits are given in Table 14.
Table 14. SIEMENS Gas Turbine Emission Performance (Natural Gas)*
Pollutant SGT5-4000F Gas Turbine
Turkish Standards World Bank Guidelines
NOx 51.5 mg/Nm3 a (25 ppmvdb)
75 mg/Nm3 125 mg/Nm3
CO < 10 mg/Nm3 100 mg/Nm3 N.A. Soot (Bacharach Nr.) - 3 N.A. SO2 < 10 mg/Nm3 60 mg/Nm3 2000 mg/Nm3 Unburned Hydrogen Carbons 4 ppm N.A N.A. PM-10 N.A. N.A (given as soot) 50 mg/Nm3
*Values are for base load operation at lower turbine inlet temperature, and dry exhaust with 15 % O2; Regulation on Prevention and Control of Industrial Air Pollution (Date: 22.07.2006, No: 26230) N.A.: not applicable a:Normal; temperature of 0oC and pressure of 1.013 bar, when 1 mole ideal gas has a volume of 22.4 liters. b: parts per million, volumetric, dry c: Particulate Matter of size 10µ and less
Air Pollution Modeling Studies
The aim of the modeling studies is to determine the effects of exhaust gases discharged by the
natural gas power plant on the air quality of Antalya region and determine the highest average
concentration values and their coordinates on monthly and annual bases.
The air pollution modeling results of SIEMENS SGT5-4000F model gas turbines are compiled in
a separate report given in Annex 2. In this report, the impacts of three pollutants of concern,
which are carbon monoxide (CO), nitrogen oxide compounds (NOx) and hydrocarbons (HC)
have been investigated according to the meteorological and topographical data of Antalya region
and the proposed power plant parameters with the help of ISCLT 3 (Industrial Source Complex

ENVIRONMENTAL IMPACT ASSESSMENT REPORT FOR ANTALYA-TURKEY POWER PLANT 51
Model - Long Term) Modeling Program. The monthly and annual maximum five average
concentrations and their coordinates are given for each pollutant in the report.
The concentration distribution results show that the highest monthly and annual average
concentration values will be lower than standards for each pollutant.
The 2 – D and 3 – D annual average concentration distribution graphs of each pollutant are
given in Figures 7 to 12, respectively.
Figure 7. 2-D Concentration Distribution of Carbon Monoxide (CO)

ENVIRONMENTAL IMPACT ASSESSMENT REPORT FOR ANTALYA-TURKEY POWER PLANT 52
Figure 8. 3 – D Concentration Distribution of Carbon Monoxide (CO)
Figure 9. 2 – D Concentration Distribution of Nitrogen Oxide Compounds (NOx)

ENVIRONMENTAL IMPACT ASSESSMENT REPORT FOR ANTALYA-TURKEY POWER PLANT 53
Figure 10. 3 – D Concentration Distribution of Nitrogen Oxide Compounds (NOx)
Figure 11. 2-D Concentration Distribution of Hydrocarbons (HC)

ENVIRONMENTAL IMPACT ASSESSMENT REPORT FOR ANTALYA-TURKEY POWER PLANT 54
Figure 12. 3-D Concentration Distribution of Hydrocarbons (HC)
5.2.1.5 Noise Noise sources from the plant during energy production will include the generators and turbines.
However the power house will be insulated for noise and vibration and hence it is estimated that
the workers will not be affected.
The Power Plant will be located approximately 3 km away from the nearest residential area and
the gas turbine packages are equipped with standard silencing to keep noise levels below 85
dBA at 1 meter and below 55 dBA at 154 meter. In addition, the noise insulation will ensure
compliance with the Turkish Standards and World Bank Guidelines as shown in Table 15.
Table 15. Noise Standards
Turkish Standards World Bank Guidelines Limits in Decibels, dB(A)
Location Category Day time Night Time Day time Night Time Residential, Institutional, Educational 60 50 55 45 Commercial/Industrial 70 60 70 70 The article of national ‘Assessment and Management of Environmental Noise Regulation’ (Date:
1.7.2005, and No: 25862) will be considered and complied.

ENVIRONMENTAL IMPACT ASSESSMENT REPORT FOR ANTALYA-TURKEY POWER PLANT 55
5.2.1.6. Hydrology Groundwater
Groundwater will be exploited from the wells to be dug at and around the site with necessary
permissions taken from the State Hydraulic Works as required by the Groundwater Law (Date:
23.12.1960, No: 10688). Groundwater use during the operation phase will be limited to domestic
use by the personnel. The estimated total amount of water use by the personnel is calculated on
the basis of assumed per capita water consumption rate of 75 lt/cap/day. The total number of
people using freshwater is assumed as 150, of which 100 will be the staff and 50 is assumed to
be visitors.
150 x 75 l/cap/day = 11 250 L/day The water discharge rates from the wells will not affect local hydrology. Surface Water
There will be no use of surface water during the operation of the plant. All cooling operations will
be performed only with air.
5.2.1.7 Water Quality The plant will only generate domestic wastewater sourced by a number of 100 employees and
an assumed number of 50 visitors. The amount of wastewater discharges are assumed to be
equal to amount used for domestic purposes as calculated in the previous part of the study as
11 250 lt/day.
An independent wastewater treatment plant will be designed to treat the domestic wastewater
discharges. The treatment system will be designed to meet the criteria defined for Sensitive
Zones under the EU Council Directive Concerning Urban Wastewater Treatment (91/271/EEC)
considering the sensitive character of the project area. The treated wastewater will be reused for
irrigation in the project area pursuant to the Article 28 of the Water Pollution Control Regulation
(Date: 21.12.2004, no: 25687) and the standards set out in Technical Procedures Notification
(Date: 7.1.1991, No: 20748), which is in line with the policies related to rational use of water
resources.

ENVIRONMENTAL IMPACT ASSESSMENT REPORT FOR ANTALYA-TURKEY POWER PLANT 56
Oil tanks will be isolated with concrete lining to prevent any leakage and the waste oils,
generated less than 10 m3/year, will be removed by a licensed hauler.
New storm water drains will be constructed at the site which will be used together with the
existing drains to direct storm water to the main drainage system.
There will be no cooling water discharges.
5.2.1.8. Solid Waste
The solid waste generated by the plant will be only domestic solid waste which will be properly
disposed of in sanitary landfills as required by the national Solid Waste Control Regulation
(Date: 14.3.1991, No: 20814).
The amount of solid waste generated in the operation phase is estimated based on the daily
generation rate of 1 kg/cap/day. Accordingly the amount of solid waste generation is estimated
as:
150 x 1 kg/cap/day = 150 kg/day.
5.2.2. Biological 5.2.2.1. Flora and Fauna
It is accepted that the air emissions majorly affect the land biota. Whereas the fauna specie can
move away from the discomforting sources, plants will have to respond physiologically. Pollution
damaged their tissues and may even kill them.
In the operation phase, the effects on flora will be basically from NOx emissions. NOx emissions
were found to be causing discoloration in plant leaves and then to lesions (Brown or dark Brown
spots). The loss of carotene and reduction of chlorophyll are the major responses from plant
exposed to NOx emissions. The type, severity and extend of the impact of NOx on plants vary
depending on both internal and external factors. Environmental conditions, presence of other
pollutants and the existing plant condition affect the responses of the plant to NOx exposure.

ENVIRONMENTAL IMPACT ASSESSMENT REPORT FOR ANTALYA-TURKEY POWER PLANT 57
The results of emission estimates show that the NOx emissions will be below the limit values set
out in the Air Pollution Prevention Regulation (Date: 02.11.1986, No: 19269) and the World Bank
standards.
Accordingly, NOx emissions originating from the plant will not have any adverse effects on the
flora and fauna. Operation of the plant will supply reliable electrical energy to the users in the
region which will limit the use of operation of diesel type or other type of energy production units
i.e. diesel generators that have adverse effects on the environment. Hence the current pollution
load that arises from the use of other fossil fuels will be reduced.
There are no endangered flora and fauna on the project site to be affected from air emissions.
There will be no particulate emissions and no cooling water discharges to affect flora and fauna.
5.2.2.2. Ecosystems Impacts of operation of the plant on ecosystem will be negligible since there will be:
• No removal or interference with prey of predatory animals;
• No wastewater discharges to receiving bodies;
• Limited emission of stack gases well below the national and World bank standards;
• No significant siltation from run-off, altering aquatic and marine flora and fauna
populations and hence population dynamics of dependent organisms;
• No noises disrupting breeding behavior or use of breeding grounds, resulting in shifts in
population dynamics; and
• No removal of predatory animals resulting in increased prey populations that exceed the
carrying capacity of the local environment.
The frequent power outages experienced in Antalya caused increased use of fossil powered
generators which discharge greenhouse gasses. The operation of power plant will result in
continuous power availability, which will reduce the adverse effects of additional pollutants from
such applications.

ENVIRONMENTAL IMPACT ASSESSMENT REPORT FOR ANTALYA-TURKEY POWER PLANT 58
5.2.3. Socio-economic Structure 5.2.3.1. Demographic
The operation of plant will have limited effects on the demographic conditions since the number
of workers in the operation phase will be around 100 people. There will be no permanent living
quarters associated with this power plant. Hence there will be no increased demand on local
infrastructure, such as utilities, housing, medical facilities, schools, water, and food.
The project will not cause any displacement of individuals whose livelihood depends on the land
that will be occupied by the Project.
The labor force for the operation of the plant will be supplied also from Antalya, which will result
in increased disposable income of plant employees.
The Antalya city has been experiencing frequent power outages in the last years due to the
insufficient power supplies. This has been a major problem in the city which heavily depends on
tourism sector. The seasonal fluctuation of population due to tourism activity could not be
compensated in terms of electricity supply.
The power plant, by itself, will be able to meet the electrical energy demand of the whole city, as
the only producer of electricity in the area. Hence it will positively impact the social economical
environment for tourism and service sectors by providing improved power availability and
reliability.
The use of clean energy i.e. natural gas will also help to improve local conditions to support the
development of tourism sector.
5.2.3.2. Land Use The plant’s site is currently unimproved agricultural land, hence the shift in land use is from
unimproved land to industrial area. Additional changes in land use may occur as a result of the
development of new industries in the area, constructed to take advantage of local, reliable, and
oftentimes cheaper electrical power.

ENVIRONMENTAL IMPACT ASSESSMENT REPORT FOR ANTALYA-TURKEY POWER PLANT 59
There may be increased local industrial development as a result of additional power availability
and reliability in the future.
5.1.4. Occupational Health and Safety Health and safety impacts of the project on workers and communities in the area of influence of
the project will be reasonably managed according to the national Occupational Health and
Safety Regulation (Date: 9.12.2003, No: 25311) in order to reduce the likelihood of accidents
and work-related illnesses on the job as well as accidents occurring between construction-
related equipment and local vehicles. Since the project site is near the industrial district and
minimum 3 km away from the nearest residential area possible impacts on local people and
pedestrians are assumed to be negligible.

ENVIRONMENTAL IMPACT ASSESSMENT REPORT FOR ANTALYA-TURKEY POWER PLANT 60
6. MITIGATION MEASURES
The purpose of impact mitigation is to look for alternative and better ways of implementing the
proposed project or associated activities so that the negative impacts are eliminated or
minimized, while benefits are enhanced. Impact mitigation requires that the full extent of the
anticipated environmental problems are understood. In view of this, this section of the EIA
presents mitigation measures resulting from the impacts identified. The mitigation measures are
presented for the construction phase and the operation phase in Table 16 and Table 17,
respectively. AKSA ENERJİ ÜRETİM A.Ş. will be responsible for all mitigation measures
presented in this report.

ENVIRONMENTAL IMPACT ASSESSMENT REPORT FOR ANTALYA-TURKEY POWER PLANT 61
Table 16. Environmental Impacts and Planned Mitigation Activities in the Construction Phase Environmental Impacts Mitigation Physical and Chemical Geology and Soils No mitigation needed Topography and landforms
Careful reshaping, landscaping will be made to restore the aesthetic quality of the area
Climate and Meteorology No mitigation needed Air Quality All heavy equipment, delivery trucks, vessels will be inspected
and maintained to reduce exhaust emissions. Unpaved roads will be watered twice a day to minimize dust. Air Quality will be monitored on a regular basis.
Noise All noise-generating equipment will be inspected and maintained to reduce noise emissions. Use of noise suppressors or mufflers will be required for heavy equipment. Generators and compressors will be provided with enclosures. Noise levels at the site and at the closest residential area will be measured on a regular basis.
Hydrology No mitigation needed Water Quality Domestic wastewater generated will be treated by individual
treatment units and the effluent will be used for site irrigation. Storage and routine handling of fuels, lubricants and other potentially contaminating substances in a weather-protected area having containment for spills. All equipment and materials required to execute a clean-up will be available on-site. The quality of well water will be monitored periodically.
Solid Waste All sorts of solid waste (of domestic type) will be collected systematically and protected-storage will be provided. Solid wastes will be disposed of to a sanitary landfill. No burning of wastes will be permitted.
Biological Flora and Fauna The project will secure permits for any trees to be cut. Socio-economic Demographic No mitigation needed Land use No mitigation needed Occupational Health and Safety
To prevent disease and accidents, workers will undergo an environmental and safety briefing on safety, sanitation measures, and emergency rescue procedures before development begins. Adequate sanitary facilities, potable water, and garbage bins will be provided. Safety rules and regulations will be implemented during construction. All workers will be required to wear protective gear and equipment that conforms to safety standards. Security of the project site will be imposed at all times.

ENVIRONMENTAL IMPACT ASSESSMENT REPORT FOR ANTALYA-TURKEY POWER PLANT 62
Table 17. Environmental Impacts and Planned Mitigation Activities in the Operation Phase Environmental Impacts Mitigation Physical and Chemical Geology and Soils No mitigation needed Topography and landforms
No mitigation needed
Climate and Meteorology No mitigation needed Air Quality Although atmospheric emissions will not be a major concern for
the project, continuous monitoring of the stack emissions and ambient air quality will be undertaken during operations. NOx emissions will be controlled using a dry low NOx combustor. Air Quality will be monitored on a regular basis.
Noise The selected gas turbine packages are equipped with standard silencing. The plant will comply with noise standards (national and WB) for an industrial area. The powerhouse will be noise insulated. Noise levels at the site and at the closest residential area will be measured on a regular basis.
Hydrology No mitigation needed Water Quality Domestic wastewater generated will be treated by individual
treatment units and the effluent will be used for site irrigation. Oil tanks will be isolated with concrete lining to prevent any leakage and the waste oils will be removed by a licensed hauler. Dumping of any contaminating material into the environment including waste oils will be prohibited. Storage and routine handling of fuels, lubricants and other potentially contaminating substances in a weather-protected area having containment for spills. All equipment and materials required to execute a clean-up will be available on-site. The quality of well water will be monitored periodically.
Solid Waste All sorts of solid waste (of domestic type) will be collected systematically and protected-storage will be provided. Solid wastes will be disposed of to a sanitary landfill. No burning of wastes will be permitted.
Biological Flora and Fauna With the use of clean fuel i.e. natural gas and dry low NOx
technology, adverse impacts on flora and fauna will be insignificant.
Socio-economic Demographic No mitigation needed Land use No mitigation needed Occupational Health and Safety
To prevent disease and accidents, workers will undergo an environmental and safety briefing on safety, sanitation measures, and emergency rescue procedures before development begins. Adequate sanitary facilities, potable water, and garbage bins will be provided. Precautions will be taken against fire accidents and electrocution. Security of the project site will be imposed at all times.

ENVIRONMENTAL IMPACT ASSESSMENT REPORT FOR ANTALYA-TURKEY POWER PLANT 63
7. ANALYSIS OF ALTERNATIVES The purpose of the analysis of alternatives as part of the EIA process is to select the best
among all possible project options. The assessments and recommendations made by the EIA
Team are presented below:
7.1. Site 1. Land has already been identified and is free of conflict.
2. The site is well located in regard to the following:
a. Easy access.
b. Close proximity to the Antalya organized industrial district
c. Close proximity to the already existing national electric transmission lines
d. Close proximity to the already existing natural gas transmission lines
e. Has no settlements in close vicinity.
7.2. Fuel Types Natural gas has the obvious advantages over coal or diesel, of low carbon dioxide and NOx
emissions, negligible release of SO2 and TSPM (Total Suspended Particulate Matter), and no
ash or other hazardous wastes. The intended power plant should have a significant positive
impact on air quality compared to any fossil fuel burning power plant.
7.3. Technology
Alternative for gas turbines are gas motors and diesel generators.
There are no suitable hydropower sites available in the vicinity of Antalya city. Construction of
dams and reservoirs would also involve rehabilitation issues. Hence, the hydropower choice was
not pursued. The thermal power source was the only alternative left. As far as the generation
technology was considered, the project proposes to use advanced class turbines having more
than 55% thermal efficiency. This class of turbines has been in service all over the world and is
well proven.

ENVIRONMENTAL IMPACT ASSESSMENT REPORT FOR ANTALYA-TURKEY POWER PLANT 64
7.4. The "Do Nothing" Scenario If the project would be assumed to fail to meet the required environmental conditions the
alternative would be the transfer of energy from a distant power plant via construction of energy
transmission lines, which will not be an economically and environmentally sound option.
It is therefore recommended that the project goes ahead but should take into consideration all
the suggested mitigation measures.

ENVIRONMENTAL IMPACT ASSESSMENT REPORT FOR ANTALYA-TURKEY POWER PLANT 65
8. ENVIRONMENTAL MANAGEMENT PLAN (EMP) AKSA ENERJİ ÜRETİM A.Ş. is committed to minimizing any adverse impacts that could arise
from the construction and operation of the project. To achieve this, an environmental
management plan (EMP) was formulated to manage impacts, to adopt the best available proven
control technologies and procedures, to ensure a continuing process of review and positive
action in the light of available monitoring results, and to consult with local communities on a
continued basis. An environmental and safety officer will be hired to oversee implementation of
the EMP, the environmental monitoring program, and compliance with ECC conditions. The
officer will closely coordinate with the plant general manager, the management staff, and the
monitoring team.
The EMP will aim to achieve an exemplary environmental performance during construction and
operation. To meet this goal, the following activities, measures and programs will be
implemented in AKSA ENERJİ ÜRETİM A.Ş.: (i) environmental policy; (ii) application of all
mitigation and management measures; (iii) an environmental monitoring program; (iv) an
emergency and contingency plan (v) an institutional plan (vi) an environmental and safety
officer.
Environmental monitoring is an important component of the EMP. It provides the information for
periodic review and refinement modification of the EMP as necessary, ensuring that
environmental protection is optimized at all project phases. Through monitoring, unwanted
environmental impacts are detected early and remedied effectively. It will also validate the
impacts predicted in the Environmental Impact Assessment (EIA) and the effectiveness of the
proposed mitigation measures. Lastly, it will also demonstrate compliance with national and
World Bank regulatory requirements.
A comprehensive monitoring program for the plant complex has been developed, covering the
measurement of relevant environmental indicators. At the plant, it will involve noise, safety
concerns, site drainage, solid waste and wastewater disposal, groundwater abstraction, and
structural integrity of the tanks and buildings. The results of the monitoring program, which will
be implemented by the Monitoring Team (MT) to be created for the project, will be used to
optimize plant operations and adjust to management practices.

ENVIRONMENTAL IMPACT ASSESSMENT REPORT FOR ANTALYA-TURKEY POWER PLANT 66
The monitoring of required parameters to check the environmental impacts, frequency of their
measurement, recording and reporting to related national authorities will be carried out strictly as
required by the related national regulations. The legal framework to be complied for
environmental monitoring is provided in Table 18.
Table 18. Legal Framework for Environmental Compliance
Monitoring of; Regulation to be complied
Air Emissions Regulation on Prevention and Control of Industrial Air Pollution (Date: 22.07.2006, No: 26230)
Well water quality Regulation on Water Intended for Human Consumption (Date:
17.02.2005, No: 25730)
Wastewater quality used for
irrigation
Water Pollution Control Regulation (Date: 21.12.2004, no:
25687) and standards set out in Technical Procedures
Notification (Date: 7.1.1991, No: 20748).
Handling and disposal of oil
wastes
Regulation on Control of Waste Oils (Date: 21.01.2004, No: 25353)
All measurements for the required parameters will be done with methods described under
Turkish Standards (TS), Environmental Protection Agency (EPA), Deutsches Institut für
Normung (DIN) and European Committee for Standardization (CEN) norms.
In the event that monitoring indicates that any environmental quality is deteriorating to
unacceptable levels, the proponent will correct operation procedures that are contributing to the
problem and/or undertake necessary engineering installations.


ANNEX 2
AIR POLLUTION MODELLING OF
ANTALYA POWER PLANT (SIEMENS GAS TURBINES)

2
PROJECT DESCRIPTION
Plant Description
The plant is designed to generate electricity power as a base-loaded plant.
The power plant will be installed at the industrial zone of Antalya. It is going to be based on two units of 283 MW SIEMENS SGT5-4000F gas turbine packages as simple cycle during the first phase. No liquid fuel system is being considered for the project. The operation is going to be only on natural gas fuel.
Natural gas simple cycle ISO base load conditions are given in Table 1.
Table 1. ISO Base Load Conditions of Simple Cycle for Natural Gas
Turbine Inlet Temperature 15 oC Ambient Pressure (Sea Level) 1.013 bar Relative Humidity of the Air 60 % Load Level 100 % Turbine Rotor Speed 3000 min-1 Design Pressure Loss Exhaust Gas System 9 mbar
Generator Power Factor 0.85 Lower Heating Value 50035 kJ/kg Fuel Mass Flow 13.9 kg/s Emission Control dry
Two SGT5-4000F gas turbine units include dry low NOx technology to control NOx emissions.
Dry low NOx technology utilizes lean premix combustion in conjunction with a pilot zone. The intense mixing and overall lean conditions result in lower flame temperatures and minimal NOx generation. The conventional diffusion-flame zone is used to meet the operational requirements of the gas turbine: ignition, fuel staging sequence through the engine load range and flame stability.
SIEMENS Gas Turbine System has a standardized base design and base scope of supply which is aimed in this project. Although this base design could meet project and site specific conditions, it can also be improved to meet increased operational flexibility. Heat recovery applications including, re-powering, combined cycle and cogeneration in a wide range of environments and requirements.

3
This system also offers part-load and fast start-up capabilities.
In the choice of specific systems, options are available for fuels used, emissions reduction, power output enhancement, efficiency enhancement, generator type, air intake system, exhaust gas system and noise abatement.
Emission Performance
Emission levels of SIEMENS SGT5-4000F gas turbine are illustrated in Table 2. Gas turbine emission levels meet the required emission values of Turkish Industry Related Air Pollution Control Regulation.
Table 2. SIEMENS Gas Turbine Emission Performance – Simple Cycle (Natural Gas)*
Pollutant SGT5-4000F Turkish Standarts NOx 51.5 mg/Nm3 75 mg/Nm3 CO < 10 mg/Nm3 100 mg/Nm3 Soot (Bacharach Nr.) < 2 mg/Nm3 3 mg/Nm3
SO2 < 10 mg/Nm3 60 mg/Nm3 Unburned Hydrocarbon 4 ppm N/A
* Values are for base load operation at lower turbine inlet temperature, and dry exhaust with 15 % 02 .
Thermal Performance
Thermal performance values of SIEMENS SGT5-4000F gas turbine are illustrated in Table 3.
Table 3. SIEMENS Gas Turbine Thermal Performance at Base Load Conditions – Simple Cycle (Natural Gas)
Gross* Power Output 283 MW Gross* Effieciency 39.2 % Gross* Heat Rate 9175 kJ/kWh Exhaust Flow 687 kg/s Exhaust Temperature 581 oC
* at generator terminals

4
AIR POLLUTION MODEL DESCRIPTION
BREEZE AIR ISCLT 3 was used to assess the impacts of the emissions on the
ambient air quality.
The software is a Windows based program for the development of EPA long
term industrial source complex (ISCLT 3) model. The software is capable of
analyzing the emissions of up to 1000 point, area, volume and open pit sources
which may be grouped. Receptor grids as well as discrete receptor can be
defined to assess the air quality in a particular urban location. Concentrations
can be calculated for all terrain elevations up to stack height and for receptors
above ground elevations. It requires meteorological data in a frequency
distribution of wind speed, stability class and wind direction (star data).
Star data was prepared from the long term monthly average climate data
published by the Turkish Meteorology Office. The stability classes have been
calculated by considering the rules in AQPR and EPA regulatory options.
Topography was investigated and relevant file was prepared by reading
elevations on a 1/25.000 chart in 250 m distances for a grid of 5 km by 5 km.
The locations of the emission sources are indicated in the same grid file.

5
PROJECT PARAMETERS

6
A) STACK PROPERTIES Stack Height: 62 m
Stack Diameter: 5,5 m
Flue Gas Density: 0,7 kg/m3
Flue Gas Flow Rate: 687 kg/s
Flue Gas Average Velocity: 41.3 m/s
B) FLUE GAS EMISSION DATA According to the SIEMENS SGT5-4000F gas turbine technical data, the flow rate of gas emissions are given as follows;
Carbon Monoxide → 6.87 g/s
Nitrogen Oxide Compounds → 10.2 g/s
Hydrocarbon → 4.1 g/s

7
C) TOPOGRAPHICAL DATA
PERIOD MONTHLY ANNUAL
CARTESIAN COORDINATE SYSTEM X 85000 [m] Y 8000 [m] XY INCREMENT 250 [m] NUMBER OF POINTS 21
ELEVATIONS [m]
ELEV 1 340.0 300.0 300.0 300.0 306.0 305.0 306.0
306.0 305.0 307.0 307.0 307.0 307.0 307.0
307.0 307.0 307.0 307.0 307.0 307.0 307.0
ELEV 2 330.0 300.0 300.0 300.0 306.0 305.0 306.0
306.0 305.0 307.0 307.0 307.0 307.0 307.0
307.0 307.0 307.0 307.0 307.0 307.0 307.0
ELEV 3 310.0 330.0 300.0 300.0 303.0 305.0 306.0
305.0 305.0 305.0 305.0 307.0 307.0 307.0
307.0 307.0 307.0 307.0 308.0 307.0 307.0
ELEV 4 320.0 330.0 300.0 300.0 300.0 303.0 303.0
305.0 305.0 305.0 305.0 307.0 307.0 307.0
307.0 307.0 308.0 308.0 310.0 308.0 308.0
ELEV 5 360.0 330.0 300.0 300.0 300.0 300.0 300.0
303.0 303.0 305.0 303.0 305.0 307.0 307.0
305.0 307.0 310.0 310.0 311.0 310.0 309.0
ELEV 6 325.0 325.0 300.0 300.0 300.0 300.0 300.0
300.0 300.0 300.0 300.0 303.0 307.0 300.0
300.0 307.0 310.0 311.0 312.0 311.0 310.0
ELEV 7 320.0 320.0 300.0 300.0 303.0 305.0 300.0
300.0 300.0 300.0 300.0 300.0 305.0 300.0
300.0 305.0 308.0 310.0 312.0 312.0 311.0

8
ELEV 8 310.0 310.0 300.0 300.0 303.0 310.0 310.0
300.0 300.0 300.0 300.0 300.0 303.0 302.0
300.0 305.0 308.0 310.0 312.0 312.0 312.0
ELEV 9 310.0 300.0 300.0 303.0 305.0 310.0 310.0
300.0 300.0 300.0 300.0 300.0 300.0 302.0
300.0 305.0 310.0 310.0 312.0 312.0 313.0
ELEV 10 410.0 310.0 305.0 305.0 305.0 307.0 307.0
300.0 303.0 300.0 302.0 302.0 300.0 302.0
300.0 305.0 309.0 310.0 311.0 311.0 313.0
ELEV 11 410.0 310.0 305.0 305.0 305.0 305.0 306.0
303.0 303.0 300.0 304.0 303.0 301.0 302.0
300.0 300.0 309.0 311.0 311.0 310.0 311.0
ELEV 12 410.0 300.0 305.0 303.0 305.0 305.0 306.0
303.0 303.0 303.0 304.0 305.0 302.0 302.0
300.0 305.0 310.0 311.0 311.0 311.0 311.0
ELEV 13 320.0 310.0 305.0 300.0 303.0 305.0 305.0
303.0 303.0 303.0 305.0 305.0 303.0 302.0
300.0 305.0 310.0 311.0 310.0 311.0 311.0
ELEV 14 300.0 300.0 305.0 300.0 300.0 305.0 305.0
303.0 303.0 305.0 305.0 306.0 304.0 305.0
305.0 305.0 310.0 310.0 310.0 311.0 311.0
ELEV 15 330.0 310.0 300.0 300.0 300.0 305.0 340.0
305.0 304.0 305.0 307.0 307.0 305.0 305.0
305.0 305.0 307.0 310.0 310.0 311.0 311.0
ELEV 16 390.0 310.0 300.0 300.0 300.0 305.0 304.0
305.0 305.0 305.0 310.0 310.0 307.0 305.0
305.0 305.0 307.0 310.0 310.0 311.0 312.0
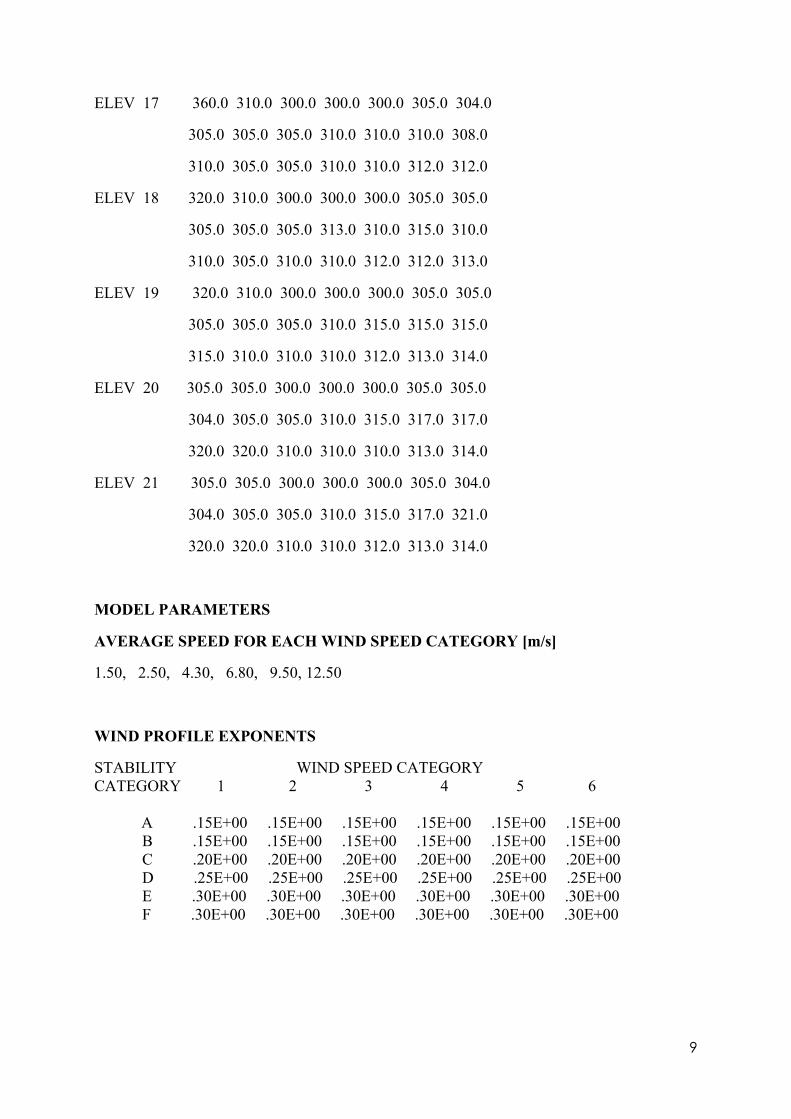
9
ELEV 17 360.0 310.0 300.0 300.0 300.0 305.0 304.0
305.0 305.0 305.0 310.0 310.0 310.0 308.0
310.0 305.0 305.0 310.0 310.0 312.0 312.0
ELEV 18 320.0 310.0 300.0 300.0 300.0 305.0 305.0
305.0 305.0 305.0 313.0 310.0 315.0 310.0
310.0 305.0 310.0 310.0 312.0 312.0 313.0
ELEV 19 320.0 310.0 300.0 300.0 300.0 305.0 305.0
305.0 305.0 305.0 310.0 315.0 315.0 315.0
315.0 310.0 310.0 310.0 312.0 313.0 314.0
ELEV 20 305.0 305.0 300.0 300.0 300.0 305.0 305.0
304.0 305.0 305.0 310.0 315.0 317.0 317.0
320.0 320.0 310.0 310.0 310.0 313.0 314.0
ELEV 21 305.0 305.0 300.0 300.0 300.0 305.0 304.0
304.0 305.0 305.0 310.0 315.0 317.0 321.0
320.0 320.0 310.0 310.0 312.0 313.0 314.0
MODEL PARAMETERS
AVERAGE SPEED FOR EACH WIND SPEED CATEGORY [m/s]
1.50, 2.50, 4.30, 6.80, 9.50, 12.50
WIND PROFILE EXPONENTS
STABILITY WIND SPEED CATEGORY CATEGORY 1 2 3 4 5 6
A .15E+00 .15E+00 .15E+00 .15E+00 .15E+00 .15E+00
B .15E+00 .15E+00 .15E+00 .15E+00 .15E+00 .15E+00 C .20E+00 .20E+00 .20E+00 .20E+00 .20E+00 .20E+00 D .25E+00 .25E+00 .25E+00 .25E+00 .25E+00 .25E+00 E .30E+00 .30E+00 .30E+00 .30E+00 .30E+00 .30E+00 F .30E+00 .30E+00 .30E+00 .30E+00 .30E+00 .30E+00

10
VERTICAL POTENTIAL TEMPERATURE GRADIENTS [DEGREES K/m] STABILITY WIND SPEED CATEGORY CATEGORY 1 2 3 4 5 6 A .00E+00 .00E+00 .00E+00 .00E+00 .00E+00 .00E+00 B .00E+00 .00E+00 .00E+00 .00E+00 .00E+00 .00E+00 C .00E+00 .00E+00 .00E+00 .00E+00 .00E+00 .00E+00 D .00E+00 .00E+00 .00E+00 .00E+00 .00E+00 .00E+00 E .20E-01 .20E-01 .20E-01 .20E-01 .20E-01 .20E-01 F .35E-01 .35E-01 .35E-01 .35E-01 .35E-01 .35E-01

11
D) METEOROLOGICAL DATA
ANEMOMETER HEIGHT 10.0 [m] WIND SPEED CATEGORIES 1.50 2.50 4.30 6.80 9.50 12.50 [m/s] AVERAGE AMBIENT AIR TEMPERATURE [DEGREES K] JAN 288.2 288.2 288.2 283.1 279.3 279.3 FEB 288.9 288.9 288.9 283.6 279.4 279.4 MAR 291.1 291.2 291.2 285.7 281.0 281.0 APR 294.2 294.2 294.2 288.9 284.2 284.2 MAY 299.9 299.9 299.9 294.3 289.0 289.0 JUN 305.2 305.2 305.2 299.2 293.4 293.4 JUL 308.1 308.1 308.1 302.2 296.8 296.8 AUG 307.5 307.5 307.5 301.5 296.4 296.4 SEP 304.2 304.2 304.2 297.8 292.7 292.7 OCT 300.0 300.0 300.0 293.3 288.6 288.6 NOV 294.8 294.8 294.8 288.3 284.1 284.1 DEC 289.7 289.7 289.7 284.6 281.0 281.0 ANNUAL 297.7 297.7 297.7 291.9 287.2 287.2 AVERAGE MIXING LAYER HEIGHT [m] ANNUAL AND MONTHLY A 250 400 950 1200 2200 7000 B 250 400 950 1200 2200 7000 C 250 400 950 1200 2200 7000 D 250 400 950 1200 2200 7000 E 550 1000 1200 1500 2800 9000 F 1300 1750 2300 2500 3300 9000 AVERAGE SURFACE ROUGHNESS ANNUAL AND MONTHLY 2

12
Figure 1. Wind Rose of Antalya According to the Blow Frequencies

13
RESULTS OF AIR POLLUTION MODEL

14
CARBON MONOXIDE IMPACTS ON AIR POLLUTION In this model; 2 Emission Sources
21 Receptor Points Emission Unit: g/s Output Unit: µg/m3

15
RESULTS JANUARY THE MAXIMUM 5 AVERAGE CONCENTRATION VALUES No Concentration [µg/m3] X Y 1 .045884 88750 8000 2 .041813 89000 8000 3 .037688 89250 8000 4 .037278 88750 8250 5 .035518 88500 8000 FEBRUARY THE MAXIMUM 5 AVERAGE CONCENTRATION VALUES No Concentration [µg/m3] X Y 1 .051327 88750 8000 2 .044566 89000 8000 3 .040898 88750 8250 4 .039769 88500 8000 5 .037335 89250 8000 MARCH THE MAXIMUM 5 AVERAGE CONCENTRATION VALUES No Concentration [µg/m3] X Y 1 .036748 88750 8000 2 .033632 89000 8000 3 .030500 89250 8000 4 .029908 88750 8250 5 .028443 88500 8000 APRIL THE MAXIMUM 5 AVERAGE CONCENTRATION VALUES No Concentration [µg/m3] X Y 1 .014326 87500 12250 2 .013691 87750 12500 3 .013406 87750 12750 4 .013319 87500 12500 5 .013084 88000 12750

16
MAY THE MAXIMUM 5 AVERAGE CONCENTRATION VALUES No Concentration [µg/m3] X Y 1 .013376 87500 12250 2 .012443 87500 12500 3 .012426 87750 12500 4 .012227 87750 12750 5 .012224 87500 12750 JUNE THE MAXIMUM 5 AVERAGE CONCENTRATION VALUES No Concentration [µg/m3] X Y 1 .033095 88750 8000 2 .028731 89000 8000 3 .026370 88750 8250 4 .025644 88500 8000 5 .024064 89250 8000 JULY THE MAXIMUM 5 AVERAGE CONCENTRATION VALUES No Concentration [µg/m3] X Y 1 .033899 88750 8000 2 .030528 89000 8000 3 .027410 88750 8250 4 .027050 89250 8000 5 .026248 88500 8000 AUGUST THE MAXIMUM 5 AVERAGE CONCENTRATION VALUES No Concentration [µg/m3] X Y 1 .015408 87500 12250 2 .014953 87750 12500 3 .014626 87750 12750 4 .014461 88000 12750 5 .014408 88000 12250

17
SEPTEMBER THE MAXIMUM 5 AVERAGE CONCENTRATION VALUES No Concentration [µg/m3] X Y 1 .015001 88000 12250 2 .014661 88250 13000 3 .014294 88000 12500 4 .014231 88250 12750 5 .014088 88000 12750 OCTOBER THE MAXIMUM 5 AVERAGE CONCENTRATION VALUES No Concentration [µg/m3] X Y 1 .008347 87500 10750 2 .002982 87500 11250 3 .001827 87750 10750 4 .001093 87250 11250 5 .001020 87750 11250 NOVEMBER THE MAXIMUM 5 AVERAGE CONCENTRATION VALUES No Concentration [µg/m3] X Y 1 .009937 87500 10750 2 .002803 87500 11250 3 .001606 87750 11250 4 .001332 87750 10750 5 .000722 87250 11250 DECEMBER THE MAXIMUM 5 AVERAGE CONCENTRATION VALUES No Concentration [µg/m3] X Y 1 .007722 87500 10750 2 .005670 87000 12250 3 .005594 86750 12750 4 .005214 86750 12500 5 .005116 86750 13000

18
ANNUAL THE MAXIMUM 5 AVERAGE CONCENTRATION VALUES No Concentration [µg/m3] X Y 1 .036915 88750 8000 2 .032050 89000 8000 3 .029414 88750 8250 4 .028603 88500 8000 5 .026847 89250 8000
Figure 2. 2 – D Concentration Distribution of Carbon Monoxide

19
Figure 3. 3 – D Concentration Distribution of Carbon Monoxide

20
NITROGEN OXIDE COMPOUNDS IMPACTS ON AIR POLLUTION In this model; 2 Emission Sources
21 Receptor Points Emission Unit: g/s Output Unit: µg/m3

21
RESULTS JANUARY THE MAXIMUM 5 AVERAGE CONCENTRATION VALUES No Concentration [µg/m3] X Y 1 .068125 88750 8000 2 .062080 89000 8000 3 .055956 89250 8000 4 .055347 88750 8250 5 .052733 88500 8000 FEBRUARY THE MAXIMUM 5 AVERAGE CONCENTRATION VALUES No Concentration [µg/m3] X Y 1 .076205 88750 8000 2 .066167 89000 8000 3 .060723 88750 8250 4 .059045 88500 8000 5 .055432 89250 8000 MARCH THE MAXIMUM 5 AVERAGE CONCENTRATION VALUES No Concentration [µg/m3] X Y 1 .054560 88750 8000 2 .049934 89000 8000 3 .045284 89250 8000 4 .044405 88750 8250 5 .042230 88500 8000 APRIL THE MAXIMUM 5 AVERAGE CONCENTRATION VALUES No Concentration [µg/m3] X Y 1 .021270 87500 12250 2 .020327 87750 12500 3 .019905 87750 12750 4 .019775 87500 12500 5 .019426 88000 12750

22
MAY THE MAXIMUM 5 AVERAGE CONCENTRATION VALUES No Concentration [µg/m3] X Y 1 .019859 87500 12250 2 .018474 87500 12500 3 .018449 87750 12500 4 .018154 87750 12750 5 .018150 87500 12750 JUNE THE MAXIMUM 5 AVERAGE CONCENTRATION VALUES No Concentration [µg/m3] X Y 1 .049137 88750 8000 2 .042658 89000 8000 3 .039153 88750 8250 4 .038075 88500 8000 5 .035728 89250 8000 JULY THE MAXIMUM 5 AVERAGE CONCENTRATION VALUES No Concentration [µg/m3] X Y 1 .050330 88750 8000 2 .045325 89000 8000 3 .040696 88750 8250 4 .040161 89250 8000 5 .038971 88500 8000 AUGUST THE MAXIMUM 5 AVERAGE CONCENTRATION VALUES No Concentration [µg/m3] X Y 1 .022876 87500 12250 2 .022201 87750 12500 3. .021716 87750 12750 4 .021471 88000 12750 5 .021391 88000 12250

23
SEPTEMBER THE MAXIMUM 5 AVERAGE CONCENTRATION VALUES No Concentration [µg/m3] X Y 1 .022272 88000 12250 2 .021767 88250 13000 3 .021223 88000 12500 4 .021129 88250 12750 5 .020917 88000 12750 OCTOBER THE MAXIMUM 5 AVERAGE CONCENTRATION VALUES No Concentration [µg/m3] X Y 1 .012393 87500 10750 2 .004427 87500 11250 3 .002712 87750 10750 4 .001623 87250 11250 5 .001514 87750 11250 NOVEMBER THE MAXIMUM 5 AVERAGE CONCENTRATION VALUES No Concentration [µg/m3] X Y 1 .014754 87500 10750 2 .004162 87500 11250 3 .002385 87750 11250 4 .001978 87750 10750 5 .001073 87250 11250 DECEMBER THE MAXIMUM 5 AVERAGE CONCENTRATION VALUES No Concentration [µg/m3] X Y 1 .011465 87500 10750 2 .008419 87000 12250 3 .008306 86750 12750 4 .007741 86750 12500 5 .007596 86750 13000
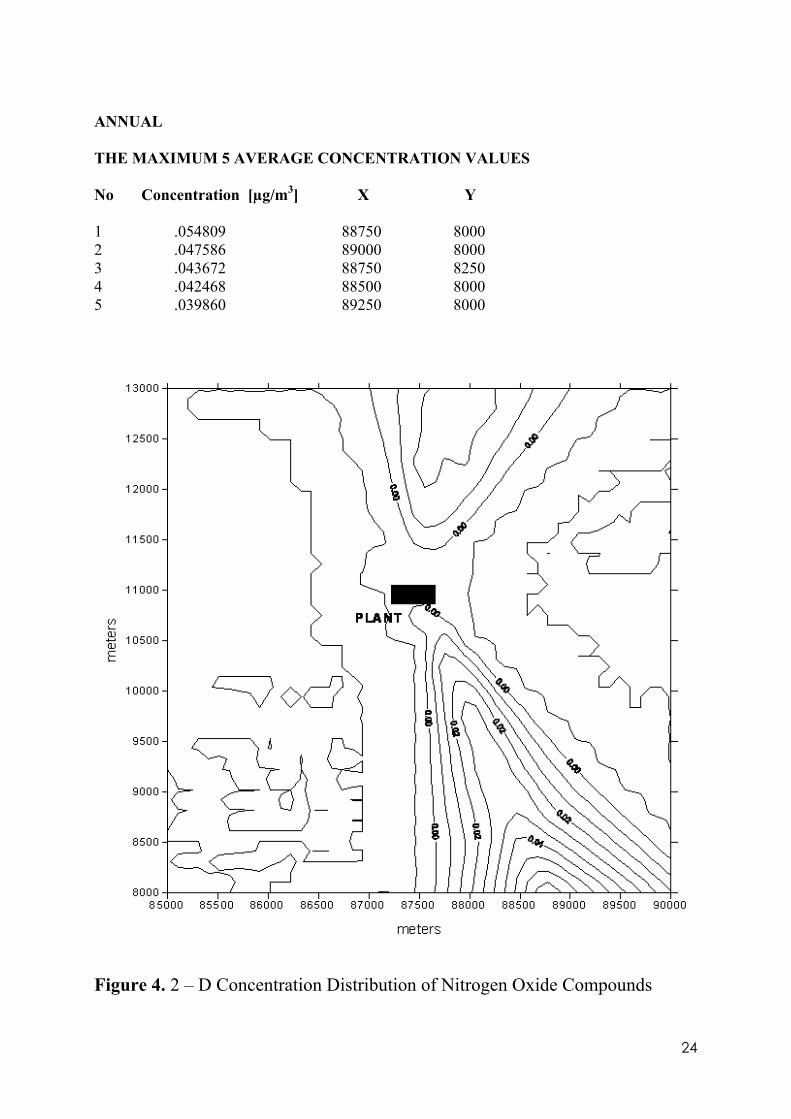
24
ANNUAL THE MAXIMUM 5 AVERAGE CONCENTRATION VALUES No Concentration [µg/m3] X Y 1 .054809 88750 8000 2 .047586 89000 8000 3 .043672 88750 8250 4 .042468 88500 8000 5 .039860 89250 8000
Figure 4. 2 – D Concentration Distribution of Nitrogen Oxide Compounds

25
Figure 5. 3 – D Concentration Distribution of Nitrogen Oxide Compounds

26
HYDROCARBON IMPACTS ON AIR POLLUTION In this model; 2 Emission Sources
21 Receptor Points Emission Unit: g/s Output Unit: µg/m3

27
RESULTS JANUARY
THE MAXIMUM 5 AVERAGE CONCENTRATION VALUES No Concentration [µg/m3] X Y 1 .027384 88750 8000 2 .024954 89000 8000 3 .022492 89250 8000 4 .022248 88750 8250 5 .021197 88500 8000 FEBRUARY THE MAXIMUM 5 AVERAGE CONCENTRATION VALUES No Concentration [µg/m3] X Y 1 .030632 88750 8000 2 .026597 89000 8000 3 .024408 88750 8250 4 .023734 88500 8000 5 .022281 89250 8000 MARCH THE MAXIMUM 5 AVERAGE CONCENTRATION VALUES No Concentration [µg/m3] X Y 1 .021931 88750 8000 2 .020072 89000 8000 3 .018202 89250 8000 4 .017849 88750 8250 5 .016975 88500 8000 APRIL THE MAXIMUM 5 AVERAGE CONCENTRATION VALUES No Concentration [µg/m3] X Y 1 .008550 87500 12250 2 .008171 87750 12500 3 .008001 87750 12750 4 .007949 87500 12500 5 .007808 88000 12750

28
MAY THE MAXIMUM 5 AVERAGE CONCENTRATION VALUES No Concentration [µg/m3] X Y 1 .007983 87500 12250 2 .007426 87500 12500 3 .007416 87750 12500 4 .007297 87750 12750 5 .007295 87500 12750 JUNE THE MAXIMUM 5 AVERAGE CONCENTRATION VALUES No Concentration [µg/m3] X Y 1 .019751 88750 8000 2 .017147 89000 8000 3 .015738 88750 8250 4 .015304 88500 8000 5 .014361 89250 8000 JULY THE MAXIMUM 5 AVERAGE CONCENTRATION VALUES No Concentration [µg/m3] X Y 1 .020231 88750 8000 2 .018219 89000 8000 3 .016358 88750 8250 4 .016143 89250 8000 5 .015665 88500 8000 AUGUST THE MAXIMUM 5 AVERAGE CONCENTRATION VALUES No Concentration [µg/m3] X Y 1 .009195 87500 12250 2 .008924 87750 12500 3 .008729 87750 12750 4 .008631 88000 12750 5 .008598 88000 12250

29
SEPTEMBER THE MAXIMUM 5 AVERAGE CONCENTRATION VALUES No Concentration [µg/m3] X Y 1 .008952 88000 12250 2 .008750 88250 13000 3 .008531 88000 12500 4 .008493 88250 12750 5 .008408 88000 12750 OCTOBER THE MAXIMUM 5 AVERAGE CONCENTRATION VALUES No Concentration [µg/m3] X Y 1 .004981 87500 10750 2 .001779 87500 11250 3 .001090 87750 10750 4 .000652 87250 11250 5 .000609 87750 11250 NOVEMBER THE MAXIMUM 5 AVERAGE CONCENTRATION VALUES No Concentration [µg/m3] X Y 1 .005931 87500 10750 2 .001673 87500 11250 3 .000959 87750 11250 4 .000795 87750 10750 5 .000431 87250 11250 DECEMBER THE MAXIMUM 5 AVERAGE CONCENTRATION VALUES No Concentration [µg/m3] X Y 1 .004608 87500 10750 2 .003384 87000 12250 3 .003339 86750 12750 4 .003112 86750 12500 5 .003053 86750 13000

30
ANNUAL THE MAXIMUM 5 AVERAGE CONCENTRATION VALUES No Concentration [µg/m3] X Y 1 .022031 88750 8000 2 .019128 89000 8000 3 .017554 88750 8250 4 .017071 88500 8000 5 .016022 89250 8000
Figure 6. 2 – D Concentration Distribution of Hydrocarbons

31
Figure 7. 3 – D Concentration Distribution of Hydrocarbons
Top Related