


Languages
Pages
Legal


Enterprise Risk Management for Insurance Companies
by George OrrosChief Executive, Universal Health Consultants

2
Enterprise Risk Management – a definition
“ERM is a systematic process, embedded in a company’s system of internal
control (spanning all business activity), to satisfy policies effected by its board of
directors, aimed at fulfilling its business objectives and safeguarding both the
shareholder’s investment and the company’s assets. The purpose of this process is
to manage and effectively control risk appropriately (without stifling
entrepreneurial endeavour) within the company’s overall risk appetite. The
process reflects the nature of risk, which does not respect artificial departmental
boundaries and manages the interdependencies between the risks. Additionally,
the process is accomplished through regular reviews, which are modified when
necessary to reflect the continually evolving business environment.”

3
Corporate Governance – Chairman & Managing Director roles
Policy Formulation and Foresight
Short-term (Board performance) Long-term (Board performance)
Operations review cycle
Policy review cycle
Gov
ern
ance
rev
iew
cyc
le
Ext
erna
lIn
tern
al
Learning Board
Str
ateg
y re
view
cyc
le
Area of responsibility for the chairman
Area of responsibility for the managing director
Accountability
Supervising Management Strategic Thinking

4
Corporate Governance – a simplified learning organisation
Accountability Policy Formulation and Foresight
Supervising Management Strategic Thinking
Short-term (Board performance) Long-term (Board performance)
Operations review cycle
Policy review cycle
Go
ver
na
nce
rev
iew
cy
cle
Ex
tern
al
Learning Board
Str
ate
gy
rev
iew
cy
cle
Inte
rna
l

5
Corporate Governance – a comprehensive learning model
Accountability Policy Formulation and Foresight- to the company - stating purpose- to owners - creating vision and values- to regulators and legislators - developing corporate climate- to other stakeholders and corporate culture- ensuring directoral audits - monitoring the external
environments
Supervising Management Strategic Thinking- overseeing management - positioning in the changing markets performance - setting corporate direction- monitoring budgetary control - reviewing and deciding key resources- reviewing key business results - deciding implementation process- ensuring organisational capability
Short-term (Board performance) Long-term (Board performance)
Operations review cycle
Policy review cycle
Go
ver
na
nce
rev
iew
cy
cle
Ex
tern
al
Business Brain
Str
ate
gy
rev
iew
cy
cle
Inte
rna
l

6
Corporate Governance – Risk and Opportunity Management
Accountability Policy Formulation- to the company - creating the vision- to owners - creating the mission- to regulators - creating values- to legislators - developing culture- to other stakeholders - monitoring the environment
Supervisory Management Strategic Thinking- oversight management - positioning in the changing markets- monitoring budgetary control - setting corporate direction- reviewing key business results - reviewing and deciding key resources- ensuring business capability - deciding the implementation process
Short-term (Board performance) Long-term (Board performance)
Operations review cycle
Policy review cycle
Go
ver
na
nce
rev
iew
cy
cle
Ex
tern
al
Risk and Opportunity Management
Str
ate
gy
rev
iew
cy
cle
Inte
rna
l

7
Risk and Opportunity Management Framework
AnalysisRisk
Management
5. Sources of Risk
4. Risk Management Processes(incremental phases of an iterative process)
Risk Identification
Risk Assessment
Risk Evaluation
Risk Planning
3. Implementation(appointment of external support)
(internal to a business and emanating from the environment)
Internal Processes Business Operating Environment
1. Corporate Governance
(Board oversight)
2. Internal Control
(sound system of internal control)

8
Stages in the Enterprise Risk Management process
A1A2
A3A4
A5A6
Management
Evaluation Risk Planning Risk
Risk Assessment Risk
Analysis Risk Identification
9
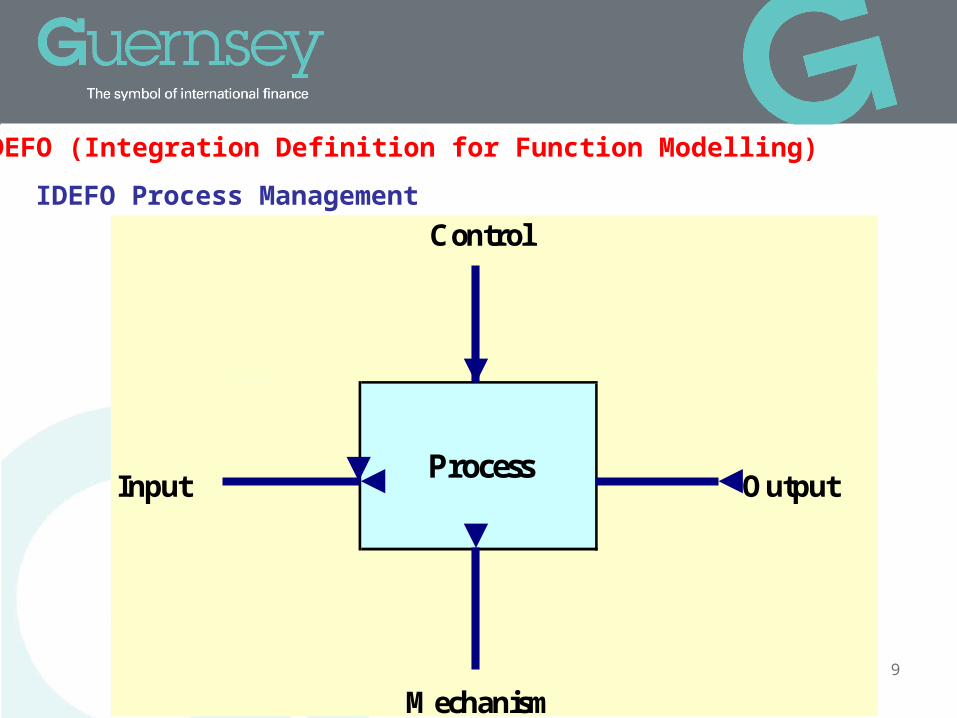
IDEFO Process Management
InputProcess
Control
Mechanism
Output
IDEFO (Integration Definition for Function Modelling)

10
ERM Process - Stage 1: Analysis
INPUTS CONSTRAINTS1 Appointment 1 Business risk management culture2 Business objectives and plan 2 Risk management resources3 Process map and organogram 3 Risk management study parameters4 Value chain 4 Risk management plan5 Audit committee6 Internal controls7 Risk management plan8 Financial reports9 Marketing plan
10 Ratio analysis
MECHANISMS A1 OUTPUTS1 Finance analysis tools 1 Business analysis findings
2 Risk management process diagnostic3 SWOT questions4 PEST questions5 PESTEL analysis6 Risk mapping7 Causal modelling
Analysis

11
ERM Process – Stage 2: Risk Identification CONSTRAINTS
1 Business risk management culture2 Risk management resources3 Risk management study4 Risk management plan
INPUTS1 Business analysis2 Assumptions3 Uncertain events4 Lessons learned5 Issues
MECHANISMS A2 OUTPUTS1 Risk checklist 1 Risk register
2 Risk prompt list3 PEST prompt4 PESTEL prompt5 SWOT prompt6 Risk database7 Process map8 Business risk breakdown structure9 Risk questionnaire
Risk Identification

12
ERM Process – Stage 3: Risk Assessment
CONSTRAINTS1 Risk management resources2 Risk management study parameters3 Risk management plan
INPUTS1 Risk identification2 Risk register3 Profit and loss account4 Balance sheet5 Industry betas
MECHANISMS A3 OUTPUTS1 Probablility distributions 1
2 Probabliity impact matrix
Risk Assessment
Risk register, including assessments

13
ERM Process – Stage 4: Risk Evaluation CONSTRAINTS
1 Risk management resources2 Risk management study parameters3 Risk management plan
INPUTS1 Risk register
MECHANISMS A4 OUTPUTS1 Probability Trees 1 Risk register
2 Expected Monetary Value 2 Modelling results3 Utility Theory 3 Decision trees4 Markov Chain 4 Quantitative results5 Investment appraisal 5 Scenario modelling
6 Sensitivity analysis
Risk Evaluation

14
ERM Process – Stage 5: Risk Planning
CONSTRAINTS1 Risk management resources2 Risk management study parameters3 Risk management plan
INPUTS1 Risk register2 Existing risk policies3 Business risk appetite4 Industry betas
MECHANISMS A5 OUTPUTS1 Risk response flow chart 1 Risk responses
2 Response strategy 2 Updated risk register
Risk Planning

15
ERM Process – Stage 6: Risk Management CONSTRAINTS
1 Business risk management culture2 Risk management resources3 Risk management study parameters4 Risk management plan
INPUTS1 Risk database2 Risk register3 Risk responses
MECHANISMS A6 OUTPUTS1 Meeting agendas 1 Meeting agenda
2 Proformas 2 Report format3 Early warning indicators4 Key performance indicators
Risk Management

16
ERM – External and Internal Sources of Risk
Operational Risk
Technological Risk
Financial Risk
Internal Sources of Risk
Economic Risk
EnvironmentRisk
Social Risk
External Sources of Risk
MarketRisk
LegalRisk
PoliticalRisk

17
ERM implementation should include causal risk mapping ....
High Level Risk Map
Underlying Causes - Internal (management, governance, ownership
Internal processes, people or systems (failed, inadequate)
Risk decisions (inappropriate risk
appetite)
Financial Outcomes (market, reputational,
credit)
Policyholder Harm (losses,
insolvency)
Risk Appetite Decision
Incorrect Evaluation of
Financial Outcomes
Underlying or Trigger Causes - External (wider changes, as well as event or insurance market)
feedback control loop

18
Rare 0.00 < p < 0.05
Unlikely 0.05 < p < 0.30
Likely 0.30 < p < 0.70
Probable 0.70 < p < 0.95
Almost certain 0.95 > p > 1.00
impact > £300M Extreme Extreme Extreme Extreme Extreme
£150M > impact > £300M Severe Extreme Extreme Extreme Extreme
£60M > impact > £150M High Severe Extreme Extreme Extreme
£30M > impact > £60M High Severe Severe Extreme Extreme
£10M > impact > £30M Moderate High Severe Severe Extreme
£1M > impact > £10M Moderate High High High Severe
£0.5M > impact > £1M Low Moderate High High High
£0 > impact > £0.5M Low Low Moderate High High

19
Impact on enterprise value
Rare 0.00 < p < 0.05
Unlikely 0.05 < p < 0.30
Likely 0.30 < p < 0.70
Probable 0.70 < p < 0.95
Almost certain 0.95 > p > 1.00
impact > £300M Extreme Extreme Extreme Extreme Extreme
£150M > impact > £300M Severe Extreme Extreme Extreme Extreme
£60M > impact > £150M High Severe Extreme Extreme Extreme
£30M > impact > £60M High Severe Severe Extreme Extreme
£10M > impact > £30M Moderate High Severe Severe Extreme
£1M > impact > £10M Moderate High High High Severe
£0.5M > impact > £1M Low Moderate High High High
£0 > impact > £0.5M Low Low Moderate High High
Control effectiveness → High Medium Low Opportunity
Likelihood
2
3 4
1
5
6
7
8
9
10
11
12
Risk 7
Inherent Residual Risk
Risk 6

20
Low Risk High Risk
50% 50% 50%
35% 65% 35% 65% 35% 65%
20% 80% 20% 80% 20% 80%
0% 100% 0% 100% 0% 100%
Key Performance Indicator 1 Key Performance Indicator 2 Key Performance Indicator 3
Current value 42.1% Target value 40.0% Current value 27.5% Target value 45.0% Current value 59.1% Target value 49.0%
Variance -2.1% Variance 17.5% Variance -10.1%
50% 50% 50%
35% 65% 35% 65% 35% 65%
20% 80% 20% 80% 20% 80%
0% 100% 0% 100% 0% 100%
Key Performance Indicator 4 Key Performance Indicator 5 Key Performance Indicator 6
Current value 11.0% Target value 47.0% Current value 79.0% Target value 50.0% Current value 92.7% Target value 48.0%
Variance 36.0% Variance -29.0% Variance -44.7%

21
Risks of Relying on the Unconditional Benefits of Past Experience
Consider the following pearls of wisdom that were allegedly voiced by a famous ship’s captain:
“But in all my experience, I have never been involved in any accident … of any sort worth speaking about. I have seen but one vessel in distress in all my years at sea. I never saw a wreck and never have been wrecked nor was I ever in any predicament that threatened to end in disaster of any sort”.Source: Captain E.J. Smith (1907)

22

23
The problem of extrapolating too much from past events

24
The problem of inductive knowledge

25
Risk response strategies for unexpected events
Top Related