


Languages
Pages
Legal


Enrollment UpdateAcademic Affairs Committee Meeting
October 17, 2012
Dr. Thomas J. LeBlanc
ENROLLMENT UPDATE
PRESENTED AT THE FACULTY SENATE MEETINGOCTOBER 17, 2012
THOMAS J. LEBLANCEXECUTIVE VICE PRESIDENT & PROVOST

2
Numbers of Applied, Accepted, and Enrolled New Freshmen
Note: Students who began studies during the prior summer were included in fall data.Source: Student Admission System
2000 2001 2002 2003 2004 2005 2006 2007 2008 2009 2010 2011 20120
10,000
20,000
30,000
Applied Accepted Enrolled
3
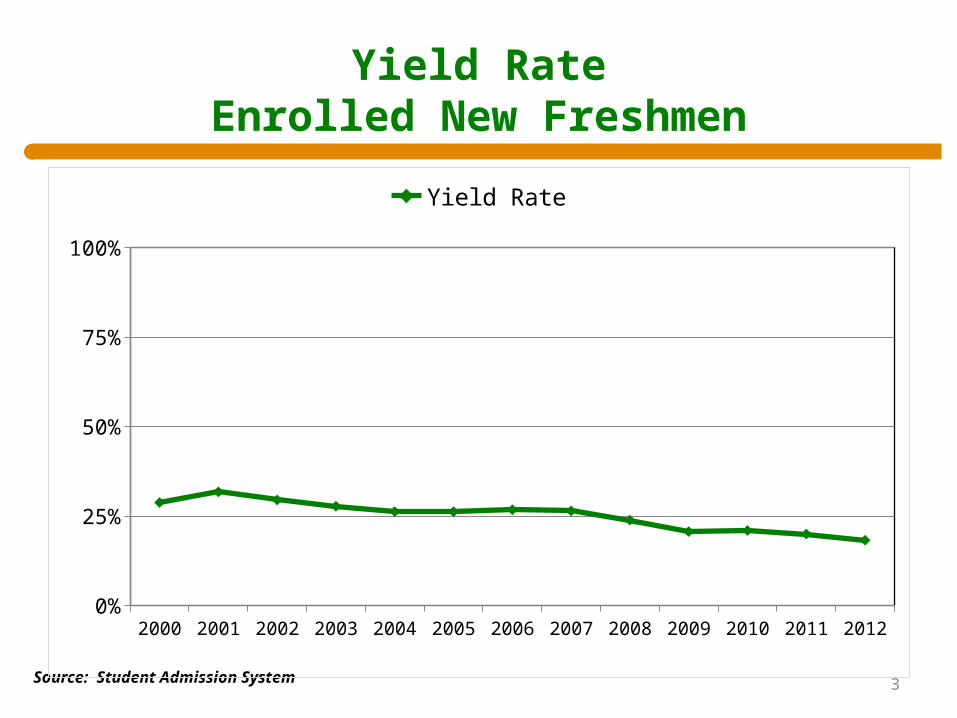
Yield RateEnrolled New Freshmen
Source: Student Admission System
2000 2001 2002 2003 2004 2005 2006 2007 2008 2009 2010 2011 20120%
25%
50%
75%
100%
Yield Rate

4
Yield Rate by Official SAT RangeEnrolled New Freshmen
Source: Student Admission System
2000 2001 2002 2003 2004 2005 2006 2007 2008 2009 2010 2011 20120%
25%
50%
75%
100%
< 1000 1000 - 1199 1200 - 1399 1400 - 1600
Percent of Students Reporting
5
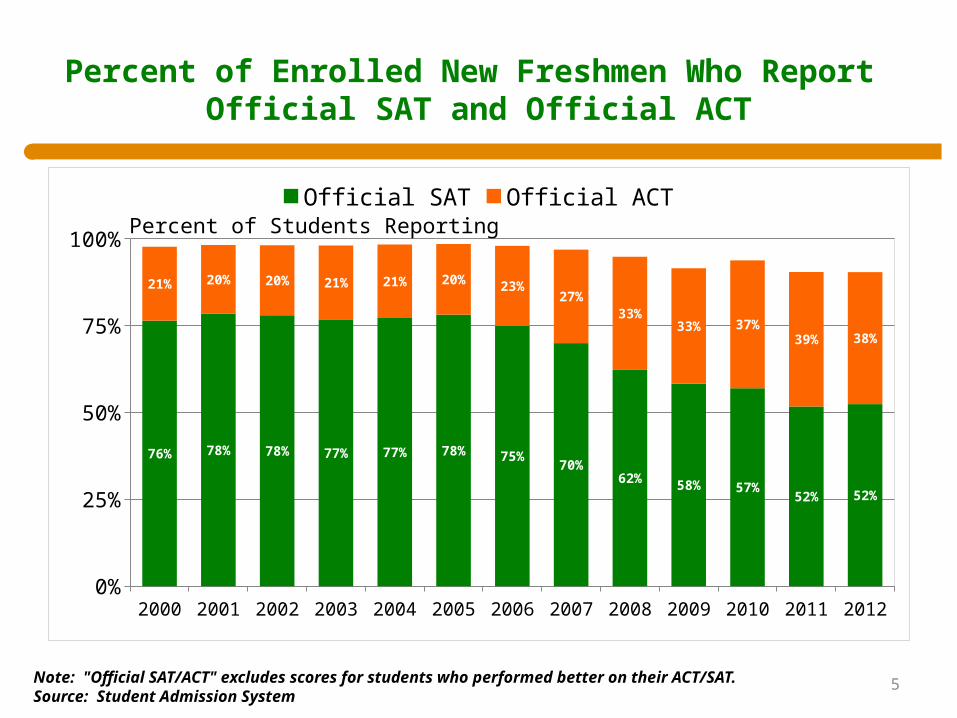
Percent of Enrolled New Freshmen Who Report Official SAT and Official ACT
Note: "Official SAT/ACT" excludes scores for students who performed better on their ACT/SAT.Source: Student Admission System
2000 2001 2002 2003 2004 2005 2006 2007 2008 2009 2010 2011 20120%
25%
50%
75%
100%
76% 78% 78% 77% 77% 78% 75%70%
62% 58% 57%52% 52%
21% 20% 20% 21% 21% 20% 23%27%
33%33% 37%
39% 38%
Official SAT Official ACTPercent of Students Reporting
6
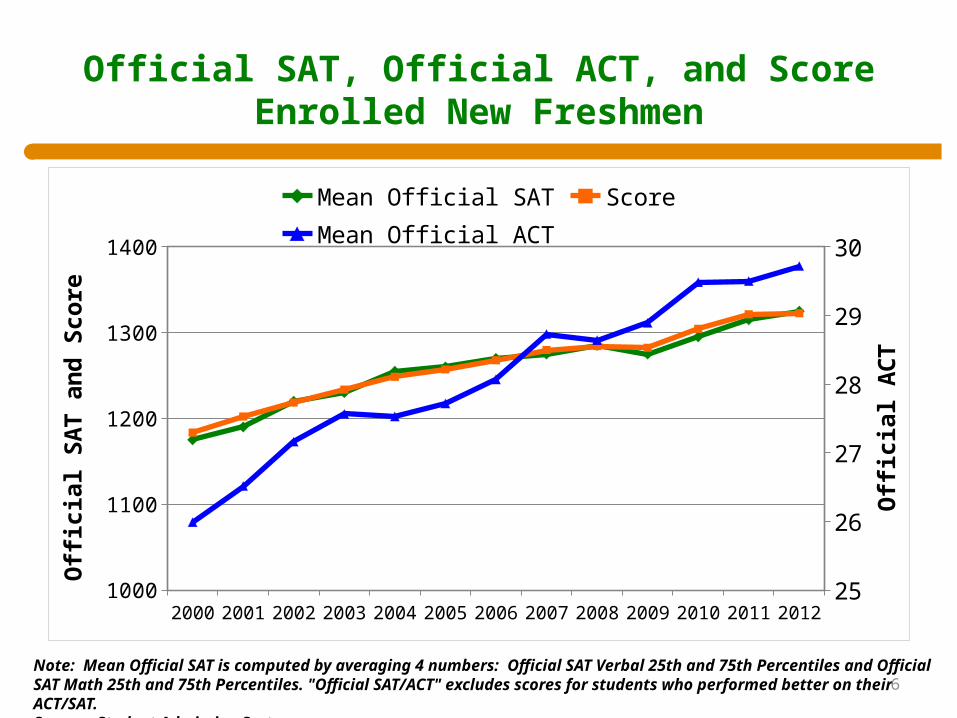
Official SAT, Official ACT, and ScoreEnrolled New Freshmen
Note: Mean Official SAT is computed by averaging 4 numbers: Official SAT Verbal 25th and 75th Percentiles and Official SAT Math 25th and 75th Percentiles. "Official SAT/ACT" excludes scores for students who performed better on their ACT/SAT. Source: Student Admission System
2000 2001 2002 2003 2004 2005 2006 2007 2008 2009 2010 2011 20121000
1100
1200
1300
1400
25
26
27
28
29
30
Mean Official SAT Score Mean Official ACT
Offi
cial
SA
T an
d Sc
ore
Offi
cial
ACT

7
Percent of Enrolled New Freshmen Who Report High School Percentile and High School GPA
Source: Student Admission System
2000 2001 2002 2003 2004 2005 2006 2007 2008 2009 2010 2011 20120%
25%
50%
75%
100%
High School Percentile High School GPA
Percent of Students Reporting

8
High School Percentile and High School GPAEnrolled New Freshmen
Source: Student Admission System
2000 2001 2002 2003 2004 2005 2006 2007 2008 2009 2010 2011 20120%
25%
50%
75%
100%
3.8
3.9
4.0
4.1
4.2
4.3
Mean High School Percentile Mean High School GPA
Mea
n H
igh
Scho
ol P
erce
ntile
Mea
n H
igh
Scho
ol G
PA
9
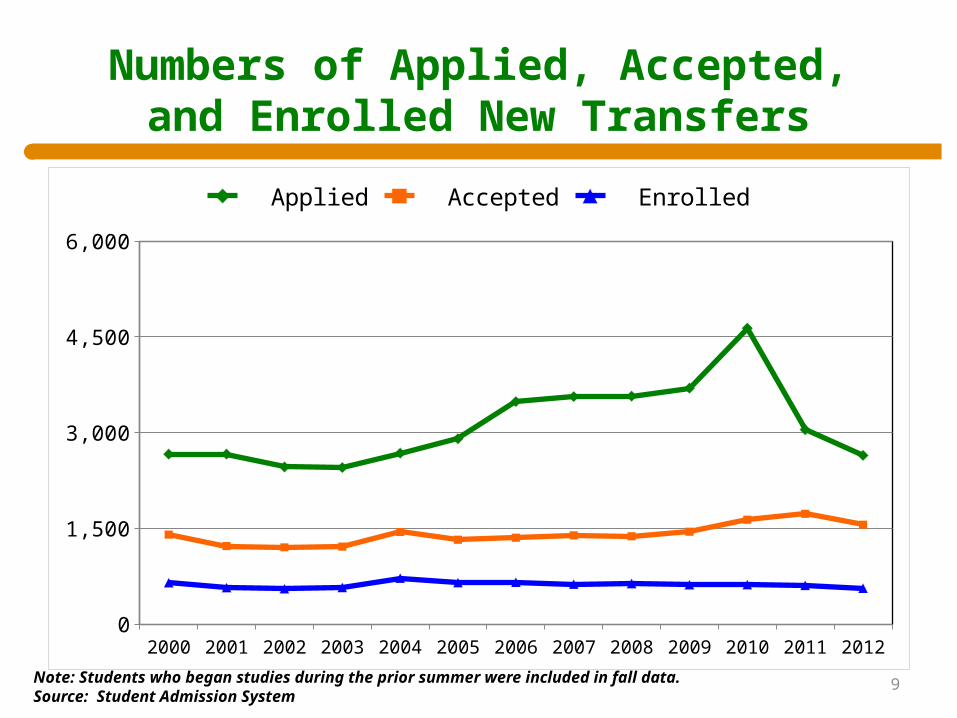
Numbers of Applied, Accepted, and Enrolled New Transfers
Note: Students who began studies during the prior summer were included in fall data.Source: Student Admission System
2000 2001 2002 2003 2004 2005 2006 2007 2008 2009 2010 2011 20120
1,500
3,000
4,500
6,000
Applied Accepted Enrolled
10
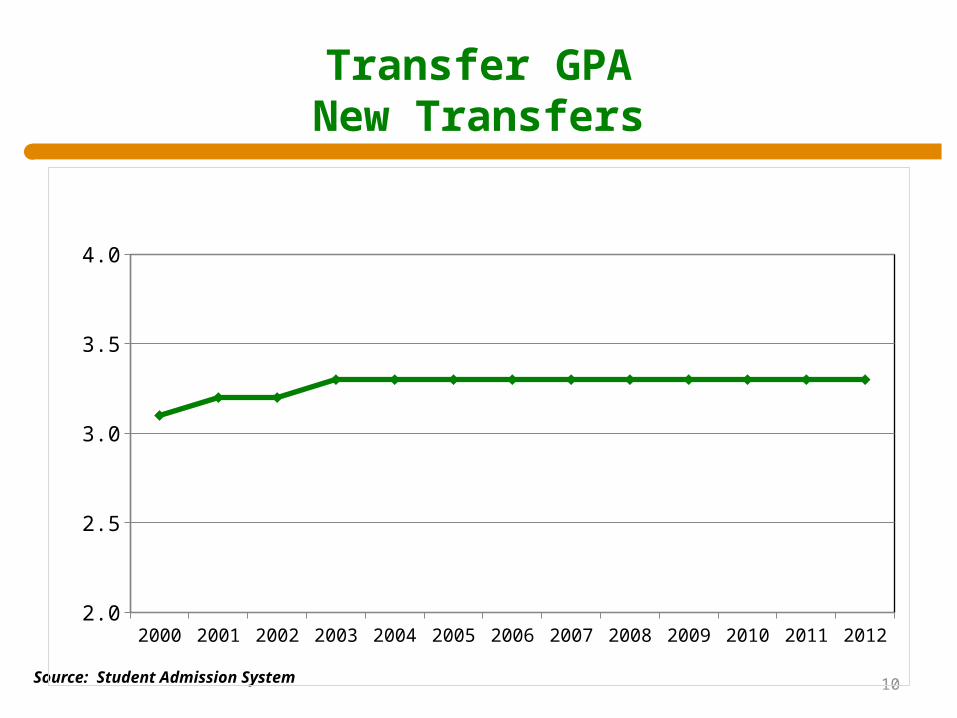
Transfer GPANew Transfers
Source: Student Admission System
2000 2001 2002 2003 2004 2005 2006 2007 2008 2009 2010 2011 20122.0
2.5
3.0
3.5
4.0

11
Fall to Fall Benchmark Retention Rate
Note: Percent is the percent who returned/graduated, adjusted for deceased students.Source: PIR Retention Rate (Benchmark) Database
2000-2001
2001-2002
2002-2003
2003-2004
2004-2005
2005-2006
2006-2007
2007-2008
2008-2009
2009-2010
2010-2011
2011-2012
70%
80%
90%
100%
New Freshmen New Transfers
Percent of Full-Time New Freshmen and New Transfers Returning or Graduating
12
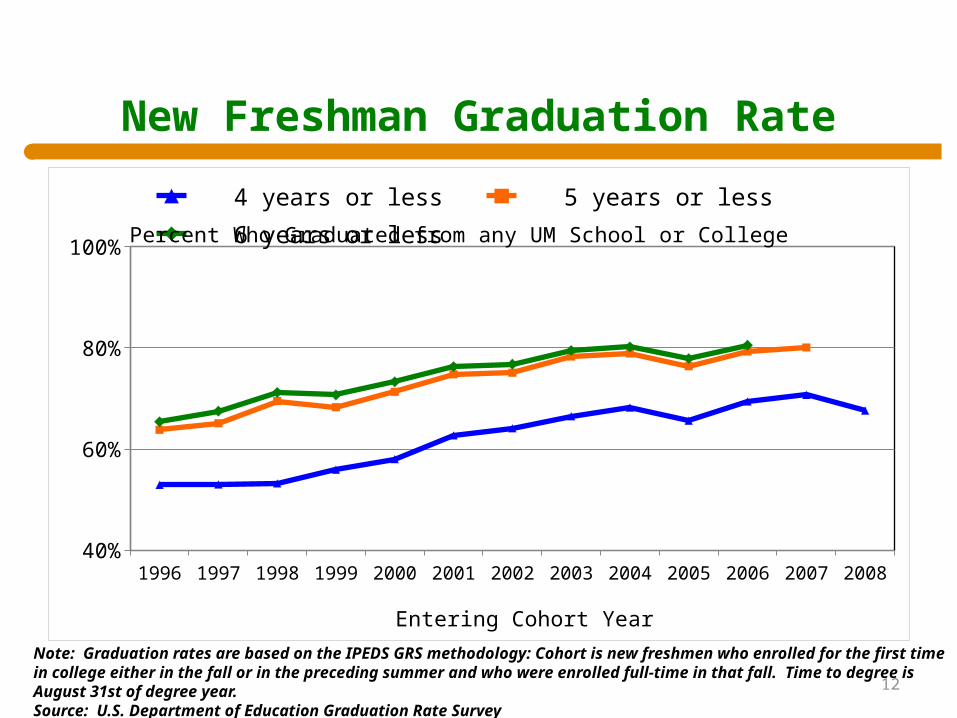
New Freshman Graduation Rate
Note: Graduation rates are based on the IPEDS GRS methodology: Cohort is new freshmen who enrolled for the first time in college either in the fall or in the preceding summer and who were enrolled full-time in that fall. Time to degree is August 31st of degree year.Source: U.S. Department of Education Graduation Rate Survey
1996 1997 1998 1999 2000 2001 2002 2003 2004 2005 2006 2007 200840%
60%
80%
100%
4 years or less 5 years or less 6 years or less
Entering Cohort Year
Percent Who Graduated from any UM School or College

15
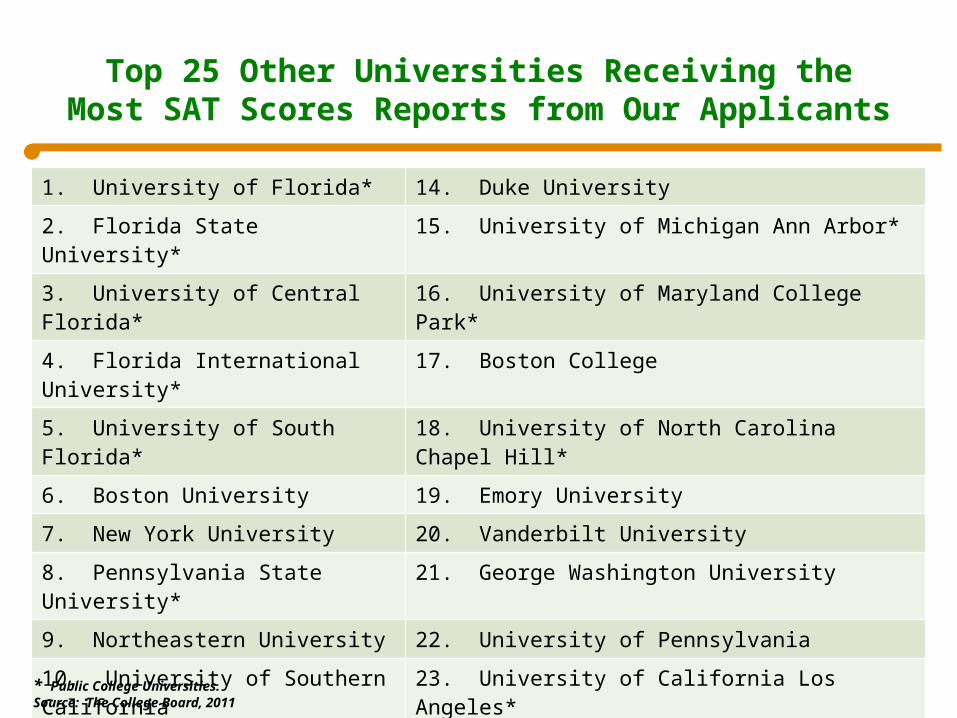
Top 25 Other Universities Receiving the Most SAT Scores Reports from Our Applicants
Year Published
1. University of Florida* 14. Duke University
2. Florida State University* 15. University of Michigan Ann Arbor*
3. University of Central Florida* 16. University of Maryland College Park*
4. Florida International University* 17. Boston College
5. University of South Florida* 18. University of North Carolina Chapel Hill*
6. Boston University 19. Emory University
7. New York University 20. Vanderbilt University
8. Pennsylvania State University* 21. George Washington University
9. Northeastern University 22. University of Pennsylvania
10. University of Southern California 23. University of California Los Angeles*
11. Tulane University 24. Cornell University
12. Florida Atlantic University* 25. Columbia University
13. Syracuse University
* Public College Universities.Source: The College Board, 2011

Top 10 Private Universities Receiving the Most SAT Scores Reports from Our Applicants
1. Boston University
2. New York University
3. Northeastern University
4. University of Southern California
5. Tulane University
6. Syracuse University
7. Duke University
8. Boston College
9. Emory University
10. Vanderbilt University
Source: The College Board, 2011 16
Top Related