


Languages
Pages
Legal

engineering.tomorrow.together.Interim report 1st half 2016 /2017October 1, 2016 – March 31, 2017thyssenkrupp AG

thyssenkrupp interim report 1st half 2016 /2017
thyssenkrupp in figures
2
thyssenkrupp in figures
GROUP TOTAL
1st halfended
March 31,2016
1st halfended
March 31,2017 Change in %
2nd quarterended
March 31,2016
2nd quarterended
March 31,2017 Change in %
Order intake million € 18,837 21,948 3,111 17 9,027 11,993 2,966 33
Net sales million € 19,400 21,084 1,684 9 9,852 10,998 1,146 12
EBIT 1 million € 474 324 798 -- 281 564 846 --
EBIT margin % 2.4 1.5 4.0 — 2.9 5.1 8.0 —
Adjusted EBIT 1 million € 560 756 196 35 326 427 101 31
Adjusted EBIT margin % 2.9 3.6 0.7 — 3.3 3.9 0.6 —
EBT million € 185 580 765 -- 151 703 855 --
Net income/ loss million € 9 855 846 -- 45 870 915 --
attributable to thyssenkrupp AG'sshareholders million € 37 871 909 -- 61 879 940 --
Earnings per share EPS € 0.07 1.54 1.61 -- 0.11 1.55 1.66 --
Operating cash flows million € 703 1,340 636 90 105 110 215 ++
Cash flow for investments million € 546 726 180 33 293 364 71 24
Cash flow from divestments million € 31 59 27 88 27 38 12 45
Free cash flow million € 1,218 2,007 789 65 371 216 156 42
Free cash flow before M&A million € 1,212 1,949 737 61 365 212 153 42
Net financial debt March 31 million € 4,816 5,760 945 20 4,816 5,760 945 20
Total equity March 31 million € 2,753 2,304 450 16 2,753 2,304 450 16
Gearing March 31 % 174.9 250.0 75.1 — 174.9 250.0 75.1 —
Employees March 31 155,453 158,584 3,131 2 155,453 158,584 3,131 2
1 See reconciliation in segment reporting Note 07 .

thyssenkrupp interim report 1st half 2016 /2017
thyssenkrupp in figures
3
1 See reconciliation in the analysis of the statement of cash flows.
In the context of the Strategic Way Forward, thyssenkrupp reached agreement with Ternium in
February 2017 on the sale of the Brazilian steel mill CSA. The sale is subject to the approval of the
competition authorities and is planned to be completed by September 30, 2017. The transaction
meets the criteria of IFRS 5 for reporting the Steel Americas business area as a discontinued
operation.
CONTINUING OPERATIONS
1st halfended
March 31,2016
1st halfended
March 31,2017 Change in %
2nd quarterended
March 31,2016
2nd quarterended
March 31,2017 Change in %
Order intake million € 18,282 21,244 2,962 16 8,791 11,643 2,852 32
Net sales million € 18,827 20,335 1,508 8 9,588 10,617 1,029 11
EBIT million € 618 501 118 19 341 313 29 8
EBIT margin % 3.3 2.5 0.8 — 3.6 2.9 0.6 —
Adjusted EBIT million € 699 703 4 1 390 412 22 6
Adjusted EBIT margin % 3.7 3.5 0.3 — 4.1 3.9 0.2 —
EBT million € 338 283 55 16 206 208 2 1
Income/ loss net of tax million € 162 58 104 64 108 64 44 41
attributable to thyssenkrupp AG'sshareholders million € 141 42 99 70 97 55 42 43
Earnings per share EPS € 0.25 0.07 0.18 72 0.17 0.10 0.07 41
Operating cash flows million € 595 1,281 686 -- 67 170 237 ++
Cash flow for investments million € 491 634 143 29 267 346 79 30
Cash flow from divestments million € 31 54 23 77 26 34 8 32
Free cash flow 1 million € 1,055 1,861 806 76 308 142 166 54
Free cash flow before M&A 1 million € 1,049 1,858 809 77 302 139 163 54
Employees March 31 151,682 154,431 2,749 2 151,682 154,431 2,749 2

thyssenkrupp interim report 1st half 2016 /2017
thyssenkrupp in figures
4
1 See reconciliation in segment reporting Note 07 .
Order intakemillion €
Net salesmillion €
EBITmillion €
Adjusted EBIT 1
million €
2nd quarterended
March 31,2016
2nd quarterended
March 31,2017
2nd quarterended
March 31,2016
2nd quarterended
March 31,2017
2nd quarterended
March 31,2016
2nd quarterended
March 31,2017
2nd quarterended
March 31,2016
2nd quarterended
March 31,2017
Components Technology 1,669 1,979 1,688 1,936 76 66 86 101
Elevator Technology 1,832 2,111 1,752 1,868 171 168 186 207
Industrial Solutions 644 1,959 1,609 1,282 152 20 153 23
Materials Services 2,922 3,683 3,005 3,649 3 93 10 121
Steel Europe 2,183 2,442 1,925 2,371 56 91 65 92
Corporate 36 56 54 67 122 117 117 123
Consolidation 494 587 445 555 6 8 8 8
Continuing operations 8,791 11,643 9,588 10,617 341 313 390 412
Steel Americas 286 440 325 470 61 878 65 14
Consolidation 50 90 61 90 1 0 0 0
Group Total 9,027 11,993 9,852 10,998 281 564 326 427
1 See reconciliation in segment reporting Note 07 .
THYSSENKRUPP STOCK / ADR MASTER DATA AND KEY FIGURES
ISIN Number of shares total shares 565,937,947
Shares Frankfurt, Düsseldorf stock exchanges DE 000 750 0001 Closing price end March 2017 € 22.96
ADRs over-the-counter trading US88629Q2075 Stock exchange value end March 2017 million € 12,993
Symbols
Shares TKA
ADRs TKAMY
BUSINESS AREAS
Order intakemillion €
Net salesmillion €
EBIT 1
million €Adjusted EBIT 1
million € Employees
1st halfended
March 31,2016
1st halfended
March 31,2017
1st halfended
March 31,2016
1st halfended
March 31,2017
1st halfended
March 31,2016
1st halfended
March 31,2017
1st halfended
March 31,2016
1st halfended
March 31,2017
March 31,2016
March 31,2017
Components Technology 3,318 3,738 3,338 3,678 146 124 157 176 30,118 31,770
Elevator Technology 3,824 4,014 3,621 3,749 364 352 390 422 51,532 52,378
Industrial Solutions 2,174 3,118 3,115 2,761 242 33 244 64 19,575 19,349
Materials Services 5,768 6,814 5,827 6,681 2 131 13 173 19,791 19,800
Steel Europe 4,029 4,521 3,649 4,279 106 116 115 119 27,368 27,400
Corporate 93 93 114 125 255 243 234 239 3,298 3,734
Consolidation 923 1,055 837 938 14 11 14 11
Continuing operations 18,282 21,244 18,827 20,335 618 501 699 703 151,682 154,431
Steel Americas 657 873 675 917 145 826 139 51 3,771 4,153
Consolidation 102 168 102 168 0 1 0 1 0 0
Group Total 18,837 21,948 19,400 21,084 474 324 560 756 155,453 158,584

thyssenkrupp interim report 1st half 2016 /2017
Contents
Contents
02 thyssenkrupp in figures
06 Interim management report
06 Report on the economic position
06 Summary
06 Macro and sector environment
09 Group and business area review
14 Results of operations and financial
position
19 Compliance
19 Employees
20 Technology and innovations
21 Subsequent events
21 Forecast, opportunity and risk report
21 2016 / 2017 forecast
23 Opportunities and risks
24 Condensed interim financial
statements
25 Consolidated statement of
financial position
27 Consolidated statement of income
28 Consolidated statement of
comprehensive income
29 Consolidated statement of changes in
equity
30 Consolidated statement of cash flows
32 Selected notes to the consolidated
financial statements
47 Review report
48 Responsibility statement
49 Additional information
49 Contact and 2017 / 2018
financial calendar
Our fiscal year begins on October 1 and ends on
September 30 of the following year.
thyssenkrupp interim report 1st half 2016 /2017
Interim management report Report on the economic position
6
Report on the economic position
Summary
Positive trend continued in 2nd quarter: Strategic Way Forward with pleasing progress inGroup transformation and growth■ Important milestone reached in transformation into strong industrial group: Sale of Brazilian steelmill CSA to Ternium concluded Steel Americas exit
– Purchase price €1.5 billion enterprise value ; with closing of the transaction, correspondingreduction in net financial debt and clear reduction in complexity and volatility
– This transaction leads to a negative income effect of around €0.9 billion in the 2nd quarter;improvement in gearing on closing
– Signing took place in February 2017, transfer to take retroactive effect from September 30, 2016– Sale subject to the approval of the competent competition authorities; aim is to close thetransaction by September 30, 2017, until which time Steel Americas will be reported as a dis-
continued operation■ Continuing operations on growth track: order intake and sales clearly up year-on-year■ All capital goods businesses and all materials businesses with double-digit growth rates in 2nd-quarter order intake; Components Technology and Elevator Technology with new record highs,
Industrial Solutions with highest orders in three years■ Capital goods businesses overall and all materials businesses with sales growth■ €450 million EBIT effects from “impact” increase efficiency in 1st half■ Group and continuing operations with adjusted EBIT higher year-on-year■ Group’s net income in reporting period impacted by negative earnings effect at Steel Americas■ As expected, free cash flow of Group and continuing operations temporarily clearly negative due toincrease in net working capital, but already showing clear quarter-on-quarter and year-on-year
improvement in 2nd quarter■ Full-year forecast revised on account of good operating performance and dislocations on the rawmaterial markets see forecast report
Macro and sector environment
Global economic growth will accelerate slightly in 2017 – outlook remains marked bygreat uncertainty■ Compared with start of fiscal year, further stabilization of global economy despite high politicaluncertainty
■ Industrialized countries: Continued, slightly faster upturn thanks to continuing expansionary mone-tary policy and hope of fiscal support in the USA
■ Emerging economies: Increasing momentum, in part due to higher raw material prices and end ofrecession in Brazil and Russia
Interim management report

thyssenkrupp interim report 1st half 2016 /2017
Interim management report Report on the economic position
7
■ But risks and uncertainties for global economy remain exceptionally high geopolitical flashpoints,impact of new US economic policy and interest rate liftoff in USA, Brexit negotiations, elections in
major EU member states, volatility of oil and raw material prices, high volatility in Chinese finan-
cial and real estate sectors
GROSS DOMESTIC PRODUCT
Real change compared to previous year in % 2016 20171
Euro zone 1.7 1.5
Germany 1.9 1.5
Russia 0.2 1.0
Rest of Central/Eastern Europe 2.4 2.7
USA 1.6 2.3
Brazil 3.6 0.3
Japan 1.0 1.1
China 6.7 6.5
India 7.0 7.2
Middle East & Africa 2.4 2.9
World 2.9 3.3
1 ForecastSources: IHS Markit, Oxford Economics, national associations, own estimates
Automotive■ Continued slight growth in global sales and production of cars and light trucks in 2017 from highprior-year level
■ Europe: Impact of Brexit very small to date■ NAFTA: Uncertainties about impact of new US economic policy on regional and internationalsupply chains
■ China: Sales and production of cars with double-digit growth in 2016, benefiting in part frompull-forward effects due to reduced tax breaks; further growth expected in 2017 with reduced
government incentives■ Heavy trucks: Further increase in global production expected for 2017, driven by Asian markets,particularly China; Europe stable; NAFTA Class 8 remains weak, turnaround expected end of 2017
Machinery■ Germany: Forecast for 2017 raised slightly, in particular demand from abroad expected to increase■ USA: Low investment in oil and gas production ended■ China: Growth in 2017 to slow faster than expected at start of fiscal year; lower government fiscalincentives for infrastructure and state-owned companies; however, planned transformation to
high-tech nation should keep growth at a solid level

thyssenkrupp interim report 1st half 2016 /2017
Interim management report Report on the economic position
8
Construction■ Germany: Further slight increase in growth expected in 2017; driver remains housing construc-tion, but public sector and commercial construction also solid
■ USA: Continued solid growth, potential additional stimulus from new administration’s fiscalmeasures
■ China and India: In China government measures to cool down real estate market taking effect in2017; continuing urbanization to provide further important impetus in India
IMPORTANT SALES MARKETS
2016 20171
Vehicle production, million cars and light trucks
World 90.8 92.1
Western Europe incl. Germany 14.6 14.7
Germany 5.9 5.7
USA 12.0 11.2
Mexico 3.5 4.1
Japan 8.8 9.0
China 27.0 27.7
India 4.1 4.3
Brazil 2.0 2.2
Machinery production, real, in % versus prior year
Germany 0.1 1.0
USA 2.7 3.4
Japan 1.5 0.9
China 4.5 3.8
Construction output, real, in % versus prior year
Germany 1.0 2.5
USA 4.5 5.8
China 6.6 4.6
India 2.7 5.5
1 Forecast
Steel■ Global finished steel demand continuing to increase slightly in 2017; growth focused on emerg-ing economies, with stagnation expected for China
■ EU carbon flat steel market up slightly year-on-year in first two months of 2017 – with importsagain showing higher growth overall: slight decline in volumes from China, but significantly high-
er imports from other third countries■ Market environment remains extremely challenging, particularly on account of global overcapaci-ties and highly volatile raw material prices
thyssenkrupp interim report 1st half 2016 /2017
Interim management report Report on the economic position
9
Group and business area review
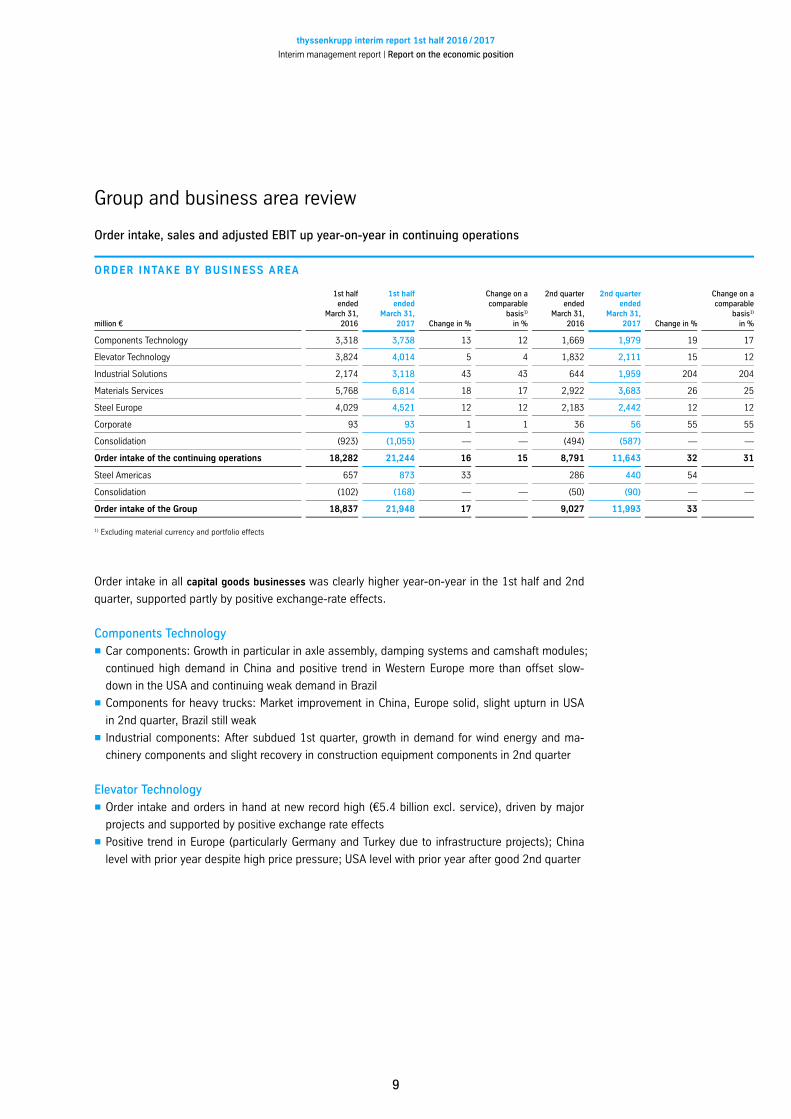
Order intake, sales and adjusted EBIT up year-on-year in continuing operations
ORDER INTAKE BY BUSINESS AREA
million €
1st halfended
March 31,2016
1st halfended
March 31,2017 Change in %
Change on acomparable
basis1
in %
2nd quarterended
March 31,2016
2nd quarterended
March 31,2017 Change in %
Change on acomparable
basis1
in %
Components Technology 3,318 3,738 13 12 1,669 1,979 19 17
Elevator Technology 3,824 4,014 5 4 1,832 2,111 15 12
Industrial Solutions 2,174 3,118 43 43 644 1,959 204 204
Materials Services 5,768 6,814 18 17 2,922 3,683 26 25
Steel Europe 4,029 4,521 12 12 2,183 2,442 12 12
Corporate 93 93 1 1 36 56 55 55
Consolidation 923 1,055 — — 494 587 — —
Order intake of the continuing operations 18,282 21,244 16 15 8,791 11,643 32 31
Steel Americas 657 873 33 286 440 54
Consolidation 102 168 — — 50 90 — —
Order intake of the Group 18,837 21,948 17 9,027 11,993 33
1 Excluding material currency and portfolio effects
Order intake in all capital goods businesses was clearly higher year-on-year in the 1st half and 2nd
quarter, supported partly by positive exchange-rate effects.
Components Technology■ Car components: Growth in particular in axle assembly, damping systems and camshaft modules;continued high demand in China and positive trend in Western Europe more than offset slow-
down in the USA and continuing weak demand in Brazil■ Components for heavy trucks: Market improvement in China, Europe solid, slight upturn in USAin 2nd quarter, Brazil still weak
■ Industrial components: After subdued 1st quarter, growth in demand for wind energy and ma-chinery components and slight recovery in construction equipment components in 2nd quarter
Elevator Technology■ Order intake and orders in hand at new record high €5.4 billion excl. service , driven by majorprojects and supported by positive exchange rate effects
■ Positive trend in Europe particularly Germany and Turkey due to infrastructure projects ; Chinalevel with prior year despite high price pressure; USA level with prior year after good 2nd quarter

thyssenkrupp interim report 1st half 2016 /2017
Interim management report Report on the economic position
10
Industrial Solutions■ Clear year-on-year increase in 1st half; highest order intake in three years in 2nd quarter con-firms turnaround in order intake and strong project pipeline
■ Marine Systems: Strong 1st half thanks to major submarine order in 2nd quarter; nominated asexclusive strategic partner for Norwegian/German submarine program
■ Cement plants: Medium-size order in Algeria in 1st quarter and pleasing demand for expansioncontracts
■ Mining: Medium-size and smaller orders clearly higher year-on-year incl. belt conveyor systems,bucket wheel excavators, and coal handling facility in Asia as well as biomass power plant in
Australia■ Chemical plant engineering: Major projects at advanced stage of negotiation■ System Engineering: Several orders for body-in-white lines and test systems from leading GermanOEMs in Europe and Asia; but temporary decline overall with full-year outlook remaining positive
Orders in the materials businesses Materials Services and Steel Europe were clearly up year-on-year
in a volatile environment thanks in particular to higher prices, with significantly increased spot
prices on materials markets.
Steel Americas discontinued operation clearly up from prior-year due to higher prices.
NET SALES BY BUSINESS AREA
million €
1st halfended
March 31,2016
1st halfended
March 31,2017 Change in %
Change on acomparable
basis1
in %
2nd quarterended
March 31,2016
2nd quarterended
March 31,2017 Change in %
Change on acomparable
basis1
in %
Components Technology 3,338 3,678 10 9 1,688 1,936 15 13
Elevator Technology 3,621 3,749 4 2 1,752 1,868 7 4
Industrial Solutions 3,115 2,761 11 12 1,609 1,282 20 21
Materials Services 5,827 6,681 15 14 3,005 3,649 21 20
Steel Europe 3,649 4,279 17 17 1,925 2,371 23 23
Corporate 114 125 9 9 54 67 24 23
Consolidation 837 938 — — 445 555 — —
Sales of the continuing operations 18,827 20,335 8 7 9,588 10,617 11 9
Steel Americas 675 917 36 325 470 44
Consolidation 102 168 — 61 90 —
Sales of the Group 19,400 21,084 9 9,852 10,998 12
1 Excluding material currency and portfolio effects
Overall sales in the capital goods businesses were slightly higher year-on-year.■ Rising sales at Components Technology particularly for auto components and Elevator Technol-ogy particularly positive trend in the USA, China and Korea outweighed declining sales at In-
dustrial Solutions lower number of milestone billings in plant engineering and at Marine Systems
The materials businesses Materials Services and Steel Europe increased their sales significantly
year-on-year due to higher volumes and prices

thyssenkrupp interim report 1st half 2016 /2017
Interim management report Report on the economic position
11
Materials Services■ Continuation of price recovery in almost all product segments, but with decreasing momentum in parts■ Overall materials volumes higher year-on-year 4.9 million tons shipments; up 3%■ Stable warehousing and service business; significant growth at auto-related service centers, inparticular also due to new service centers in Hungary and Spain
■ Gains in global materials trading■ Gains at AST due to higher volumes and prices■ Raw material trading volumes down from 1.6 million tons to 0.6 million tons; stronger focus onhigher-value, higher-margin products
Steel Europe■ Higher sales due to higher average net selling prices and rising shipments 5.7 million tons; up10% , but lower volumes in grain-oriented electrical steel and heavy plate
■ Selling prices rising significantly over the course of the reporting period, also higher year-on-yearon average for the 1st half
Steel Americas discontinued operation achieved higher sales due to higher prices, with shipments
temporarily lower 2.0 million tons; down 9% .
ADJUSTED EBIT BY BUSINESS AREA
million €
1st halfended
March 31,2016
1st halfended
March 31,2017 Change in %
2nd quarterended
March 31,2016
2nd quarterended
March 31,2017 Change in %
Components Technology 157 176 12 86 101 18
Elevator Technology 390 422 8 186 207 11
Industrial Solutions 244 64 74 153 23 85
Materials Services 13 173 ++ 10 121 ++
Steel Europe 115 119 3 65 92 42
Corporate 234 239 2 117 123 6
Consolidation 14 11 — 8 8 —
Adjusted EBIT of the continuingoperations 699 703 1 390 412 6
Steel Americas 139 51 ++ 65 14 ++
Consolidation 0 1 — 0 0 —
Adjusted EBIT of the Group 1 560 756 35 326 427 31
1 See reconciliation in segment reporting Note 07 .
In the capital goods businesses as a whole adjusted EBIT was lower year-on-year despite sustaina-
ble efficiency and cost reduction measures.■ Continued growth at Components Technology and Elevator Technology could not offset decline atIndustrial Solutions
Components Technology■ Adjusted EBIT again higher year-on-year■ Improvements in car components outweighed declines in industrial components; margin slightlyhigher year-on-year at 4.8% in 1st half and 5.2% in 2nd quarter

thyssenkrupp interim report 1st half 2016 /2017
Interim management report Report on the economic position
12
Elevator Technology■ Adjusted EBIT and margin in 2nd quarter higher year-on-year for the 18th quarter in succession■ Margin at 11.3% in 1st half and 11.1% in 2nd quarter 0.5 points higher year-on-year thanks toperformance program
Industrial Solutions■ Adjusted EBIT down sharply year-on-year, reflecting lower sales and lower-margin project mile-stones as well as partial underutilization
In the materials businesses Materials Services and Steel Europe adjusted EBIT was significantly
higher year-on-year overall, also supported by cost-saving programs.
Materials Services■ Positive price trend and continued earnings-securing measures led to strong earnings improve-ment in all units
■ AST with significantly higher earnings contribution, reflecting further sustainable restructuringsuccess as well as positive price trend
Steel Europe■ 1st half earnings higher year-on-year mainly due to higher volumes; particularly in the1st quarter sharply rising raw material costs plus earnings impact of blast furnace reline at HKM
■ Significant earnings improvement in 2nd quarter, both quarter-on-quarter and year-on-year,primarily due to higher selling prices
At Corporate adjusted EBIT was largely unchanged year-on-year and continues to include project
expenditures in connection with the digital initiatives for IT infrastructure standardization and data
and process harmonization.
At Steel Americas discontinued operation the positive price trend, cost reduction measures and
valuation effects on input tax credits outweighed lower shipments and higher raw material costs
and negative cost effects from the stronger Brazilian real.

thyssenkrupp interim report 1st half 2016 /2017
Interim management report Report on the economic position
13
Earnings impacted by special items
SPECIAL ITEMS BY BUSINESS AREA
million €
1st halfended
March 31,2016
1st halfended
March 31,2017 Change
2nd quarterended
March 31,2016
2nd quarterended
March 31,2017 Change
Components Technology 10 52 42 10 35 25
Elevator Technology 26 71 45 16 39 24
Industrial Solutions 2 32 30 1 3 1
Materials Services 12 41 29 7 28 21
Steel Europe 10 3 7 9 1 8
Corporate 21 4 17 6 7 12
Consolidation 0 0 — 0 0 —
Special items from continuingoperations 81 203 122 49 99 50
Steel Americas 5 877 872 4 892 897
Consolidation 0 0 — 0 0 —
Total special items 86 1,080 994 45 991 947
■ Main special items in the reporting period:– Components Technology: restructurings and capacity adjustments at Forging & Machining due toweak market and order situation in Brazil, in “heavy crankshafts” in Germany and construction
equipment components in Italy, as well as non-period expenses in steering systems business
– Elevator Technology: restructuring and reorganization in Europe and the Middle East– Industrial Solutions: restructuring of chemical plant construction and reorganization– Materials Services: several restructuring measures, winding-up of railway equipment– Steel Americas discontinued operation : updated valuation of a long-term freight contract;negative earnings effect in connection with sale of CSA

thyssenkrupp interim report 1st half 2016 /2017
Interim management report Report on the economic position
14
Results of operations and financial position
Analysis of the statement of income
Income from operations■ Growth in cost of sales of continuing operations slightly higher than growth in net sales; grossprofit margin of continuing operations down year-on-year to 16.5%
■ Increase in selling expenses of continuing operations mainly due to higher expenses for sales-related freight and insurance charges and increased restructuring expenses
■ Increase in general and administrative expenses of continuing operations resulting mainly fromhigher personnel expenses, due in part to increased restructuring provisions, and higher consult-
ing and IT costs■ Deterioration in other gains/losses of continuing operations mainly influenced by losses on thedisposal of non-current assets in the reporting half
Financial income/expense and income tax■ Decrease in finance income mainly due to lower exchange rate gains in connection with financialtransactions alongside higher income from derivatives in connection with financing
■ Net decrease in finance expense mainly due to lower exchange rate losses in connection withfinancial transactions and lower interest expense for financial debt and pensions alongside high-
er expenses from derivatives in connection with financing■ Tax expense as in the prior year affected by non-recognition of deferred tax assets for currentlosses at individual Group companies
Earnings per share■ Net income down sharply by €846 million to loss of €855 million mainly due to impact on incomefrom discontinued operations in the reporting period due to impairment charges in connection
with the initiated sale of the Brazilian steel mill CSA to Ternium■ Improvement in non-controlling interest mainly due to takeover of minority interest inthyssenkrupp CSA in 3rd quarter of fiscal 2015 / 2016
■ Large decrease in earnings per share to loss of €1.54
Analysis of the statement of cash flows
Operating cash flows■ Operating cash flows from continuing operations positive and higher year-on-year in 2nd quartermainly due to improvement in operating assets and liabilities, but negative and sharply down
year-on-year in 1st half due to net increase in operating assets and liabilities
– Volume recovery and strong rise in materials prices in the materials businesses– Working down of existing orders and temporary shift in payment profile at Industrial Solutions

thyssenkrupp interim report 1st half 2016 /2017
Interim management report Report on the economic position
15
Cash flows from investing activities■ Capital spending at continuing operations at prior-year level or higher in all business areas in 1sthalf; share of capital goods businesses in continuing operations up to 53%
■ Modernization of IT and harmonization of systems landscape at all business areas and Corporateto enhance efficiency, lower costs and as a basis for Industry 4.0
INVESTMENTS BY BUSINESS AREA
million €
1st halfended
March 31,2016
1st halfended
March 31,2017 Change in %
2nd quarterended
March 31,2016
2nd quarterended
March 31,2017 Change in %
Components Technology 163 227 40 84 136 62
Elevator Technology 56 76 37 35 41 15
Industrial Solutions 33 32 3 18 15 17
Materials Services 44 43 3 30 24 20
Steel Europe 175 240 37 89 119 33
Corporate 22 25 15 11 19 68
Consolidation 2 12 — 2 9 —
Investments of the continuingoperations 491 634 29 267 346 30
Steel Americas 55 92 67 25 18 26
Consolidation 0 0 — 1 0 —
Total investments 546 726 33 293 364 24
Components Technology■ Building of highly automated plants in growth region China following new orders from interna-tional and Chinese OEMs for electric steering systems, springs and stabilizers
■ Expansion of production in Hungary: cylinder head covers with integrated camshafts, front andrear axle assembly, production of springs and stabilizers and electric steering systems
Elevator Technology■ China: new elevator plant in Zhongshan in production, shell of 249 m high test tower at samelocation completed in March
■ India: Ramp-up of elevator manufacturing in Pune on schedule■ Germany: further progress on construction of 246 m high test tower in Rottweil, opened forresearch in December
Industrial Solutions■ Cement and Mining: expansion of infrastructure and optimization of technology portfolio tostrengthen market position
■ Chemical plant construction: continued investment in optimization of technology portfolio■ System Engineering: continued growth and international expansion in forming dies■ Marine Systems: further implementation of modernization program at Kiel shipyard currentlymainly IT and infrastructure
thyssenkrupp interim report 1st half 2016 /2017
Interim management report Report on the economic position
16
Materials Services■ Modernization and maintenance measures at warehousing and service units and AST
Steel Europe■ Reline of blast furnace B at HKM■ New ladle furnace at BOF meltshop 2 to produce high-quality grades as part of focus on premiumproducts, in particular ultrahigh-strength steels for the auto industry; project started last fiscal year
Corporate■ Investments for the Carbon2Chem project■ Centrally pooled property investments and license purchases
At Steel Americas discontinued operation investments included the insourcing of water and efflu-
ent treatment services with the acquisition of two Brazilian companies as well as environmental
protection and technical optimization measures.
The slight increase in cash inflows from divestments at the continuing operations was mainly the
result of proceeds in the reporting half from the disposal of German property classified as non-
operating real estate.
Cash flows from financing activities■ Increase in cash flows from financing activities at the continuing operations mainly due to higherproceeds from borrowings in the reporting period compared with the prior year; offsetting effects
mainly due to increased expenditures for the financing of discontinued operations and repayments
in the reporting period of currency and cross currency swaps in connection with Group financing
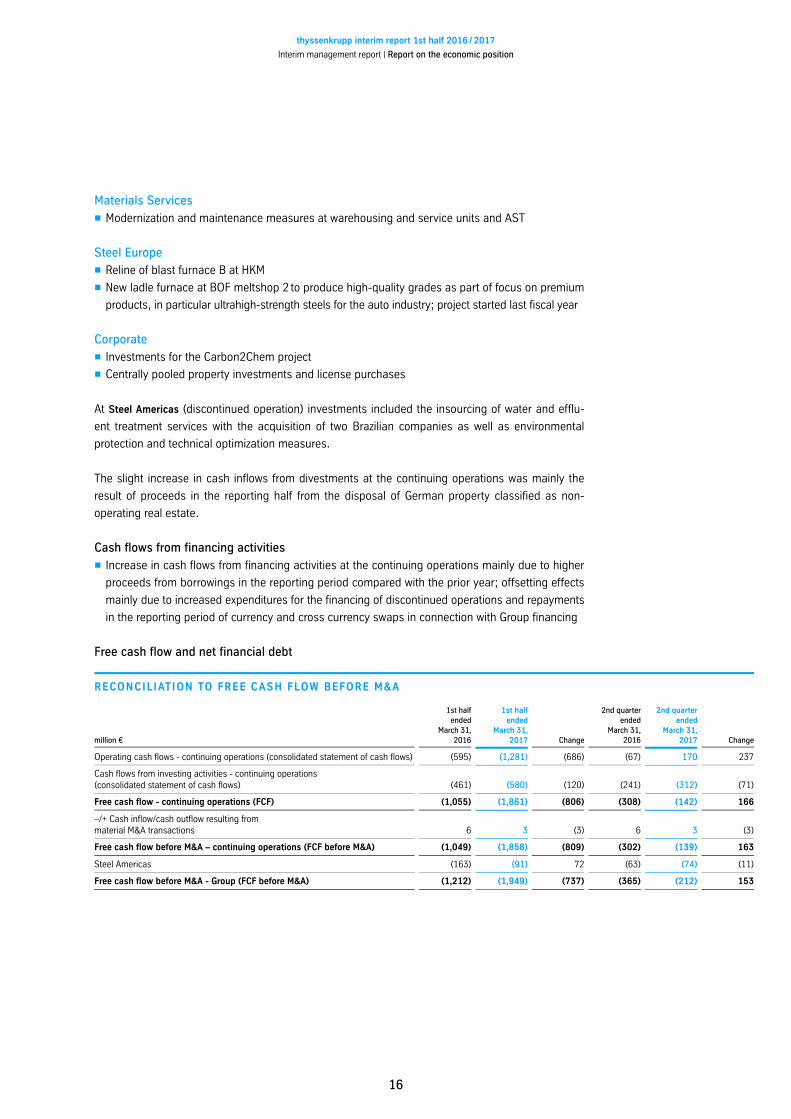
Free cash flow and net financial debt
RECONCILIATION TO FREE CASH FLOW BEFORE M&A
million €
1st halfended
March 31,2016
1st halfended
March 31,2017 Change
2nd quarterended
March 31,2016
2nd quarterended
March 31,2017 Change
Operating cash flows - continuing operations consolidated statement of cash flows 595 1,281 686 67 170 237
Cash flows from investing activities - continuing operationsconsolidated statement of cash flows 461 580 120 241 312 71
Free cash flow - continuing operations FCF 1,055 1,861 806 308 142 166
–/+ Cash inflow/cash outflow resulting frommaterial M&A transactions 6 3 3 6 3 3
Free cash flow before M&A – continuing operations FCF before M&A 1,049 1,858 809 302 139 163
Steel Americas 163 91 72 63 74 11
Free cash flow before M&A - Group FCF before M&A 1,212 1,949 737 365 212 153

thyssenkrupp interim report 1st half 2016 /2017
Interim management report Report on the economic position
17
■ FCF before M&A of continuing operations and of Group € 1,949 million, prior year € 1,212 millionas expected down from prior year in the 1st half due mainly to higher negative operating cash flows
■ Net financial debt correspondingly up at March 31, 2017 to €5,760 million; includes €85 milliondividend payment of thyssenkrupp AG
■ Ratio of net financial debt to equity gearing at 250.0% higher than at September 30, 2016134.2%
■ Available liquidity of €6.6 billion €3.0 billion cash and cash equivalents and €3.6 billion undrawncommitted credit lines
■ Under the existing commercial paper program with a maximum emission volume of €1.5 billion,€1.0 billion had been drawn at March 31, 2017
Financing measure carried out successfully■ Placement of a €1,250 million bond in March 2017; maturity 5 years; coupon 1.375% p.a.
Rating
RATING
Long-term rating Short-term rating Outlook
Standard & Poor’s BB B stable
Moody’s Ba2 Not Prime stable
Fitch BB+ B stable
Analysis of the statement of financial position
Non-current assets■ Increase in intangible assets mainly exchange rate related■ Decrease in property, plant and equipment and other non-financial assets mainly due to reclassi-fications to assets held for sale as a result of classification of Steel Americas as discontinued op-
eration■ Decrease in deferred tax assets mainly the result of interest rate changes for pension obligationsat March 31, 2017
Current assets■ Net increase in current assets mainly due to increase in assets held for sale as a result of classi-fication of Steel Americas as discontinued operation
■ Increase in inventories and trade accounts receivable, both mainly due to significant rise in capi-tal employed at the continuing materials operations; at the same time decreases mainly due to
reclassifications to assets held for sale
thyssenkrupp interim report 1st half 2016 /2017
Interim management report Report on the economic position
18
■ Rise in other non-financial assets mainly the result of higher advance payments; at the sametime decreases in entitlements in connection with non-income taxes due to reclassifications to
assets held for sale■ Significant decrease in cash and cash equivalents: mainly the result of negative free cash flowfrom continuing operations in the reporting period and financing of Steel Americas business area
now classified as discontinued operation; offset by proceeds from borrowings
Total equity■ Net decrease mainly due to net loss for the reporting period■ At the same time increases mainly due to gains after taxes recognized in other comprehensiveincome from the remeasurement of pensions and similar obligations as a result of higher discount
rates
Non-current liabilities■ Decrease in provisions for pensions and similar obligations mainly due to higher discount rates■ Increase in financial debt mainly due to the placement of a bond in March 2017; decreases dueto reclassifications to liabilities associated with assets held for sale
Current liabilities■ Net increase in current liabilities mainly due to increase in liabilities associated with assets heldfor sale as a result of classification of Steel Americas as discontinued operation
■ Reduction in provisions for current employee benefits mainly due to utilization■ Decrease in financial debt mainly reflects repayment of a bond in February 2017 combined withdrawings from the existing commercial paper program in the reporting period
■ Increases in trade accounts payable mainly at the continuing materials operations; at the sametime decreases mainly due to reclassifications to liabilities associated with assets held for sale
■ Reduction in other financial liabilities mainly due to lower interest liabilities and reclassification ofderivatives to liabilities associated with assets held for sale
■ Decrease in other non-financial liabilities mainly in connection with construction contracts

thyssenkrupp interim report 1st half 2016 /2017
Interim management report Compliance Employees
19
Compliance
Compliance – a question of mindset■ We build on strong values: reliability, honesty, credibility and integrity■ Compliance is a must■ Our values are anchored in the Group mission statement, Code of Conduct and ComplianceCommitment
■ We investigate reports of violations and clear up the facts; violations are stopped immediately;necessary sanctions are independent of person and function
■ More information on compliance at thyssenkrupp in the 2015 / 2016 Annual Report
Employees
■ 158,584 employees worldwide at March 31, 2017; 2,097 or 1.3% more versus September 30, 2016■ Net increase in workforce by almost 2,500, in particular in the high-growth capital goods busi-nesses Components Technology and Elevator Technology in connection with the development of
new customers and markets outside Germany■ At the same time, overall decrease of more than 400 employees at Industrial Solutions and SteelEurope; in addition, long-term reduction in weekly working hours in both areas
■ Over 350 additional internships and apprenticeships created for refugees as part of the “we help”aid program initiated in fall 2015
■ Launch of a new Groupwide health and safety awareness campaign; goal is to achieve at least10% year-on-year reductions in accident rate per 1 million hours worked up to 2020
■ More information on HR strategy in 2015 / 2016 Annual Report

thyssenkrupp interim report 1st half 2016 /2017
Interim management report Technology and innovations
20
Technology and innovations
Innovation strategy and key development areas■ Systemic approach across sector and technology boundaries; targeted leveraging of our collec-tive strength as an industrial group; global research and development network of more than
3,500 employees at around 100 locations■ Key development areas include technologies for the energy transition, intelligent manufacturing,sustainable mobility
Innovation projects■ Carbon2Chem – Collaborative project aimed at converting steel mill gases into base chemicals:construction work started on a technical center to translate results of laboratory research to in-
dustrial scale; basic engineering and layout planning for electrolysis and gas scrubbing facilities
completed; preparations underway for integration of a methanol plant in the gas scrubber■ Load management – Flexibilization of processes to adjust to fluctuations in power supply: studyinto adapting cement production to volatile supply from renewable energies completed; simula-
tions of production processes and power supply scenarios identify new opportunities for stable
processes while saving costs■ Industrial Data Space – Secure data space for exchange of information between companies: firstapplication now in use; new information system optimizing truck logistics at thyssenkrupp Steel
Europe; platform guarantees full data sovereignty for users at all times■ Predictive maintenance – Development project launched to increase the availability of electrolysiscells by collecting and analyzing available process data
■ Autonomous driving: New test and development center for steering technology under construc-tion in Eschen Liechtenstein ; among other things center will be used for development projects
such as steer-by-wire, e-mobility, driver assist systems■ Diesel fuel cell: Conventional diesel is broken down catalytically to create additional input materi-als for fuel cells, which are 25% more efficient than diesel engines. The technology is quiet and
clean: As no diesel is burnt, other than CO2 there are no other combustion products or particu-
lates. Prototype for surface ships in use■ Steel distribution: First pilot of an autonomous, digitally controlled steel processing machine nowin operation; fully automated machine processes up to 70 metric tons of flat steel per day in line
with customer requirements

thyssenkrupp interim report 1st half 2016 /2017
Interim management report Subsequent events Forecast, opportunity and risk report
21
Subsequent eventsSubsequent events between the end of the 1st half reporting period March 31, 2017 and the date
of authorization for issuance May 8, 2017 are presented in Note 10 to the interim financial state-
ments.
Forecast, opportunity andrisk report
2016 / 2017 forecast
Overall assessment by the Executive Board■ Pleasing progress on transformation of the Group and continuation of good operating perfor-mance in 2nd quarter:
– Sale of Brazilian steel mill CSA to Ternium concludes Steel Americas exit– Highest order intake since start of Strategic Way Forward; sales and adjusted EBIT higher year-on-year
■ Recently however renewed severe dislocations on the raw materials markets, especially for cok-ing coal, with temporary effects on expected costs and net working capital
■ Following adjustments to full-year forecast mainly reflect effects from good operating perfor-mance, sale of CSA and recent dislocations on raw materials markets
For key assumptions and expected economic conditions see forecast section and “Macro and
sector environment” in the report on the economic position in the 2015 / 2016 Annual Report and
this interim report.
thyssenkrupp interim report 1st half 2016 /2017
Interim management report Forecast, opportunity and risk report
22
2016 / 2017 forecast■ Group sales and sales of the continuing operations to increase on a comparable basis in the high
single-digit percentage range
– Capital goods businesses: on a comparable basis increase in single-digit percentage range– Materials businesses: on a comparable basis Materials Services, Steel Europe and Steel Americasdiscontinued operation to achieve increase in double-digit percentage range driven by volumes
and in particular prices/costs■ Adjusted EBIT of the Group expected to be around €1.8 billion prior year: €1,469 million , sup-
ported by €850 million planned EBIT effects from “impact”■ Adjusted EBIT of continuing operations expected to be around €1.7 billion■ Capital goods businesses– Components Technology: Improvement in adjusted EBIT prior year: €335 million from signifi-cant rise in sales and slight improvement in margin prior year: 4.9%
– Elevator Technology: Improvement in adjusted EBIT prior year: €860 million from slight salesgrowth and increase in adjusted EBIT margin by 0.5 to 0.7 percentage points prior year: 11.5%
– Industrial Solutions:– Short-term focus on reversing trend in orders and cash flow– Decline in adjusted EBIT due to partial underutilization prior year: €355 million with largelystable sales
– Marine Systems with temporary sharp decline in margin and earnings– Overall margin temporarily noticeably below target range of 6 to 7%
■ Materials businesses– Materials Services: Adjusted EBIT significantly higher year-on-year prior year: €128 million– Steel Europe: Adjusted EBIT significantly higher year-on-year prior year: €315 million
■ Steel Americas discontinued operation : Adjusted EBIT significantly higher year-on-year prioryear: € 33 million ; elimination of scheduled depreciation due to classification as discontinued
operation■ Net income of the Group: With positive operating earnings and continued restructuring expense,
overall significant net loss expected prior year: €261 million net income exclusively as a result
of negative earnings impact from sale of CSA■ tkVA of the Group: Clearly positive trend due to good operating performance, but as a result of
negative earnings impact from sale of CSA overall significantly lower year-on-year prior year:
€ 85 million■ Capital spending of the Group before M&A: Expected around €1.5 billion prior year: €1,387 million■ FCF before M&A of the Group: Significant increase in net working capital at our materials business-
es as a result of dislocations on raw materials markets and due to higher volumes and prices will
result in overall negative FCF before M&A in the mid-three-digit million euro range prior year:
€198 million

thyssenkrupp interim report 1st half 2016 /2017
Interim management report Forecast, opportunity and risk report
23
Opportunities and risks
Opportunities■ Strong and stable earnings, cash flow and value added through positioning as diversified indus-trial group and systematic continuation of “impact” measures as well as utilization of advantages
in interplay between business areas, regions, corporate functions and service units■ Increasing focus on high-earning capital goods and service businesses■ Announced infrastructure programs of new US administration■ Strategic and operational opportunities described in 2015 / 2016 Annual Report continue to apply
Risks■ No risks threatening ability to continue as a going concern; detailed information on risks de-scribed in 2015 / 2016 Annual Report continues to apply
■ Sale of CSA significantly reduces risks going forward■ Economic risks from numerous geopolitical flashpoints; increasing volatility in external environ-ment, among other things due to Brexit vote in United Kingdom; increased uncertainty over
global economy and effects on the Group’s business models■ Trade measures of new US administration being continuously monitored; import tariffs on goodsfrom Mexico could jeopardize existing value chains between USA and Mexico
■ Risks from attacks on IT infrastructure; countermeasure: further expansion of information securitymanagement and security technologies
■ Atlas Elektronik is in talks with Bremen public prosecutor over ending the current investigationproceedings by mutual agreement
thyssenkrupp interim report 1st half 2016 /2017
Condensed interim financial statements
Condensed interimfinancial statements
25 Consolidated statement of financial position
27 Consolidated statement of income
28 Consolidated statement of comprehensive income
29 Consolidated statement of changes in equity
30 Consolidated statement of cash flows
32 Selected notes to the consolidated financial statements
47 Review report
48 Responsibility statement

thyssenkrupp interim report 1st half 2016 /2017
Condensed interim financial statements thyssenkrupp AG – Consolidated statement of financial position
25
thyssenkrupp AG – Consolidatedstatement of financial position
ASSETS
million € Note Sept. 30, 2016 March 31, 2017
Intangible assets 4,570 4,671
Property, plant and equipment 8,872 7,277
Investment property 66 65
Investments accounted for using the equity method 284 290
Other financial assets 44 47
Other non-financial assets 445 254
Deferred tax assets 2,322 2,060
Total non-current assets 16,604 14,664
Inventories 6,341 7,027
Trade accounts receivable 5,003 5,531
Other financial assets 407 427
Other non-financial assets 2,376 2,461
Current income tax assets 172 233
Cash and cash equivalents 4,105 2,868
Assets held for sale 02 65 2,148
Total current assets 18,468 20,695
Total assets 35,072 35,360

thyssenkrupp interim report 1st half 2016 /2017
Condensed interim financial statements thyssenkrupp AG – Consolidated statement of financial position
26
EQUITY AND LIABILITIES
million € Note Sept. 30, 2016 March 31, 2017
Capital stock 1,449 1,449
Additional paid-in capital 5,434 5,434
Retained earnings 5,255 5,754
Cumulative other comprehensive income 474 659
thereof discontinued operations — 176
Equity attributable to thyssenkrupp AG’s stockholders 2,102 1,789
Non-controlling interest 507 515
Total equity 2,609 2,304
Accrued pension and similar obligations 03 8,754 8,018
Provisions for other employee benefits 373 338
Other provisions 589 587
Deferred tax liabilities 33 43
Financial debt 04 6,157 7,069
Other financial liabilities 221 198
Other non-financial liabilities 6 7
Total non-current liabilities 16,134 16,260
Provisions for current employee benefits 408 276
Other provisions 963 1,000
Current income tax liabilities 279 276
Financial debt 04 1,455 1,366
Trade accounts payable 5,119 5,300
Other financial liabilities 975 843
Other non-financial liabilities 7,130 6,975
Liabilities associated with assets held for sale 02 0 759
Total current liabilities 16,329 16,795
Total liabilities 32,463 33,056
Total equity and liabilities 35,072 35,360
See accompanying notes to consolidated financial statements.

thyssenkrupp interim report 1st half 2016 /2017
Condensed interim financial statements thyssenkrupp AG – Consolidated statement of income
27
thyssenkrupp AG – Consolidatedstatement of income
million €, earnings per share in € Note
1st halfended
March 31,20161
1st halfended
March 31,2017
2nd quarterended
March 31,20161
2nd quarterended
March 31,2017
Net sales 07 18,827 20,335 9,588 10,617
Cost of sales 15,610 16,978 7,928 8,853
Gross margin 3,217 3,357 1,660 1,765
Research and development cost 169 177 88 92
Selling expenses 1,381 1,451 690 762
General and administrative expenses 1,122 1,219 580 620
Other income 87 90 40 48
Other expenses 50 75 25 34
Other gains/ losses , net 17 3 17 6
Income/ loss from operations 599 523 334 311
Income from companies accounted for using the equity method 26 2 10 8
Finance income 605 499 225 180
Finance expense 893 737 363 290
Financial income/ expense , net 262 240 128 102
Income/ loss from continuing operations before tax 338 283 206 208
Income tax expense /income 175 224 98 144
Income/ loss from continuing operations net of tax 162 58 108 64
Discontinued operations net of tax 171 913 64 934
Net income/ loss 9 855 45 870
Thereof:
thyssenkrupp AG’s shareholders 37 871 61 879
Non-controlling interest 46 17 16 9
Net income/ loss 9 855 45 870
Basic and diluted earnings per share based on 08
Income/ loss from continuing operations attributable to thyssenkrupp AG’s shareholders 0.25 0.07 0.17 0.10
Net income/ loss attributable to thyssenkrupp AG's shareholders 0.07 1.54 0.11 1.55
See accompanying notes to consolidated financial statements.1 Figures have been adjusted cf. Note 02 .

thyssenkrupp interim report 1st half 2016 /2017
Condensed interim financial statements thyssenkrupp AG – Consolidated statement of comprehensive income
28
thyssenkrupp AG – Consolidatedstatement of comprehensive income
million €
1st halfended
March 31,2016
1st halfended
March 31,2017
2nd quarterended
March 31,2016
2nd quarterended
March 31,2017
Net income/ loss 9 855 45 870
Items of other comprehensive income that will not be reclassified to profit or loss in future periods:
Other comprehensive income from remeasurements of pensions and similar obligations
Change in unrealized gains/ losses , net 573 631 578 5
Tax effect 175 179 172 3
Other comprehensive income from remeasurements of pensions and similar obligations, net 398 452 406 8
Share of unrealized gains/ losses of investments accounted for using the equity-method 1 6 2 10
Subtotals of items of other comprehensive income that will not be reclassified to profit or loss in futureperiods 397 458 408 18
Items of other comprehensive income that will be reclassified to profit or loss in future periods:
Foreign currency translation adjustment
Change in unrealized gains/ losses , net 22 209 136 3
Net realized gains /losses 0 1 0 0
Net unrealized gains /losses 22 208 136 3
Unrealized gains/ losses from available-for-sale financial assets
Change in unrealized gains/ losses , net 0 2 0 2
Net realized gains /losses 0 0 0 0
Tax effect 0 0 0 0
Net unrealized gains /losses 0 2 0 2
Unrealized gains/ losses on derivative financial instruments cash flow hedges
Change in unrealized gains/ losses , net 32 40 17 8
Net realized gains /losses 12 24 2 24
Tax effect 15 4 9 10
Net unrealized gains /losses 5 12 6 22
Share of unrealized gains/ losses of investments accounted for using the equity-method 7 3 7 0
Subtotals of items of other comprehensive income that will be reclassified to profit or loss in futureperiods 34 201 149 17
Other comprehensive income 431 659 557 1
Total comprehensive income 440 196 512 869
Thereof:
thyssenkrupp AG’s shareholders 411 228 511 882
Non-controlling interest 29 33 1 13
Total comprehensive income attributable to thyssenkrupp AG’s stockholders refers to:
Continuing operations 332 706 499 37
Discontinued operations1 79 934 13 918
See accompanying notes to consolidated financial statements.1 Prior-year figures have been adjusted cf. Note 02 .

thyssenkrupp interim report 1st half 2016 /2017
Condensed interim financial statements thyssenkrupp AG – Consolidated statement of changes in equity
29
thyssenkrupp AG – Consolidatedstatement of changes in equity
Equity attributable to thyssenkrupp AG’s stockholders
Cumulative other comprehensive income
million €,except number of shares
Number of sharesoutstanding Capital stock
Additionalpaid-incapital
Retainedearnings
Foreigncurrency
translationadjustment
Available-for-sale financial
assets
Derivativefinancial
instrumentscash flowhedges
Share ofinvestmentsaccounted
for using theequity
method Total
Non-controlling
interest Total equity
Balance as ofSept. 30, 2015 565,937,947 1,449 5,434 4,123 417 6 58 57 3,182 125 3,307
Net income/ loss 37 37 46 9
Other comprehensiveincome 397 31 0 13 7 448 17 431
Total comprehensiveincome 360 31 0 13 7 411 29 440
Profit attributable to non-controlling interest 0 24 24
Payment ofthyssenkrupp AGdividend 85 85 0 85
Changes of shares ofalready consolidatedcompanies 3 3 4 7
Other changes 14 14 12 2
Balance as ofMarch 31, 2016 565,937,947 1,449 5,434 4,557 386 6 71 50 2,697 56 2,753
Balance as ofSept. 30, 2016 565,937,947 1,449 5,434 5,255 484 6 64 48 2,102 507 2,609
Net income/ loss 871 871 17 855
Other comprehensiveincome 458 193 1 12 3 643 16 659
Total comprehensiveincome 413 193 1 12 3 228 33 196
Profit attributable to non-controlling interest 0 24 24
Payment ofthyssenkrupp AGdividend 85 85 0 85
Balance as ofMarch 31, 2017 565,937,947 1,449 5,434 5,754 677 7 76 51 1,789 515 2,304
See accompanying notes to consolidated financial statements.

thyssenkrupp interim report 1st half 2016 /2017
Condensed interim financial statements thyssenkrupp AG – Consolidated statement of cash flows
30
thyssenkrupp AG – Consolidatedstatement of cash flows
million €
1st halfended
March 31,20161
1st halfended
March 31,2017
2nd quarterended
March 31,20161
2nd quarterended
March 31,2017
Net income/ loss 9 855 45 870
Adjustments to reconcile net income/ loss to operating cash flows:
Discontinued operations net of tax 171 913 64 934
Deferred income taxes, net 9 71 6 38
Depreciation, amortization and impairment of non-current assets 528 534 268 274
Reversals of impairment losses of non-current assets 2 0 5 0
Income/ loss from companies accounted for using the equity method, net of dividends received 26 2 10 8
Gain /loss on disposal of non-current assets 16 3 17 8
Changes in assets and liabilities, net of effects of acquisitions and divestitures and other non-cash changes
– Inventories 179 953 407 241
– Trade accounts receivable 19 562 126 514
– Accrued pension and similar obligations 108 118 44 46
– Other provisions 163 157 52 48
– Trade accounts payable 681 369 117 626
– Other assets/liabilities not related to investing or financing activities 459 523 736 34
Operating cash flows – continuing operations 595 1,281 67 170
Operating cash flows – discontinued operations 109 59 38 60
Operating cash flows – total 703 1,340 105 110
Purchase of investments accounted for using the equity method and non-current financial assets 8 2 1 1
Expenditures for acquisitions of consolidated companies net of cash acquired 16 7 16 5
Capital expenditures for property, plant and equipment inclusive of advance payments and investment property 413 549 220 290
Capital expenditures for intangible assets inclusive of advance payments 55 76 32 50
Proceeds from disposals of investments accounted for using the equity method and non-current financial assets 0 1 0 0
Proceeds from disposals of previously consolidated companies net of cash disposed 9 6 8 6
Proceeds from disposals of property, plant and equipment and investment property 21 47 17 28
Proceeds from disposals of intangible assets 0 0 1 0
Cash flows from investing activities – continuing operations 461 580 241 312
Cash flows from investing activities – discontinued operations 54 87 25 14
Cash flows from investing activities – total 515 667 266 325

thyssenkrupp interim report 1st half 2016 /2017
Condensed interim financial statements thyssenkrupp AG – Consolidated statement of cash flows
31
million €
1st halfended
March 31,20161
1st halfended
March 31,2017
2nd quarterended
March 31,20161
2nd quarterended
March 31,2017
Proceeds from issuance of bonds 850 1,250 850 1,250
Repayments of bonds 1,000 1,250 1,000 1,250
Proceeds from liabilities to financial institutions 690 2,152 682 2,136
Repayments of liabilities to financial institutions 255 1,994 205 1,965
Proceeds from/ repayments on loan notes and other loans 74 995 41 621
Increase/ decrease in bills of exchange 2 6 2 4
Increase /decrease in current securities 0 0 1 1
Payment of thyssenkrupp AG dividend 85 85 85 85
Profit attributable to non-controlling interest 24 24 2 16
Expenditures for acquisitions of shares of already consolidated companies 6 0 4 0
Financing of discontinued operations 170 219 29 120
Other financing activities 53 152 133 20
Cash flows from financing activities – continuing operations 126 680 297 556
Cash flows from financing activities – discontinued operations 96 143 7 71
Cash flows from financing activities – total 222 823 290 627
Net increase/ decrease in cash and cash equivalents – total 996 1,184 82 411
Effect of exchange rate changes on cash and cash equivalents – total 0 43 27 7
Cash and cash equivalents at beginning of year – total 4,535 4,105 3,648 2,545
Cash and cash equivalents at end of year – total 3,539 2,964 3,539 2,964
thereof cash and cash equivalents within the discontinued operations 32 96 32 96
Additional information regarding cash flows from interest, dividends and income taxes which are included inoperating cash flows of continuing operations:
Interest received 50 35 23 17
Interest paid 287 214 201 134
Dividends received 54 0 53 0
Income taxes paid 177 219 71 92
See accompanying notes to consolidated financial statements.1 Figures have been adjusted cf. Note 02 .

thyssenkrupp interim report 1st half 2016 /2017
Condensed interim financial statements thyssenkrupp AG – Selected notes
32
thyssenkrupp AG –Selected notes
Corporate information
thyssenkrupp Aktiengesellschaft „thyssenkrupp AG“ or „Company“ is a publicly traded
corporation domiciled in Duisburg and Essen in Germany. The condensed interim consolidated
financial statements of thyssenkrupp AG and subsidiaries, collectively the “Group”, for the period
from October 1, 2016 to March 31, 2017, were reviewed and authorized for issue in accordance
with a resolution of the Executive Board on May 8, 2017.
Basis of presentation
The accompanying Group’s condensed interim consolidated financial statements have been
prepared pursuant to section 37w of the German Securities Trading Act WpHG and in conformity
with IAS 34 “Interim financial reporting”. They are in line with the International Financial Reporting
Standards IFRS and its interpretations adopted by the International Accounting Standards Board
IASB for interim financial information effective within the European Union. Accordingly, these
financial statements do not include all of the information and footnotes required by IFRS for
complete financial statements for year-end reporting purposes.
The accounting principles and practices as applied in the condensed interim consolidated financial
statements as of March 31, 2017 correspond to those pertaining to the most recent annual
consolidated financial statements with the exception of the recently adopted accounting standards.
A detailed description of the accounting policies is published in the notes to the consolidated
financial statements of our annual report 2015 / 2016.
Recently adopted accounting standards
In fiscal year 2016 / 2017, thyssenkrupp adopted the following amendments to already existing
standards that did not have a material impact on the Group’s consolidated financial statements:
■ Amendments to IAS 1 “Presentation of Financial Statements“, issued in December 2014. Theamendments mainly include clarifications regarding the judgment of materiality of disclosures,
explanations how to aggregate and disaggregate line items of the balance sheet and the
statement of comprehensive income, the order to the notes and the disclosure to significant
accounting policies.■ Amendments to IFRS 11 “Joint Arrangements“: „Accounting for Acquisitions of Interests in JointOperations“, issued in May 2014
■ Amendments to IAS 16 “Property, Plant and Equipment“ and IAS 38 „Intangible Assets“:„Clarification of Acceptable Methods of Depreciation and Amortisation“, issued in May 2014
■ Annual Improvements to IFRSs 2012-2014 Cycle, issued in September 2014■ Amendments to IFRS 10, IFRS 12 and IAS 28: “Investment Entities – Applying the ConsolidationException“, issued in December 2014

thyssenkrupp interim report 1st half 2016 /2017
Condensed interim financial statements thyssenkrupp AG – Selected notes
33
01 AcquisitionsIn the 1st half ended March 31, 2017, the Group acquired the two Brazilian Ecosteel companies in
December 2016 and acquired additional smaller companies that are, on an individual basis,
immaterial. Based on the values as of acquisition date, these acquisitions affected in total the
Group’s consolidated financial statements as presented below:
ACQUISITIONS
million €
1st halfended
March 31, 2017
Goodwill 11
Other intangible assets 3
Property, plant and equipment 31
Other non-current financial assets 20
Deferred tax assets 1
Trade accounts receivable 3
Current income tax assets 1
Cash and cash equivalents 4
Total assets acquired 74
Deferred tax liabilities 1
Other non-current non-financial liabilities 3
Trade accounts payable 1
Other current financial liabilities 1
Other current non-financial liabilities 3
Total liabilities assumed 8
Net assets acquired 65
Non-controlling interest 0
Purchase prices 65
Thereof: paid in cash and cash equivalents 65
02 Discontinued operation and disposal groupAs part of the Strategic Way Forward, thyssenkrupp reached agreement with Ternium on the sale of
the Brazilian steel mill CSA Siderúrgica do Atlantico CSA at the end of February 2017. The sale is
subject to the approval of the responsible competition authorities and is due for completion by
September 30, 2017. The transaction meets the criteria of IFRS 5 for presentation of the Steel
Americas business area as a discontinued operation. Consequently in the current reporting periods
all expense and income of Steel Americas are reported separately in the income statement and all
cash flows reported separately in the statement of cash flows; prior-period figures are adjusted
accordingly. In the statement of financial position, assets and liabilities attributable to Steel
Americas are only reported separately at the current balance sheet date.
thyssenkrupp interim report 1st half 2016 /2017
Condensed interim financial statements thyssenkrupp AG – Selected notes
34
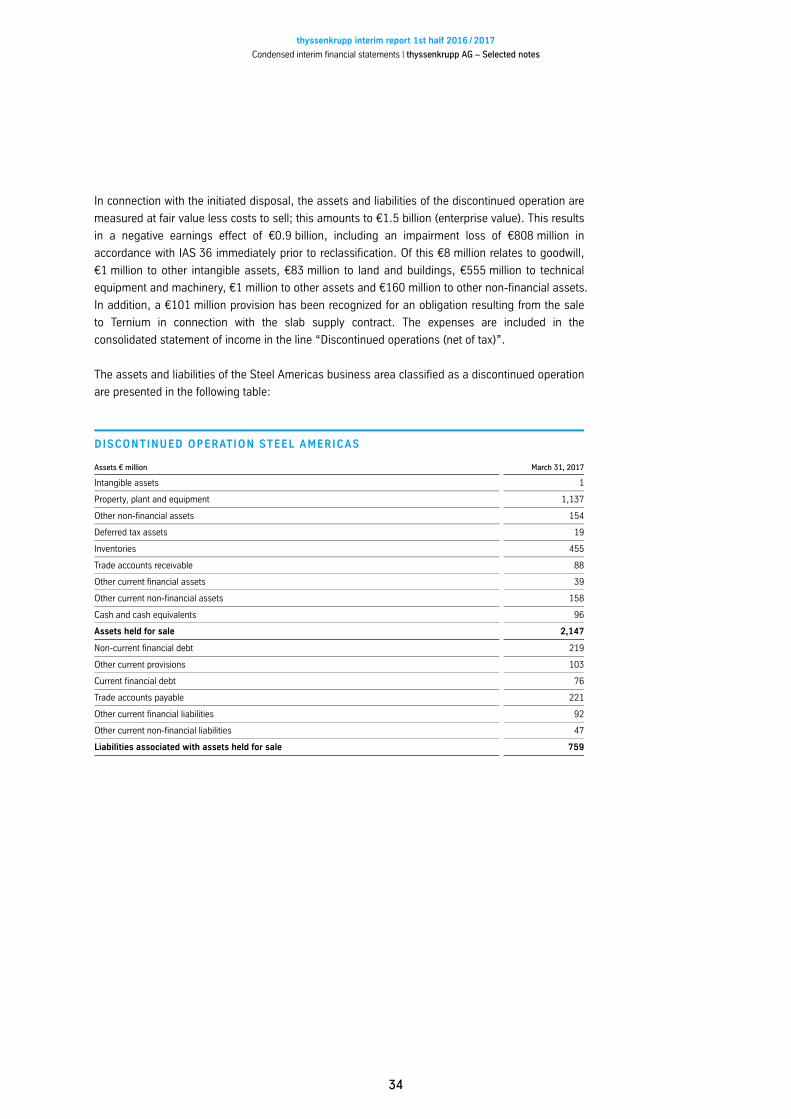
In connection with the initiated disposal, the assets and liabilities of the discontinued operation are
measured at fair value less costs to sell; this amounts to €1.5 billion enterprise value . This results
in a negative earnings effect of €0.9 billion, including an impairment loss of €808 million in
accordance with IAS 36 immediately prior to reclassification. Of this €8 million relates to goodwill,
€1 million to other intangible assets, €83 million to land and buildings, €555 million to technical
equipment and machinery, €1 million to other assets and €160 million to other non-financial assets.
In addition, a €101 million provision has been recognized for an obligation resulting from the sale
to Ternium in connection with the slab supply contract. The expenses are included in the
consolidated statement of income in the line “Discontinued operations net of tax ”.
The assets and liabilities of the Steel Americas business area classified as a discontinued operation
are presented in the following table:
DISCONTINUED OPERATION STEEL AMERICAS
Assets € million March 31, 2017
Intangible assets 1
Property, plant and equipment 1,137
Other non-financial assets 154
Deferred tax assets 19
Inventories 455
Trade accounts receivable 88
Other current financial assets 39
Other current non-financial assets 158
Cash and cash equivalents 96
Assets held for sale 2,147
Non-current financial debt 219
Other current provisions 103
Current financial debt 76
Trade accounts payable 221
Other current financial liabilities 92
Other current non-financial liabilities 47
Liabilities associated with assets held for sale 759
thyssenkrupp interim report 1st half 2016 /2017
Condensed interim financial statements thyssenkrupp AG – Selected notes
35
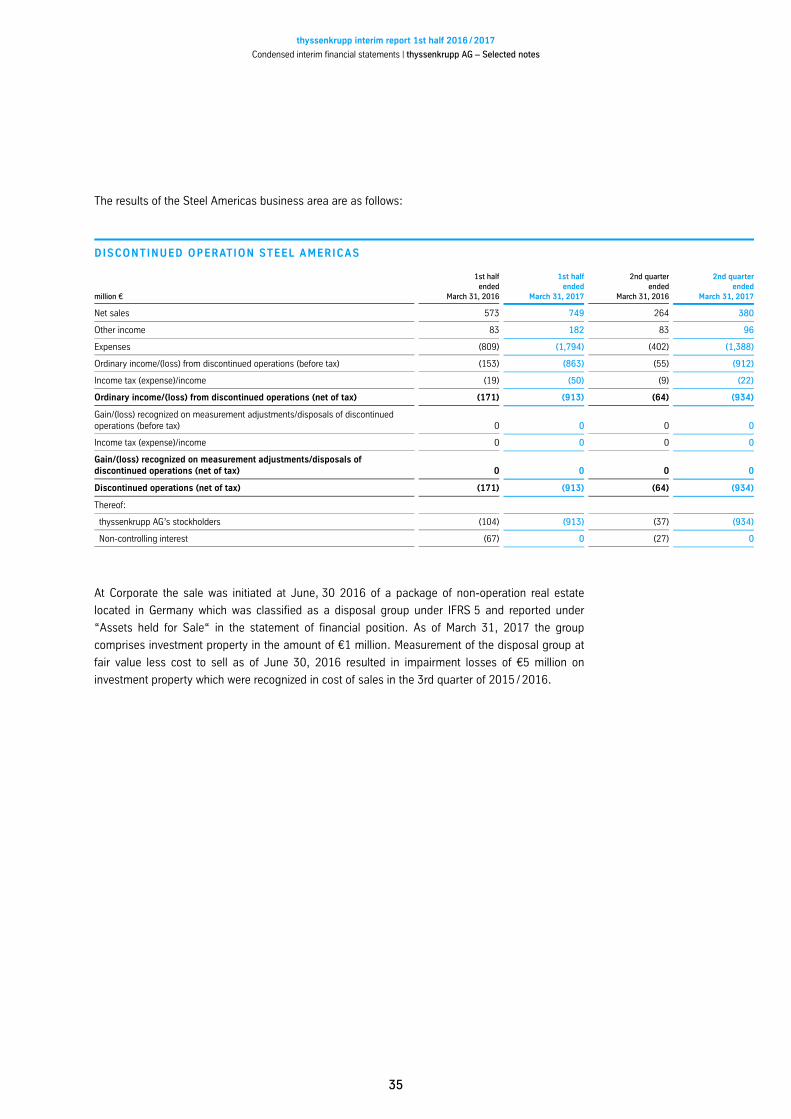
The results of the Steel Americas business area are as follows:
DISCONTINUED OPERATION STEEL AMERICAS
million €
1st halfended
March 31, 2016
1st halfended
March 31, 2017
2nd quarterended
March 31, 2016
2nd quarterended
March 31, 2017
Net sales 573 749 264 380
Other income 83 182 83 96
Expenses 809 1,794 402 1,388
Ordinary income/ loss from discontinued operations before tax 153 863 55 912
Income tax expense /income 19 50 9 22
Ordinary income/ loss from discontinued operations net of tax 171 913 64 934
Gain/ loss recognized on measurement adjustments/disposals of discontinuedoperations before tax 0 0 0 0
Income tax expense /income 0 0 0 0
Gain/ loss recognized on measurement adjustments/disposals ofdiscontinued operations net of tax 0 0 0 0
Discontinued operations net of tax 171 913 64 934
Thereof:
thyssenkrupp AG’s stockholders 104 913 37 934
Non-controlling interest 67 0 27 0
At Corporate the sale was initiated at June, 30 2016 of a package of non-operation real estate
located in Germany which was classified as a disposal group under IFRS 5 and reported under
“Assets held for Sale“ in the statement of financial position. As of March 31, 2017 the group
comprises investment property in the amount of €1 million. Measurement of the disposal group at
fair value less cost to sell as of June 30, 2016 resulted in impairment losses of €5 million on
investment property which were recognized in cost of sales in the 3rd quarter of 2015 / 2016.
thyssenkrupp interim report 1st half 2016 /2017
Condensed interim financial statements thyssenkrupp AG – Selected notes
36
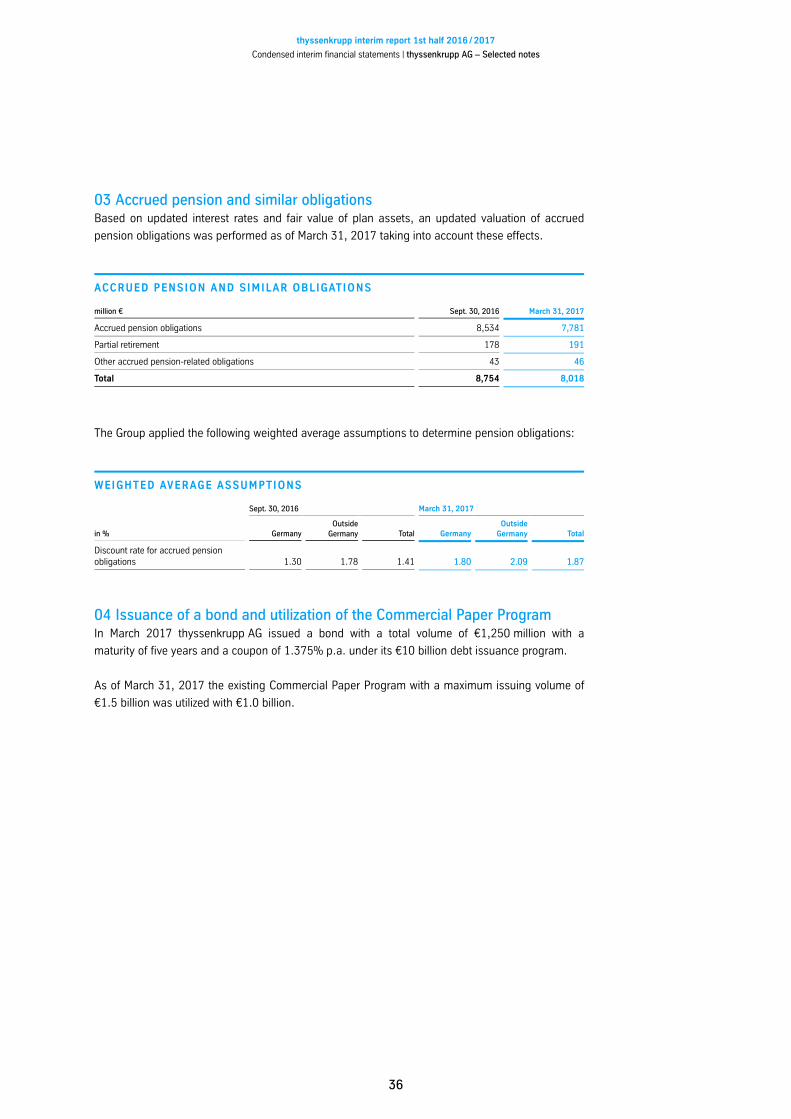
03 Accrued pension and similar obligationsBased on updated interest rates and fair value of plan assets, an updated valuation of accrued
pension obligations was performed as of March 31, 2017 taking into account these effects.
ACCRUED PENSION AND SIMILAR OBLIGATIONS
million € Sept. 30, 2016 March 31, 2017
Accrued pension obligations 8,534 7,781
Partial retirement 178 191
Other accrued pension-related obligations 43 46
Total 8,754 8,018
The Group applied the following weighted average assumptions to determine pension obligations:
WEIGHTED AVERAGE ASSUMPTIONS
Sept. 30, 2016 March 31, 2017
in % GermanyOutside
Germany Total GermanyOutside
Germany Total
Discount rate for accrued pensionobligations 1.30 1.78 1.41 1.80 2.09 1.87
04 Issuance of a bond and utilization of the Commercial Paper ProgramIn March 2017 thyssenkrupp AG issued a bond with a total volume of €1,250 million with a
maturity of five years and a coupon of 1.375% p.a. under its €10 billion debt issuance program.
As of March 31, 2017 the existing Commercial Paper Program with a maximum issuing volume of
€1.5 billion was utilized with €1.0 billion.
thyssenkrupp interim report 1st half 2016 /2017
Condensed interim financial statements thyssenkrupp AG – Selected notes
37
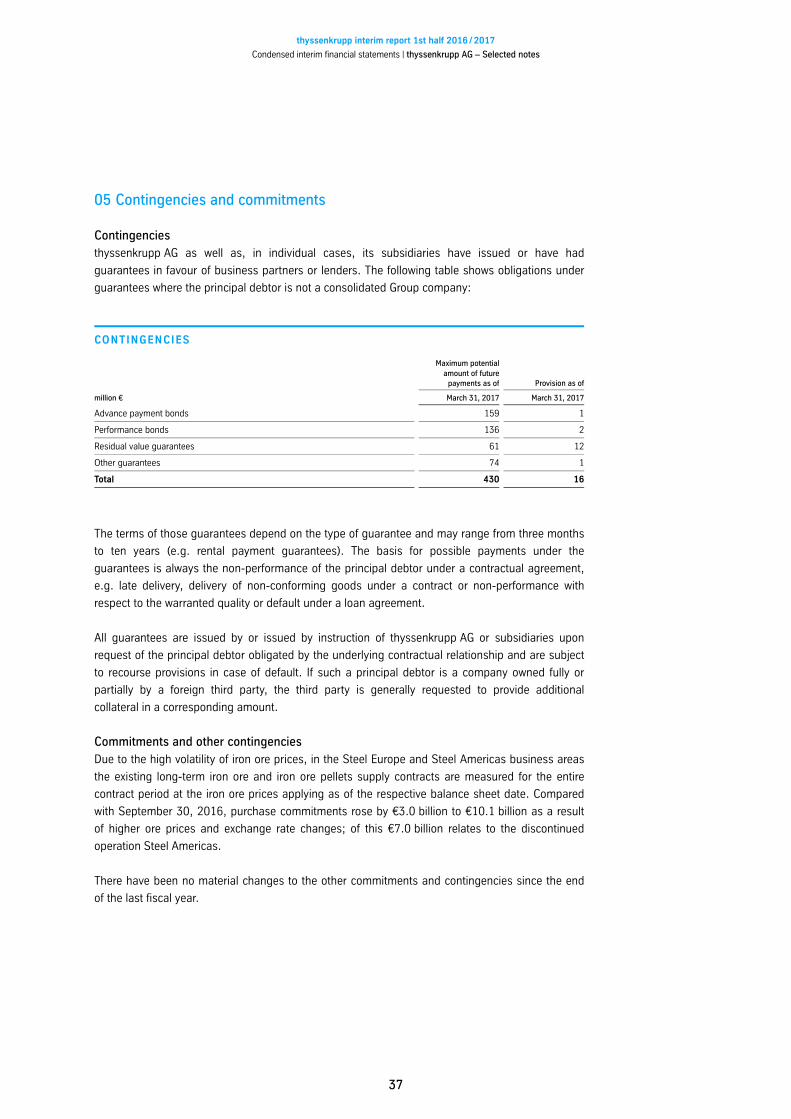
05 Contingencies and commitments
Contingenciesthyssenkrupp AG as well as, in individual cases, its subsidiaries have issued or have had
guarantees in favour of business partners or lenders. The following table shows obligations under
guarantees where the principal debtor is not a consolidated Group company:
CONTINGENCIES
Maximum potentialamount of futurepayments as of Provision as of
million € March 31, 2017 March 31, 2017
Advance payment bonds 159 1
Performance bonds 136 2
Residual value guarantees 61 12
Other guarantees 74 1
Total 430 16
The terms of those guarantees depend on the type of guarantee and may range from three months
to ten years e.g. rental payment guarantees . The basis for possible payments under the
guarantees is always the non-performance of the principal debtor under a contractual agreement,
e.g. late delivery, delivery of non-conforming goods under a contract or non-performance with
respect to the warranted quality or default under a loan agreement.
All guarantees are issued by or issued by instruction of thyssenkrupp AG or subsidiaries upon
request of the principal debtor obligated by the underlying contractual relationship and are subject
to recourse provisions in case of default. If such a principal debtor is a company owned fully or
partially by a foreign third party, the third party is generally requested to provide additional
collateral in a corresponding amount.
Commitments and other contingenciesDue to the high volatility of iron ore prices, in the Steel Europe and Steel Americas business areas
the existing long-term iron ore and iron ore pellets supply contracts are measured for the entire
contract period at the iron ore prices applying as of the respective balance sheet date. Compared
with September 30, 2016, purchase commitments rose by €3.0 billion to €10.1 billion as a result
of higher ore prices and exchange rate changes; of this €7.0 billion relates to the discontinued
operation Steel Americas.
There have been no material changes to the other commitments and contingencies since the end
of the last fiscal year.
thyssenkrupp interim report 1st half 2016 /2017
Condensed interim financial statements thyssenkrupp AG – Selected notes
38
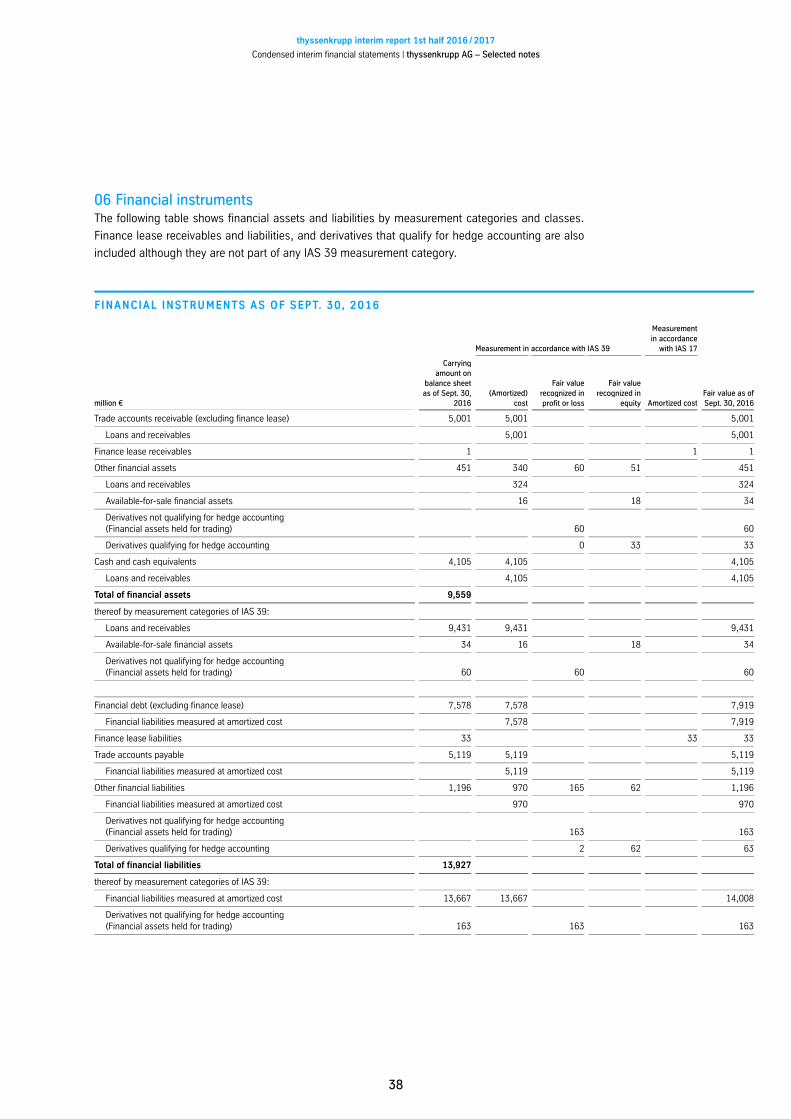
06 Financial instrumentsThe following table shows financial assets and liabilities by measurement categories and classes.
Finance lease receivables and liabilities, and derivatives that qualify for hedge accounting are also
included although they are not part of any IAS 39 measurement category.
FINANCIAL INSTRUMENTS AS OF SEPT. 30, 2016
Measurement in accordance with IAS 39
Measurementin accordance
with IAS 17
million €
Carryingamount on
balance sheetas of Sept. 30,
2016Amortized
cost
Fair valuerecognized inprofit or loss
Fair valuerecognized in
equity Amortized costFair value as ofSept. 30, 2016
Trade accounts receivable excluding finance lease 5,001 5,001 5,001
Loans and receivables 5,001 5,001
Finance lease receivables 1 1 1
Other financial assets 451 340 60 51 451
Loans and receivables 324 324
Available-for-sale financial assets 16 18 34
Derivatives not qualifying for hedge accountingFinancial assets held for trading 60 60
Derivatives qualifying for hedge accounting 0 33 33
Cash and cash equivalents 4,105 4,105 4,105
Loans and receivables 4,105 4,105
Total of financial assets 9,559
thereof by measurement categories of IAS 39:
Loans and receivables 9,431 9,431 9,431
Available-for-sale financial assets 34 16 18 34
Derivatives not qualifying for hedge accountingFinancial assets held for trading 60 60 60
Financial debt excluding finance lease 7,578 7,578 7,919
Financial liabilities measured at amortized cost 7,578 7,919
Finance lease liabilities 33 33 33
Trade accounts payable 5,119 5,119 5,119
Financial liabilities measured at amortized cost 5,119 5,119
Other financial liabilities 1,196 970 165 62 1,196
Financial liabilities measured at amortized cost 970 970
Derivatives not qualifying for hedge accountingFinancial assets held for trading 163 163
Derivatives qualifying for hedge accounting 2 62 63
Total of financial liabilities 13,927
thereof by measurement categories of IAS 39:
Financial liabilities measured at amortized cost 13,667 13,667 14,008
Derivatives not qualifying for hedge accountingFinancial assets held for trading 163 163 163

thyssenkrupp interim report 1st half 2016 /2017
Condensed interim financial statements thyssenkrupp AG – Selected notes
39
FINANCIAL INSTRUMENTS AS OF MARCH 31, 2017
Measurement in accordance with IAS 39
Measurementin accordance
with IAS 17
million €
Carryingamount on
balance sheetas of
March 31,2017
Amortizedcost
Fair valuerecognized inprofit or loss
Fair valuerecognized in
equity Amortized cost
Fair value asof March 31,
2017
Trade accounts receivable excluding finance lease 5,530 5,530 5,530
Loans and receivables 5,530 5,530
Finance lease receivables 1 1 1
Other financial assets 474 377 57 39 474
Loans and receivables 361 361
Available-for-sale financial assets 16 21 37
Derivatives not qualifying for hedge accountingFinancial assets held for trading 57 57
Derivatives qualifying for hedge accounting 0 19 19
Cash and cash equivalents 2,868 2,868 2,868
Loans and receivables 2,868 2,868
Total of financial assets 8,873
thereof by measurement categories of IAS 39:
Loans and receivables 8,759 8,759 8,759
Available-for-sale financial assets 37 16 21 37
Derivatives not qualifying for hedge accountingFinancial assets held for trading 57 57 57
Financial debt excluding finance lease 8,404 8,404 8,725
Financial liabilities measured at amortized cost 8,404 8,725
Finance lease liabilities 30 30 30
Trade accounts payable 5,300 5,300 5,300
Financial liabilities measured at amortized cost 5,300 5,300
Other financial liabilities 1,041 882 69 90 1,041
Financial liabilities measured at amortized cost 882 882
Derivatives not qualifying for hedge accountingFinancial assets held for trading 59 59
Derivatives qualifying for hedge accounting 10 90 100
Total of financial liabilities 14,776
thereof by measurement categories of IAS 39:
Financial liabilities measured at amortized cost 14,586 14,586 14,907
Derivatives not qualifying for hedge accountingFinancial assets held for trading 59 59 59
thyssenkrupp interim report 1st half 2016 /2017
Condensed interim financial statements thyssenkrupp AG – Selected notes
40
The carrying amounts of trade accounts receivable, other current financial assets as well as cash
and cash equivalents equal their fair values. The fair value of loans equals the present value of
expected cash flows which are discounted on the basis of interest rates prevailing on the interim
balance sheet date.
Available-for-sale financial assets primarily include equity and debt instruments. They are in
general measured at fair value, which is based to the extent available on market prices as of the
interim balance sheet date. When no quoted market prices in an active market are available and
the fair value cannot be reliably measured, equity instruments are measured at cost.
The fair value of foreign currency forward transactions is determined on the basis of the middle
spot exchange rate applicable as of the interim balance sheet date, and taking into account of
forward premiums or discounts arising for the respective remaining contract term compared to the
contracted forward exchange rate. Common methods for calculating option prices are used for
foreign currency options. The fair value of an option is influenced not only by the remaining term of
an option, but also by other factors, such as current amount and volatility of the underlying
exchange or base rate.
Interest rate swaps and cross currency swaps are measured at fair value by discounting expected
cash flows on the basis of market interest rates applicable for the remaining contract term. In the
case of cross currency swaps, the exchange rates for each foreign currency, in which cash flows
occur, are also included.
The fair value of commodity futures is based on published price quotations. It is measured as of
the interim balance sheet date, both internally and by external financial partners.
The carrying amounts of trade accounts payable and other current liabilities equal their fair values.
The fair value of fixed rate liabilities equals the present value of expected cash flows. Discounting is
based on interest rates applicable as of the balance sheet date. The carrying amounts of floating
rate liabilities equal their fair values.

thyssenkrupp interim report 1st half 2016 /2017
Condensed interim financial statements thyssenkrupp AG – Selected notes
41
Financial assets and liabilities measured at fair value could be categorized in the following three
level fair value hierarchy:
FAIR VALUE HIERARCHY AS OF SEPT. 30, 2016
million € Sept. 30, 2016 Level 1 Level 2 Level 3
Financial assets at fair value
Fair value recognized in profit or loss
Derivatives not qualifying for hedge accountingFinancial assets held for trading 60 0 60 0
Derivatives qualifying for hedge accounting 0 0 0 0
Fair value recognized in equity
Available-for-sale financial assets 18 16 3 0
Derivatives qualifying for hedge accounting 33 0 33 0
Total 111 16 96 0
Financial liabilities at fair value
Fair value recognized in profit or loss
Derivatives not qualifying for hedge accountingFinancial liabilities held for trading 163 0 51 113
Derivatives qualifying for hedge accounting 2 0 2 0
Fair value recognized in equity
Derivatives qualifying for hedge accounting 62 0 62 0
Total 227 0 114 113
FAIR VALUE HIERARCHY AS OF MARCH 31, 2017
million € March 31, 2017 Level 1 Level 2 Level 3
Financial assets at fair value
Fair value recognized in profit or loss
Derivatives not qualifying for hedge accountingFinancial assets held for trading 57 0 57 0
Derivatives qualifying for hedge accounting 0 0 0 0
Fair value recognized in equity
Available-for-sale financial assets 21 18 3 0
Derivatives qualifying for hedge accounting 19 0 19 0
Total 97 18 79 0
Financial liabilities at fair value
Fair value recognized in profit or loss
Derivatives not qualifying for hedge accountingFinancial liabilities held for trading 59 0 59 0
Derivatives qualifying for hedge accounting 10 0 10 0
Fair value recognized in equity
Derivatives qualifying for hedge accounting 90 0 90 0
Total 159 0 159 0
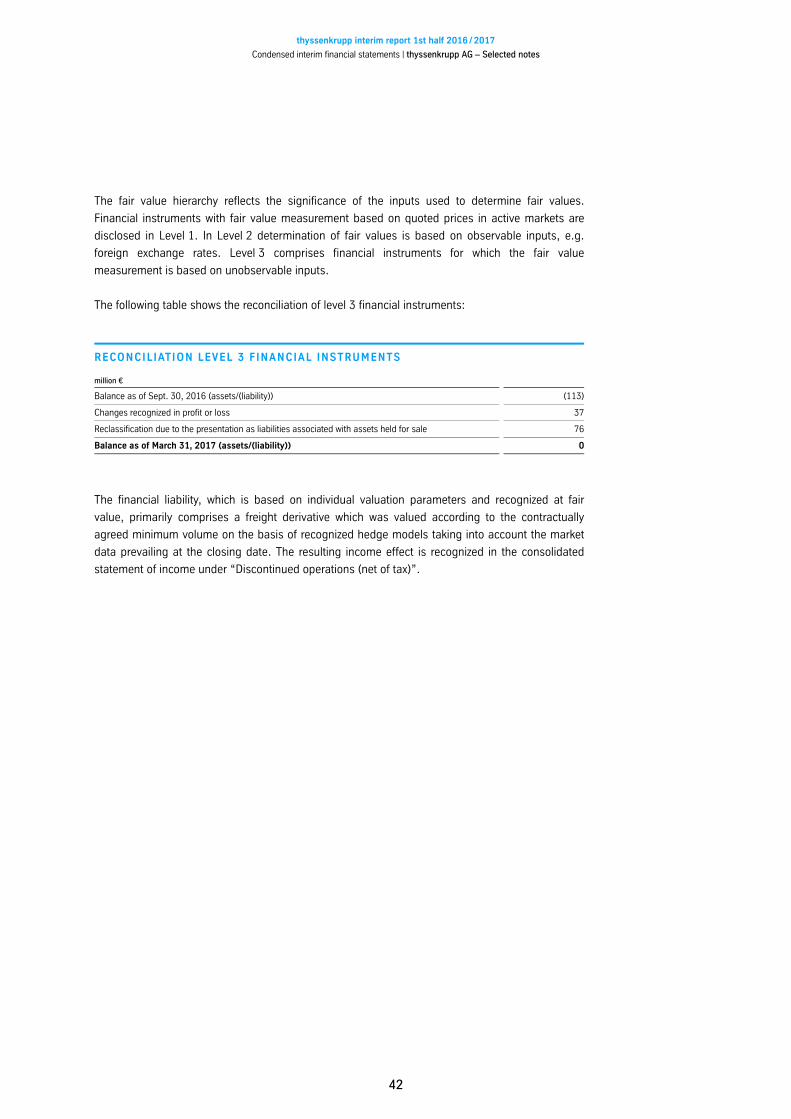
thyssenkrupp interim report 1st half 2016 /2017
Condensed interim financial statements thyssenkrupp AG – Selected notes
42
The fair value hierarchy reflects the significance of the inputs used to determine fair values.
Financial instruments with fair value measurement based on quoted prices in active markets are
disclosed in Level 1. In Level 2 determination of fair values is based on observable inputs, e.g.
foreign exchange rates. Level 3 comprises financial instruments for which the fair value
measurement is based on unobservable inputs.
The following table shows the reconciliation of level 3 financial instruments:
RECONCILIATION LEVEL 3 FINANCIAL INSTRUMENTS
million €
Balance as of Sept. 30, 2016 assets/ liability 113
Changes recognized in profit or loss 37
Reclassification due to the presentation as liabilities associated with assets held for sale 76
Balance as of March 31, 2017 assets/ liability 0
The financial liability, which is based on individual valuation parameters and recognized at fair
value, primarily comprises a freight derivative which was valued according to the contractually
agreed minimum volume on the basis of recognized hedge models taking into account the market
data prevailing at the closing date. The resulting income effect is recognized in the consolidated
statement of income under “Discontinued operations net of tax ”.

thyssenkrupp interim report 1st half 2016 /2017
Condensed interim financial statements thyssenkrupp AG – Selected notes
43
The notional amounts and fair values of the Group’s derivative financial instruments are as follows:
DERIVATIVE FINANCIAL INSTRUMENTS
million €Notional amount as of
Sept. 30, 2016Carrying amount as of
Sept. 30, 2016Notional amount as of
March 31, 2017Carrying amount as of
March 31, 2017
Assets
Foreign currency derivatives that do not qualify for hedge accounting 2,100 41 1,546 22
Foreign currency derivatives qualifying as cash flow hedges 360 14 459 11
Embedded derivatives 70 1 181 6
Interest rate derivatives qualifying as cash flow hedges1 618 9 118 3
Commodity derivatives that do not qualify for hedge accounting 278 18 382 29
Commodity derivatives qualifying as cash flow hedges 64 10 56 4
Commodity derivatives qualifying as fair value hedges 0 0 21 0
Total 3,490 93 2,763 76
Equity and liabilities
Foreign currency derivatives that do not qualify for hedge accounting 2,662 30 2,340 29
Foreign currency derivatives qualifying as cash flow hedges 400 7 426 14
Embedded derivatives 169 2 103 3
Interest rate derivatives that do not qualify for hedge accounting 11 0 18 1
Interest rate derivatives qualifying as cash flow hedges1 406 32 459 51
Commodity derivatives that do not qualify for hedge accounting2 483 131 395 26
Commodity derivatives qualifying as cash flow hedges 152 23 152 25
Commodity derivatives qualifying as fair value hedges 50 2 140 10
Total 4,332 227 4,032 159
1 Inclusive of cross currency swaps2 Inclusive of freights

thyssenkrupp interim report 1st half 2016 /2017
Condensed interim financial statements thyssenkrupp AG – Selected notes
44
07 Segment reportingSegment information for the 1st half ended March 31, 2016 and 2017, respectively and for the 2nd
quarter ended March 31, 2016 and 2017, respectively is as follows:
SEGMENT INFORMATION
million €ComponentsTechnology
ElevatorTechnology
IndustrialSolutions
MaterialsServices Steel Europe Corporate
SteelAmericas1 Consolidation Group
1st half ended March 31, 2016
Net sales 3,335 3,619 3,109 5,695 3,050 19 573 0 19,400
Internal sales within the Group 3 2 6 132 598 95 102 939 0
Total sales 3,338 3,621 3,115 5,827 3,649 114 675 939 19,400
EBIT 146 364 242 2 106 255 145 14 474
Adjusted EBIT 157 390 244 13 115 234 139 14 560
1st half ended March 31, 2017
Net sales 3,677 3,749 2,749 6,542 3,580 38 749 0 21,084
Internal sales within the Group 1 0 11 139 699 87 168 1,106 0
Total sales 3,678 3,749 2,761 6,681 4,279 125 917 1,106 21,084
EBIT 124 352 33 131 116 243 826 11 324
Adjusted EBIT 176 422 64 173 119 239 51 11 756
2nd quarter ended March 31, 2016
Net sales 1,687 1,751 1,605 2,933 1,608 4 264 0 9,852
Internal sales within the Group 1 1 4 73 317 50 61 506 0
Total sales 1,688 1,752 1,609 3,005 1,925 54 325 506 9,852
EBIT 76 171 152 3 56 122 61 8 281
Adjusted EBIT 86 186 153 10 65 117 65 8 326
2nd quarter ended March 31, 2017
Net sales 1,933 1,867 1,273 3,572 1,973 1 380 0 10,998
Internal sales within the Group 3 1 9 77 398 66 90 645 0
Total sales 1,936 1,868 1,282 3,649 2,371 67 470 645 10,998
EBIT 66 168 20 93 91 117 878 8 564
Adjusted EBIT 101 207 23 121 92 123 14 8 427
1 Discontinued operation
In the Industrial Solutions business area, average capital employed increased from € 475 million
as of September 30, 2016 to €241 million as of March 31, 2017.

thyssenkrupp interim report 1st half 2016 /2017
Condensed interim financial statements thyssenkrupp AG – Selected notes
45
Net sales as well as adjusted EBIT and EBIT reconcile to the respective figures as presented in the
consolidated statement of income as following:
RECONCILIATION NET SALES
million €1st half ended
March 31, 20161st half ended
March 31, 20172nd quarter ended
March 31, 20162nd quarter ended
March 31, 2017
Net sales as presented in segment reporting 19,400 21,084 9,852 10,998
– Net sales Steel Americas 573 749 264 380
Net sales as presented in the statement of income 18,827 20,335 9,588 10,617
RECONCILIATION EBIT TO EBT
million €1st half ended
March 31, 20161
1st half endedMarch 31, 2017
2nd quarter endedMarch 31, 20161
2nd quarter endedMarch 31, 2017
Adjusted EBIT as presented in segment reporting 560 756 326 427
Special items 86 1,080 45 991
EBIT as presented in segment reporting 474 324 281 564
+ Non-operating income/ expense from companies accounted for using the equitymethod 0 0 0 0
+ Finance income 647 622 277 238
– Finance expense 987 858 423 358
– Items of finance income assigned to EBIT based on economic classification 42 39 13 26
+ Items of finance expense assigned to EBIT based on economic classification 8 20 3 7
EBT-Group 185 580 151 703
– EBT Steel Americas 153 863 55 912
EBT from continuing operations as presented in the statement of income 338 283 206 208
1 Figures have been adjusted cf. Note 02 .

thyssenkrupp interim report 1st half 2016 /2017
Condensed interim financial statements thyssenkrupp AG – Selected notes
46
08 Earnings per shareBasic earnings per share are calculated as follows:
EARNINGS PER SHARE
1st half endedMarch 31, 20161
1st half endedMarch 31, 2017
2nd quarter endedMarch 31, 20161
2nd quarter endedMarch 31, 2017
Total amountin million €
Earnings pershare in €
Total amountin million €
Earnings pershare in €
Total amountin million €
Earnings pershare in €
Total amountin million €
Earnings pershare in €
Income/ loss from continuing operations net of taxattributable to thyssenkrupp AG’s shareholders 141 0.25 42 0.07 97 0.17 55 0.10
Income/ loss from discontinued operationsnet of taxattributable to thyssenkrupp AG’s shareholders 104 0.18 913 1.61 37 0.06 934 1.65
Net income/ lossattributable to thyssenkrupp AG's shareholders 37 0.07 871 1.54 61 0.11 879 1.55
Weighted average shares 565,937,947 565,937,947 565,937,947 565,937,947
1 Figures have been adjusted cf. Note 02 .
There were no dilutive securities in the periods presented.
09 Additional information to the consolidated statement of cash flowsThe liquid funds considered in the consolidated statement of cash flows correspond to the “Cash
and cash equivalents” line item in the consolidated statement of financial position taking into
account the cash and cash equivalents attributable to the discontinued operation. As of March 31,
2017 cash and cash equivalents of €0 million prior year: €114 million result from the joint
operation HKM.
10 Subsequent eventthyssenkrupp completed the full takeover of Atlas Elektronik in early April 2017.
Essen, May 8, 2017
thyssenkrupp AG
The Executive Board
Hiesinger
Burkhard Kaufmann Kerkhoff

thyssenkrupp interim report 1st half 2016 /2017
Review Report
47
Review ReportTo thyssenkrupp AG, Duisburg and Essen
We have reviewed the condensed consolidated interim financial statements – comprising the
consolidated statement of financial position, the consolidated statement of income and the
consolidated statement of comprehensive income, the consolidated statement of changes in equity,
the consolidated statement of cash flows and selected explanatory notes – and the interim group
management report of thyssenkrupp AG, Duisburg and Essen, for the period from October 1, 2016,
to March 31, 2017, which are part of the half-year financial report pursuant to § Article 37w
WpHG “Wertpapierhandelsgesetz” German Securities Trading Act . The preparation of the
condensed consolidated interim financial statements in accordance with the IFRS applicable to
interim financial reporting as adopted by the EU and of the interim group management report in
accordance with the provisions of the German Securities Trading Act applicable to interim group
management reports is the responsibility of the parent Company’s Board of Managing Directors.
Our responsibility is to issue a review report on the condensed consolidated interim financial
statements and on the interim group management report based on our review.
We conducted our review of the condensed consolidated interim financial statements and the interim
group management report in accordance with German generally accepted standards for the review
of financial statements promulgated by the Institut der Wirtschaftsprüfer Institute of Public Auditors
in Germany IDW and additional observed the International Standard on Review Engagements
“Review of Interim Financial Information Performed by the Independent Auditor of the Entity”
ISRE 2410 . Those standards require that we plan and perform the review so that we can preclude
through critical evaluation, with moderate assurance, that the condensed consolidated interim
financial statements have not been prepared, in material respects, in accordance with the IFRS
applicable to interim financial reporting as adopted by the EU and that the interim group
management report has not been prepared, in material respects, in accordance with the provisions
of the German Securities Trading Act applicable to interim group management reports. A review is
limited primarily to inquiries of company personnel and analytical procedures and therefore does not
provide the assurance attainable in a financial statement audit. Since, in accordance with our
engagement, we have not performed a financial statement audit, we cannot issue an audit opinion.
Based on our review, no matters have come to our attention that cause us to presume that the
condensed consolidated interim financial statements have not been prepared, in material respects, in
accordance with the IFRS applicable to interim financial reporting as adopted by the EU nor that the
interim group management report has not been prepared, in material respects, in accordance with the
provisions of the German Securities Trading Act applicable to interim group management reports.
Essen, May 11, 2017
PricewaterhouseCoopers GmbH Wirtschaftsprüfungsgesellschaft
Prof. Dr. Norbert Winkeljohann Michael Preiß
German Public Auditor German Public Auditor
thyssenkrupp interim report 1st half 2016 /2017
Responsibility statement
48
Responsibility statementTo the best of our knowledge, and in accordance with the applicable reporting principles for half-
year reporting, the condensed interim consolidated financial statements give a true and fair view of
the assets, liabilities, financial position and profit and loss of the Group, and the Group interim
management report includes a fair review of the development and performance of the business
and the position of the Group, together with a description of the principal opportunities and risks
associated with the expected development of the Group in the remaining months of the year.
Essen, May 8, 2017
thyssenkrupp AG
The Executive Board
Hiesinger
Burkhard Kaufmann Kerkhoff

thyssenkrupp interim report 1st half 2016 /2017
Additional information Contact and 2017 / 2018 financial calendar
Contact and 2017/2018financial calendar
For more information please contact:
Communications
Telephone:+49 201 844-536043
Fax: +49 201 844-536041
E-mail: [email protected]
Investor Relations
E-mail: [email protected]
Institutional investors and analysts
Telephone:+49 201 844-536464
Fax: +49 201 8456-900702
Private investors
Telephone:+49 201 844-536367
Fax: +49 201 8456-900702
Published by
thyssenkrupp AG
thyssenkrupp Allee 1, 45143 Essen, Germany
Postfach, 45063 Essen, Germany
Telephone:+49 201 844-0
Fax: +49 201 844-536000
E-mail: [email protected]
www.thyssenkrupp.com
2017 /2018 financial calendar
August 10, 2017
Interim report 9 months 2016 / 2017 October to June
Conference call with analysts and investors
November 23, 2017
Annual report 2016 / 2017 October to September
Annual press conference
Analysts’ and investors’ conference
January 19, 2018
Annual General Meeting
February 14, 2018
Interim report 1st quarter 2017 / 2018 October to December
Conference call with analysts and investors
May 15, 2018
Interim report on the 1st half 2017 / 2018 October to March
Conference call with analysts and investors
This interim report was published on May 12, 2017.
Produced in-house using firesys.
Forward-looking statements
This document contains forward-looking statements that reflect management’s
current views with respect to future events. Such statements are subject to risks
and uncertainties that are beyond thyssenkrupp’s ability to control or estimate
precisely, such as future market and economic conditions, the behavior of other
market participants, the ability to successfully integrate acquired businesses and
achieve anticipated synergies and the actions of government regulators. If any of
these or other risks and uncertainties occur, or if the assumptions underlying any
of these statements prove incorrect, then actual results may be materially different
from those expressed or implied by such statements. thyssenkrupp does not
intend or assume any obligation to update any forward-looking statements to
reflect events or circumstances after the date of these materials.
Rounding differences and rates of change
Percentages and figures in this report may include rounding differences. The signs
used to indicate rates of change are based on economic aspects: Improvements
are indicated by a plus + sign, deteriorations are shown in brackets . Very high
positive and negative rates of change ≥500% or ≤ 100 % are indicated by ++ and
−− respectively.
Variances for technical reasons
Due to statutory disclosure requirements the Company must submit this financial
report electronically to the Federal Gazette Bundesanzeiger . For technical reasons
there may be variances in the accounting documents published in the Federal Gazette.
German and English versions of the financial report can be downloaded from the
internet at www.thyssenkrupp.com. In the event of variances, the German version
shall take precedence over the English translation.
Additional information

Top Related