


Languages
Pages
Legal


1General Information | ECSA Annual Report 2016
The Engineering Council of South AfricaAnnual report for the year ended 31 March 2016
ENGINEERING COUNCIL OF SOUTH AFRICA
1st Floor, Waterview Corner Building
2 Ernest Oppenheimer Avenue
Bruma
2198
POSTAL ADDRESS:
Private Bag X691
Bruma
Johannesburg
2026
ENGINEERING COUNCIL OF SOUTH AFRICA
EN
GIN
EER
ING
CO
UN
CIL
OF S
OU
TH
AFR
ICA
AN
NU
AL R
EPO
RT
20
15
/20
16

3
The Engineering Council of South AfricaAnnual report for the year ended 31 March 2016
Contents
Part AGeneral Information .......................................................................................................5 ECSA General Information ......................................................................................................................6
List of Abbreviations/Acronyms ...............................................................................................................7
Foreword by the President ......................................................................................................................9
ChiefExecutiveOfficer’sOverview ....................................................................................................... 11
Statementofresponsibilityandconfirmationofaccuracyfortheannualreport ....................................16
Strategic Overview ................................................................................................................................17
Legislative and Other Mandates ............................................................................................................18
Organisational Executive Structure .......................................................................................................19
Part BPerformance Information .............................................................................................21 Situational Analysis ...............................................................................................................................22
Strategic Outcome Oriented Goals .......................................................................................................24
Performance Information by Programme ..............................................................................................25
Strategic Services Functions .................................................................................................................53
Engenius Report ....................................................................................................................................56
UNESO Africa Engineering Week .........................................................................................................58
International Engagements ...................................................................................................................61
Revenue Collection ...............................................................................................................................62
Capital Investment ................................................................................................................................62
Key Stratergy Partneships - Recognised Voluntary Associations .........................................................63
Part CGovernance ...................................................................................................................67 Composition of the Council ...................................................................................................................70
Committee Structures ............................................................................................................................71
Executive Authority: ...............................................................................................................................72
Accounting Authority ..............................................................................................................................72
Risk Management ................................................................................................................................90
Internal Audit, Risk and Compliance Committee ...................................................................................93
Key Activities and Objectives of the Internal Audit ................................................................................93

4 5General Information | ECSA Annual Report 2016
The Engineering Council of South AfricaAnnual report for the year ended 31 March 2016
The Engineering Council of South AfricaAnnual report for the year ended 31 March 2016
Compliance with Laws and Regulations ................................................................................................95
Fraud and Corruption ............................................................................................................................95
PreventingConflictofInterest ...............................................................................................................95
Code of Conduct ................................................................................................................................96
Social Responsibility .............................................................................................................................97
Audit Committee Report ........................................................................................................................98
Part DOverview of Human Resources.................................................................................101 Overview of Human Resources ...........................................................................................................104
Human Resource Oversight Statistics .................................................................................................105
Part EFinancial Information ................................................................................................. 111
Part AGeneral Information

6 7ECSA Annual Report 2016 | General Information General Information | ECSA Annual Report 2016
The Engineering Council of South AfricaAnnual report for the year ended 31 March 2016
The Engineering Council of South AfricaAnnual report for the year ended 31 March 2016
REGISTERED NAME: Engineering Council of South Africa REGISTRATION NUMBER (if applicable): N/A PHYSICAL ADDRESS: 1st Floor Waterview Corner Building 2 Ernest Oppenheimer Avenue Bruma 2198 POSTAL ADDRESS: Private Bag X691 Bruma Johannesburg 2026 TELEPHONE NUMBER: + 27 11 607 9500 FAX NUMBER: + 27 11 622 9295 EMAIL ADDRESS: [email protected] WEBSITE ADDRESS: www.ecsa.co.za EXTERNAL AUDITORS: PricewaterhouseCoopers Inc. 2 Eglin Road Sunninghill 2157 www.pwc.com/za BANKERS: Standard Bank East Gate Bedfordview COMPANY/BOARD SECRETARY None, Administration Department performs some of the secretarial duties
2. List of Abbreviations/AcronymsAEW Africa Engineering WeekAoPI Audit of performance informationARC Audit, Risk and Compliance CommitteeBE Built EnvironmentCPUT Cape Peninsula University of TechnologyCBE Council for the Built EnvironmentCC Competition CommissionCEO ChiefExecutiveOfficerCERTAC CertificatedEngineerAccreditationCommitteeCESA Consulting Engineers South AfricaCHE Council on Higher EducationCIDB Construction Industry Development BoardCIM Communication, Information and MarketingCOP Code of PracticeCPD Continuing Professional DevelopmentCPUT Cape Peninsula University of TechnologyCRC Central Registration CommitteeCUT Central University of TechnologyDEA DepartmentofEnvironmentalAffairsDHET Department of Higher Education and TrainingDME Department of Minerals and EnergyDoL Department of LabourDPW Department of Public WorksDST Department of Science and TechnologyDUT Durban University of TechnologyEC Education CommitteeECN Engineering Council of NamibiaECSA Engineering Council of South AfricaECZ Engineering Council ZimbabweELOs Exit Level OutcomesEMF Engineers Mobility ForumEP Engineering ProfessionEPA Engineering Profession Act, 2000 (Act No 46 of 2000)EPAC Engineering Programme Accreditation CommitteeEPQEC EngineeringProgrammeQualificationsandExaminationsCommitteeESA Employer Surplus AccountESGB Engineering Standards Generating BodyETMF EngineeringTechnologists’MobilityForumEXCO Executive CommitteeF&S FinanceandStaffCommitteeGGI Gillian Gamsy InternationalGRAP South African Standards of Generally Recognised Accounting PracticeGSSA Geological Society of South AfricaHEQC HigherEducationQualificationCouncilHEQF HigherEducationQualificationsFrameworkHESA Higher Education South AfricaHR Human ResourcesIAC InternationalAffairsCommitteeIC Investigating CommitteeICE Institution of Civil Engineers
1. ECSA General Information

8 9ECSA Annual Report 2016 | General Information General Information | ECSA Annual Report 2016
The Engineering Council of South AfricaAnnual report for the year ended 31 March 2016
The Engineering Council of South AfricaAnnual report for the year ended 31 March 2016
IDOEW IdentificationofEngineeringWorkSteeringCommitteeIFEES International Federation of Engineering Education Societies IFRS International Financial Reporting StandardsIMESA Institute of Municipal Engineering of Southern AfricaIMSSA Institute of Mine and Surveyors of South AfricaIT Information Technology CommitteeJIC Joint Implementation CommitteeLMI Lifting Machinery Inspectors registration committeeMoU Memorandum of UnderstandingMUT Mangosuthu University of TechnologyNATED National Technical EducationNDP National Development PlanNBS NationalBeneficiationStrategyNC NationalCertificateNHBRC National Home Builders Registration CouncilNIP National Infrastructure PlanNQF NationalQualificationsFrameworkNRCS NationalRegulatorforCompulsorySpecificationsNRS New Registration SystemsPAC Professional Advisory CommitteePICC Presidential Infrastructure Coordinating CommissionPLATO South African Council for Professional and Technical SurveyorsQEC QualificationsEvaluationCommitteeSAC Strategic Advisory CommitteeSACNASP SouthAfricanCouncilforNaturalScientificProfessionSACPE South African Council for Professional EngineersSAGI South African Geomatics InstituteSAICA South African Institute of Chartered AccountantsSAIMM Southern African Institute for Mining and MetallurgySALGA South African Local Government AssociationSAQA SouthAfricanQualificationsAuthoritySASEE South African Society of Engineering EducationSAYEP South African Youth into Engineering ProgrammeSCM Supply Chain ManagementSEESA Society of Engineering Educators South AfricaTECHNO SGG Technology Standard Generating GroupTPAC Technology Programme Accreditation CommitteeTPQEC TechnologyProgrammeQualificationsandExaminationsCommitteeTUT Tshwane University of TechnologyTT Task TeamUCT University of Cape TownUK United KingdomUKZN University of KwaZulu NatalUNESCO UnitedNationsEducationScientificandCulturalOrganisationUP University of PretoriaVA Voluntary AssociationVC Vice -ChancellorWA Washington AccordWFEO World Federation of Engineering OrganisationsWSU Walter Sisulu University
3. Foreword by the PresidentI feel very privileged to have served the engineering profession and to contribute to the growth and prosperity of the South African society, as I ponder over the events that took place within the four year term of this outgoing Council. I am overwhelmed with humility in the acknowledgement that a new and impactful chapter of history has been written. A sequence of achievements took shape at the helm of Council representatives that consisted of ambitious, experienced and motivated individuals. Several members were engineering practitioners; some members of the community; and there was a diverse group of consulting experts, private and state owned enterprises. I am particularly grateful to Council representatives for having successfully steered this chapter towards a direction of endless possibilities. They served ECSA diligently and provided strategic leadership to committees and management. ECSA was able to deliver its mandate from the constitutional purpose of ECSA as detailed in the Annual Performance Plan and Operational Plan which is a year by year prognosis of the strategies of the Council.
I also reflect on a term that was characterised by change.Change is a termandprocess that is defineddifferently forvarying organisations, but within the context of ECSA, it refers toconsistenteffortsofensuringviableandrelevantresponsesfor:
• Engineeringpractitionerstoenjoythebenefitofworldclasseducationandregistration.• Promote public awareness of the profession and its standards and regulation to ensure the
implementation of those standards in the public interest.• Engineeringpractitionerstoproactivelyrespondtolocalandnationalsocio-economicrequirements.• Ensuringasustainable, transformedandcoherentorganisationthat iscapableofdeliveringthe
impact desired by its stakeholders and society.
These responses are an integral part of ECSA operations as they each focus on an inclusive and well balanced value creation system over the short, medium and long term. The New Registration System (NRS) is a good example. The NRS is a registration tool to ensure that ECSA delivers a convenient, innovative and quicker service to its primary stakeholders, the engineering practitioners within the built environment. NRS is still top on operational priorities as the roll out for its paper based version continues for various categories of registration. An online version of NRS is concurrently being developed not only to assist in the registration process but also to give access to registered persons to update details personally, log queries and also to log Continuing Professional Development (CPD) activities and renew theirregistrations.Thisintegratedprojectisindicativeofhowtheorganisation’svaluecreationprocessisimpacted by its internal and external environment and the drive to strive for improvement of organisational infrastructure for the betterment of its culture and realisation of its mandate.
Various high impact committees have played a key role in advancing the objectives of ECSA. The Audit and Risk Committee (ARC), Strategic Advisory Committee (SAC) and Transformation Committee (TC) for example, amongst others strived to ensure impact within strategy, governance, performance and future outlook of ECSA by reworking several policies that determined key decisions. It worked on capacitating theorganisationtobefinanciallyviableandensuringacultureofaccountability.
Cyril Vuyani GamedeECSA President
2. List of Abbreviations/Acronyms (cont.)

10 11ECSA Annual Report 2016 | General Information General Information | ECSA Annual Report 2016
The Engineering Council of South AfricaAnnual report for the year ended 31 March 2016
The Engineering Council of South AfricaAnnual report for the year ended 31 March 2016
Therewasalsosignificantprogressthatwasmadewithstrategic initiativessuchasIdentificationofEngineering Work that need to be reserved for registered persons. These negotiations continue with key stakeholders such as the Competition Commission and the Department of Public Works (DPW) sothataneffectivesystemforregulatingworkbecomesapriority for thesafetyof theenvironmentwithin which ECSA exists and is mandated to protect. Noteworthy strides have been taken to broaden the international platform that ECSA can use to participate and gain more credibility. These platforms include the World Federation of Engineering Organisations (WFEO) which covers the national and international engineering fraternities. As a result, the Southern African Federation of Engineering Organisations (SAFEO) forum is still at the stages of establishment. These also give the origin of the Central Engineering Consultancy Bureau (CECB) project capacity building forum that ECSA will be overseeing. The African Engineering Alliance is a mobilisation unit that seeks to ensure the implementationofprojectsinthecontinent.Inhindsight,thevisionisforECSAtoinfluenceandleadthe engineering developmental agenda of the African continent.
In conclusion, ECSA concludes the 2015/16 chapter with considerable triumphs but nonetheless still confronting some on-going challenges.TheCouncil, volunteers and staff remain committed todischarging their duties with commitment to improve the organisation. I wish to thank each and every recognised Voluntary Association for your valued inputs to the constitutional and operational strategy of the Council. This report seeks to provide a transparent and balanced appraisal of all contributions considering both qualitative and quantitative matters that are material to our operations.
IwouldliketothanktheentirestaffcollectiveofECSA,fromExecutiveleveltogeneralworkers.YourinvaluableeffortscontinuetoaddvaluetowardsengineeringexcellenceinSouthAfrica.
Yours sincerely,
.........................................Cyril Vuyani GamedeECSA President
4. Chief Executive Officer’s Overview1. Overview
a. Interpretation of the mandateSection 22 of the Constitution of the Republic of South Africa states that, “Every citizen has the right to choose their trade, occupation or profession freely. The practice of a trade, occupation or profession may be regulated by law”. South Africa took a decision to regulate the engineering profession through the Engineering Profession Act (EPA). The EPA gave rise to the establishment Engineering Council of South Africa (ECSA) and grants the Council power to regulate the profession sequentially through the development of policies, standards and procedures; registration, accreditation and quality assurance; professional conduct management and through management of Continuing Profession Development (CPD). Furthermore, ECSA is mandated to develop the Identification of Engineering Work (IDoEW) for registered persons together with related fees thereto. This goes along with the development and gazzeting of the scope of services and fees for practicing engineers.
However, there are other unlegislated but additional mandates that flow our way from time to time, emanating from expectations from government, registered persons and voluntary associations. These include, inter alia:
• Fromgovernment–ECSAisexpectedtoplayaroletowardssocio-economicdevelopmentandtoalignitsplanswithgovernment’s14outcomeswhichareintendedtoachievethegoals of vision 2030 through the National Development Plan (NDP).
• From the professionals (on matters of public discourse, particularly those who haveinterestinthemattersoftheprofession)–ECSAisexpectedtobecomethevoiceoftheprofession where it articulates the aspirations of its registered persons regarding what should happen in the engineering space and also to serve and protect their turf.
• Fromcandidates–ECSAisexpectedtoactasavoiceof theprofessionand interveneto ease the skills pipeline through which candidates get developed towards professional registration.
• From Voluntary Associations (VA’s) (these are societies of engineering knowledge) –ECSA is expected to maintain a tradition of a peer-led institution as it regulates the profession.
It is therefore paramount for our stakeholders to appreciate this disposition where there are common and contradicting views, expectations and mandates regarding ECSA’s role. Thisannual report will seek to report on the mandate, strategic objectives and operational plans to give effect to our mandate and expectations of our stakeholders.
Sipho MadonselaECSA CEO

12 13ECSA Annual Report 2016 | General Information General Information | ECSA Annual Report 2016
The Engineering Council of South AfricaAnnual report for the year ended 31 March 2016
The Engineering Council of South AfricaAnnual report for the year ended 31 March 2016
Council has also decided to hear all appeals against registration on its plenary sessions so as to apply collective wisdom to bring about fairness in the registration process as per; “the Council may delegate anyofitspowersintermsofthisActtoacommittee,astaffmemberoramemberofthecounciloranyother person or body of persons, excluding the power to hear an appeal” (EPA, Section 40(2)), whereas inthepastitwasdealtwithdifferently.
3. Growth and Retentions
ForthefirsttimeinthehistoryofECSA,thenumberofregisteredpersonshavegonebeyondthe50000mark. There was an expected growth of registered persons that depended on the exemption application with the Competition Commission (CC) on the IDoEW. Unfortunately on 10 February 2016, the CC rejected the exemption application in respect of the Guideline Fees of all the six Built Environment Professional Councils (BEPCs). Furthermore, On 20 January 2016, the Competition Commission (CC) rejectedtheexemptionapplicationinrespectoftheDraftIdentificationofWorkRegulationsofallthesixBuilt Environment Professional Councils (BEPCs). Therefore, the growth targets which will be in place in the future may have to happen organically because of this important outcome.
4. Promotion of Public Awareness
Thisareawasachievedthroughrigorouseffortstowardsengineeringcapacitybuilding.Thefollowingprogrammes have been implemented in the promotion of, and public awareness about engineering and what role ECSA plays in the engineering space:
Sakhimfundo Trust – the trust has been established in order to collect funds for the purposes ofimproving the “talent pipeline” and talent pool from schools into University or other Tertiary Educational Provider by providing full bursaries for deserving poor students and mentorship to Engineering students andgraduates.TheTrusthasbeenregisteredasaPublicBenefitOrganization(PBO)inordertoattractdonors and that the donors may be able to claim on their tax deductions.
Engenius–thisprogrammeexposeslearnersatschoollevelstoengineeringcareerandgivesthemthe opportunity to showcase their engineering aligned ideas through elementary tools. In the 2015/16 financialyear,Engeniusmanagedtointeractwith22381learners.
Africa Engineering Week (AEW) – The national AEW is held annually in collaboration with theDepartment of Science and Technology (DST) with the aim of increasing the visibility of engineering and its role in sustainable development and also to encourage students to study engineering. The event was held at the Mangosuthu University of Technology, Durban, where 1248 delegates were hosted and 2 580 learners attended the exhibitions. The event was sponsored by ECSA, DST and the Ethekwini Municipality and in this regard we would like to express our gratitude for their support.
Visits to corporate companies – In our drive to forge relationships with corporate companies andgovernment, we visited nine (9) companies regarding the steps towards professional registration. Furthermore, we visited 5 institutions, including Ethekwini and Ekurhuleni Municipalities regarding the developmentofspecifiedcategories.
b. Areas informed by the mandate A new unit was created called the Policy Development and Standard Generation division to deal with issues of excellence, relevance, educational, global and competency standards. The division is populatedwith3employees,withanotheronebeingaddedinthenextfinancialyear.
• The New Registration System (NRS). The New Registration System (NRS) was introduced and migration from the legacy system was initiated to give way for the outcome-based system for registration. One hundred and ten (110) voluntary peerassessorshadbeentrainedasat theendof the2015/16financialyear.Theprojectcouldnotbe completed under the period under review due to complexities and multiplicity of categories and disciplines of registration as well as integration with other existing enterprise operations. These include makingapplicationforregistration,financialrecordofregisteredpeopleandCPD.Thisremainsworkin progress until a special purpose IT platform is designed and implemented. We are also developing a web based IT online system platform for the entire organization which will integrate all the systems forthepurposeofefficiency.Wearealsolookingintoexpandingthescopeofregisteredpersonsbylookingcloselyattheregistrationofspecifiedcategories.
c. Financial Performance During the2015/16financial yearwe received revenueofR81,549,781whichshowedan increaseof 18%as compared to the2014/15 financial year.However,with thismarked increase, the fundsavailablearestillnotadequatetofinancealltheprojectsinourplans.Wealsoreceivedanunqualifiedauditreportfromtheauditorsforthe2015/16financialyear.Thisachievementisdespitethefactthatall revenue comes from subscriptions of registered persons including a challenge of defaulters who constitute 4% of all registered persons.
Since ECSA is not an organ of state, it is not registered as a Public Finance Management Act (PFMA) organizationinaccordancewithTreasury.However,wecontinuetomakeeffortstofollowthePFMAprinciples.
d. Financial Sustainability Plan Council took a resolution to craft a financial sustainability plan for the future, indicating a planwhich depicts medium to long term interventions that are being put in place in order to ensure the sustainability of the organization in the long run. The interventions include, inter alia, savings from the reduced discount for registered persons belonging to voluntary associations as recognized by ECSA, thegenerationof revenuefromAfricaEngineeringWeek,specifiedcategoriesandtheregulationofContinuing Professional Development (CPD).
2. Transparent and Fair Processes
Council has piloted a project of recording of interviews at all stages of registration process. This is to ensure that the previous allegations of ECSA being a gate-keeper are alleviated. However, it is very unfortunate that theVA’s,whoareourkeypartners in thisprocess,haveshownoutright resistanceto cooperate with us. This has forced ECSA to carry out its mandate directly with their members and non-members who are in our database of assessors. We are still expanding the database and are encouraged by the response and the outcome borne out of this alternative process.

14 15ECSA Annual Report 2016 | General Information General Information | ECSA Annual Report 2016
The Engineering Council of South AfricaAnnual report for the year ended 31 March 2016
The Engineering Council of South AfricaAnnual report for the year ended 31 March 2016
8. Responsiveness to decision-makers through excellent stakeholder relationships
Our response to media interviews and press releases has since improved. We have taken some of our executivesthroughmediatrainingforeffectivecommunicationandinterviewskillsaswecontinuetouphold and protect the ECSA brand. Some of the interviews that have been on the main headlines in the 2015/16 period include, inter alia, the Media reports on the Prasa matter where there was acclaim of unregistered person designated for the rail infrastructure registration status and the collapse of the Greyston pedestrian bridge in Sandton.
9. Development of funding proposals
We have received funding from Council for the Built Environment (CBE) towards the development of the New Registration System (NRS). The project is still on course to revamp the whole registration process.
Furthermore, Council took a resolution to diminish the discount of registered members who are also membersoftheVA’sby10%.Thefundsfromthisdiscountwillberedirectedandusedforthefollowingprojects:
• TheReviewofFrameworkforRecognitionofVA’sandCPDRegulation• AuditsofVA’sManual• EngineeringSouthAfricaAccord–thisprojectseekstodriveacommonandsharedcommitment
between industry and the profession forward and align it with the NDP and NIP.
10. Managing a sustainable and transformed ECSA
InOctober2015,theentirecomplimentofECSAstaffmetwiththeMinisterofPublicWorks,HonourableThulasNxesiatStellenbosch,WesternCapetodeliverforthefirsttimeourorganizationalstrategyfor2015-2020 and the 2015/16 Annual Performance Plan. In our discussion, we implored the Minister to review the legislation together with certain rules and regulations. At this meeting, the Chairperson and the CEO of the Engineering Council of Zimbabwe (ECZ), Engineers Martin Manhuwa and Ben Rafemoyo, respectively, were in attendance. Also attending were some members of the EXCO of Council.
In conclusion, we extend sincere gratitude to the Council for the Built Environment (CBE) for their continued support and inputs towards the programmes and policies of ECSA. We are well aware that we function within a much broader built environment society as we strive to make meaningful contributions for the legacy of this Council. We thank all the Voluntary Associations and volunteers who tirelessly contribute towards the livelihood of this organisation. We also wish to thank all Council members for theirstandingcontributionstowardsthedeliveryoftheECSAmandateandECSAstaffmemberswhogiveeffecttoECSAstrategy.
Yours sincerely,
______________________Sipho Madonsela, Pr Eng.ECSA CEO
5. Protection of Health
Through the management of conduct of ECSA ‘s registered persons, ECSA regulates the profession togiveeffecttoprotectionofhealthandsafetyandtheinterestsofthepublic.Tothisextent,wehavefinalised24outof49casesattheendofthe2015/16financialyear,includingtheinvestigationonthecollapse of the Greyston pedestrian bridge in Sandton.
Our failure to secure the exemption from the Competition Competition on IDoEW erodes our authority toenforceengineeringstandardsthatwillgiveeffecttotheprotectionofhealth,safetyandinterestofthe public.
6. Research into strategic contribution
ThoughtLeadership–Thisisameansandspacewherebyengineersarerecognizedasauthorityandwhose expertise is sought and often rewarded. It is a vehicle by which ECSA and the engineering profession is contributing to national debate, influence public policy and make the expertise andknowledge of the profession available to government, and also make the ECSA an advisor of choice to government and various stakeholders. Through this platform, we have engaged various stakeholders and identifiedon-going research topicsof interest to thenationalagendawhere improvementsandresources could be channeled for the betterment of service delivery, poverty alleviation and curb against unemployment in South Africa. The research work is done in-house with collaboration from other strategic stakeholders.
7. ECSA’s international standing through compliance with international accords and agreements
We have continued to be recognized members in the Washington, Dublin and Sydney Accords which sets and benchmark internationally engineering programmes for Engineers, Technicians and Technologists, respectively. We are also party to the Competence Agreements such as the International Professional Engineers Agreement (IPEA), International Engineering Technologist Agreement (IETA) and Agreement for International Engineering Technicians (AIET) where the International Engineering Alliance(IEA)servesasapresidingbody.ECSA’sCouncilmembersDrKeithJacobsandMrJonesMoloisane serve as Chairperson and deputy chairperson of AIET and IETA, respectively.
In May/June of 2015, a delegation from ECSA representing South Africa attended a meeting in Instabul, Turkey - where various resolutions to recognize National Registers for International Register and toestablishnewTechniciancompetencyagreement–Agreement for InternationalEngineeringTechnicians (AIET) were taken.
We also participate at the World Federation of Engineering Organizations (WFEO) where Mr Yashin Brijmohan,ECSA’sCouncilmember,servesasoneoftheVice–PresidentspresidingoverengineeringCapacity Building at a global scale. He also serves as the Chairperson of the Chairpersons of the other nine (9) Vice-Presidents who preside over various portfolios.
In December of 2015, another delegation went to Kyoto, Japan at the World Engineering Conference and Convention. A delegation from ECSA also attended the SAFEO UNESCO AEW in September 2015 at Victoria Falls, Zimbabwe.ECSA was appointed to organize the UNESCO Africa Engineering Week which was held at the Mangosuthu University of Technology in September 2015.

16 17ECSA Annual Report 2016 | General Information General Information | ECSA Annual Report 2016
The Engineering Council of South AfricaAnnual report for the year ended 31 March 2016
The Engineering Council of South AfricaAnnual report for the year ended 31 March 2016
ECSA Vision
Engineering excellence, transforming the nation.
ECSA Mission
ECSA seeks to achieve this vision through:• Determiningstandards foreducationandaccreditationofeducationalprogrammesaswellas
registration of engineering practitioners• Developingandsustaininga relevant, transformed, competentand internationally recognised
engineering profession• Educatingthepubliconexpectedengineeringqualitystandardsandprotectingtheinterestofthe
public against sub-standard quality of engineering work;• Regulatoryeffortstoensureenvironmentalprotection,and• Engagingwithgovernmenttosupportnationalpriorities
ECSA Values
• Professional – Conductbeyondreproachtothehighestethicalstandards underpinned by quality, timelines, trust and respect;
• Accountable – Doingwhatwecommittodoinanenvironmentoftrustandrespectandbeinganswerable for our failures to meet our committed obligations;
• Collaborative – Workingasateamtoachieveexceptionalresults;• Transparent – Honestandopencommunicationandsharingofinformation
between stakeholders
6. Strategic Overview5. Statement of responsibility and confirmation of accuracy for the annual report
To the best of my knowledge and belief, I confirm the following:
All information and amounts disclosed in the annual report is consistent with the annual financialstatements audited by the PricewaterhouseCoopers Inc.
The annual report is complete, accurate and is free from any omissions.
The annual report has been prepared in accordance with the guidelines on the annual report as issued by National Treasury.
The Annual Financial Statements (Part E) have been prepared in accordance with the South African standards of Generally Recognised Accounting Practice (GRAP) applicable to the public entity.
Theaccountingauthorityisresponsibleforthepreparationoftheannualfinancialstatementsandforthe judgements made in this information.
The accounting authority is responsible for establishing, and implementing a system of internal control designed to provide reasonable assurance as to the integrity and reliability of the performance information,thehumanresourcesinformationandtheannualfinancialstatements.
Theexternalauditorsareengagedtoexpressanindependentopinionontheannualfinancialstatements.
Inouropinion,theannualreportfairlyreflectstheoperations,theperformanceinformation,thehumanresourcesinformationandthefinancialaffairsoftheentityforthefinancialyearended31March2016.
Yours faithfully
___________________ ___________________ ChiefExecutiveOfficer PresidentoftheCouncilMr Sipho Madonsela Mr Cyril Vuyani Gamede26 August 2016 26 August 2016

18 19ECSA Annual Report 2016 | General Information General Information | ECSA Annual Report 2016
The Engineering Council of South AfricaAnnual report for the year ended 31 March 2016
The Engineering Council of South AfricaAnnual report for the year ended 31 March 2016
The Engineering Council of South Africa (ECSA) is a statutory body established in terms of the Engineering Profession Act, 2000 (Act No. 46 of 2000) (EPA). This Act superseded the Acts of 1990 and1968andprogressivelyextendedECSA’sscopebeyondtheoriginalpurpose,namelytoregulateProfessional Engineers. ECSA and its predecessor have thus regulated engineering practice for forty (40) years.
ECSA exists as a regulatory body for the profession of engineering because of the recognition that, whileengineeringactivityisessentialandbeneficialtosocietyandtheeconomy,substantialriskstohealth, safety and the environment accompany engineering activity that must be managed by competent professionals. In addition, engineering services must be of adequate quality in the interests of economy and avoidance of waste.
With these objectives in mind, the EPA requires and empowers ECSA to perform the following functions:
• Establish an engineering standards generating body (ESGB) and develop standards forengineering education and professional competency
• Visit educationproviders toevaluateprogrammesandaccredit educational programmes thatmeet the educational requirements toward registration in each of the categories;
• Registerpersonsinprofessionalcategorieswhodemonstratecompetencyagainstthestandardsfor the categories;
• Evaluateeducationalqualificationsthatarenotalreadyaccreditedorrecognised;• Registerpersonswhomeeteducationalrequirementsincandidatecategories;• Establish specified categories of registration to meet specific health and safety licencing
requirements and register persons in these categories; • Requireregisteredpersonstorenewregistrationatintervalsandunderconditionsthatthecouncil
prescribes; • Enter into international agreements for the recognition of educational programmes and
registration;• Developandmaintainacodeofconduct,supportedwherenecessarybycodesofpractice;• Investigatecomplaintsof improperconductagainst registeredpersonsandconductenquiries
and impose sanctions as each case requires; • Annuallypublishguidelineprofessionalfeesandscopeofwork;• RecogniseVoluntaryAssociations(VA’s);• RecommendtotheCouncilfortheBuiltEnvironment(CBE)ECSA’sidentificationofthetypeof
engineering work which may be performed by persons registered in any category.
In addition, ECSA is empowered to advise government and other parties and to take necessary steps to protect the public interest, health and safety, improve standards of engineering services, create awareness of the need to protect the environment and conduct research.
Professional Regulation of engineering in SouthAfrica dates from the Professional Engineers’Act1968 (Act 81 of 1968) that provided for the registration of Professional Engineers. The Engineering Profession Act, 1990 (Act No 114 of 1990) expanded registration to engineering technologists, engineering technicians and certificated engineers.TheEPAestablishedECSA in its present formandgaveprofessionalstatustoEngineeringTechnologists,EngineeringTechniciansandCertificatedEngineers.
7. Legislative and Other Mandates 8. Organisational Executive Structure
SiphoMadonsela
CEO
Ms. Conny PhalaneExecutive: Corporate Services
(Responsible for Finance, Supply Chain Management and Human
Resources)
Adv. Rebaone GaoraelweExecutive: Statutory Function (Responsible for education,
registrations, CPD professional conduct and legal Services)
Mr Edgar SabelaExecutive: Strategic Services - until
end of January 2016. (Responsible for strategy,
stakeholder relations, marketing and communications, research, thought
leadership and business development)
Ms. Thoko MachimaneActing Executive: Strategic Services -
until end of March 2016
Mr John CatoExecutive: Policy Development &
Standards Generation(Responsible for Development &
Management of Policies, Standards and Procedures and IT)

20 21ECSA Annual Report 2016 | General Information General Information | ECSA Annual Report 2016
The Engineering Council of South AfricaAnnual report for the year ended 31 March 2016
The Engineering Council of South AfricaAnnual report for the year ended 31 March 2016
Part BPerformance Information

22 23
The Engineering Council of South AfricaAnnual report for the year ended 31 March 2016
The Engineering Council of South AfricaAnnual report for the year ended 31 March 2016
Performance Information | ECSA Annual Report 2016ECSA Annual Report 2016 | Performance Information
9. Performance Information9.1 Situational Analysis
9.1.1 Service Delivery Environment
Most of the targets as expressed in the APP for the year under review were not achieved mainly becauseeffortswerefocusedonrestructuringandrealignmentofthebusinessprocesses,reviewoftheorganogram,developingofreportingandmonitoringinstruments,orientationofthestaffonthenewprocesses and the recruitment of key personnel such as the Quality Manager in order to operationalise the new strategy. Council considered the targets and approved for the roll-over of the performance targetstothe2016/17financialyear.
9.1.2 Organisational Environment
The Council approved the 2015-2020 Strategic Plan on the 19 March 2015. At the beginning of the year under review, administration embarked on developing the Annual Performance Plan (APP). The APP was approved on the 27 August 2015, which was followed by the review of the organogram that was approved on the 24 March 2016 in order to support the newly approved strategy. It was a historic moment for ECSAas the very first ECSAAPP (2015/16) and theStrategic Plan (2015-2020)wasunveiled in Cape Town and the event was graced by the Honourable Minister of Public Works, Minister Thulas Nxesi.
On rigorous appraisal of the business in line with the 2015-2020 Strategic Plan, it became evident that the currentbusinessconfigurationpresentswithstructuralproblemsthatneedsremodelling.Centraltothechallenges is that ECSA carries out its mandate primarily through the 3 output arms being:
• Administration,ledbytheCEO;• Committeescomprisingofpeers;and• VoluntaryAssociationsrecognisedintermsofsection25oftheEPA. Accountability for performance is not equitably shared amongst the three arms of delivery of the ECSA mandate. Plans are underway to ensure that all the three arms of delivery will share responsibility and accountabilityequitablytowardsthedeliveryofthemandate.Theidentifiedkeystructuralproblemhasacausaleffectonthefollowing:
• blurredhierarchicalreportinglinesbetweenthethreearmsofdelivery;• unclearareasofresponsibilityandaccountability;• adversarialrelationships;• AnewdevelopingtrendofdeviatingfromthecultureofvolunteerisminperformingECSA’swork,
and that is replaced by expectation of monetary compensation”
Thefocusinthecomingfinancialyearwillbeonaddressingtheidentifiedproblematicareasinordertocreate a conducive business environment.
9.1.3 Key Policy Development and Legislative Changes
9.1.3.1 PublicationGuidelineofProfessionalFeesandIdentificationofEngineeringWork
In terms of Section 34 of the Engineering Profession Act 46 of 2000 (the Act), the Engineering Council of South Africa (ECSA), in consultation with the voluntary associations, representatives of service providers and clients in the public and private sector, is required to publish Guideline of Professional Fees.
Section 34(2) of the Act mandates ECSA to annually review the Guideline of Professional Fees and to publish them in the Government Gazette. The Guideline of Professional Fees (GPF) is applicable from thefirstofJanuarytothe31stDecemberperyear.
Section 26 of the Act mandates ECSA to make recommendations to the Council for the Built Environment (CBE), regarding the type of engineering work which may be performed by persons registered in any of the categories referred to in section 18, including work which may fall within the scope of any other professionregulatedbytheprofessions’ActsreferredtointheCouncilfortheBuiltEnvironmentAct43of 2000(CBE Act).
In terms of section 20 of the CBE Act, the CBE is required to consult with the Competition Commission (CC)beforefinalizationoftheidentificationofwork(IDOW).
In March 2014, the CBE applied to the CC, for exemption of the IDOW and GPF of all the 6 Built Environment Professional Councils (BEPCs); Architecture, Engineering, Landscape Architects, Project and Construction Management, Property Valuation, and Quantity Surveying.
On 20 January 2016, the Competition Commission (CC) rejected the exemption application in respect of the IDOW and subsequently rejected the exemption application in respect of the GPF of all the BEPCs on 20 February 2016.
At the firstCouncilmeetingof the year, 24March2016,Council resolved to followa two-prongedapproach by engaging the CC in order to discuss its reasons for declining the exemption application and simultaneously lodging an appeal through the CBE.
TheCBEhasbeenattemptingtoconfirmameetingwiththeCCsinceFebruary2016.Theintentionofthe CBE was to have a high level meeting between the Commissioner and Deputy Commissioner of the CC and the Minister of Public Works as well as CEOs and Registrars of the 6 BEPCs.
The CBE requested the CC for an extension to appeal till 30 April2016, which was granted. The CC and CBE then agreed to put the lodgment of the appeal in abeyance until the said high level meeting takes place with the intention to reach a settlement, failure which the CBE will apply for condonation then lodge the appeal.

24 25
The Engineering Council of South AfricaAnnual report for the year ended 31 March 2016
The Engineering Council of South AfricaAnnual report for the year ended 31 March 2016
Performance Information | ECSA Annual Report 2016ECSA Annual Report 2016 | Performance Information
9.2 Strategic Outcome Oriented Goals
Strategic Goal 1:
Professional Thrust - Engineering practitioners enjoy the benefit of world class education and registration
Strategic objective 1.1 Engineering practitioners are recognised through excellent, relevant and globally accepted education standards
Strategic objective 1.2 Engineering practitioners are registered through accessible, fair, transparent,efficientandcrediblesystem
Strategic objective 1.3 Growth and retention of registered engineering practitioners
Strategic objective 1.4 The Engineering profession is grown by increasing the number of engineering practitioners to meet existing and future demands
Strategic objective 1.5 Practitioners successfully renew their registration through fair, credible, transparent and accessible processes
Strategic Goal 2
Public awareness of the profession and its standards and regulation to ensure the implementation of those standards in the public interest
Strategic objective 2.1 Public awareness of the engineering profession and its standards through public education, information and awareness programmes
Strategicobjective2.2 Protectionofthehealth,safetyandinterestofthepublicthrougheffectiveregulation of the profession
Strategic objective 2.3 Regulate the profession in accordance with legislative requirements
Strategic Goal 3
Engineering practitioners proactively responsive to local and national socio-economic requirements
Strategic objective 3.1 Research undertaken into strategic contributions the profession could be making to support national programmes including but not limited to NDP, NIPandNationalBeneficiationStrategy
Strategic objective 3.2 ECSA is responsive to the decision makers through excellent stakeholder relationships. ECSA is represented in or structurally linked to key Government decision making bodies and SOEs such as PICC, NDP, ESKOM, Transnet, Sasol, etc
Strategicobjective3.3 Proposalsaredevelopedandimplementedforspecificprojectsandfunding sought from Government and other stakeholders
Strategic Goal 4
A sustainable, transformed and coherent organisation that is capable of delivering the impact desired by its stakeholders and society within the provisions of the EPA
Strategicobjective4.1 Arelevantorganisationthatsignificantlymeetstheneedsofbothinternaland external stakeholders within the ECSA mandate.

26 27
The Engineering Council of South AfricaAnnual report for the year ended 31 March 2016
The Engineering Council of South AfricaAnnual report for the year ended 31 March 2016
Performance Information | ECSA Annual Report 2016ECSA Annual Report 2016 | Performance Information
9.3 Performance Information by Programme
Programme 1
Education and Registration
StrategicGoal Engineeringpractitionersenjoythebenefitofworldclasseducationandregistration
StrategicObjectives Anefficient,inclusive,transparentregistrationandeducationpracticesthatpromote demand, employability, marketability, mobility and protection of work environment.
Table 1:
Strategic objective (S.O)
Actual achieve-ment 2014/15
Planned target 2015/2016
Actual achievement 2015/16
Deviation from the planned target to ac-tual achieve-ment for 2015/2016
Comment on deviation
S.O 1.1Engineering prac-titioners are rec-ognised though excellent, relevant and globally ac-cepted education-al standards
6 accreditation visits conducted
Accreditation of engi-neering programmes in 6 institutions of higher learning
Achieved 7 accreditation visits
N/A
100% compli-ance with the requirements for the interna-tional accords and standards
Submission of reports on ECSA activities in line with the educa-tional accords and competency agree-ments.
Achieved. N/A N/A
S.O 1.2 Engineering practitioners are registered through accessible, fair, transparent,effi-cient and credible system
N/A Launch New Regis-tration System (NRS) phase 1.
Not achieved There were technical problems with the developed online plat-form.
The target was dependant onfinalisationof the online platform.
N/A Train 170 volunteers on paper based assessment and 260 volunteers on the on-line system
Not achieved 81 volunteers were trained.
This is a demand driven target. Invi-tations were made to the engineering practition-ers but few came forth for training. ECSA managed to train only 81 volunteers
N/A Review 11(eleven) NRS policies
Achieved N/A N/A
Strategic objective (S.O)
Actual achieve-ment 2014/15
Planned target 2015/2016
Actual achievement 2015/16
Deviation from the planned target to ac-tual achieve-ment for 2015/2016
Comment on deviation
S.O 1.3 Growth and re-tention of regis-tered engineering practitioners
N/A Host Africa Engineer-ing Week according to plan and support the international Event
Achieved N/A N/A
N/A A revised Voluntary Association recogni-tion framework.
Achieved N/A NA
N/A A joint transformation plan for the industry
Not achieved No joint plans were entered into.
The Joint Transformation Strategy is de-pendent on the finalizationofthe Voluntary Association recognition Framework which is cur-rently under-way.
N/A A draft retention strategy.
Partially achieved
N/A A draft reten-tion strategy was developed but put on hold pending the review of the virtual shop concepts
N/A Launched virtual shopping mall on ECSA website
Not achieved N/A The virtual mall concept needs a review to in-clude a broad-er spectrum of partners
28 29
The Engineering Council of South AfricaAnnual report for the year ended 31 March 2016
The Engineering Council of South AfricaAnnual report for the year ended 31 March 2016
Performance Information | ECSA Annual Report 2016ECSA Annual Report 2016 | Performance Information
Strategic objective (S.O)
Actual achieve-ment 2014/15
Planned target 2015/2016
Actual achievement 2015/16
Deviation from the planned target to ac-tual achieve-ment for 2015/2016
Comment on deviation
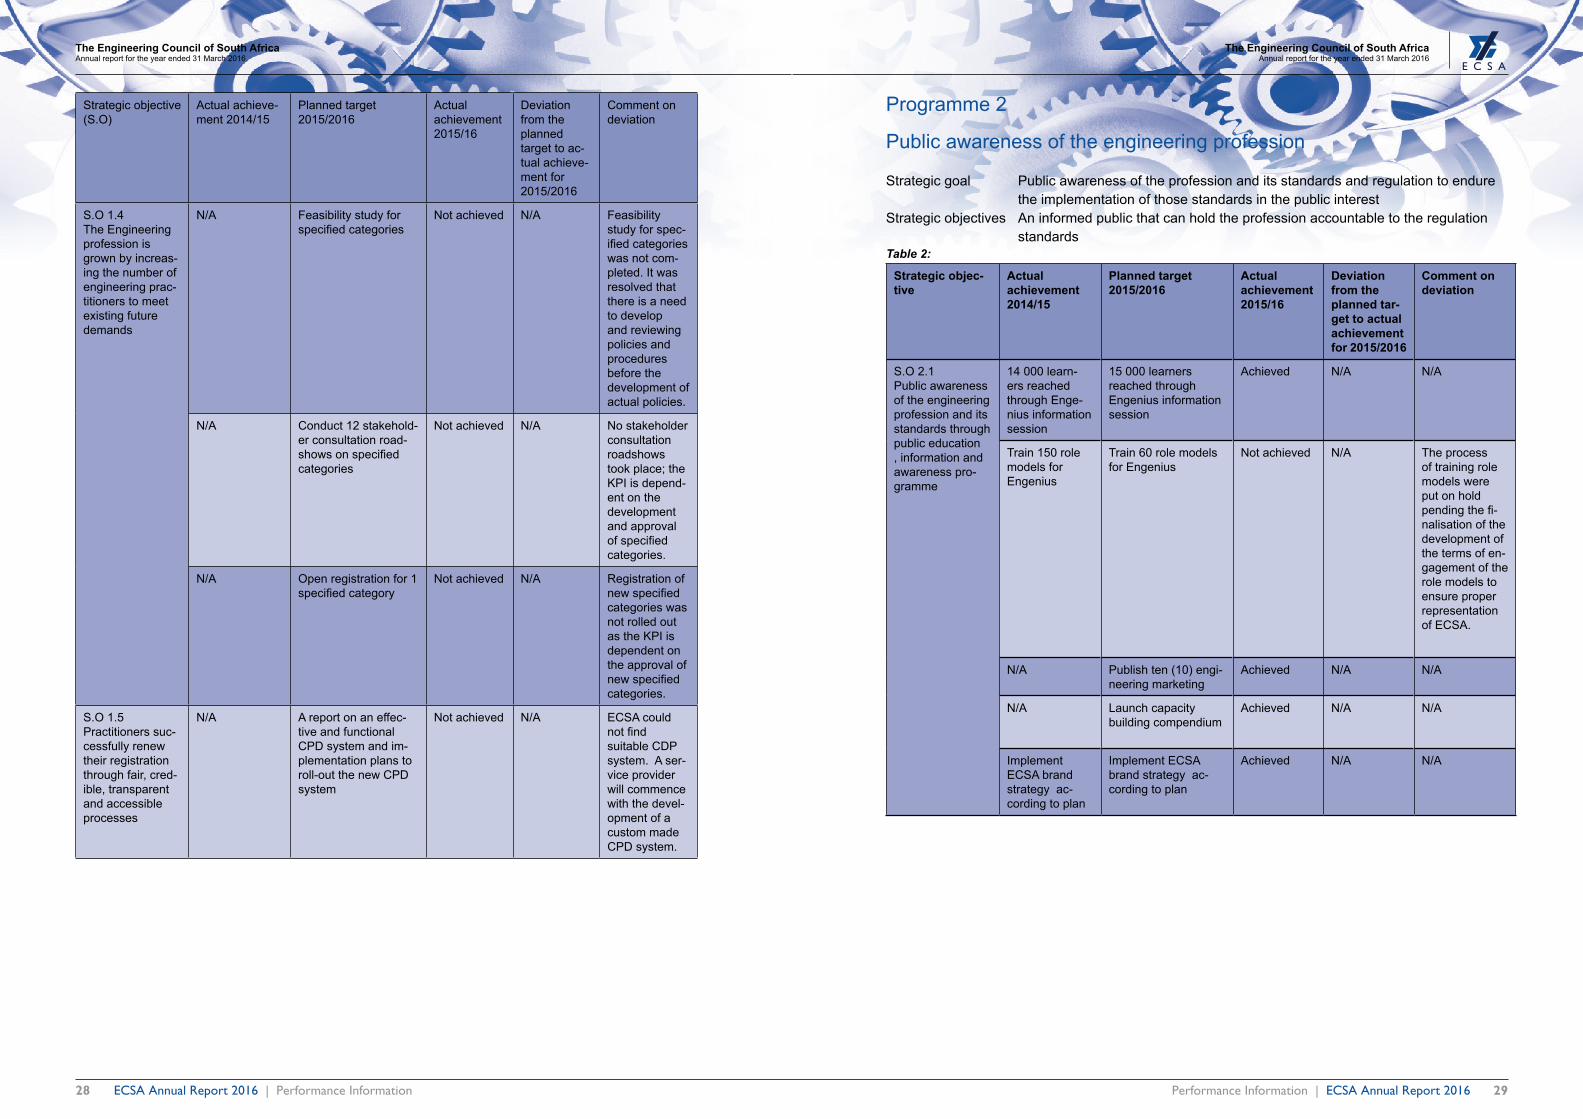
S.O 1.4 The Engineering profession is grown by increas-ing the number of engineering prac-titioners to meet existing future demands
N/A Feasibility study for specifiedcategories
Not achieved N/A Feasibility study for spec-ifiedcategorieswas not com-pleted. It was resolved that there is a need to develop and reviewing policies and procedures before the development of actual policies.
N/A Conduct 12 stakehold-er consultation road-showsonspecifiedcategories
Not achieved N/A No stakeholder consultation roadshows took place; the KPI is depend-ent on the development and approval ofspecifiedcategories.
N/A Open registration for 1 specifiedcategory
Not achieved N/A Registration of newspecifiedcategories was not rolled out as the KPI is dependent on the approval of newspecifiedcategories.
S.O 1.5Practitioners suc-cessfully renew their registration through fair, cred-ible, transparent and accessible processes
N/A Areportonaneffec-tive and functional CPD system and im-plementation plans to roll-out the new CPD system
Not achieved N/A ECSA could notfindsuitable CDP system. A ser-vice provider will commence with the devel-opment of a custom made CPD system.
Programme 2
Public awareness of the engineering profession
Strategic goal Public awareness of the profession and its standards and regulation to endure the implementation of those standards in the public interest
Strategic objectives An informed public that can hold the profession accountable to the regulation standards
Table 2:
Strategic objec-tive
Actual achievement 2014/15
Planned target 2015/2016
Actual achievement 2015/16
Deviation from the planned tar-get to actual achievement for 2015/2016
Comment on deviation
S.O 2.1Public awareness of the engineering profession and its standards through public education , information and awareness pro-gramme
14 000 learn-ers reached through Enge-nius information session
15 000 learners reached through Engenius information session
Achieved N/A N/A
Train 150 role models for Engenius
Train 60 role models for Engenius
Not achieved N/A The process of training role models were put on hold pendingthefi-nalisation of the development of the terms of en-gagement of the role models to ensure proper representation of ECSA.
N/A Publish ten (10) engi-neering marketing
Achieved N/A N/A
N/A Launch capacity building compendium
Achieved N/A N/A
Implement ECSA brand strategy ac-cording to plan
Implement ECSA brand strategy ac-cording to plan
Achieved N/A N/A

30 31
The Engineering Council of South AfricaAnnual report for the year ended 31 March 2016
The Engineering Council of South AfricaAnnual report for the year ended 31 March 2016
Performance Information | ECSA Annual Report 2016ECSA Annual Report 2016 | Performance Information
Strategic objec-tive
Actual achievement 2014/15
Planned target 2015/2016
Actual achievement 2015/16
Deviation from the planned tar-get to actual achievement for 2015/2016
Comment on deviation
S.O 2.2Protection of the health, safety and interest of public througheffectiveregulation of the profession
N/A Finalise 80% of disci-plinary cases backlog
Not achieved N/A Thefinalisationof discipli-nary cases is dependent on the participation of the respond-ent and the respondent’slegal represent-atives. Prompt response from the Respond-ent’sorRe-spondent’slegalrepresentatives determines the durationinfinal-ising a case.
N/A Finalise 90% of new disciplinary cases
Not achieved N/A Thefinalisationof disciplinary cases is de-pendent on the participation of the Respondent and the Re-spondent’slegalrepresentatives.
Prompt re-sponse from the Respondent’sor Respond-ent’slegalrepresentatives determines the duration it will taketofinaliseacase.
N/A Development of a case management system
Not achieved N/A On review of the process, it was resolved that case man-agement should form part of the ECSA com-prehensive IT infrastructure.
Strategic objec-tive
Actual achievement 2014/15
Planned target 2015/2016
Actual achievement 2015/16
Deviation from the planned tar-get to actual achievement for 2015/2016
Comment on deviation
S.O 2.3Regulate the profession in accordance with legislative require-ments
N/A Report on the need to review the Act and advise CBE
Not achieved N/A ECSA awaits theofficeoftheMinister of Pub-lic Works to trig-ger the process as communi-cated by him. This process will commence once the Minister has communicated the process to be followed
N/A An approved frame-work of collaboration to uphold the code of conduct
Not achieved N/A This target is dependant tothefinali-sation of the framework of collaboration with employer bodies which is under develop-ment.
N/A An approved frame-work of collaboration to investigate poor quality engineering work
Not achieved No MoU was signed during the period.
Framework of collaboration to investigate poor quality engineering work is in draft format and has not been ap-proved. There is currently a MoU between ECSA and Dept. of Labour (DoL) and National Home Builders Regulations (NHBRC).

32 33
The Engineering Council of South AfricaAnnual report for the year ended 31 March 2016
The Engineering Council of South AfricaAnnual report for the year ended 31 March 2016
Performance Information | ECSA Annual Report 2016ECSA Annual Report 2016 | Performance Information
Programme 3
Proactive response to socio-economic requirements
Strategic Goal Engineering practitioners are proactively responsive to local and national socio-economic requirements
Strategic objectives High impact socio-economic interventions in response to national and other priorities
Table 3:
Strategic objective Actual achieve-ment 2014/15
Planned target 2015/2016
Actual achievement 2015/16
Deviation from the planned target to actu-al achievement for 2015/2016
Comment on deviation
S.O 3.1Research under-taken into strategic contributions the profession could be making to support national pro-grammes including but not limited to NDP, NIP and Na-tional Beneficiation
To conduct Research on two topics
To conclude two research reports
Not achieved N/A The process was modelled around task teams repre-senting various recognised Voluntary As-sociations. The task teams that were constituted to support the process did not meet to take the process forward. Several workshops were convened but none material-ised.
S.O 3.2 ECSA is responsive to decision makers through excellent stakeholder rela-tionships. ECSA is represented in or structurally linked to key Government decision making bodies and SOE’s e.g. PICC, NDP, Eskom, Transnet, Sasol, etc
To build strategic relationships with Government and SOEs to enable ECSA to achieve its goals
Enter into 4 x MoUs with any Government Depart-ment or SOEs.
Not achieved N/A The Executive responsible for the portfolio fell sick, and on review, manage-ment decided to develop a framework of collaboration be-tween ECSA and employer bodies which is current-ly underway.
S.O 3.3Proposals are developed and implemented for specific projects and funding sought from Government and other stake-holders
To develop two funding propos-als and engage strategic partners
Raise R3m for strategic projects
Not achieved N/A The Researcher appointed at the time did not have the ability to manage the magnitude of the assignment. The officer has since left the employment. Previously she did receive counselling regarding her performance.
Programme 4
A sustainable, transformed and coherent organisation
Strategic Goal A sustainable, transformed and coherent organisation that is capable of delivering the impact desired by its stakeholders and society within the provisions of the EPA (Engineering Profession Act)
Strategic Objectives A coherent and well run organisation
Table 4:
Strategic objective Actual achieve-ment 2014/15
Planned target 2015/2016
Actual achievement 2015/16
Deviation from the planned target to actu-al achievement for 2015/2016
Comment on deviation
S.O 4.1A relevant organisa-tion that significant-ly meet the needs of both internal and external stakehold-ers within the ECSA mandate
N/A A quality management roll-out plan
Achieved N/A N/A
N/A Review organogram Achieved N/A N/A
N/A Review Governance policies
Not achieved N/A This target is depended on the finalisation of the review process of the Governance structures.
unqualified audit opinion
unqualified audit opinion
Achieved N/A N/A
N/A IT infrastructure plan in support of strategy
Not achieved N/A The IT plan was reconfigured to develop an inte-grated platform for the entire business
N/A Increased revenue col-lection by 8% from last financial year base
Achieved N/A N/A
The analyses of performance information
• Atotalof34performancetargetswerereviewed.
• Managementreported26targetsasachievedforyeartodate;howeverduetoinsufficientsupportingdocumentation,InternalAuditconfirmedonly13asachieved.
• Managementhadreported8targetsasnotachieved year to date; however Internal Audit confirmed21asnotachieved.
Thegraphtotherightreflectsacomparisonofthe Performance Information as reported by management vs. the Internal Audit assessments:
ENGINEERING COUNCIL OF SOUTH AFRICA AUDIT OF PERFORMANCE INFORMATION INTERNAL AUDIT REPORT JULY 2016
Page 7 of 19
6. SUMMARY OF FINDINGS AND OVERALL ASSESSMENT OF AUDITED ACTIVITIES Based on the portfolio of evidence provided by management in support of the information reported on the draft annual report for the 2015/2016 Financial Year; internal audit noted the following (Detailed observations and recommendations are detailed in the Appendix A):
A total of 34 performance targets were reviewed. Management reported 26 targets as achieved for year to date; however due to insufficient
supporting documentation, Internal Audit confirmed only 13 as achieved. Management had reported 8 targets as not achieved year to date; however Internal Audit
confirmed 21 as not achieved. The graph below reflects a comparison of the Performance Information as reported by management vs. the Internal Audit assessments:
26
8
13
21
0
5
10
15
20
25
30
Achieved Not Achieved
2015/2016 Year to date reported targets
ECSA Management Internal Audit

34 35
The Engineering Council of South AfricaAnnual report for the year ended 31 March 2016
The Engineering Council of South AfricaAnnual report for the year ended 31 March 2016
Performance Information | ECSA Annual Report 2016ECSA Annual Report 2016 | Performance Information
9.3.1 Registration Overview
9.3.1.1 Registration
The Engineering Profession Act (EPA), 46 of 2000, is ECSA’s current founding legislation whichempowers ECSA to register persons applying for registration as Professionals and persons applying forregistrationascandidatesorcandidates inspecifiedcategories. Inthecaseofpersonsapplyingfor registration as professionals, they must have demonstrated their competence as measured against standards determined by the Council for the relevant category of registration and have passed any additional examinations that may be determined by the Council.
Inthecaseofpersonsapplyingforregistrationascandidatesorcandidates inspecifiedcategories,they must have relevant educational outcomes determined by Council by having passed accredited or recognizedexaminationsatanyeducationalinstitutionofferingeducationalprogrammesinengineeringand should have passed any other examination that may be determined by council or present evidence of prior learning in engineering.
The above conditions and requirements are encapsulated in section 19 of the Engineering Professions Act (Act 46 of 2000). There are four categories of professional registrations namely: Professional Engineers, Professional Engineering Technologists, Professional Engineering Technicians and ProfessionalCertificatedEngineers.Furthermore,therearefourcategoriesofcandidacytoregistrationand these are Candidate Engineers, Candidate Engineering Technologists, Candidate Engineering TechniciansandCandidateCertificatedEngineers.Candidatesareregistered toprofessionalstatussubject to applicants meeting the prescribed competency and educational requirements under each category.
In1999,ECSAsoughtandobtainedinternationalrecognitionofitseducationalqualificationstandardsand registration processes with the International Standards and subsequently became a signatory to the International mutual professional agreements and competency standards such as the Washington, Dublin and Sydney Accords. Through these agreements and competency standards, professionals in theengineeringfieldwhocomefromcountries thataresignatories to theInternationalaccords,arerecognized and only subjected to minimum assessment when applying for registration with ECSA. ECSA participation in international accords also facilitates mobility of South African engineers across various international jurisdictions consistent with section 13 (e) of the Engineering Profession Act of 2000.
Registration with ECSA is a legislative mandate for Engineering professionals practicing under categories designated by ECSA in terms of section 18 (1) of the Engineering Professions Act. A person may not practice in any of the categories contemplated in section 18 (1), unless he or she is registered in that category.
9.3.1.2 New Outcome-based Registration and Online System
Theoutcomesbasedregistrationsystem isproving tobeaneffectiveand transparentsystem.Theoutcomes based registration system is to be supported by an integrated online platform which will improve accessibility, efficiency and transparency by providing an interactive platform, wherebyapplicants can track the progress of applications online, automatic reminders are sent to relevant partiesinvolvedintheprocesstoensuremaximumefficienciesareachieved.Theonlineplatformwillimprove turnaround times and increase accessibility for existing and future registered persons, the outcome based registration system is one of the major initiatives implemented by ECSA to improve registration outputs in conjunction with integrated online system that is currently being developed. Throughthisoutcomebasedsystem,ECSAwillprovideaprocesswhichistransparent,efficientandwith clear guidelines as well as supporting policies on how applicants are expected to complete their reports and how the assessment process will be conducted. The online system on the other hand will improveaccessibility,efficiencyandtransparencythroughitsinteractivenaturewhichwillconsistentlysend reminders and updates to all parties involved in the process. The process will yield shortened turnaround times and potentially increase registration numbers with a more user- friendly system to submit and processing of applications for registrations.
9.3.1.3 Registration Trends
Inthe2014/15financialyear,thenumberofregisteredpersonswasstandingat45806,whereasbytheendofthe2015/16financialyearthenumberofregisteredpersonswasat50009whichshowsanincremental trajectory of 9% in the database. This is an indication that more government and private entitiesareseekingqualityassuredprofessionalsinthefieldofengineeringwhich,toaconsiderableextent,areasaresultofECSA’sawarenesscampaigns,initiatives,presentationsregardingregistrationimperatives to the industry and career guidance initiatives at institutions of higher learning. Most of the cancellations of registrations experienced have been largely due to cases where a registered professional is deceased.
The purpose of this overview is to project the registration statistics per race and gender during the current reporting period and also show the existing trend of registration within a period of 5 years. These statistics are attached herewith as per the following tables.

36 37
The Engineering Council of South AfricaAnnual report for the year ended 31 March 2016
The Engineering Council of South AfricaAnnual report for the year ended 31 March 2016
Performance Information | ECSA Annual Report 2016ECSA Annual Report 2016 | Performance Information
Professional Engineer 16526
Professional Engineering Technologist 5491
Professional Certificated Engineer 1076
Professional Engineering Technician 5214
Figure 1
Male Female
16753 773
5145 346
1069 7
4509 705
Figure 2
Professional Registrations Statistics by Race & Category
Professional Registrations Statistics by Category
Professional Registrations Statistics by Gender & Category
Category
Professional Engineer
Professional Engineering Technologist
Professional Certificated Engineer
Professional Engineering Technician
Professional Engineer
Professional Engineering Technologist
Professional Certificated Engineer
Professional Engineering Technician
0
2000
4000
6000
8000
10000
12000
14000
16000
18000
20000
Professional Engineer Professional
Engineering
Technologist
Professional
Certificated Engineer
Professional
Engineering Technician
Female
Male
REGISTRATIONSTATISTICS
TABLE 5: PROfESSIONAlCATEGORyREGISTRATIONSTATISTICS
PROfESSIONAlENGINEER
TOTAlREGISTRA-TIONS
NEwREGISTRATIONS
TRANSfERSfROmCANdIdATES CANCEllATIONS dEREGISTRA-
TIONS
TOTAlREGISTEREd 16526 504 352 13 81
GENd
ER mAlE 16753 438 295 12 77
fEmAlE 773 66 57 1 4
RACE
AfRICAN 1671 158 121 0 0
whITE 13657 277 176 11 79
INdIAN 1023 60 48 2 2
COlOuREd 175 9 7 0 0
PROfESSIONAlENGINEERINGTEChNOlOGIST
TOTAlREGISTEREd 5491 354 192 5 29
GENdER mAlE 5145 307 161 4 29
fEmAlE 346 47 31 1 0
RACE
AfRICAN 1487 208 120 0 1
whITE 3311 101 62 5 28
INdIAN 474 28 19 0 0
COlOuREd 219 17 12 0 0
PROfESSIONAlCERTIfICATEdENGINEER
TOTAlREGISTEREd 1076 25 9 4 12
GENd
ER mAlE 1069 25 9 4 12
fEmAlE 7 0 0 0 0
RACE
AfRICAN 71 6 5 0 0
whITE 952 17 3 3 12
INdIAN 40 1 0 1 0
COlOuREd 13 1 1 0 0
PROfESSIONAlENGINEERINGTEChNICIAN
TOTAlREGISTEREd 5214 444 234 4 29
GENd
ER mAlE 4509 347 181 4 29
fEmAlE 705 97 53 0 0
RACE
AfRICAN 2434 361 213 1 4
whITE 2299 53 16 3 24
INdIAN 283 12 0 0 1
COlOuREd 198 18 5 0 0
NB:31REGISTEREdPERSONSONOuRECSAdATABASEAREREGISTEREdByECSAONSOuThAfRICANdATABASEOfThEENGINEERS.mOBIlITyfORumANdThEENGINEERINGTEChNOlOGISTfORumSINTERNATIONAlREGISTERS.
Table 6:
PROfESSIONAlREGISTRATIONSSTATISTICSByCATEGORy
PROfESSIONAlENGINEER 16526
PROfESSIONAlENGINEERINGTEChNOlOGIST 5491
PROfESSIONAlCERTIfICATEdENGINEER 1076
PROfESSIONAlENGINEERINGTEChNICIAN 5214
Figure 1
Table 7:
PROfESSIONAlREGISTRATIONSSTATISTICSByGENdER&CATEGORy
CATEGORy mAlE fEmAlE
PROfESSIONAlENGINEER 16526 773
PROfESSIONAlENGINEERINGTEChNOlOGIST 5491 346
PROfESSIONAlCERTIfICATEdENGINEER 1076 7
PROfESSIONAlENGINEERINGTEChNICIAN 5214 705
Figure 2
Professional Engineer 16526
Professional Engineering Technologist 5491
Professional Certificated Engineer 1076
Professional Engineering Technician 5214
Figure 1
Male Female
16753 773
5145 346
1069 7
4509 705
Figure 2
Professional Registrations Statistics by Race & Category
Professional Registrations Statistics by Category
Professional Registrations Statistics by Gender & Category
Category
Professional Engineer
Professional Engineering Technologist
Professional Certificated Engineer
Professional Engineering Technician
Professional Engineer
Professional Engineering Technologist
Professional Certificated Engineer
Professional Engineering Technician
0
2000
4000
6000
8000
10000
12000
14000
16000
18000
20000
Professional Engineer Professional
Engineering
Technologist
Professional
Certificated Engineer
Professional
Engineering Technician
Female
Male

38 39
The Engineering Council of South AfricaAnnual report for the year ended 31 March 2016
The Engineering Council of South AfricaAnnual report for the year ended 31 March 2016
Performance Information | ECSA Annual Report 2016ECSA Annual Report 2016 | Performance Information
Table 8:
PROfESSIONAlREGISTRATIONSSTATISTICSByRACE&CATEGORy
CATEGORy AfRICAN whITE INdIAN COlOuREd TOTAl
PROfESSIONAlENGINEER 1671 13657 1023 175 16526
PROfESSIONAlENGINEERINGTEChNOlO-GIST 1487 3311 474 219 5491
PROfESSIONAlCERTIfICATEdENGINEER 71 952 40 13 1076
PROfESSIONAlENGINEERINGTEChNICIAN 2434 2299 283 198 5214
Figure 3
African White Indian Coloured Total
1671 13657 1023 175 16526
1487 3311 474 219 5491
71 952 40 13 1076
2434 2299 283 198 5214
Figure 3
Category
Professional Engineer
Professional Engineering Technologist
Professional Certificated Engineer
Professional Engineering Technician
0
2000
4000
6000
8000
10000
12000
14000
Professional
Engineer
Professional
Engineering
Technologist
Professional
Certificated Engineer
Professional
Engineering
Technician
Black
White
Asian
Coloured
TABLE 9: CANdIdATECATEGORIES:REGISTRATIONSTATISTICS
CANdIdATEENGINEER
TOTAlREGISTRA-TIONS
NumBEROfCANdI-dATESREGISTEREd(3yEARSANdlESS)
NumBEROfCANdI-dATESREGISTEREd
(4-5yEARS)
NumBEROfCANdI-dATESREGISTEREd(OvER6yEARS)
TOTAlREGISTEREd 8975 4326 1911 2967
GEN-
dER mAlE 7326 3403 1502 2433
fEmAlE 1649 923 409 534
RACE
AfRICAN 2946 1757 635 776
whITE 4497 1877 906 1718
INdIAN 1315 588 303 427
COlOuREd 217 104 67 46
CANdIdATEENGINEERINGTEChNOlOGIST
TOTAlREGISTEREd 4252 2430 768 1150
GEN-
dER mAlE 3345 1907 600 934
fEmAlE 907 523 168 216
RACE
AfRICAN 3011 1807 543 662
whITE 721 345 132 244
INdIAN 366 185 61 120
COlOuREd 154 93 35 29
CANdIdATECERTIfICATEdENGINEER
TOTAlREGISTEREd 316 104 79 133
GEN-
dER mAlE 310 101 78 131
fEmAlE 6 3 1 2
RACE
AfRICAN 155 74 46 35
whITE 123 0 24 79
INdIAN 27 9 4 14
COlOuREd 11 20 5 5
CANdIdATEENGINEERINGTEChNICIAN
TOTAlREGISTEREd 6936 3653 1616 1658
GEN-
dER mAlE 5083 2690 1121 1263
fEmAlE 1853 963 495 395RACE
AfRICAN 5664 3141 1351 1166
whITE 717 262 117 323
INdIAN 368 142 84 142
COlOuREd 187 108 51 27

40 41
The Engineering Council of South AfricaAnnual report for the year ended 31 March 2016
The Engineering Council of South AfricaAnnual report for the year ended 31 March 2016
Performance Information | ECSA Annual Report 2016ECSA Annual Report 2016 | Performance Information
Figure 6
0
1000
2000
3000
4000
5000
6000
29463011
155
5664
4497
721
123
717
1315
366
27
368217
15411
187
African
White
Indian
Coloured
0
1000
2000
3000
4000
5000
6000
Candidate Engineer Candidate
Engineering
Technologist
Candidate
Certificated
Engineer
Candidate
Engineering
Technician
Black
White
Asian
Coloured
Table 10:
PROfESSIONAlREGISTRATIONSSTATISTICSByCATEGORy
CANdIdATEENGINEER 8975
CANdIdATEENGINEERINGTEChNOlOGIST 4252
CANdIdATECERTIfICATEdENGINEER 316
CANdIdATEENGINEERINGTEChNICIAN 6936
Figure 4
8975
4252
316
6936
Male Female
7326 1649
3345 907
310 6
5083 1853
African White Indian Coloured
2946 4497 1315 217
3011 721 366 154
155 123 27 11
5664 717 368 187
Candidate Engineer
Professional Registrations Statistics by Race & Category
Candidate Engineering Technologist
Candidate Certificated Engineer
Candidate Engineering Technician
Professional Registrations Statistics by Category
Candidate Certificated Engineer
Candidate Engineering Technician
Category
Category
Professional Registrations Statistics by Gender & Category
Figure 5
Canditate Engineer
Candidate Engineering Technologist
Candidate Certificated Engineer
Candidate Engineering Technician
Candidate Engineering Technologist
Candidate Engineer
Figure 4
7326
3345
310
5083
1649
907
6
1853
0
1000
2000
3000
4000
5000
6000
7000
8000
9000
10000
Female
Male
8975
4252 316
6936
0
1000
2000
3000
4000
5000
6000
7000
8000
9000
10000
Candidate Engineer Candidate
Engineering
Technologist
Candidate
Certificated
Engineer
Candidate
Engineering
Technician
Female
Male
Canditate Engineer
Candidate Engineering
Technologist
Candidate Certificated Engineer
Candidate Engineering
Technician
Table 11:
PROfESSIONAlREGISTRATIONSSTATISTICSByGENdER&CATEGORy
CATEGORy mAlE fEmAlE
CANdIdATEENGINEER 7326 1649
CANdIdATEENGINEERINGTEChNOlOGIST 3345 907
CANdIdATECERTIfICATEdENGINEER 310 6
CANdIdATEENGINEERINGTEChNICIAN 5083 1853
Figure 5
8975
4252
316
6936
Male Female
7326 1649
3345 907
310 6
5083 1853
African White Indian Coloured
2946 4497 1315 217
3011 721 366 154
155 123 27 11
5664 717 368 187
Candidate Engineer
Professional Registrations Statistics by Race & Category
Candidate Engineering Technologist
Candidate Certificated Engineer
Candidate Engineering Technician
Professional Registrations Statistics by Category
Candidate Certificated Engineer
Candidate Engineering Technician
Category
Category
Professional Registrations Statistics by Gender & Category
Figure 5
Canditate Engineer
Candidate Engineering Technologist
Candidate Certificated Engineer
Candidate Engineering Technician
Candidate Engineering Technologist
Candidate Engineer
Figure 4
7326
3345
310
5083
1649
907
6
1853
0
1000
2000
3000
4000
5000
6000
7000
8000
9000
10000
Female
Male
8975
4252 316
6936
0
1000
2000
3000
4000
5000
6000
7000
8000
9000
10000
Candidate Engineer Candidate
Engineering
Technologist
Candidate
Certificated
Engineer
Candidate
Engineering
Technician
Female
Male
Canditate Engineer
Candidate Engineering
Technologist
Candidate Certificated Engineer
Candidate Engineering
Technician
Table 12:
PROfESSIONAlREGISTRATIONSSTATISTICSByRACE&CATEGORy
CATEGORy AfRICAN whITE INdIAN COlOuREd TOTAl
CANdIdATEENGINEER 2946 4497 1315 217 8975
CANdIdATEENGINEERINGTEChNOlOGIST 3011 721 366 154 4252
CANdIdATECERTIfICATEdENGINEER 155 123 27 11 316
CANdIdATEENGINEERINGTEChNICIAN 5664 717 368 187 6936
Figure 6

42 43
The Engineering Council of South AfricaAnnual report for the year ended 31 March 2016
The Engineering Council of South AfricaAnnual report for the year ended 31 March 2016
Performance Information | ECSA Annual Report 2016ECSA Annual Report 2016 | Performance Information
TABLE 13: SPECIfIEdCATEGORIES:REGISTRATIONSTATISTICS
REGISTEREdlIfTING
mAChINERyINSPECTORS
REGISTEREdmEdICAlEquIPmENTmAIN-
TAINERS
REGISTEREdfIREPROTECTIONSySTEmS
INSPECTORS
REGISTEREdlIfTINSPECTORS
GEN-
dER mAlE 1021 5 4 155
fEmAlE 4 1 1 1
RACE
AfRICAN 98 1 1 8
whITE 836 5 4 121
INdIAN 62 0 0 19
COlOuREd 29 0 0 8
GRANdTOTAlREGISTEREd 1025 6 5 156
Table 14:
PROfESSIONAlREGISTRATIONSSTATISTICSByCATEGORy
REGISTEREdlIfTINGmAChINERyINSPECTORS 1025
REGISTEREdmEdICAlEquIPmENTmAINTAINERS 6
REGISTEREdfIREPROTECTIONSySTEmSINSPECTORS 5
REGISTEREdlIfTINSPECTORS 156
Figure 7
Table 3: Specified Categories Registration Statistics
Registered Lifting
Machinery
Inspectors
Registered
Medical
Equipment
Maintainers
Registered
Fire
Protection
Systems
Inspectors
Registered Lift
Inspectors
Male 1021 5 4 155
Female 4 1 1 1
African 98 1 1 8
White 836 5 4 121
Indian 62 0 0 19
Coloured 29 0 0 8
1025 6 5 156
1025
6
Registered Fire Protection Systems Inspectors 5
156
Professional Registrations Statistics by Gender & Category
Category Male Female
Registered Lifting Machinery Inspectors 1021 4
Registered Medical Equipment Maintainers 5 1
Registered Fire Protection Systems Inspectors4 1
Registered Lift Inspectors 155 1
Registration Statistics
GRAND TOTAL REGISTERED
Gender
Race
Figure 7
Figure 8
Professional Registrations Statistics by Category
Registered Lifting Machinery Inspectors
Registered Medical Equipment Maintainers
Registered Lift Inspectors
1025
6
5156
Registered Fire Protection
Systems Inspectors
Registered Lifting Machinery
Inspectors
Registered Medical
Equipment Maintainers
Registered Fire Protection
Systems Inspectors
Registered Lift Inspectors
African White Indian Coloured Total
98 836 62 29 1025
1 5 0 0 6
1 4 0 0 5
8 121 19 8 156
108 966 81 37 1192
Figure 9
Registered Lifting Machinery Inspectors
Registration Statistics by Race & Category
GRAND TOTAL
Registered Medical Equipment Maintainers
Registered Fire Protection Systems Inspectors
Registered Lift Inspectors
Category
0
200
400
600
800
1000
1200
Registered
Lifting
Machinery
Inspectors
Registered
Medical
Equipment
Maintainers
Registered
Fire
Protection
Systems
Inspectors
Registered
Lift
Inspectors
1021
5
4155
4 1
1
1
Male
Female
0
100
200
300
400
500
600
700
800
900
98
1 1 8
836
5 4
121
62
0 019
29
0 0 8
African
White
Indian
Coloured
0
200
400
600
800
1000
1200
Registered
Lifting
Machinery
Inspectors
Registered
Medical
Equipment
Maintainers
Registered
Fire
Protection
Systems
Inspectors
Registered
Lift
Inspectors
Male
Female
0
100
200
300
400
500
600
700
800
900
Registered
Lifting
Machinery
Inspectors
Registered
Medical
Equipment
Maintainers
Registered Fire
Protection
Systems
Inspectors
Registered Lift
Inspectors
Black
White
Asian
Coloured
Table 15:
PROfESSIONAlREGISTRATIONSSTATISTICSByGENdER&CATEGORy
CATEGORy mAlE fEmAlE
REGISTEREdlIfTINGmAChINERyINSPECTORS 1021 4
REGISTEREdmEdICAlEquIPmENTmAINTAINERS 5 1
REGISTEREdfIREPROTECTIONSySTEmSINSPECTORS 4 1
REGISTEREdlIfTINSPECTORS 155 1
Figure 8
Table 16:
REGISTRATIONSTATISTICSByRACE&CATEGORy
CATEGORy AfRICAN whITE INdIAN COlOuREd TOTAl
REGISTEREdlIfTINGmAChINERyINSPECTORS 98 836 62 29 1025
REGISTETEdmEdICAlEquIPmENTmAINTAIN-ERS 1 5 0 0 6
REGISTEREdfIREPROTECTIONSySTEmSINSPECTORS 1 4 0 0 5
REGISTEREdlIfTINSPECTORS 8 121 19 8 156
GRANdTOTAl 108 966 81 37 1192
Figure 9

44 45
The Engineering Council of South AfricaAnnual report for the year ended 31 March 2016
The Engineering Council of South AfricaAnnual report for the year ended 31 March 2016
Performance Information | ECSA Annual Report 2016ECSA Annual Report 2016 | Performance Information
Registration StatisticsNew Registration statistics from 2011 to 2015 (per calendar year)
Table 17
Professional Category 2011 2012 2013 2014 2015 Total
Professional Engineer 547 650 801 556 516 3070
Professional Engineering Technologist 372 435 412 400 398 2017
ProfessionalCertifiedEngineer 29 25 30 26 24 134
Professional Engineer Technician 340 353 392 315 432 1832
Candidate Category
Candidate Engineer 1261 1146 1178 1433 1522 6540
Candidate Engineering Technologist 645 520 690 804 904 3563
CandidateCertificatedEngineer 58 39 24 23 48 192
Candidate Engineering Technician 1216 1261 1178 1237 1459 6351
SpecifiedCategory
Registered Lifting Machinery Inspector 75 60 65 46 66 312
Registered Lift Inspector 0 5 9 2 1 17
Medical Equipment Maintainers 5 1 0 0 0 6
Fire Protection System Inspectors 0 4 0 0 1 5
Intenational Register
International Professional Engineers Agreement 0 1 1 2 2 6
International Engineering Technologist Agreement 0 1 0 2 1 4
Grand Total 4548 4501 4780 4846 5374 24049
Professional Categories
Figure 10
900
800
700
600
500
400
300
200
100
0 2011 2012 2013 2014 2015
ProfessionalEngineer
ProfessionalEngineeringTechnologist
ProfessionalCertifiedEngineer
ProfessionalEngineeringTechnician
Candidate Categories
Figure 11
1 600
1 400
1 200
1 000
800
600
400
200
0 2011 2012 2013 2014 2015
CandidateEngineer
CandidateEngineeringTechnologist
CandidateCertifiedEngineer
CandidateEngineeringTechnician

46 47
The Engineering Council of South AfricaAnnual report for the year ended 31 March 2016
The Engineering Council of South AfricaAnnual report for the year ended 31 March 2016
Performance Information | ECSA Annual Report 2016ECSA Annual Report 2016 | Performance Information
9.3.2 Education Overview
The Engineering Profession Act, Act No. 46 of 2000, empowers ECSA, in collaboration with the Council onHigherEducation (CHE)and theSouthAfricanQualificationsAuthority (SAQA), toevaluateandmaintain standards in the provisioning of engineering programmes by institutions of higher learning in the country. The highest standard of quality in engineering education is maintained through the following key functions:
Education: Visit education providers to evaluate programmes and accredit educational programmes that meet the educational requirements toward registration in each of the categories. Accreditation of aprogrammeisapublicacknowledgementthattheprogrammemeetsdefinedcriteriaasaresultofanevaluation
Evaluationofeducationalqualifications:Qualificationsthatarenotalreadyaccreditedorrecognisedare subjected to an evaluation to determine their substantial equivalence to a South African accredited qualification.
Continuing Professional Development (CPD): In terms of section 13(k) of the Engineering Professions Act, Act 46 of 2000 ECSA may determine, after consultation with the voluntary associations and registered persons, conditions relating to and the nature and extent of continuing education and training.
The discretion provided for in the Act to make use of Continuing Professional Development (CPD), gives Council the opportunity to comply with the CPD legislative requirements and to use CPD as part of the ECSA policy requirement for both the renewal of registration and the maintenance of registration status for the ECSA registered practitioners.
ECSA received good co-operation from registered persons whose registration became due for renewal during 2015/16. Of the 5004 registered persons due for renewal, 1716 are marked Retired/Exempted on the ECSA database. Of the 1716 retired registered persons 405 renewed their registration with the Councilwhichcontributedtotheconsiderabledeclineintherenewalrateforthefinancialyearunderreview. An additional 4.1% could not be renewed for reasons such as cancellations, death, etc. The renewal rate received per month for the 2015/16 Calendar year is as per table attached as Table 9.3.2.3
ItshouldbenotedthatintheabsenceofIdentificationofEngineeringWork(IDoEW)andthefactthatCPD has never been used as a compulsory precondition for renewal at ECSA, it remains a challenge to achieve higher levels of renewal.
It is envisaged that the development on the new CPD Online Management system will commence inAugust 2016.Additional fact-finding and information-gathering visits to two professional bodies,Health Professions Council of South Africa (HPCSA) and South African Pharmacy Council (SAPC) were conducted during the month of February 2016. The main focus of these visits was to gather more information on their CPD policies and procedures, CPD Administration IT platform and the relationship between CPD and renewal of registration.
During these visits, it was established that the Healthcare Professionals are required to complete a series of accredited continuing education activities each year and that these activities are recorded manually byway of completing record forms and submitting these to theCouncil for uploading/confirmationwhereas, the Pharmacy Act does not regulate CPD and therefore, their professionals do not need to comply. A set of regulations relating to Continuing Professional Development for persons registered in terms of the Pharmacy Act is currently being developed and will be implemented in the near future.
SpecifiedCategories
Figure 12
80
70
60
50
40
30
20
10
0 2011 2012 2013 2014 2015
Registered Lifting MachineryInspector
Registered LiftInspector
Medical Equipment Maintainers
Fire Protection System Inspectors
International Registration
Figure 13
2
1.5
1
0.5
0 2011 2012 2013 2014 2015
International Professional Engineers Agreement
International Engineering Technologist Agreement
0

48 49
The Engineering Council of South AfricaAnnual report for the year ended 31 March 2016
The Engineering Council of South AfricaAnnual report for the year ended 31 March 2016
Performance Information | ECSA Annual Report 2016ECSA Annual Report 2016 | Performance Information
All lessons learnt from the above visits will invariably lead to the successful development and implementation of the new CPD Online Management system which will provide permanent solutions to problems currently grappled by ECSA in the monitoring and implementing the CPD policy and processes.
TheautomatedemailnotificationsystemiscurrentlyunderdevelopmentbyECSA’scurrentCPDserviceprovider.Thisimprovedsystemwillbeusedtosendoutnotificationstoallregisteredpersonsdueforrenewalduringaspecificperiodinelectronicformat.ThisinterventionispartofabroaderendeavortomakeCPDefficient,effectiveanduser-friendlyfortheexpeditionofCPDrenewals.
Herewith,findapictureoftheactivitiesrelatedtothekeyfunctionsintheEducationDepartment:
9.3.2.1 Accreditation
9.3.2.1.1 TECSA Accredited Programmes
Table 18:
QualificationTitle Number of Programmes Number of Institution
BEng/Bsc (Eng) 50 8
BTECH 89 10
National Diploma 77 10
9.3.2.1.2 Accreditation activities during the reporting period
Table 19:
Name of Institution Type of Visit Number of Programmes Date of Visit
Cape Peninsula University of Technology Provisional visit 1 24 & 25 February 2015
UNISA Regular visit 28 17 & 18 March 2015
Tshwane University of Technology Final visit 1 21 May 2015
Nelson Mandela University of Technology Regular visit 9 20 & 21 August 2015
Durban University of Technology Interim visit 2 10 September 2015
Walter Sisulu University of Technology Regular visit 9 10 & 13 November 2015
Vaal University of Technology Regular visit 19 14 17 March 2016
9.3.2.2EvaluationofEducationalQualifications
Table 20:
Application status/decision Considered by TPQEC Forwarded to EPQEC Total
New applications allocated to each QEC 279 229 508
Washington Accord recognition 2 109 (BTECH)
Substantially equivalent tothetypeofqualificationshown
104 59 (ND)
ECSA recognised 11 47 (ALT)
Interview 104
Not recognised/File closed (no response) 1
Refused Candidate Engineer 0
Information outstanding/Awaiting Interview 55 14
Applications in process: Next EPQEC/TPQEC 2
9.3.2.3 CPD Renewal Statistics
Table 21:
Month Renewals Due Renewals Received Renewals Date
April 398 173 43.40%
May 595 318 53.40%
June 357 160 44.80%
July 448 227 50.60%
August 312 144 46.20%
September 358 258 47.90%
October 312 135 43.20%
November 566 280 49.40%
December 187 84 44.90%
January 284 123 43.30%
February 404 160 39.60%
March 603 131 22.00%
Totals 4824 2193 44.10%

50 51
The Engineering Council of South AfricaAnnual report for the year ended 31 March 2016
The Engineering Council of South AfricaAnnual report for the year ended 31 March 2016
Performance Information | ECSA Annual Report 2016ECSA Annual Report 2016 | Performance Information
9.4 Cross Border Assistance
ECSA, in compliance with its international obligations, continuously avails its members to, inter alia, attend meetings of international bodies and conduct reviews of international countries that are signatories to international accords.
The following are international activities which have been undertaken as part of ECSA cross-border assistance.
Table 22:
Member Activity Counttry
Prof Herman Vermaak ICACIT Review for Sydney nomi-nation Peru
Dr. Keith Jacobs Accreditation Ireland
Mr Chris Stuurman Accreditation Canada
Ms Sy Gourrah Accreditation Malaysia
Prof. Brandon Collier-Reed Accreditation Australia
ECSA has been instrumental in providing assistance to countries in the South African Development Community (SADC) and Africa as part of the South African Federation of Engineering Organisation (SAFEO) and has further participated in the global space as part of the World Federation of Engineering Organisation.
9.5 Relationship with Key Education Stakeholders
The Engineering Council of South Africa (ECSA) is in collaboration with the Council on Higher Education (CHE) and other Professional Councils (PCs) to contribute towards the development of a framework for theaccreditationofprofessionally–orientedprogrammes.TheCouncilonHigherEducationpublisheda document “Towards a national framework: The roles and responsibilities of the CHE and professional councils regarding the accreditation of professional programmes and related quality assurance functions” and invited professional councils to submit comments. The Engineering Council of South Africa has established a task team to look into contributing toward the development of the framework.
The Engineering Council of South Africa is again in close consultation with CHE regarding the revised Higher Education Sub-Framework (HEQSF), which would see the phasing out of non-aligned programmes which would have an impact on our accredited Universities of Technology.
9.6 CHE Standards Development Process
According to the NQF Act the CHE is the sole Quality Council for Higher Education (CHE) and in terms oftheHEQSF,oneofthemandatesoftheCHEistodevelopqualificationstandards.Thepurposeofthe Standards is to provide benchmarks (both internally and externally, of the programmes that lead to qualifications)i.e.accreditation,implementation,developmentandqualityassurance.Theframeworkfor Standards Development can be found on the CHE website.
ECSA continues with the process established at a previous Deans meeting, whereby CHE contract individuals to draft new standards which follow the fundamental principles of the standards completed by ECSA. CHE have since completed and published two standards (Bachelor of Engineering & Diploma
in Engineering), with two other new standards currently in the process of being developed (Bachelor of EngineeringTechnology&AdvancedDiplomainEngineering),whereafteranotherfive(5)standardsare due to be developed.
CHE and ECSA have worked well together and have a mutual understanding of their responsibilities, whichareclearlydefinedintheMemorandumofUnderstanding(MoU),whichhighlightsthesymbioticrelationship.
9.7 International Accord Matters
South Africa, through the Engineering Council of South Africa is a signatory to the following international agreements:
• Washington Accord: A mutual recognition of educational qualifications for the Education ofEngineers
• Sydney Accord: The mutual recognition of educational qualifications for the Education ofEngineering Technologists.
• DublinAccord:ThemutualrecognitionofeducationalqualificationsforeducationofEngineeringTechnicians.
The Washington Accord (WA) review of South Africa is in the cards. This will be taking place in the comingfinancialyear(2016/2017),withtheUniversitiesofJohannesburgandNorthWestbeingtheinstitutionsidentifiedandchosenbyECSAfortheWashingtonAccord(WA)accreditationandmonitoringvisits. The three WA Reviewers from abroad will be coming over to observe how ECSA conducts accreditation visits and to monitor if ECSA systems and processes are in line with the Washington Accord standards. The ECSA Education Team, in collaboration with the ECSA Education Programmes Accreditation Committee (EPAC) have already commenced with the preparations wherein the following has already happened:
• Visitleaders,teamleadersandteammembershavealreadybeenconstituted.• TheUniversitieshavealreadybeentrainedonthelatestrequirementsthattheywouldneedto
produce for the accreditation visits.• Draft itinerary and programmes for the International EngineeringAlliance (IEA) Washington
Accord review have already been prepared.

52 53
The Engineering Council of South AfricaAnnual report for the year ended 31 March 2016
The Engineering Council of South AfricaAnnual report for the year ended 31 March 2016
Performance Information | ECSA Annual Report 2016ECSA Annual Report 2016 | Performance Information
10. Strategic Services Functions10.1 Marketing and Communications
The2015/16financialyearhasbeenfullofsignificanteventsinpromotingECSAasapreferredadvisorofchoiceintheengineeringfield,anengineeringregulatorybodyresponsibleforgeneratingregistrationstandards and policies. ECSA paced up as a representative and ambassador of the engineering profession in the country and displayed commitment towards stakeholder relations.
ECSA continued to engage in corporate communications activities as a reliable voice on matters pertaining to the engineering profession.
10.2 Stakeholder Relations
ECSAhastoengagewithdifferentstakeholdersatdifferentlevels,thisincludes:InternationalvisitsasECSA is a signatory to the international Professional Engineers Agreement (IEPA) and the International Engineering Technologists Agreement (IETA); strengthening of stakeholder relations with all institutions that work closely with ECSA; engaging with government departments; hosting other engineering institutes from across Africa and supporting ECSA recognised voluntary associations. ECSA continued to engage with their stakeholders, in order to strengthen the relationship in the best interest of the engineering profession.
Belowarethestrategicstakeholderengagementactivitiesthattookplaceinthe2015/16financialyear:
Table 23:
Event Date Venue
Gauteng Department of Infrastruc-ture Development pre-budget vote 17 June 2015 Gallagher, Midrand
Visit to Istanbul 22 and 26 June 2015 Istanbul, Turkey
Tanzanian delegation visit to ECSA 10 July 2015 ECSA
Consulting Engineers SA Young Professionals Imbizo 11–12August2015 Premier Hotel, Kempton Park
ECSA support to the National Development plan (Leaderex) 17 September 2015 Sandton Convention Centre
University of KwaZulu -Natal Engineering post graduate day 22 September 2015 UKZN campus, Pietermaritzburg
Africa Engineering Week 2015 28–30September2015 MUT, Umlazi, Durban
Public Works Minister Nxesi addresses ECSA 22 October 2015 Stellenbosch, Cape Town

54 55
The Engineering Council of South AfricaAnnual report for the year ended 31 March 2016
The Engineering Council of South AfricaAnnual report for the year ended 31 March 2016
Performance Information | ECSA Annual Report 2016ECSA Annual Report 2016 | Performance Information
10.4 Promoting and profiling the ECSA brand through advertising:
ThisisaimedatpublicisingECSAandthebenefitsofregistrationthroughadvertisingonprint–trademedia, online and digital platforms. ECSA has continued to retain its corporate visibility and brand positioning through advertising on a range of media platforms such as:
Table 25:
Graduate 2015 Edition
Engineering News - Eskom
Government Digest
Engineering News - Africa Utility Week
SAICE
NDP 20130
IMIESA magazine (Conference)
South African Business Integrator
Municipal Focus
10.5 External Communication – Newsletter (E-bulletin)
This is a communication platform used to disseminate information to ECSA registered persons, updating them on all ECSA activities, regulatory and policy content. ECSA has shared information quarterly with their stakeholders through the E-Bulletin, which has now been made modern and user-friendly on a digital copy. The E-Bulletin is disseminated every 3 months.
For copies of the E-Bulletin, please follow this link: https://www.ecsa.co.za/news/SitePages/Bulletins.aspx
10.3 Promotion of the ECSA Brand
ECSAcontinuedtopromotetheirbrand,highlightingthebenefitsofregistrationaswellastheprocessofbeing registered. These are initiatives aimed at promoting the ECSA brand, educating the public about ECSA and promoting the engineering profession, it also extends to brand positioning, increasing ECSA visibility, as well as building and maintaining a reputation for ECSA. This was done through participation in exhibitions, conducting Engenius workshops to learners as well as making registration presentations atdifferentconferences.
Allcorporatecommunicationeventsforthe2015/16financialyeararelistedbelow:
Table 24:
Event Date Venue
Department of Public Works Career initiative 22, 24 and 29 April 2015
Rakgotso High School, Soshanguve South High School and WF Nkomo High School
Engineering Week 04–08May2015 Sci-Bono, Science Centre, Johan-nesburg
Africa Utility Week 12–14May2015 Cape Town International Convention Centre
Limpopo Rural Education Festival (RED Fest) 11–15May2015 Mopani District Limpopo
SABC Education Career Indaba 18–19May2015 Sandton Convention Centre
South African Industry and Technolo-gy Fair (INDUTEC) 20–22May2015 GallagherConventionCentre–
MidrandKwaZulu-Natal Industrial Technology Fair 09–12June2015 Durban Exhibition Centre
Sustainability Week 23–25June2015 CSIR Convention Centre, Pretoria
Southern African Transport Confer-ence (SATC) 06–09July2015 CSIR convention Centre, Pretoria
National Minquiz Science competi-tion 14 July 2015 Mintek, Randburg
Department of Basic Education Careers Jamboree 20–24July2015
Bohlabela District, Bushbuckridge, Accornhoek, Tulamahashe, and Hazy-view villages (Mpumalanga)
Northern Cape Department of Edu-cation Career Expo 23 July 2015 SANDF 3 SAI Battalion Military
Base, KimberleyYou Only Matriculate Once (YOMO) Career Expo 7 August 2015 Middleburg, Mpumalanga
Leaders of Tomorrow Career fair 24 July 2015 Mount Frere, Eastern Cape
Bauma Connexpo Africa 15–18September2015 Johannesburg Expo Centre, Nasrec
Infrastructure Africa Conference 01–02September2015 Sandton Convention Centre
IMESA Conference 27–30October2015 Grandwest Hotel & Casino, Cape Town from
CESA conference 09–10November2015 Emperors Palace, Kempton Park
Africa Energy indaba 16 - 17 February 2016 Sandton Convention Centre
Working World Exhibition (WWE) 16–18February2016 Nelson Mandela Bay Stadium
My Future Career Exhibition 18 February 2016 False Bay College, Khayelitsha, Cape Town

56 57
The Engineering Council of South AfricaAnnual report for the year ended 31 March 2016
The Engineering Council of South AfricaAnnual report for the year ended 31 March 2016
Performance Information | ECSA Annual Report 2016ECSA Annual Report 2016 | Performance Information
11.2 Schools reached per province
Table 26:Province Name of School
1. Mpumalanga- Middleburg (07 August 2015)- Bohlabela District Municipality (20-24 July 2015)
Ekwazini Secondary School; Phumelela Secondary School; Middleburg Combined; Middleburg Institute of Learning; Phendulani; Sehlakabje; Hoedspruit Independent College; Maphuthaditshaba and Hoyohoyo High Schools.
2. Eastern Cape- Mount Frere (24 July 2015)- Lady Frere (6-7 August 2015)- Grahamstown (2-8 March 2016)- Port Elizabeth (16-18 February 2016)
Colana, Lutateni and Mvenyane Senior Secondary Schools; Nonkqubela,Machibini,STCyprians,Joho’sGlenandLamplovigh Secondary Schools and many learners who came from the Nelson Mandela and Makana Municipality districts.
3. Kwa Zulu Natal- Umlazi and Pinetown Districts (28-30 September
2015)
Vukuzakhe, Open Air, Dabeka, St. Julius, Brettonwood, Dassenhoek, Ndengetho, Esizibeni and Ilanga high schools.
4. Northern Cape- Kimberley ( 23 July 2015)
Dr Lekhela High, Vuyolwethu High; Tetlanyo High, Tlwa-halang High, Elizabeth Conradie, Boresetse, Thabane High, Pampierstad and Homevale.
5. Gauteng- DPW Tshwane programme (24-29 April 2015)- DBE Jamboree School Holiday programme (8
July 2015)-Minquizfinals(14July2015)- Scibono National Engineering Week (4-8 May
2015)
Dr Nkomo H.S Atteridgeville; Soshanguve S.S; THS Lan-glaagte & Aurora Girls High School Thuthukani; Finetown; Mid-Ennerdale; Motheo; Ithubalethu; Jiswa and Regutlile. VariouslearnerswerereachedfromMinquizfinalsaswell.
6. Limpopo- Mopani District Municipality Rural Education
Festival (11-15 May 2015) - Greater Tzaneen and Malamulele Central
Municipalities National Science Week programme (1-7 August 2015)
Mopani District Municipality: Mathibadifate; Masehlone; Thabanatshwana; Motsheudi; Sekgosese; Sebelaolo; Mokope; Molai Jubilee; Tshweni HS; Kgola-ka-leleme; Kgapane; Mapatla; Khesethwane; Kolobetona and Abel Secondary.
7. Western Cape- My Future Expo (18 February 2016)
There were several students from Mitchells Plain and Khayelitsha high schools and FET colleges.
ECSA remarks:We thank our stakeholders for their support in making sure that learners are fully equipped with knowledge. In particular, we thank the Chemical Industries Education and Training SETA for their support towards the promotion of the chemicals industry. The MoU that was co-signed is reaping good rewards for the development of learners. The Department of Public Works is doing commendable work in integrating the Engenius programme into their career awareness campaigns as well.
We request for the support of young engineering practitioners who can assist as role models in reaching out to more learners and adopt them for mentorship and career guidance. It remains evident that there is more work still to be done to grow and nurture the scarce engineering skills in South Africa.
11. Engenius Report This programme seeks to address three strategic objectives:
• To promote national collaboration, coordination and support amongst partner organisations(includingtheengineeringdepartment&VA’s)
• Topromotetheengineeringprofessiontoprimaryandhighschoollearnersnationally• Empowerpartnerstospreadthedrivingmessage.Thisspeakstothetrainingofyoungengineers.
Inthefinancialyearunderreview,Engeniushascontinuedtodeliveronitsmandate:thepromotionofengineering to primary and high school learners across the country to ensure a growth in the profession. The focus is broadly around the peripheral areas of the country as most of the learners in these areas havebeenidentifiedtolackinformationforinformedcareerdecisionmaking.
11.1 Engenius Exhibitions and Workshops
Within the year 2015/16 year the following outreaches were concluded:
Figure 14:
In total, 16 329 learners were reached through exhibitions and 924 were reached through interactive engineering workshops across all aforementioned provinces.

58 59
The Engineering Council of South AfricaAnnual report for the year ended 31 March 2016
The Engineering Council of South AfricaAnnual report for the year ended 31 March 2016
Performance Information | ECSA Annual Report 2016ECSA Annual Report 2016 | Performance Information
12. UNESCO Africa Engineering Week (AEW)
ThemainobjectiveoftheAEWisthecontinuationofyouthandthegeneralpublicaboutthesignificanceof engineering as the profession.
ECSA CEO at the UNESCO Africa Engineering Week held at Mangosuthu University Technology, Durban(UmlaziTownship)–SouthAfrica
ECSA Counsil Member (middle - Mr Yashin Brijmohan) and other dignitaries at the Africa Engineering WeekheldatMangosuthuUniversityTechnology,Durban(UmlaziTownship)–SouthAfrica
Message from UNESCO
The second Africa Engineering Week, held in Victoria Falls, Zimbabwe from 15 to 19 September, comes at a critical juncture, as we advance towards the target date for the Millennium Development Goals, as we shape a new global development agenda to follow 2015. Later this Month, the UN General Assembly in New York, will adopt the draft outcome document on the post-2015 development agenda entitled: “Transforming Our World: The 2030 Agenda for Global Action”. Agenda 2030 presents a universal agenda, for all countries, which emphasizes the need for transformational shifts to achieve the dual objective of poverty eradication and sustainable development. Such transformational shifts will be needed in a number of sectors, such as energy, food production, water management, sustainable cities, and others. These transformational shifts, however, will not happenbythemselves–weneedto‘engineer’theroadtowardsasustainable future.
In doing so, we need more engineering, and we need more engineers. The shortage of engineers is a major concern in Africa and across the world where there has been declining interest and enrolment of young people, especially women. Engineering is vital in addressing basic human needs, improving the quality of life and creating opportunities for sustainable prosperity on a local, regional, national and global level. More young people need to take up engineering careers and making that choice depends on access to the necessary science, technology, engineering and mathematics (STEM) curriculum as wellashavingaccesstoeffectiveguidance,communicationsandrolemodels.
Addressing sustainable development within current climate change challenges will require innovative engineering and technology-based solutions. Engineering capacity and competence building activities are critical to ensure an adequate supply of engineers to work on these global challenges. Such activities are particularly important in Africa, where the per capita number of engineering professionals is lower thaninotherregions.Giventhisengineeringdeficit,activitiesthatpromoteawarenessofengineeringas a career as well as show how youth studying science, technology, engineering and mathematics STEM can become part of the solution have high priority. To increase engineering capacity in Africa, UNESCO, in cooperation with our partners, established the Africa Engineering Week.
Almost all of the 17 proposed Sustainable Development Goals under Agenda 2030 (SDGs) relate to engineering. With the creation of the SDGs, engineers will need to play a decisive role in their success. The activities during Africa Engineering Week will increase the visibility of engineering as a discipline; it will strengthen the position of engineering in Africa; it will raise awareness on the importance of engineering, science and technology for the successful implementation of the Agenda 2030. As such theAfricaEngineeringWeekfulfillsanimportantadvocacyroletowardsattractingyoungergenerationsto engineering to achieve a much higher goal, which is to ensure that transformational change, inclusive economic empowerment, peace and sustainable development, will characterise Africa’s furtherdevelopment towards the future we want for all people in Africa.
Prof. Hubert GijzenUNESCO Regional Director

60 61
The Engineering Council of South AfricaAnnual report for the year ended 31 March 2016
The Engineering Council of South AfricaAnnual report for the year ended 31 March 2016
Performance Information | ECSA Annual Report 2016ECSA Annual Report 2016 | Performance Information
ECSACouncilMembers,staffandotherdignatoriesatAfricaEngineeringWeek
13. International Engagements13. 1 Needs and Numbers Study
The overall objective of the study is to get a better understanding of the actual numbers of engineers, Technology and Technicians in the SADC countries and the needs of SADC Member States to allow for better planning for the attainmentof sustainable development in the region. The SADC Needs and Numbers Technical Working Group meeting was held on 2 September 2015 in Pretoria, South Africa.
13.2 South African Women Engineers Award
ECSA Council Member (left - Mr Yashin Brijmohan) and Ms Mmampei Chaba - DST (3rd from left) with SA Women Engineers who received the Recognition Awards at the African Union Meeting held in Addis Ababa 2015.
ECSA President and ECSA CEO with other dignitaries at the World Federation of Engineering Organisations meeting held in Japan 2015.
Standing from left:Prof. Thomas Jo Afullo (UKZN), Mr Cecil Masoka (DST), Dr Innocent Davidson (DUT), Prof. Senzo Malinga (MUT),Mr. Dave Renwick (eThekwini Municipality), Mr Yashin Brijmohan (ECSA Council Member).
Sitting from the left:Mr Martin Manuhwa (WFEO), Ms Benitta Senyatsi (Nissan SA), Ms Julia Baah (NUT), Ms. Hema Vollabh (SA-Women-Eng.),Mr Greg Evans (eThekwini Municipality), Mr Thembinkosi Madikane (ECSA), Ms Thoko Machimane (ECSA).

62 63
The Engineering Council of South AfricaAnnual report for the year ended 31 March 2016
The Engineering Council of South AfricaAnnual report for the year ended 31 March 2016
Performance Information | ECSA Annual Report 2016ECSA Annual Report 2016 | Performance Information
14. Revenue CollectionThe invoicing of revenue items exceeded the budget by 7.2%. As the budget assumptions include a provision for bad debt of 5%, the invoiced revenue exceeded an unadjusted budget by roughly 2%. The actual collection of the invoiced revenue was not satisfactory, as portrayed in the Provision for Impairment (refer to note 8 of the Annual Financial Statements).
The reason for the poor revenue collection is partly due to economic factors impacting in the registered persons’ ability tomakepayment andadebtors’ databasenotmeeting standards. It is crucial thatECSA’sITsystemunderdevelopmentiscompletedinorderfortheregisteredpersontoaccessandupdatehisprofileonhisownaccord.
15. Capital InvestmentECSA’scapitalinvestmentsarefairlylimited,thebulkofinvestmentbeingpooledintothereplacementof IT Equipment and Furniture and Fixtures (see note 4 and 5 of the Annual Financial Statements). It is envisagedtoourcurrentofficespacecouldstillmeetECSA’sdemandsforroughlyfiveyears,where-after itwouldbenecessary toobtainadditionalofficespace.Thematterwillbe investigatedduring2016/17 to determine the way forward.
Key Strategic Partnerships
Recognised Voluntary AssociationsCurently ECSA has 48 Recognised Voluntary Associations:
Table 27: ANNEXURE 1
Category A
No Acronym Name Ref No. Date Recognised
1 AeSSA Aeronautical Society of South Africa VA A0022 11 August 2011
2 AMMSA Association of Mine Managers of South Africa VA A0031 24 January 2007
3 AMRE Association of Mine Resident Engineers VA A0032 22 August 2013
4 CEASA Clinical Engineering Association of South Africa VA A0040 26 August 2010
5 COET The Chamber of Engineering Technology VA A0001 19 October 2010
6 CSSA Concrete Society of Southern Africa VA A0019 11 August 2011
7 ICMEESA InstitutionofCertificatedMechanicalandElectricalEngineering VA A0002 24 November 2010
8 IEEE Institute of Electrical and Electronic Engineers South African Section VA A0036 22 August 2013
9 IMESA Institution of Municipal Engineering of Southern Africa VA A0003 14 April 2011
10 IPET Institute of Professional Engineering Technologists VA A0004 19 October 2010
11 LIASA Lift Inspectors Association of South Africa VA A0026 15 March 2012
12 NSBE National Society of Black Engineers VA A0037 23 May 2013
13 SAAMA South African Asset Management Association VA A0025 14 May 2009
14 SACEA SouthAfricanCollieryEngineers’Association VA A0005 11 August 2011
15 SACMA South African Colliery Managers Association VA A0029 23 May 2013
16 SAIAE South African Institute of Agricultural Engineers VA A0020 11 August 2011
17 SAICE South African Institution of Civil Engineering VA A0006 24 November 2010

64 65
The Engineering Council of South AfricaAnnual report for the year ended 31 March 2016
The Engineering Council of South AfricaAnnual report for the year ended 31 March 2016
Performance Information | ECSA Annual Report 2016ECSA Annual Report 2016 | Performance Information
18 SAIChE South African Institution of Chemical Engineers VA A0007 11 August 2011
19 SAIEE South African Institute of Electrical Engineers VA A0008 14 April 2011
20 SAIIE Southern African Institute of Industrial Engineers VA A0009 11 August 2011
21 SAIMechE The South African Institution of Mechanical Engineer-ing VA A0021 14 April 2011
22 SAIMENA South African Institute of Marine Engineers and Naval Architects VA A0010 11 August 2011
22 SAIMENA South African Institute of Marine Engineers and Naval Architects VA A0010 11 August 2011
23 SAIMM South African Institute of Mining and Metallurgy VA A0011 14 April 2011
24 SAIRAC South African Institute of Refrigeration and Air-Condi-tioning VA A0028 10 May 2012
25 SAT Society for Asphalt Technology VA A0043 26 August 2010
26 STE Society of Telkom Engineers VA A0035 22 August 2013
27 INCOSE International Council of Systems Engineering (SA Chapter) VA A0030 24 January 2007
28 SANCOLD South African National Committee on Large Dams VA A0046 4 December 2014
29 SASRE South African Society for Railway Engineers VA A0047 4 December 2014
30 LEEASA Lifting Equipment Engineering Association of South Africa VA A0048 4 December 2014
Category B
No Acronym Name Ref No. Date Recognised
31 SAFHE South African Federation of Hospital Engineers VA B0023 11 April 2011
32 SAID South African Institute of Draughting VA B0033 22 August 2013
33 SAIMC South African Institute of Measurement and Control VA B0024 11 August 2011
34 WISA Water Institute of Southern Africa VA B0038 12 June 2008
35 SABTACO South African Black Technical and Allied Careers Organisation VA B0045 23 May 2013
Category C
36 AMEU Association of Municipal Electricity Undertakings VA C0027 11 August 2011
37 BEPEC Built Environment Professions Export Council VA C0044 24 November 2010
38 CESA Consulting Engineers South Africa (p.n.a. SAACE) VA C0013 14 April 2011
39 IESSA Illumination Engineering Society of South Africa VA C0012 11 August 2011
40 IQSA Institute of Quarrying Southern Africa VA C0014 11 August 2011
41 ITC Institute for Timber Construction VA C0015 11 August 2011
42 SAFA South African Flameproof Association VA C0016 26 August 2010
43 SAFCEC South African Federation of Civil Engineering Contrac-tors VA C0017 11 August 2011
44 SAFPA South African Fluid Power Association VA C0039 26 November 2008
45 SAISC South African Institute of Steel Construction VA C0018 11 August 2011
46 SAIW South African Institute of Welding VA C0034 22 August 2013
47 SARF South African Road Federation VA C0042 26 August 2010
48 SASTT Southern African Society for Trenchless Technology VA C0041 26 August 2010

66 67
The Engineering Council of South AfricaAnnual report for the year ended 31 March 2016
The Engineering Council of South AfricaAnnual report for the year ended 31 March 2016
Governance | ECSA Annual Report 2016ECSA Annual Report 2016 | Governance
Part CGovernance

68 69
The Engineering Council of South AfricaAnnual report for the year ended 31 March 2016
The Engineering Council of South AfricaAnnual report for the year ended 31 March 2016
Governance | ECSA Annual Report 2016ECSA Annual Report 2016 | Governance
From left: Front Row (sitting):Mr Brijmohan, Ms Nkambule, Ms Botha, Mr Peters, Mr Gamede, Mr Madonsela, Dr Mathe, Dr Tutu, Dr Jacobs, Mr Moloisane
From left: Middle Row (standing):Prof Lacquet, Dr Lawless, Dr Singh, Ms Phiri, Ms Mangakane, Ms Maphumulo, Mrs Zuma, Mr Maswanganyi, Mr Ngcobo, Mr Myataza, Mr Zitha
From left: Back Row (standing):Mrs Padayachee-Saman, Mr Greenwood, Mr van Niekerk, Mr Leburu, Mr Jennings, Mr Erasmus, Prof Masu, Mr Jacobs, Mr Jele, Mr Stuurman, Mr Thunzi, Mr Petlane, Mr Mistry, Mr Nqandela, Mr Van den Berg, Prof Van Wyk
Absent from the photo:.Mr Gxamza, Mr Mashile, Dr Mwaka, Mr NyangoniMr Patel, Mr Soga, Ms Magubane, Ms SassenbergMr Dhlamini, Mr Burger, Mr Makhetha, Prof MarwalaMr Matthee
ECSA Council

70 71
The Engineering Council of South AfricaAnnual report for the year ended 31 March 2016
The Engineering Council of South AfricaAnnual report for the year ended 31 March 2016
Governance | ECSA Annual Report 2016ECSA Annual Report 2016 | Governance
16. Composition of the CouncilThe EPA establishes the Council as the governing body of ECSA. Section 3 of the EPA provides for the composition of the Council. It consists of 50 members appointed by the Minister of Public Works as the Executive authority of the Council.
17. Committee StructuresThe Council has 44 committees with delegated functions to enable the execution of ECSA mandate. The Committee structure is as per below;

72 73
The Engineering Council of South AfricaAnnual report for the year ended 31 March 2016
The Engineering Council of South AfricaAnnual report for the year ended 31 March 2016
Governance | ECSA Annual Report 2016ECSA Annual Report 2016 | Governance
18. Executive Authority:• Section3(1)(a)–Thirty(30)registeredpersons,excludingcandidates,ofwhomatleast20are
actively practicing in the Engineering Profession.• Section3(1)(b)–ten(10)personsofwhomatleast6mustbeprofessionalsintheserviceofthe
State.• Section3(1)(c)-ten(10)membersofthepublicnominatedthroughanopenprocessofpublic
participation.
19. Accounting Authority
ThetermofofficefortheCouncilisfouryearsandthetermofthecurrentCouncilendsinJuly2016.
In line with governance best practice:
• AllmembersoftheCouncilarenon-executiveandindependent.• TheCouncilactivelyplaysitsroleofoversightandgivingstrategicdirection.• CouncilhasapprovedchartersforhighimpactcommitteesandtheTermsofReferenceforall
other committees.
19.1 Members of the Council for the year under review are listed below:
Table 28: Members of the ECSA Council
No Name
Designation(in terms of the public entity board structure)
Dateappointed
Date resign-ed/ Death Qualifications
Other committees served
Number of council meetings attended
1 Mr Derick Norman Matthee
Profession 31 January 2012
N/A BEng Aeronautical Engineering;MSc Flight Test & EvaluationTest Flight EngineerCommercial Pilot Licence
PAC: AeronauticalReg Comm. Pr Eng
2/5
2 Dr Zwanani Titus Mathe
Profession 31 January 2012
PhD in Chemical EngineeringMBL
EXCOCRCTC
3/5
3 Mr Nicholas van den Berg
Profession 31 January 2012
BSc Eng (Civil) TC 2/5
4 Ms Malani Padayachee-Saman
Profession 31 January 2012
BSc Eng (Civil)GDE (Civil)Cert.Arb
PAC: Civil 5/5
5 Dr Allyson Lawless
Profession 31 January 2012
BSc Eng; MSc; DEng hc
JIC 4/5
6 Mr Ranthekeng Jones Moloisane
Profession 31 January 2012
MSc (Civil);MTech (Civil) cum laude; BSc (Honours) (Transport-ation Techno-logy); BTech: (Transport-ation Eng.); NDip (Civil)Diploma (Project Manageme-nt)
EXCOCRCECESGBIACIDoEWSACTPACTPQECVAReg Comm. TechniciansReg Comm. Technologists
5/5
7 Ms Anne Marie Sassenberg
Profession 31 January 2012
NHDT (Eng) Civil (Pret) CPMP
TCCIMPr Techno
3/5
8 Mr Mbuleleni Ambrose Ngcobo
Profession 31 January 2012
NHD (Civil) EXCOARCReg Comm. Technologists
5/5
9 Ms Tumisang Maphumulo
Profession 31 January 2012
BEng Electrical and Electronics (Honours)
PAC: Elect.Reg Comm. Pr Eng
4/5

74 75
The Engineering Council of South AfricaAnnual report for the year ended 31 March 2016
The Engineering Council of South AfricaAnnual report for the year ended 31 March 2016
Governance | ECSA Annual Report 2016ECSA Annual Report 2016 | Governance
No Name
Designation(in terms of the public entity board structure)
Dateappointed
Date resign-ed/ Death Qualifications
Other committees served
Number of council meetings attended
10 Mr Yashin Brijmohan
Profession 31 January 2012
N/A BSc Eng (Electrical); Diploma: Eng Bus Manageme-ent; MEng Engineering
EXCOSACIAC
3/5
11 Ms Thandiwe Nkambule
Profession 31 January 2012
N/A BSc (Eng); MEng (Electrical); MBA
TCF&SSAC
5/5
12 Mr Pelei Petlane
Profession 31 January 2012
N/A BEng (Electrical) PDE (Electrical); MEng (Engineering Management
IC 4/5
13 Prof Barend Van Wyk
Profession 31 January 2012
N/A NDip TelecomsNHDip EducationNHDip Electrical BTech ElectricalBComMScPhD
ESGBDeans’Advisory Comm.
1/5
14 Mr Christian Stuurman
Profession 31 January 2012
N/A MTech (Electrical) EPACTPACTPQEC
5/5
15 Mr Philippus Erasmus
Profession 31 January 2012
N/A NHDip Eng (Electrical)Mid ManagementCertificate
SACIDoEWTechno SGGESGBCRCReg Comm. TechnologistsReg Comm. TechniciansReg Comm. LMIReg Comm. MEMsReg Comm. FPSIsJIC
5/5
16 Ms Revona Botha
Profession 31 January 2012
N/A Postgraduate Certificate(BusEng Management), National Diploma (Financial Informa-tion Systems), National Diploma (Engineering), Cer-tificateInstallationElectrician
EXCOF&SVAICIDoEWReg Comm. Technicians
4/5
No Name
Designation(in terms of the public entity board structure)
Dateappointed
Date resign-ed/ Death Qualifications
Other committees served
Number of council meetings attended
17 Prof Beatrys Lacquet
Profession 31 January 2012
N/A BSc (Hons) Elec-trical & Electronic; MEng (cum laude) DEng
ECEPAC
3/5
18 Ms Philisa Mangakane
Profession 31 January 2012
N/A NDip Industri-al Engineering; Certificate:ProjectManagementBTech (Industrial)
F&SReg Comm. TechniciansCIM
3/5
19 Mr Kenneth Greenwood
Profession 31 January 2012
N/A CertificateinFuel Injection Mechanics
Reg Comm. LMI
3/5
20 Mr Mathuba Zitha
Profession 31 January 2012
N/A Postgraduate Eco-nomicsBSc (Civil)
PAC: Civil 3/5
21 Mr Nkosinathi Myataza
Profession 31 January 2012
N/A NDip (Mechani-cal Eng); NHDip (Mechanical Eng); GCC (OHS);NDip ( Project Manage-ment); BSc; Adv Programme (Risk Management) MSc (Operational Research)Executive Develop-ment ProgrammePost Graduate Cer-tificate:BusinessResearch Methods
IDoEWSAC
4/5
22 Mr Kudzai Nyangoni
Profession 31 January 2012
N/A MBA, BSc (Hons) Mech.Eng, Grad Dip Mkt Mgt (IMM)
EXCO F&SIDoEWPAC: Mechanical
3/5
23 Mr Cyril Gamede
Profession 31 January 2012
N/A BSc(Eng) Mechanical, MSc(Eng) Industrial, EMBA; Advanced Diploma in Labour Law;Certificatein Corporate Governance
EXCO 5/5

76 77
The Engineering Council of South AfricaAnnual report for the year ended 31 March 2016
The Engineering Council of South AfricaAnnual report for the year ended 31 March 2016
Governance | ECSA Annual Report 2016ECSA Annual Report 2016 | Governance
No Name
Designation(in terms of the public entity board structure)
Dateappointed
Date resign-ed/ Death Qualifications
Other committees served
Number of council meetings attended
24 Prof Tshilidzi Marwala
Profession 31 January 2012
N/A PhDMEng MechanicalBSc Mechanical
EXCOECCRC
0/5
25 Prof Leonard Masu
Profession 31 January 2012
N/A BSc (Hons) ; MSc Eng PhD Eng; PGDip BAdmin; MBA
None 4/5
26 Mr Onkgopotse Lord Leburu
Profession 31 January 2012
N/A NDip; NHDip; BTech Mechanical Engineering
CRCReg Comm. TechnologistsJICTPQECIACCPD
5/5
27 Dr Keith Jacobs Profession 31 January 2012
N/A PhD EXCOIACTPACTechno SGGESGBReg Comm. TechniciansCPE
3/5
28 Mr Kanak Mistry
Profession 31 January 2012
N/A BSc (Metallurgy & Material) MBL (Business Leadership)
EPACCRCReg Comm. Pr EngPAC: MetallurgicalCIM
5/5
29 Mr Richard Jennings
Profession 31 January 2012
N/A NHDT; Mine Managers Cert; MDP; AEP
SACReg Comm. Cert EngIDoEW
5/5
30 Mr Dirk van Niekerk
Profession 31 January 2012
N/A BSc Eng (Mining); BSc Eng (Hons); MEng (Mining); MBL;GCC: Mine Man-agerGCC: Mine Man-ager
IACIDoEWTechno SGGPAC: MiningJICEPQEC
5/5
31 Mr Camagu Soga
State 31 January 2012
N/A BSc (Physics (Distinction); ap-plied Mathematics (University of Fort Hare); BSc (Civil)
SACF&S
4/5
32 Mr Mongezi Gxamza
State 31 January 2012
N/A BEng IDoEW 5/5
No Name
Designation(in terms of the public entity board structure)
Dateappointed
Date resign-ed/ Death Qualifications
Other committees served
Number of council meetings attended
33 Mr Adrian Michael Peters
State 31 January 2012
N/A BSc Eng (Civil) , GDE, MBA
EXCOLMCICIDoEW
4/5
34 Mr Lungile Dhlamini
State 19 March2012
N/A NDip (Agriculture Land Use Plan-ning)
TCARCF&S
3/5
35 Mr Willem Schalk Brand Burger
State 11 May2012
N/A NDip (Agriculture Land Use Plan-ning)
None 3/5
36 Dr Beason Litungilu Mwaka
State 11 May2012
N/A Phd; MSc; BSc (Agricultural Engi-neering)
None 5/5
37 Mr Samuel Stephanus Jacobs
State 17 April2012
N/A BEng (Mech); MBA IDoEWICReg Comm. Technicians
4/5
1/5
38 Ms Tebogo Phiri State 17 April2012
N/A NDip Eng (Civil); MDP
IDoEW 1/5
39 Mr Nqaba Nqandela
State 09 October 2012
N/A National Diploma Electrical Engineer-ing; Programme in Project Manage-ment;Certificatein Telecomms Policy, Regulation & Management (TPRM);Certificatein Convergence and New Media in the Information Society; Master in Business Adminis-tration (MBA)
TCARC
3/5
40 Mr Thomas Boy Maswanganyi
State 14 December 2012
N/A NDip (Mech) Eng; BSc Mech
None 5/5

78 79
The Engineering Council of South AfricaAnnual report for the year ended 31 March 2016
The Engineering Council of South AfricaAnnual report for the year ended 31 March 2016
Governance | ECSA Annual Report 2016ECSA Annual Report 2016 | Governance
No Name
Designation(in terms of the public entity board structure)
Dateappointed
Date resign-ed/ Death Qualifications
Other committees served
Number of council meetings attended
41 Mr Rashid PateL
Public 31 January 2012
N/A B(Proc) LMC 1/5
42 Dr Anirood Singh
Public 31 January 2012
N/A HND (Civil Eng); Postgraduate Cer-tificateinMedicine& Law; BA; BProc; LLB; MA; LLM; LLD
IACSACLMCIC
5/5
43 Mr Mphikeleli Jele
Public 31 January 2012
N/A BSc Hons (Applied Sciences) Trans-portation Planning cum laude; BTech Civil Eng cum laude; NDip Civil cum laude
None 4/5
44 Mr Lemias Mashile
Public 31 January 2012
N/A BTech (Civil) Eng TCSACTPACJIC
1/5
45 Ms Trustworthy Zuma
Public 17 April 2012
N/A BComm; APM; MDP; MP (Supply Chain Manage-ment); EMLog
None 5/5
46 Dr Nomzamo Tutu
Public 17 April 2012
N/A PDM; DOH;MB-ChB; BSc
EXCOTCSAC
5/5
47 Mr Mthethunzima Thunzi
Public 11 August 2012
N/A NDip (Mech) Eng VACRC JICReg Comm. TechniciansLMCCPD
5/5
48 Ms Nelisiwe Veronica Barbara Magubane
Public 31 January 2012
N/A BSc (Elect) Eng; MBA; Cert in Sasol EDP;Certificate:Managing Govern-ment Performance; Certificate:Lead-ership Decision Making
EXCOARC
4/5
No Name
Designation(in terms of the public entity board structure)
Dateappointed
Date resign-ed/ Death Qualifications
Other committees served
Number of council meetings attended
49 Mr Seutloali Makhetha
Public 11 May 2012
N/A BSc (Civil) Eng; NDip (Civil) Eng; Post Grad Dip (Indust) Eng; Cert Construction Man-agement; Cert Adv Management MSc Project Man-agement
None 0/5
50 Mr Melusi Mofokeng
Public 31 January 2012
N/A NDip (Business Computing)
ARCIACVAIDoEWCIM
4/5

80 81
The Engineering Council of South AfricaAnnual report for the year ended 31 March 2016
The Engineering Council of South AfricaAnnual report for the year ended 31 March 2016
Governance | ECSA Annual Report 2016ECSA Annual Report 2016 | Governance
19.2 Council Member Meeting AttendanceFourth term Council member meeting attendance (April 2015 - March 2016)
Table 29:
NAME COUNCIL EXCO IC CRC ARC EC TRANS ESGB FI&ST IAC SAC
REGISTERED PERSONS
1. Mr Derick Norman Mathee 2/5
2. Dr Zwanani Titus Mathe 3/5 1/2 4/5 1/2
3. Mr Nicholas van den Berg 2/5 2/2
4. Ms Malani Paday-achee-Saman 5/5
5. Dr Allyson Lawless 4/5
6. Mr Ranthekeng Moloisane 5/5 2/2 3/5 0/0 1/4 3/3 2/2
7. Ms Anne-Marioe Sassen-berg 3/5 2/2
8. Mr Mbuleleni Ambrose Ngcobo 5/5 2/3
9. Ms Tumisang Maphumulo 4/5
10. Mr Yashin Brijmohan 3/5 2/2 2/3 2/2
11. Mrs Thandiwe Nkambule 5/5 1/2 2/2 1/2
12. Mr Pelei Petlane 4/5 3/3
13. Prof Barend van Wyk 1/5 2/4
14. Mr Christian Stuurman 5/5
15. Mr Phillipus Erasmus 5/5 4/5 4/4 1/2
16. Mr Revona Botha 4/5 2/2 3/3 2/2
17. Prof Beatry Lacquet 3/5 0/0
18. Ms Philisa Mangakane 3/5 1/2
19. Mr kenneth Greenwood 3/5
20. Mr Matuba Zitha 3/5
21. Mr Nkosinathi Myataza 4/5 2/2
22. Mr Kudzai Nyangoni 3/5 0/2 1/2
23. Mr Cyril Gamede 3/5 1/2
24. Prof Tshilidzi Marwala 0/5 0/2 0/5 0/0
25. Prof Leonard Masu 4/5
NAME COUNCIL EXCO IC CRC ARC EC TRANS ESGB FI&ST IAC SAC
REGISTERED PERSONS
26. Mr Onkgopotse Leburu 4/5 1/5 3/3
27. Dr Keith Jacobs 3/5 2/2 5/5 3/4 2/3
28. Mr Kanak Mistry 5/5 1/5
29. Mr Richard Jennings 5/5 2/2
30. Mr Dirk van Niekerk 5/5 3/3
31. Mr Camagu Soga 4/5 1/2 1/2
32. Mr Mongezi Gxamza 5/5
33. Mr Adrian Michael Peters 4/5 1/2 2/3
34. Mr Lungile Dhlamini 3/5 0/3 0/2 2/2
35. Mr Willem Schalk Brand Burger 3/5
36. Dr Beason Litungilu Mwaka 5/5
37. Mr Samuel Stephanus Jacobs 4/5 3/3
38. Ms Tebogo Phiri 1/5
39. Mr Nqandela 3/5 1/2 1/2
40. Mr Thompson Boy Maswan-ganyi 5/5
41. Mr Rashid Patel 1/5
42. Dr Anirood Singh 5/5 2/3 3/3 2/2
43. Mr Mphikeleli Jele 4/5
44. Mr Lemias Mashile 1/5 2/2 2/2
45. Ms Trustworthy Zuma 5/5
46. Dr Nomzamo Tutu 5/5 1/2 2/2 0/2
47. Mt Mthethunzima Thunzi 5/5 5/5
48. Ms Nelisiwe Veronica Barbara Magubane 4/5 0/2 3/3
49. Mr Seutloali Makhetha 0/5
50. Mr Melusi Mofokeng 4/5 4/5 3/3 2/3

82 83
The Engineering Council of South AfricaAnnual report for the year ended 31 March 2016
The Engineering Council of South AfricaAnnual report for the year ended 31 March 2016
Governance | ECSA Annual Report 2016ECSA Annual Report 2016 | Governance
Name of committee: EXCOTable 30: Number of committee members: 11
No. Name of committee member No.of meetings held
No.of meetings attended
1. Mr C V Gamede 2 1
2. Mr A M Peters 2 1
3. Ms R A Botha 2 2
4. Mr Y Brijmohan 2 2
5. Dr K I Jacobs 2 2
6. Ms N V B Magubane 2 0
7. Prof T Marwala 2 0
8. Dr Z T Mathe 2 1
9. Mr R J Moloisane 2 2
10. Mr K K Nyangoni 2 0
11. Dr N Tutu 2 1
Name of committee: Investigating Committee (IC)Table 31: Number of committee members: 17
No. Name of committee member No.of meetings held
No.of meetings attended
1. Mr A M Peters 3 2
2. Mrs R A Botha 3 3
3. Mr A D Aimer 3 3
4. Mr D Argyrakis 3 0
5. Mr G Barbic 3 0
6. Prof W M G Burdzik 3 2
7. Dr P W Day 3 2
8. Mr R Forbes 3 3
9. Mr S S Jacobs 3 3
10. Mr T N Maphumulo 3 2
11. Mr B P Petlane 3 3
20. High Impact Committee Members 12. Mr K Schwartz 3 2
13. Dr A Singh 3 2
14. Ms S Skorpen 3 2
15. Mr T J Tshikundamalema 3 3
16. Mrs E M Visser 3 3
17. Mr P Zingeni 3 3
Name of committee: Central Registration Committee (CRC)Table 32: Number of committee members: 18
No. Name of committee member No.of meetings held
No.of meetings attended
1. Dr Z T Mathe 5 4
2. Mr R J Moloisane 5 3
3. Mr L Beech 5 4
4. Mr K Chanikuli 5 4
5. Mr P M Erasmus 5 4
6. Ms M Hughes 5 4
7. Dr K I Jacobs 5 5
8. Mr S J Kloppers 5 4
9. Mr O L Leburu 5 1
10. Mr ON Letsholo 5 2
11. Mr D Liebenberg 5 4
12. Mr T C Madikane 5 5
13. Prof T Marwala 5 0
14. Mr K Mistry 5 1
15. Mr M M G Mofokeng 5 4
16. Ms G N Nxumalo 5 0
17. Mr S Singh 5 5
18. Mr M Thunzi 5 5

84 85
The Engineering Council of South AfricaAnnual report for the year ended 31 March 2016
The Engineering Council of South AfricaAnnual report for the year ended 31 March 2016
Governance | ECSA Annual Report 2016ECSA Annual Report 2016 | Governance
Name of committee: International Affairs Committee (IAC)Table 35: Number of committee members: 13
No. Name of committee member No.of meetings held
No.of meetings attended
1. Mr R J Moloisane 3 3
2. Mr M M G Mofokeng 3 2
3. Mr Y Brijmohan 3 2
4. Prof A Geertsema 3 1
5. Ms S Gourrah 3 1
6. Mr D T Grobler 3 3
7. Prof H Hanrahan 3 3
8. Dr K I Jacobs 3 2
9. Mr O L Leburu 3 3
10. Mr T C Madikane 3 3
11. Mr S Schoombile 3 3
12. D A Singh 3 3
13. Mr D J van Niekerk 3 3
Name of committee: Education Committee (EC)Table 36: Number of committee members: 10
No. Name of committee member No.of meetings held
No.of meetings attended
1. Prof T Marwala 0 0
2. Prof B Lacquet 0 0
3. Prof T Andrew 0 0
4. Prof A Geertsema 0 0
5. Ms S Gouurah 0 0
6. ProfHJeffery 0 0
7. Prof J H Knoetze 0 0
8. Dr N Luruli 0 0
9. Mr R J Moloisane 0 0
10. Prof K Naidoo 0 0
Name of committee: Audit, Risk and Compliance CommitteeTable 33: Number of committee members: 7
No. Name of committee member No.of meetings held
No.of meetings attended
1. Ms N V B Magubane 3 3
2. Mr M A Ngcobo 3 2
3. Mr M M G Mofokeng 3 3
4. Mr L Dhlamini 3 0
5. Mr L Mpambani 3 1
6. Mr A Singh 3 0
7. Mr N Nqandela 2 1
Name of committee: Finance and Staff CommitteeTable 34: Number of committee members: 6
No. Name of committee member No.of meetings held
No.of meetings attended
1. Mr K K Nyangoni 2 1
2. Mr C Soga 2 1
3. Ms R A Botha 2 2
4. Mr L Dhlamini 2 2
5. Ms T Nkambule 2 2
6. Ms P Mangakane 2 1

86 87
The Engineering Council of South AfricaAnnual report for the year ended 31 March 2016
The Engineering Council of South AfricaAnnual report for the year ended 31 March 2016
Governance | ECSA Annual Report 2016ECSA Annual Report 2016 | Governance
Name of committee: Engineering Standards Generating Body (ESGB)Table 39: Number of committee members: 12
No. Name of committee member No.of meetings held
No.of meetings attended
1. Dr K I Jacobs 4 3
2. Prof B van Wyk 4 2
3. Mr R Mohring 4 0
4. Dr T Stidworthy 4 4
5. Mr D T Grobler 4 4
6. Mr P Erasmus 4 4
7. Mr P Moncur 4 3
8. Prof B Collier-Reed 4 4
9. Mr R J Moloisane 4 1
10. Prof A Geertsema 4 2
11. Mr L Beech 4 2
12. Prof K Naidoo 4 1
Name of committee: Transformation Committee (TC)Table 37: Number of committee members: 10
No. Name of committee member No.of meetings held
No.of meetings attended
1. Dr N Tutu 2 2
2. Mr L Mashile 2 2
3. Mr L T Dhlamini 2 0
4. Dr D R Mkhize 2 1
5. Dr Z T Mathe 2 1
6. Ms T Nkambule 2 1
7. Mr N Nqandela 2 1
8. Mrs A M Sassenberg 2 2
9. Mr N P van den Berg 2 2
10. Mr C Koopman 1 1
Name of committee: Strategic Advisory Committee (SAC)Table 38: Number of committee members: 14
No. Name of committee member No.of meetings held
No.of meetings attended
1. Mr Y Brijmohan 2 2
2. Mr P M Erasmus 2 1
3. Mr R E Jennings 2 2
4. Mr L Mashile 2 2
5. Mr R J Moloisane 2 2
6. Mr T C Madikane 2 2
7. Mr P S Moncur 2 1
8. Mr N Myataza 2 2
9. Mr T Nkambule 2 1
10. Mr T Pillay 2 1
11. Dr A Singh 2 2
12. Mr C M Soga 2 1
13. Prof F Sodi 2 0
14. Dr N Tutu 2 0

88 89
The Engineering Council of South AfricaAnnual report for the year ended 31 March 2016
The Engineering Council of South AfricaAnnual report for the year ended 31 March 2016
Governance | ECSA Annual Report 2016ECSA Annual Report 2016 | Governance
21. Remuneration of Council MembersTable 40:: Remuneration of Council Members
No. Name Honorarium Travel Reimbursable Total
1 Botha RA 41 820,00 8 096,43 0,00 49 916,43
2 Brijmohan Y 0,00 0,00 2 572,49 2 572,49
3 Burger WSB 0,00 3 942,00 0,00 3 942,00
4 Dhlamini LT 9 050,00 902,28 0,00 9 952,28
5 Erasmus PM 189 330,00 39 739,74 1 042,00 230 111,74
6 Gamede VC 0,00 0,00 6 244,77 6 244,77
7 Greenwood K 8 160,00 1 813,32 0,00 9 973,32
8 Gxamza M 0,00 0,00 0,00 0,00
9 Jacobs KI 119 320,00 1 843,98 240,00 121 403,98
10 Jacobs SS 2 040,00 0,00 80,00 2 120,00
11 Jele Me 6 120,00 919,80 184,90 7 224,70
12 Jennings R 12 240,00 473,04 0,00 12 713,04
13 Lacquet BM 12 240,00 297,84 0,00 12 537,84
14 Lawless A 21 465,00 1 541,76 0,00 23 006,76
15 Leburu O L 130 560,00 113 442,00 0,00 244 002,00
16 Magubane N 6 120,00 3 188,64 0,00 9 308,64
17 Makhetha S 0,00 0,00 0,00 0,00
18 Mangakane P 38 460,00 7 200,72 0,00 45 660,72
19 Maphumulo TP 44 685,00 11 217,18 0,00 55 902,18
20 Marwala T 0,00 0,00 0,00 0,00
21 Masu Ml 6 120,00 2 733,12 0,00 8 853,12
22 Mashile LB 10 200,00 3 504,00 0,00 13 704,00
23 Maswanganyi TB 9 050,00 11 037,60 687,50 20 775,10
24 Matthee DN 6 120,00 3 188,64 0,00 9 308,64
25 Mathe ZT 8 985,00 1 752,00 0,00 10 737,00
No. Name Honorarium Travel Reimbursable Total
26 Mistry KC 15 300,00 6 832,80 0,00 22 132,80
27 Mofokeng MMG 20 335,00 6 132,00 0,00 26 467,00
28 Moloisane RJ 145 015,00 50 383,14 5 379,33 200 777,47
29 Myataza NM 8 160,00 0,00 0,00 8 160,00
30 Ngcobo MA 39 000,00 73 978,20 1 287,00 114 265,20
31 Nkambule T 0,00 748,98 175,00 923,98
32 Nqandela N 6 120,00 876,00 0,00 6 996,00
33 Nyangoni K 15 300,00 1 384,08 0,00 16 684,08
34 Padayachee Saman M 29 280,00 613,20 0,00 29 893,20
35 Patel R 2 040,00 70,08 0,00 2 110,08
36 Peters Am 39 455,00 4 467,60 3 518,50 47 441,10
37 Petlane BP 11 220,00 2 146,20 0,00 13 366,20
38 Phiri T 1 020,00 385,44 0,00 1 405,44
39 Sassenberg A 19 380,00 0,00 33 799,42 53 179,42
40 Singh AJ 36 660,00 2 750,64 0,00 39 410,64
41 Stuurman CP 80 255,00 11 734,02 1 990,86 93 979,88
42 Thunzi M 44 880,00 5 632,68 0,00 50 512,68
43 Tutu N 12 240,00 0,00 0,00 12 240,00
44 Van Den Berg NP 3 060,00 0,00 0,00 3 060,00
45 Van Niekerk DJ 155 570,00 58 048,14 2 419,85 216 037,99
46 Van Wyk BJ 1 020,00 613,20 0,00 1 633,20
47 Zitha TM 10 200,00 2 369,58 0,00 12 569,58
48 Zuma TM 8 160,00 919,80 80,00 9 159,80
1 385 755,00 446 919,87 59 701,62 1 892 376,49

90 91
The Engineering Council of South AfricaAnnual report for the year ended 31 March 2016
The Engineering Council of South AfricaAnnual report for the year ended 31 March 2016
Governance | ECSA Annual Report 2016ECSA Annual Report 2016 | Governance
No. Risk Risk Category Risk Descriptor Impact Likelihood Residual
RiskRisk
RatingAction Strategies/
Status
7. Inadequate business continuity processes
Operational No plan to continue business operations in the event of a major disruption (suchasfireorpower failure) toECSA’soperations
3.20 3.20 10.24 Medium ECSA is currently conducting feasibility studies in order to developafully-fledgedBusiness Continuity Plan.
8. Lack of automated systems for statutory functions
Operational Outdated IT system and controls for capturing member’sdata.
3.70 3.60 13.32 High Procurement is underway to consolidate the IT infrastructure. And plan to launch phase 1 by March 2017
9.. Outdated enabling legislation
Governance The current legislation is not fitforpurposeand needs reviewing
3.50 3.80 13.3 High ECSA awaits the Minister of Public Works to trigger the process as per his plan.
10. Lack of succession planning
Governance Insufficientsuccession planning and knowledge sharing in key positions poses arisktoECSA’ssustainability and business continuity
3.80 3.70 14.06 High Management is in the process to develop a sound HR strategy that will address succession planning.
11. Inappropriate structure and governance arrangements
Governance The current structure and governance arrangements are inappropriate as they do not enable ECSA to deliver services well, meet the organisational objectives and achieve sustainable outcomes.
3.20 3.60 11.52 Medium Administration is in the process of reviewing ECSA governance structures. A draft for discussion in place and will be abled during the third quarter of 2016/17financialyearto Council for approval.
12. Lack of a sustainable financialmodel
Financial Main revenue source (80% from membership fees) does not guarantee ECSA’sviability
3.90 3.70 14.43 High A sustainability model has been developed in is the early stages of implementation.
13. Inadequate ECSA awareness by the public
Strategic There is limited knowledge of ECSA and its activities by the broader public
3.50 3.30 11.55 Medium Management continue to implement its brand strategy.
14. Weak value proposition
Strategic Reduced income due cancellation of registration because of the perceived lack of membership value
3.30 3.40 11.22 Medium ECSA value proposition is embedded in the corporate strategy
22. Risk Management Belowaretherisksthatwereidentifiedduringthe2015/16financialyear.Thesameriskslargelypres-entsasathreattothebusiness.Managementputinplaceplanstomanagetheidentifiedriskssothatthey do not escalate to a catastrophic levels.
Table 41:
No. Risk Risk Category Risk Descriptor Impact Likelihood Residual
RiskRisk
RatingAction Strategies/
Status
1. Insufficientnumber of trained assessors
Human There are an insufficientnumber of trained assessors of applications
3.00 3.30 9.90 Medium 81 assessors were trained against a target of 270. Management will continue to train assessors for both paper based and online assessment.
2. Insufficientfinancialresources
Financial Reduced income as registered persons cancel their registration
3.0 3.0 9 Medium A retention strategy was developed but not yet implemented. It will be implemented during the2016/17financialyear.
3. Inadequate processes and procedures
Operational The risk of loss resulting from inadequate or failed internal processes and non-adherence to procedures
3.50 3.00 10.50 Medium An implementation plan to develop the quality management systems has been finalized.Theactualdevelopment will commence during the 2016/17financialyear.
4. Inadequate stakeholder support and cooperation
Strategic There is no effectivestakeholder engagement, i.e. the process by which ECSA involves people who may be affectedbythedecisions it makes or can influencetheimplementation of its decisions
3.0 3.0 9 Medium During the year under review ECSA hosted a very successful stakeholder engagement process for the New Registration system (NRS). Management collated challenges expressed by registered person and are working towards findingpossiblesolutions in response to the challenges.
5. Shortage of experts in engineering
Human There is an ongoing shortage of engineering specialists to meet the demand
3.30 3.20 10.56 Medium Council has embarked on a process to developspecifiedcategories of registration to broaden the registration scope. Policies in this regardarefinalized.Registration of new specifiedcategorieswill commence on approval by Council.
6. Lack of buy inbyqualifiedcandidates in newspecifiedcategories of registration
Operational Potential unwillingness to pay similar fees as the existing ECSA membership
4 3 12 Medium An action plan is being develop to mitigate the risk.

92 93
The Engineering Council of South AfricaAnnual report for the year ended 31 March 2016
The Engineering Council of South AfricaAnnual report for the year ended 31 March 2016
Governance | ECSA Annual Report 2016ECSA Annual Report 2016 | Governance
23. Internal Audit, Risk and Compliance Committee
Internal Audit work done in the 2015/16 financial year
Table 42: Item Audit Process Status of Audit
1 Supply Chain management review The audit was completed and the report presented to the Audit Risk Committee in July 2015.
2 Registration follow-up review The audit was completed and the report presented to the Audit Risk Committee in October 2015.
3 Audit of Performance Information 4th quarter review
The audit was completed and the report presented to the Audit Risk Committee in October 2015.
4 Education processes review The audit was completed and the report presented to the Audit Risk Committee in February 2016.
5 Marketing and Strategic Stakeholder Management review.
Management requested to prioritise the audit of Performance Information (AoPI) instead of this review. The AoPI commenced 25 April 2016. The report still has to be presented.
The ARC has the following responsibilities:
24. Key Activities and Objectives of the Internal Audit
I. Integrated reporting
The Committee oversees integrated reporting, and in particular the Committee must:
a. Give regard to all factors and risks that may impact on the integrity of the integrated report, including factors that may predispose management to present a misleading picture, significantjudgmentsandreportingdecisionsmade,monitoringorenforcementactionsbya regulatory body, any evidence that brings into question previously published information, and forward-looking statements or information;
b. Reviewtheannualfinancialstatements; c. Commentintheannualfinancialstatementsonthefinancialstatus,theaccountingpractices
andtheeffectivenessoftheinternalfinancialcontrols; d. Review the disclosure of sustainability issues in the integrated report to ensure that it is
reliable; e. Recommend to Council the engagement of an external assurance provider on material
sustainability issues; and f. Recommend the integrated report for approval by the Council.
No. Risk Risk Category Risk Descriptor Impact Likelihood Residual
RiskRisk
RatingAction Strategies/
Status
15. Lack of efficientregistration processes
Operational Long turnaround times for both registration and refusals are currently experienced
4.0 3.5 14.0 High High
Investigate and implement a streamlined and efficientregistrationprocess.
16. Non-compliance with policies, procedures and regulations
Legal The organization has not implemented the necessary systems and processes (including the relevant compliance management plans) within the business to ensure the meeting of compliance obligations
3.40 3.10 10.54 Medium The Delegation of Authority was developed and is in the early stages of implementation. In addition the Quality Management System are being developed.

94 95
The Engineering Council of South AfricaAnnual report for the year ended 31 March 2016
The Engineering Council of South AfricaAnnual report for the year ended 31 March 2016
Governance | ECSA Annual Report 2016ECSA Annual Report 2016 | Governance
24. Key Activities and Objectives of the Internal Audit (Cont.)
II. Combined assurance The Committee ensures that a combined assurance model is applied to provide a coordinated
approach to all assurance activities, and in particular the Committee must: a. Adopt and apply an internationally Combined Assurance Framework; b. Makesurethatthecombinedassurancereceivedisappropriatetoaddressallthesignificant
risks facing the organisation; and c. Monitor the relationship between the external assurance providers and the organisation.
III. Governance and compliance The Committee is responsible for overseeing governance and compliance and must: a. Ensure compliance to the prescripts of the PFMA; b. Establish an Ethics Committee; c. Monitor the application of good governance principles by ECSA; d. Monitor the progress of governance implementation plans; and e. Review and monitor the process in place to ensure that ECSA complies with all relevant
legal and statutory requirements.
IV. Internal audit The Committee is responsible for overseeing the internal audit, and in particular the Committee
must: a. Have input into the appointment, performance assessment and/or dismissal of the Internal
Auditor; b. Approve the Annual Internal Audit Plan; Evaluate the performance of the internal audit
function; c. Evaluate the performance of the internal audit function d. Ensure that the internal audit function is subject to an independent quality review, as and
when the Committee determines it appropriate; and e. Receive and oversee internal audit results and recommendations.
V. Risk management TheCommitteeisanintegralcomponentoftheriskmanagementprocessandspecificallythe
Committee must: a. Adopt and apply an internationally accepted Risk Management Framework; b. Oversee the development and annual review of a policy and plan for risk management to
recommend for approval to the Council; c. Monitor implementation of the policy and plan for risk management through risk management
systems and processes; d. Monitor the dissemination of the risk management plan throughout the organisation, and
integration into the day-to-day activities of the organisation; e. Ensure that risk management assessments are performed on a continuous basis; f. Ensure that frameworks and methodologies are implemented to increase the possibility of
anticipating unpredictable risks; g. Ensure that management considers and implements appropriate risk responses; h. Ensure that continuous risk monitoring by management takes place; i. ExpresstheCommittee’sformalopiniontotheCouncilontheeffectivenessofthesystem
and process of risk management; and j. Review reporting concerning risk management that is to be included in the integrated
report for timeliness, completeness and relevance.
VI. External audit The Committee is responsible for recommending the appointment of the external auditor and to
oversee the external audit process. In this regard the Committee must: a. Nominate the external auditor for appointment by the Council; b. Approve the terms of engagement and remuneration for the external audit engagement; c. Monitor and report on the independenceof theexternal auditor in theannual financial
statements; d. Defineapolicyfornon-auditservicesprovidedbytheexternalauditor; e. Pre-approve the contracts for non-audit services to be rendered by the external auditor;
and f. Reviewthequalityandeffectivenessoftheexternalauditprocess.
25. Compliance with Laws and RegulationsNRS roadshows where conducted to comply with Section 36 of the EPA for public consumption.
26. Fraud and Corruption
ECSA has developed a Fraud Prevention Policy which was approved by Council on 24 March 2016, the next step will be to implement this policy before a Fraud Hotline service supplier is appointed.
27. Preventing Conflict of Interest
ECSAestablishedasupplychainofficeduringthepreviousfinancialyearinordertobealignedtobestpractice in procurement processes. Below is a brief description of the processes implemented to mini-miseconflictofinterestinsupplychainmanagement.
1. SCMPolicyrequiresthatanyofficialwhoparticipatesinprocurementprocessessuchasBEC/BACmembersmustcompletea“conflictof interest”declarationandconfidentialityagreementpriortothecommencementoftheevaluation/adjudicationprocess.Noofficialwhohasaninterest(orwhoserelativeorfriendhasaninterest)inaparticularofferwillbeallowedtoparticipateintheevaluation, consideration and adjudication of the relevant tender/bid or quotes.
2. Bidders are expected to complete a “Declaration of interest questionnaire” (SBD 4 Form) whenevertheycompeteforatender,thisisforthebiddertoindicateifthereisaconflictofinterestor not.
3. SCMOfficialsalwaysobservesegregationofduties(whereoneofficialcannotstartatransactionuntilthefinalstage)whenevertheydotransactionseitherelectronicallyormanually.Forexample,theProcurementsystemdoesnotallowanSCMofficertocapturerequisition,requestquotesandissueapurchaseorder-differentofficialsarerequiredtodotransactionsbetweentheprocesses.Furthermore, the suppliers database system automatically and randomly selects suppliers for quotations.SCMDelegationofauthorityregulatesapprovalpowersofofficialsasperprescribedthresholds.
4. The Lexis system assisting in the checking of registered owners/shareholders of service providers has proved to work well, but the licence will not be renewed in 2016/17. A similar service, free of charge, is being supplied by National Treasuary.

96 97
The Engineering Council of South AfricaAnnual report for the year ended 31 March 2016
The Engineering Council of South AfricaAnnual report for the year ended 31 March 2016
Governance | ECSA Annual Report 2016ECSA Annual Report 2016 | Governance
28. Code of ConductKey Function:
The Engineering Profession Act, 46 of 2000 (the EPA) enjoins ECSA to refer matters relating to improper conduct by a registered person to an Investigating Committee (IC) appointed by ECSA.
The IC, through delegated powers from Council, investigates matters to determine breaches of the Code of Conduct.
Investigation of Complaints
Key Function:Complaints of improper conduct lodged against registered persons, or incidents regarding engineering related activities that may indicate improper conduct by registered persons are investigated. The Legal Services Unit of ECSA manages these investigations through the IC. The IC is mandated to investigate matters and to obtain evidence to determine whether or not, in its opinion, a registered person may be charged for breach of the Code of Conduct and, if so, to prefer the charge or charges against that registered person. The IC furthermore endeavors to determine trends, and initiate preventative steps, regarding unprofessional conduct. To this end, it conducts peer counseling meetings, issues advisory letters and generates practice notes.
The investigating of complaints and subsequent action against the registered person involved is fo-cused on the enhancement of public safety, safeguarding the image of the profession and maintaining professional standards. A comparative summary of investigations over the past four years is provided in the table below:
ECSA Investigations: Comparative Chart
Table 43:
Number of Matters 2015-2016 2014-2015 2013-2014 2012-2013
Complaints received for investigation 42 40 58 35
Complaints carried over from the previous reporting period 42 38 33 37
Complaintsfinalisedafterinvestigation 23 45 44 42
Disciplinary hearings concluded 24 8 3 12
Peer Counselling meetings held 1 4 2 2
Advisory Letters Issued 1 2 3 1
21. REGULATION OF ENGINEERING PRACTICE
Key Function: The Engineering Profession Act, 46 of 2000 (the EPA) enjoins ECSA to refer matters relating to improper conduct by a registered person to an Investigating Committee (IC) appointed by ECSA. The IC, through delegated powers from Council, investigates matters to determine breaches of the Code of Conduct. Investigation of Complaints Key Function: Complaints of improper conduct lodged against registered persons, or incidents regarding engineering related activities that may indicate improper conduct by registered persons are investigated. The Legal Services Unit of ECSA manages these investigations through the IC. The IC is mandated to investigate matters and to obtain evidence to determine whether or not, in its opinion, a registered person may be charged for breach of the Code of Conduct and, if so, to prefer the charge or charges against that registered person. The IC furthermore endeavors to determine trends, and initiate preventative steps, regarding unprofessional conduct. To this end, it conducts peer counseling meetings, issues advisory letters and generates practice notes. The investigating of complaints and subsequent action against the registered person involved is focused on the enhancement of public safety, safeguarding the image of the profession and maintaining professional standards. A comparative summary of investigations over the past four years is provided in the table below:
ECSA INVESTIGATIONS: COMPARATIVE CHART Number of Matters 2015 - 2016 2014 - 2015 2013 - 2014 2012-2013 Complaints received for investigation 42 40 58 35
Complaints carried over from the previous reporting period 42 38 33 37
Complaints finalised after investigation 23 45 44 42 Disciplinary hearings concluded 24 8 3 12 Peer Counselling meetings held 1 4 2 2 Advisory Letters Issued 1 2 3 1
Figure 15:
Steps to prevent improper conduct
The Rules for Inquiry into Alleged Improper Conduct, Board Notice 171of 2011 (Method of Inquiry) is currently under review. The revised Method of Inquiry will be published by September 2016. The Meth-od of Inquiry is revised annually.
Amendments to the Code of Conduct
The Code of Conduct for Registered Person, Board Notice 256 of 2013 is currently under review. The revised Code of Conduct would be published by September 2016.The Code of Conduct is revised an-nually.
29. Social Responsibility
Sakhimfundo Trust:
To increase the public interest in the engineering sector ECSA has an implementation wind of its socio- economic programmes and to provide support to aspiring future engineers. ECSA has the Sakhimfundo TrustanindependentbodythatisentrustedandembracedbyCounciltomaximiseECSA’sefforttoprovidefinancialsupport in the formofbursaries todeservingpoorstudents invariousengineeringdisciplines.
In 2015/16, we saw the continuation of a tripartite partnership between ECSA, the University of Johan-nesburg (UJ), and Gauteng Department of Infrastructure Development (GDID) with the latter continuing to provide support.

98 99
The Engineering Council of South AfricaAnnual report for the year ended 31 March 2016
The Engineering Council of South AfricaAnnual report for the year ended 31 March 2016
Governance | ECSA Annual Report 2016ECSA Annual Report 2016 | Governance
Wearepleasedtopresentourreportforthefinancialyearended31March2016.
Audit Committee Responsibility
The Audit Committee reports that it has complied with its responsibilities arising from Section 51 (1)(a)(ii) of the Public Finance Management Act and Treasury Regulation 27.1. The Audit Committee also reports that it has adopted appropriate formal terms of reference as its Audit Committee Charter, hasregulateditsaffairsincompliancewiththischarterandhasdischargedall itsresponsibilitiesascontained therein, except that we have not reviewed changes in accounting policies and practices.
The Effectiveness of Internal Control
OurreviewofthefindingsoftheInternalAuditwork,whichwasbasedontheriskassessmentsconductedin the public entity revealed certain weaknesses, which were then raised with the public entity.The following internal audit work was completed during the year under review:
Supply Chain Management review
Registration Process Follow-up review
2014/15 Audit of Performance Information 4th Quarter
Education Processes review
2015/16 Audit of Performance Information 4thQuarter–ThisauditreplacestheinitiallyapprovedMarketing and Strategic Stakeholder Management Review, at the request of management to prioritise this audit and with the approval of the Audit and Risk Committee.
The following were areas of concern:
SupplyChainManagement–controlswithinSCMwerefoundtobeinadequateandineffectiveas67%offindingsweredeemedtobeofhighriskandimpactwithintheSCMfunction.Thefindingswere attributed to the ineffectiveness of controls opposed to inadequacy, and theseincludedeviationsfromthesetSCMpolicyprescripts,systeminefficiencies,inadequateplanningandreviewoftenderspecificationsandtermsofreference
Registration Department - Slow progress in the implementation of controls and agreed managementactionplanswithregardstothepreviouslyraisedauditfindingswasnoted.Outof13findingsinitiallyreported,6weresatisfactorilyresolved,2partiallyresolvedand5remainedunresolved.Ofthe7findingseitherpartiallyresolvedorunresolved,5wereratedhighriskand2medium risk.
2014/15AuditofPerformanceInformation–therewerediscrepanciesbetweentheperformancetargets that management reported as achieved in the performance report, against what internal audit verified. This was mainly due to lack of and insufficient, supporting documentationto evidence the achievement of the reported targets. A total of 77 performance targets were reviewed,managementhadreported23targetsasachievedandInternalAuditconfirmedonly15 as achieved, 21 targets as not achieved and 41 were not reported on.
EducationDepartment–controlswiththeEducationDepartmentwerefoundtobeinadequateandineffectiveoverall.Controlweaknesseswerenotedaroundtheappointmentoftheeducationcommittee, poor management of the evaluation process, lack of audit trail to monitor progress made forevaluationsofqualifications, lackof turnaround times forevaluationofapplications,applicants’informationnottimeouslyupdatedandapplicationsforevaluationfilesnotkeptinafireproofcabinetamongstothers.
2015/16 Audit of Performance Information - there were discrepancies between the performance targets that management reported as achieved in the performance report, against what internal audit verified. This was mainly due to lack of and insufficient, supporting documentationto evidence the achievement of the reported targets. A total of 34 performance targets were reviewed,managementhadreported26targetsasachievedandInternalAuditconfirmedonly13 as achieved and 21 not achieved, against 8 that management had reported.
In-Year Management and Monthly/Quarterly Report
The public entity has reporting monthly and quarterly to the Treasury as is required by the PFMA.
Evaluation of Financial Statements
Wehavereviewedtheannualfinancialstatementspreparedbythepublicentity.
Auditor’s Report
Wehavereviewedtheentity’simplementationplanforauditissuesraisedintheprioryearandwearenotentirelysatisfiedthatthemattershavebeenadequatelyresolved,withintheregistrationdepartmentas well as the audit of performance information areas (which were the only areas audited in consecutive years).
TheinternalcontrolenvironmentatECSAappearstobeinadequateandineffectivewithintheareasreviewed.Whereareasofnon-complianceorineffectivecontrolswerehighlighted,managementhasput in place action plans to address the weaknesses, which should be monitored on an ongoing basis to ensuresustainabilityofimplementedcontrolsandtomaintainaneffectiveinternalcontrolenvironmentoverall.
The Audit Committee concurs and accepts the conclusions of Pricewaterhouse Coopers Inc. on the annual financial statements and is of the opinion that the audited annual financial statements be accepted and read together with the report of Pricewaterhouse Coopers Inc.
Ms Nelisiwe Veronica Barbara Magubane Chairperson of the Audit, Risk and Compliance CommitteeECSA
30. Audit Committee Report

100 101General Information | ECSA Annual Report 2016
The Engineering Council of South AfricaAnnual report for the year ended 31 March 2016
The Engineering Council of South AfricaAnnual report for the year ended 31 March 2016
ECSA Annual Report 2016 | Governance
Part DHuman Resource Management

102 103
The Engineering Council of South AfricaAnnual report for the year ended 31 March 2016
The Engineering Council of South AfricaAnnual report for the year ended 31 March 2016
Human Resource Management | ECSA Annual Report 2016ECSA Annual Report 2016 | Human Resource Management
Honourable Minister Nxesi, representatives of Council, dignitaries and some of ECSA staff members at the strategic plan.

104 105
The Engineering Council of South AfricaAnnual report for the year ended 31 March 2016
The Engineering Council of South AfricaAnnual report for the year ended 31 March 2016
Human Resource Management | ECSA Annual Report 2016ECSA Annual Report 2016 | Human Resource Management
31. Overview of Human Resources
Learnership Programme
OneofECSA’ssocialupliftmentfocusareasistheemploymentofyoungpreviouslydisadvantagedgraduates in the internship programme. The programme cuts across all disciplines within the administration function. Interns are employed on a one (1) year contract where they get exposure totheworkingenvironmentanddisciplinespecificworkexperience.
For theperiodunder review,five (5) internswereemployed,with three (3)placed inCorporateServices (Finance) and two (2) in Strategic Services.
Performance Management
Management and employee engagement continued in order to educate and inculcate a performance management culture. External professional advisers were involved in the continuous education and clarityonKPA’sandKPI’sandfocusedindividualdevelopmentplanning.
Employee Wellness
The ECSA Wellness Programme continued to offer employee well-being programmes andinterventions. ECSA employees and immediate family have access to a 24 hour personal support service in areas including but not limited to substance abuse, health issues, work related issues, family matters and stress.
Unveiling of the ECSA Strategy and Team Building
InOctober2015,theentirestaffandsomemembersoftheExecutiveCommitteeoftheCouncilattended the unveiling event of the ECSA strategy in Stellenbosch, Western Cape. Coupled to this occasion,was the staff teambuilding intervention conducted in sessions throughout during thethree days.
The strategy unveiling event was attended by the Honourable Minister of Public Works, Mr Thulas Nxesi, as a keynote speaker together with the Chairman and the CEO of the Engineering Council of Zimbabwe, Engineers Martin Manhuwa and Ben Rafemoyo, respectively. In his address of accepting the strategy and the annual performance plan, the Minister conveyed his appreciation of ECSA’seffortstotransformtheenvironmentandmentionedthatthiswasindeedamemorableandhistorical occasion.
The team building sessions were facilitated by a professional external provider, Mr Linda Ntuli, who highlighted the importance of introspection, individual contribution and collaboration in the workplace. He also emphasised the need for self-empowerment and excellence for the greater good of the ECSA.
Human Resources Focus Areas
The key focus areas for the 2016/2017 performance cycle include the following:
• ExploitationofexistingHumanResourcessystemsandlinemanagerempowerment;• HolisticreviewofHumanResourcespolicies;• Enhancedorganisationalperformanceanddevelopment;• CompliancewiththeEmploymentEquityAct;• Standardisedandalignedconditionsofemployment.
32. Human Resource Oversight StatisticsPersonnel Cost by Salary BandTable 44:
Level Personnel Expenditure(R’000)
% of personnel exp. to total personnel cost(R’000)
No. of employeesAverage personnel cost per employee
(R’000)
Top Management 1 717 350.00 4.82 1 1 717 350.00
Senior Management 5 221 190.99 14.66 4 1 305 297.75
Professionally Qualified 7 077 431.32 19.87 9 786 381.26
Skilled 17 822 758.58 50.04 48 371 307.47
Semi-skilled 3 770 443.36 10.61 18 209 969.08
Unskilled 0 0 0 0
TOTAL 35 618 175.25 100.00 80 445 227.19
PerformanceRewards–CompletePersonnelExpenditureinRandValueTable 45:
Personnel Categories Performance rewards Personnel Expenditure (R’000)
% of performance rewards to total
personnelcost(R’000)
Top Management 137 388.00 1 707 350.00 8.05
Senior Management 55 137.50 1 203 000.00 4.58
ProfessionallyQualified 294 769.09 5 138 924.32 5.74
Skilled 770 150.19 14 019 407.58 5.49
Semi-skilled 175 024.73 3 684 066.36 4.75
Unskilled 0 0 0
TOTAL 1 432 469.51 25 752 748.26 5.56

106 107
The Engineering Council of South AfricaAnnual report for the year ended 31 March 2016
The Engineering Council of South AfricaAnnual report for the year ended 31 March 2016
Human Resource Management | ECSA Annual Report 2016ECSA Annual Report 2016 | Human Resource Management
Training CostsTable 46:
Programme//activity/objective
Personnel Expenditure (R’000)
Training Expenditure(R’000)
Training Expenditure as a % of Personnel
Cost.
No. of empl-oyees
trained
Avg training cost per employee
Purco Delegate 428 000.00 6 500.00 1.52 1 6 500.00
Catering 146 649.00 5 999.00 4.09 1 5 999.00
Training 355 052.04 995.00 0.28 1 995.00
Payroll Systems 440 175.00 1 700.00 0.39 1 1 700.00
Workshop/Seminar 651 437.04 7 035.00 1.08 1 7 035.00
StaffTraining 146 649.00 12 000.00 2.73 3 4 000.00
HR Seminar 565 000.00 3 300.00 0.58 2 1 650.00
Tax Seminar 440 175.00 1 767.00 0.40 1 1 767.00
Interviewing Skills and Techniques
701 212.96 3 534.00 0.50 2 1 767.00
Catering for Training 1 197.00
Business Writing Training Course 355 042.44 33 642.00 0.43 22 1 529.18
Finance for Non-Financial Managers
1 717 350.00 7 068.00 0.41 1 7 068.00
Emotional Intelligence 203 043.00 11 286.05 0.69 8 1 410.76
Annual Labour Law Seminar 480 000.00 1 650.00 0.34 1 1 650.00
Best practice in PR & Communications
360 590.04 12 538.86 3.48 1 12 538.86
Tax Specialist Seminar 1 432 733.21 2 576.32 0.18 1 2 576.32
Excel Training 303 393.96 3 887.40 1.28 1 3 887.40
Excel and Word Training 303 393.96 3 410.00 1.12 1 3 410.00
Security Summit Conferenced 651 437.04 8 019.90 1.23 1 8 019.90
OHS First Aid Training 203 043.00 13 495.00 1.11 6 2 249.00
OHS Evacuation Drill Training 203 043.00 13 495.00 1.11 6 2 249.00
Employment and VacanciesTable 47:
Programme/activity/objective
2015/2016 No. of
Employees
2015/2016 Approved Posts
2015/2016 No. of
Employees
2015/2016 Vacancies % of vacancies
Top Management 1 1 1 0 0
Senior Management 4 4 4 0 0
ProfessionallyQualified 9 10 9 1 10
Skilled 48 48 48 0 0
Semi-skilled 18 18 18 0 0
Unskilled 0 0 0 0 0
TOTAL 80 81 80 1 1
Employment ChangesTable 48:
Salary BandEmployment
at beginning of period
Appointments Terminations Employment at end of the period
Top Management 1 1 0 1
Senior Management 3 1 3 1
ProfessionallyQualified 6 3 1 9
Skilled 48 5 5 48
Semi-skilled 18 2 2 18
Unskilled 0 0 0 0
TOTAL 76 12 11 77
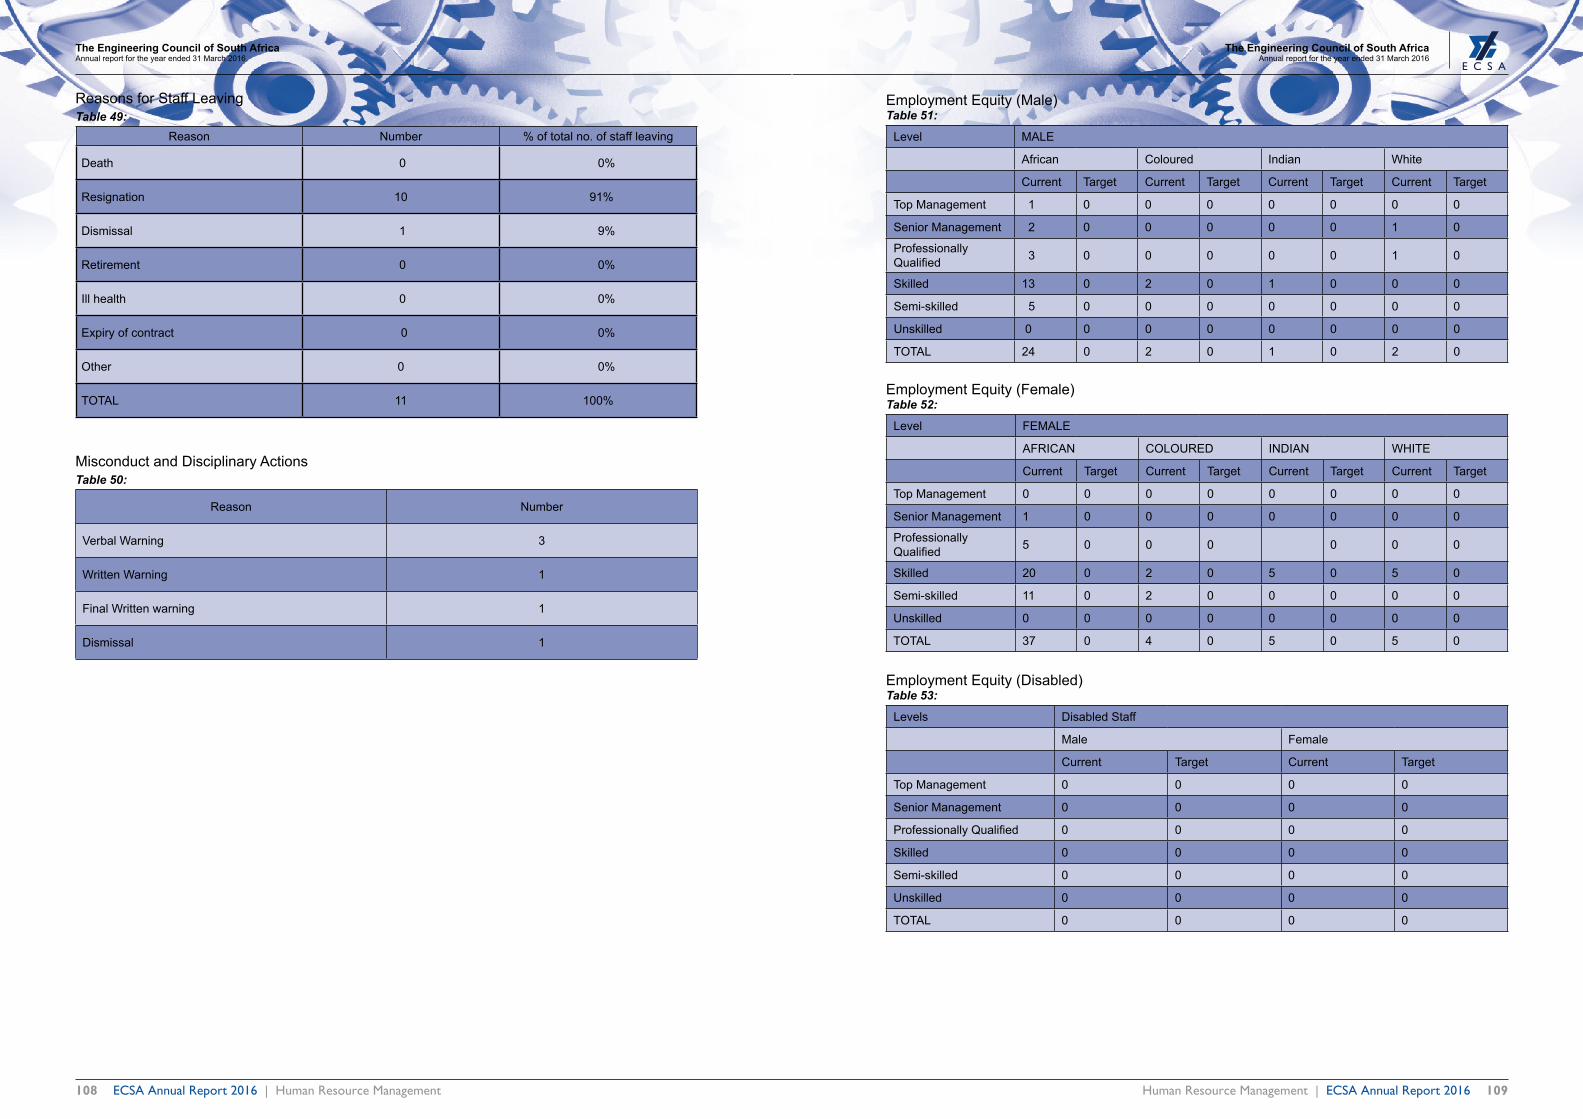
108 109
The Engineering Council of South AfricaAnnual report for the year ended 31 March 2016
The Engineering Council of South AfricaAnnual report for the year ended 31 March 2016
Human Resource Management | ECSA Annual Report 2016ECSA Annual Report 2016 | Human Resource Management
Employment Equity (Male)Table 51:
Level MALE
African Coloured Indian White
Current Target Current Target Current Target Current Target
Top Management 1 0 0 0 0 0 0 0
Senior Management 2 0 0 0 0 0 1 0
Professionally Qualified 3 0 0 0 0 0 1 0
Skilled 13 0 2 0 1 0 0 0
Semi-skilled 5 0 0 0 0 0 0 0
Unskilled 0 0 0 0 0 0 0 0
TOTAL 24 0 2 0 1 0 2 0
Employment Equity (Female)Table 52:
Level FEMALE
AFRICAN COLOURED INDIAN WHITE
Current Target Current Target Current Target Current Target
Top Management 0 0 0 0 0 0 0 0
Senior Management 1 0 0 0 0 0 0 0
Professionally Qualified 5 0 0 0 0 0 0
Skilled 20 0 2 0 5 0 5 0
Semi-skilled 11 0 2 0 0 0 0 0
Unskilled 0 0 0 0 0 0 0 0
TOTAL 37 0 4 0 5 0 5 0
Employment Equity (Disabled)Table 53:
Levels DisabledStaff
Male Female
Current Target Current Target
Top Management 0 0 0 0
Senior Management 0 0 0 0
ProfessionallyQualified 0 0 0 0
Skilled 0 0 0 0
Semi-skilled 0 0 0 0
Unskilled 0 0 0 0
TOTAL 0 0 0 0
ReasonsforStaffLeavingTable 49:
Reason Number %oftotalno.ofstaffleaving
Death 0 0%
Resignation 10 91%
Dismissal 1 9%
Retirement 0 0%
Ill health 0 0%
Expiry of contract 0 0%
Other 0 0%
TOTAL 11 100%
Misconduct and Disciplinary ActionsTable 50:
Reason Number
Verbal Warning 3
Written Warning 1
Final Written warning 1
Dismissal 1

110 111
The Engineering Council of South AfricaAnnual report for the year ended 31 March 2016
The Engineering Council of South AfricaAnnual report for the year ended 31 March 2016
Human Resource Management | ECSA Annual Report 2016ECSA Annual Report 2016 | Human Resource Management
Part EFinancial Information
The Engineering Council of South AfricaAnnual financial statements for the year ended 31 March 2016
Published 25 August 2016

Financial Information | ECSA Annual Report 2016ECSA Annual Report 2016 | Financial Information112 113
The Engineering Council of South AfricaAnnualfinancialstatementsfortheyearended31March2016
Council’s Responsibilities and ApprovalThe Engineering Council of South AfricaAnnualfinancialstatementsfortheyearended31March2016
Index Page
Council’sResponsibilitiesandApproval .....................................................................................................................113
Council’sReport .........................................................................................................................................................114
IndependentAuditor’sReport .....................................................................................................................................116
Statement of Financial Position ..................................................................................................................................118
Statement of Financial Performance ..........................................................................................................................119
Statement of Changes in Net Assets ..........................................................................................................................120
Statement of Cash Flows ...........................................................................................................................................121
Statement of Comparison of Budget and Actual Amounts ..........................................................................................122
Notestothefinancialstatements ...............................................................................................................................123
Detailed Income Statement ........................................................................................................................................149
Council’s Responsibilities and ApprovalThe Council, although not recognised by National Treasury as a Public Entity, chooses to follow the requirements of the Public Finance Management Act (Act 1 of 1999) in maintaining adequate accounting records and is responsible for thecontentandintegrityoftheannualfinancialstatementsandrelatedfinancialinformationincludedinthisreport.ItistheresponsibilityoftheCounciltoensurethattheannualfinancialstatementsfairlypresentthestateofaffairsoftheCouncilasattheendofthefinancialyearandtheresultsofitsoperationsandcashflowsfortheperiodthenended.Theexternalauditorsareengagedtoexpressanindependentopinionontheannualfinancialstatementsandweregivenunrestrictedaccesstoallfinancialrecordsandrelateddata.
The annual financial statements have been prepared in accordance with South African Standards of GenerallyRecognised Accounting Practice (GRAP) including any interpretations, guidelines and directives issued by the Accounting Standards Board.
Theannualfinancialstatementsarebaseduponappropriateaccountingpoliciesconsistentlyappliedandsupportedbyreasonable and prudent judgements and estimates.
TheCouncilacknowledgesthattheyareultimatelyresponsibleforthesystemofinternalfinancialcontrolestablishedby the Council, and place considerable importance on maintaining a strong control environment. To enable the Council to meet these responsibilities, the Council sets standards for internal control aimed at reducing the risk of error or deficitinacosteffectivemanner.Thestandardsincludetheproperdelegationofresponsibilitieswithinaclearlydefinedframework,effectiveaccountingproceduresandadequatesegregationofdutiestoensureanacceptablelevelofrisk.These controls are monitored throughout the Council and all employees are required to maintain the highest ethical standardsinensuringtheCouncil’sbusinessisconductedinamannerthatinallreasonablecircumstancesisabovereproach. The focus of risk management in the Council is on identifying, assessing, managing and monitoring all known forms of risk across the Council. While operating risk cannot be fully eliminated, the Council endeavours to minimise it by ensuring that appropriate infrastructure, controls, systems and ethical behaviour are applied and managed within predetermined procedures and constraints.
The Council is of the opinion, based on the information and explanations given by management, that the system of internalcontrolprovidesreasonableassurancethatthefinancialrecordsmaybereliedonforthepreparationoftheannualfinancialstatements.However,anysystemofinternalfinancialcontrolcanprovideonlyreasonable,andnotbsolute,assuranceagainstmaterialmisstatementordeficit.
TheCouncilhasreviewedtheCouncil’scashflowforecastfortheyearto31March2017and,inthelightofthisreviewand the current financial position, they are satisfied that theCouncil has or has access to adequate resources tocontinue in operational existence for the foreseeable future.
The external auditors are responsible for independently auditing and reporting on the Council’s annual financialstatements.TheannualfinancialstatementshavebeenexaminedbytheCouncil’sexternalauditorsandtheirreportispresented on page 116.
Theannualfinancialstatementssetoutonpages118to148whichhavebeenpreparedonthegoingconcernbasis,were approved by the Council on 25 August 2016 and were signed on its behalf by:
________________________________ ________________________________Mr CV Gamede Mr SE MadonselaPresidentChief ExecutiveOfficer

Financial Information | ECSA Annual Report 2016ECSA Annual Report 2016 | Financial Information114 115
The Engineering Council of South AfricaAnnualfinancialstatementsfortheyearended31March2016
Council’s Report
The Engineering Council of South AfricaAnnualfinancialstatementsfortheyearended31March2016
Council’s Report
Council’s ReportThe Council submits their report for the year ended 31 March 2016.
1. Review of activities
Main business and operations
The Engineering Council of South Africa (ECSA) is established in terms of the Engineering Profession Act (No. 46 of 2000). The Act empowers ECSA to perform the following functions, in order to protect the health and safety of citizensand the environment from the risks associated with engineering work:
• Setstandardsforengineeringeducationandprofessionalcompetency;• Accrediting engineering education programmes, offered by public and private providers, that meet with the
educational requirements for registration in the various categories;• Registerpersonsinprofessionalcategorieswhodemonstratescompetencyagainstthestandardsforthecategories;• Evaluateeducationalqualificationsthatarenotalreadyaccreditedorrecognised;• Registerpersonswhomeeteducationalrequirementsincandidatecategories;• Establish specified categories of registration to meet specific health and safety licensing requirements and
registered persons in these categories;• RequireregisteredpersonstorenewregistrationatintervalsandunderconditionsthattheCouncilprescribes;• Enterinternationalagreementsfortherecognitionofeducationalprogrammesandregistration;• Developandmaintainacodeofconduct,supportedwherenecessarybycodesofpractice;• Investigate complaints of improper conduct against registered persons and conduct enquiries and impose
sanctions as each case requires;• RecogniseVoluntaryassociations;• RecommendtotheCouncilfortheBuiltEnvironment(CBE),ECSA’sidentificationofthetypeoftheengineering
work which may be performed by persons registered in any category.
TheoperatingresultsandstateofaffairsoftheCouncilarefullysetoutintheattachedannualfinancialstatementsanddo not in our opinion require any further comment.
Address1st Floor Waterview Corner Building2 Ernest Oppenheimer AvenueBrumaLakeOfficeParkJohannesburg2198
2. Going concern
We draw attention to the fact that at 31 March 2016, the Council had accumulated surpluses of R 36,867,863 (2015: R28,695,340)andthattheCouncil’stotalassetsexceeditsliabilitiesbyR36,867,863(2015:R28,695,340).
Theannualfinancialstatementshavebeenpreparedonthebasisofaccountingpoliciesapplicabletoagoingconcern.Thisbasispresumesthat fundswillbeavailable tofinance futureoperationsand that therealisationofassetsandsettlement of liabilities, contingent obligations and commitments will occur in the ordinary course of business.
3. Subsequent events
TheCouncilisnotawareofanymatterorcircumstancearisingsincetheendofthefinancialyearthatcouldhaveamaterialeffectonthefinancialstatements.
Council’s Report4. Council members
The Council members of the organisation during the year and to the date of this report are as follows:
Mr CV Gamede (President) Mr DN MattheeMr A Peters Mr KC MistryMr RA Botha Mr MMG MofokengMr Y Brijmohan Mr RJ MoloisaneMr WSB Burger Dr B L MwakaMr LT Dhlamini Mr NM MyatazaMr PM Erasmus Mr MA NgcoboMr K Greenwood Mr N NqandelaMr M Gxamza Ms T NkambuleDr KI Jacobs Mr K NyangoniMr SS Jacobs Ms M Padayachee-SamanMr ME Jele Mr R PatelMr RE Jennings Mr BP PetlaneProf. BM Lacquet Ms T PhiriDr A Lawless Mr M ThunziMr OL Leburu Ms AM SassenbergMs NVB Magubane Mr AJ SinghMr S Makhetha Mr CM SogaMs P Mangakane Mr CP StuurmanMs TP Maphumulo Dr N TutuProf. T Marwala Mr NP van Den BergHon LB Mashile Mr DJ van NiekerkProf. ML Masu Prof. BJ van WykMr T Maswanganyi Ms TM ZumaDr ZT Mathe Mr MI Zitha
5. Secretary
ThedutiesofaCouncilsecretaryoftheECSAarefullyfulfilledbytheadministrativestaff.TheEngineeringProfessionAct does not require the ECSA to appoint a dedicated company secretary.
6. Auditors
PricewaterhouseCoopersInc.willcontinueinofficeinaccordancewiththeprocurementpolicy.
7. Legal form
Council.
8. PFMA compliance
The Engineering Council of South Africa strives to be PFMA compliant irrespective of the fact that National Treasury has recently declined to register the Council as a Public Entity. We will be seeking legal opinion on the matter.
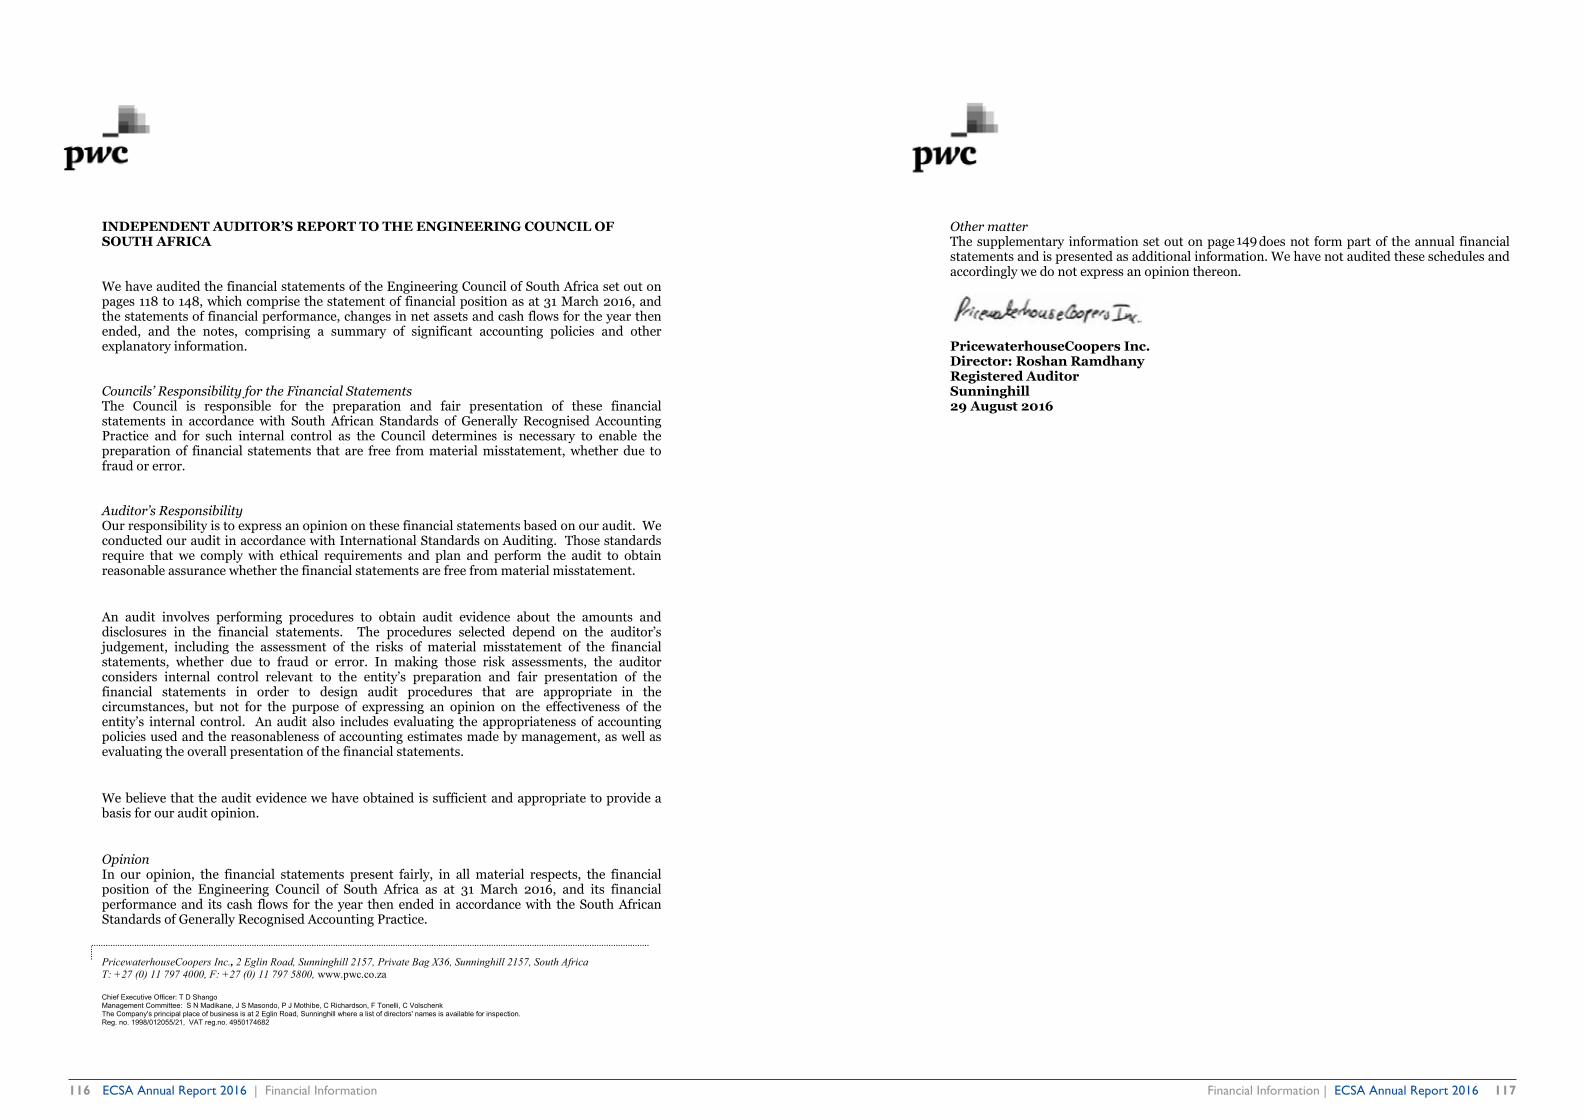
Financial Information | ECSA Annual Report 2016ECSA Annual Report 2016 | Financial Information116 117
The Engineering Council of South AfricaAnnual financial statements for the year ended 31 March 2016
Notes to the financial statements
PricewaterhouseCoopers Inc., 2 Eglin Road, Sunninghill 2157, Private Bag X36, Sunninghill 2157, South AfricaT: +27 (0) 11 797 4000, F: +27 (0) 11 797 5800, www.pwc.co.za
Chief Executive Officer: T D ShangoManagement Committee: S N Madikane, J S Masondo, P J Mothibe, C Richardson, F Tonelli, C VolschenkThe Company's principal place of business is at 2 Eglin Road, Sunninghill where a list of directors' names is available for inspection.Reg. no. 1998/012055/21, VAT reg.no. 4950174682
INDEPENDENT AUDITOR’S REPORT TO THE ENGINEERING COUNCIL OFSOUTH AFRICA
We have audited the financial statements of the Engineering Council of South Africa set out onpages 118 to 148, which comprise the statement of financial position as at 31 March 2016, andthe statements of financial performance, changes in net assets and cash flows for the year thenended, and the notes, comprising a summary of significant accounting policies and otherexplanatory information.
Councils’ Responsibility for the Financial StatementsThe Council is responsible for the preparation and fair presentation of these financialstatements in accordance with South African Standards of Generally Recognised AccountingPractice and for such internal control as the Council determines is necessary to enable thepreparation of financial statements that are free from material misstatement, whether due tofraud or error.
Auditor’s ResponsibilityOur responsibility is to express an opinion on these financial statements based on our audit. Weconducted our audit in accordance with International Standards on Auditing. Those standardsrequire that we comply with ethical requirements and plan and perform the audit to obtainreasonable assurance whether the financial statements are free from material misstatement.
An audit involves performing procedures to obtain audit evidence about the amounts anddisclosures in the financial statements. The procedures selected depend on the auditor’sjudgement, including the assessment of the risks of material misstatement of the financialstatements, whether due to fraud or error. In making those risk assessments, the auditorconsiders internal control relevant to the entity’s preparation and fair presentation of thefinancial statements in order to design audit procedures that are appropriate in thecircumstances, but not for the purpose of expressing an opinion on the effectiveness of theentity’s internal control. An audit also includes evaluating the appropriateness of accountingpolicies used and the reasonableness of accounting estimates made by management, as well asevaluating the overall presentation of the financial statements.
We believe that the audit evidence we have obtained is sufficient and appropriate to provide abasis for our audit opinion.
OpinionIn our opinion, the financial statements present fairly, in all material respects, the financialposition of the Engineering Council of South Africa as at 31 March 2016, and its financialperformance and its cash flows for the year then ended in accordance with the South AfricanStandards of Generally Recognised Accounting Practice.
Other matterThe supplementary information set out on page 38 does not form part of the annual financialstatements and is presented as additional information. We have not audited these schedules andaccordingly we do not express an opinion thereon.
PricewaterhouseCoopers Inc.Director: Roshan RamdhanyRegistered AuditorSunninghill29 August 2016
149

Financial Information | ECSA Annual Report 2016ECSA Annual Report 2016 | Financial Information118 119
The Engineering Council of South AfricaAnnualfinancialstatementsfortheyearended31March2016
Statement of Financial Performance
The Engineering Council of South AfricaAnnualfinancialstatementsfortheyearended31March2016
Statement of Financial Position as at 31 March 2016
Statement of Financial Performance 2016 2015 Note(s) R ROperating revenue 14 79,734,715 68,764,453Other income 15 1,815,066 358,118Total operating revenue 81,549,781 69,122,571Total expenses (See notes 16 to 18) (82,201,333) (68,862,905)
Operating (deficit)/surplus 18 (651,552) 259,666Investment revenue 19 6,108,589 4,156,496Fair value adjustments 28 108,475 968,799Actuarial gains/(losses) 7 (5,730,000) 7,529,000Effectsofpensionfundassetlimitation 7 10,417,000 (7,717,000)Finance costs 20 (2,079,989) (2,446,799)
Surplus for the year 8,172,523 2,750,162
Statement of Financial Position as at 31 March 2016 2016 2015 Note(s) R R
AssetsNon-Current AssetsProperty, plant and equipment 4 8,337,937 8,383,728Intangible assets 5 2,430,275 2,327,564Investments 6 12,347,620 11,932,256Netretirementbenefitasset 7 8,949,000 2,003,000 32,064,832 24,646,548
Current AssetsTrade and other receivables 8 6,930,682 5,891,480Prepayments 207,867 -Cash and cash equivalents 9 12,170,755 11,194,404 19,309,304 17,085,884Total Assets 51,374,136 41,732,432
Liabilities
Non-Current LiabilitiesBorrowings 10 - 438,660
Current LiabilitiesBorrowings 10 587,704 994,613Trade and other payables 11 12,371,401 9,958,648Provisions 12 1,547,168 1,645,171 14,506,273 12,598,432Total Liabilities 14,506,273 13,037,092Net Assets 36,867,863 28,695,340Accumulated surplus 36,867,863 28,695,340Total Liabilities And Net Assets 51,374,136 41,732,432
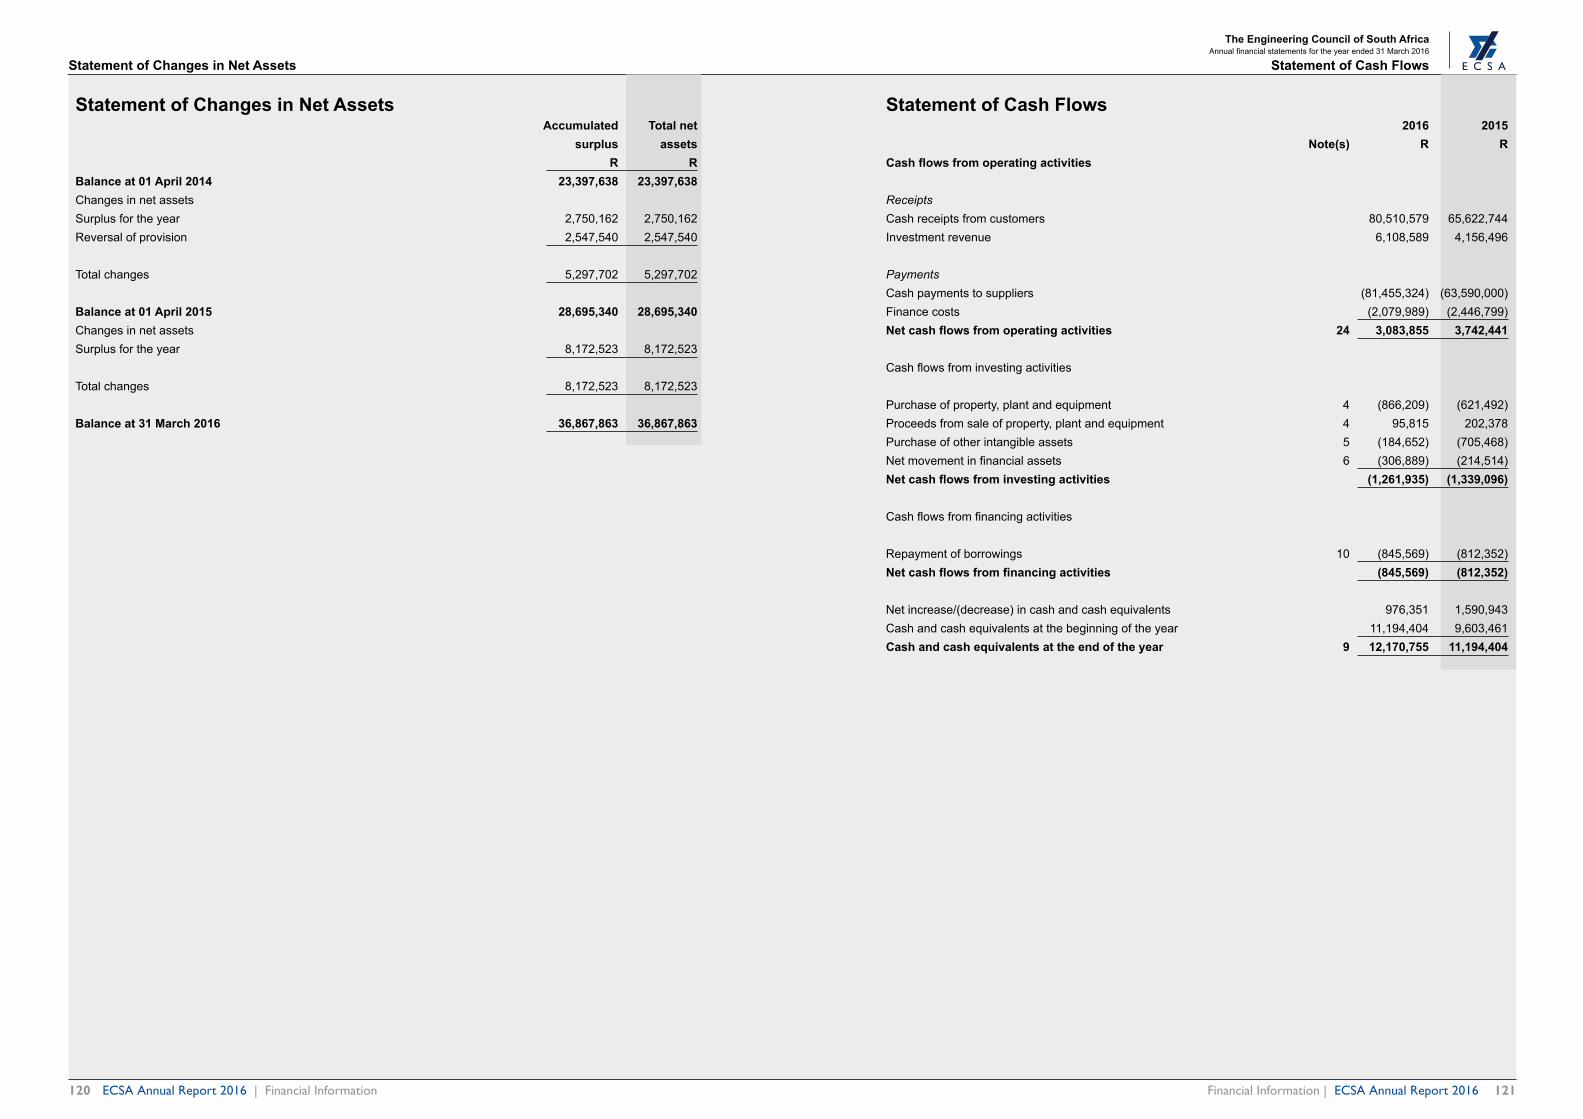
Financial Information | ECSA Annual Report 2016ECSA Annual Report 2016 | Financial Information120 121
The Engineering Council of South AfricaAnnualfinancialstatementsfortheyearended31March2016
Statement of Changes in Net Assets
The Engineering Council of South AfricaAnnualfinancialstatementsfortheyearended31March2016
Statement of Cash Flows
Statement of Cash Flows 2016 2015 Note(s) R RCash flows from operating activities
ReceiptsCash receipts from customers 80,510,579 65,622,744Investment revenue 6,108,589 4,156,496
PaymentsCash payments to suppliers (81,455,324) (63,590,000)Finance costs (2,079,989) (2,446,799)Net cash flows from operating activities 24 3,083,855 3,742,441
Cashflowsfrominvestingactivities
Purchase of property, plant and equipment 4 (866,209) (621,492)Proceeds from sale of property, plant and equipment 4 95,815 202,378Purchase of other intangible assets 5 (184,652) (705,468)Netmovementinfinancialassets 6 (306,889) (214,514)Net cash flows from investing activities (1,261,935) (1,339,096)
Cashflowsfromfinancingactivities
Repayment of borrowings 10 (845,569) (812,352)Net cash flows from financing activities (845,569) (812,352)
Net increase/(decrease) in cash and cash equivalents 976,351 1,590,943Cash and cash equivalents at the beginning of the year 11,194,404 9,603,461Cash and cash equivalents at the end of the year 9 12,170,755 11,194,404
Statement of Changes in Net Assets Accumulated Total net surplus assets R RBalance at 01 April 2014 23,397,638 23,397,638Changes in net assetsSurplus for the year 2,750,162 2,750,162Reversal of provision 2,547,540 2,547,540
Total changes 5,297,702 5,297,702
Balance at 01 April 2015 28,695,340 28,695,340Changes in net assetsSurplus for the year 8,172,523 8,172,523
Total changes 8,172,523 8,172,523
Balance at 31 March 2016 36,867,863 36,867,863

Financial Information | ECSA Annual Report 2016ECSA Annual Report 2016 | Financial Information122 123
The Engineering Council of South AfricaAnnual financial statements for the year ended 31 March 2016
Notes to the financial statements
The Engineering Council of South AfricaAnnualfinancialstatementsfortheyearended31March2016
Statement of Comparison of Budget and Actual Amounts
1. Presentation of Annual Financial Statements
Theannualfinancialstatementshavebeenprepared inaccordancewith theSouthAfricanStandardsofGenerallyRecognised Accounting Practice (GRAP) including any interpretations, guidelines and directives issued by the Accounting Standards Board in accordance with Section 91(1) of the Public Finance Management Act (Act 1 of 1999).
Theseannual financial statements havebeenpreparedonanaccrual basis of accounting andare in accordancewithhistoricalcostconventionasthebasisofmeasurement,unlessspecifiedotherwise.TheyarepresentedinSouthAfrican Rands.
1.1 Changes to accounting policy
The useful life of Furniture and Fixtures and Intangible Assets have been reviewed.
The changes are:
Furniture and Fixtures reviewed to 10 years (2015: 6 years) and; Intangible Assets reviewed to 5 years (2015: 3 years).
1.2 Significant judgements and sources of estimation uncertainty
Inpreparingtheannualfinancialstatements,managementisrequiredtomakeestimatesandassumptionsthataffecttheamountsrepresentedintheannualfinancialstatementsandrelateddisclosures.Useofavailableinformationandtheapplicationofjudgementisinherentintheformationofestimates.Actualresultsinthefuturecoulddifferfromtheseestimateswhichmaybematerialtotheannualfinancialstatements.Significantjudgementsinclude:
Trade receivables, loans and other receivables
The Council assesses its trade receivables, loans and other receivables for impairment where there are possible indicators for impairment. In determiningwhether an impairment loss should be recorded in surplusor deficit, theCouncil makes judgements as to whether there is observable data indicating a measurable decrease in the estimated futurecashflowsfromafinancialasset.
The impairment for trade receivables, loans and other receivables is calculated on a portfolio basis, based on historical lossratios,adjustedfornationalandindustry-specificeconomicconditionsandotherindicatorspresentatthereportingdate that correlate with defaults on the portfolio. These annual loss ratios are applied to loan balances in the portfolio and scaled to the estimated loss emergence period.
Post retirement benefits
The present value of the post retirement obligation depends on a number of factors that are determined on an actuarial basis using a number of assumptions. The assumptions used in determining the net cost (income) include the discountrate. Any changes in these assumptions will impact on the carrying amount of post retirement obligations.
The Council determines the appropriate discount rate at the end of each year. This is the interest rate that should be usedtodeterminethepresentvalueofestimatedfuturecashoutflowsexpectedtoberequiredtosettlethepensionobligations. In determining the appropriate discount rate, the Council considers the interest rates of high-quality corporatebondsthataredenominatedinthecurrencyinwhichthebenefitswillbepaid,andthathavetermstomaturityapproximating the terms of the related pension liability.
Other key assumptions for pension obligations are based on current market conditions. The assumptions used are consistent with assumptions used in the statutory valuation. However, GRAP 25 requires the valuation to be carried out onaprescribedmarketvaluebasisandanumberoftheassumptionsthereforedifferfromthoseusedinthestatutoryvaluation.Valuationrateofinterest–GRAP25requiresratestobedeterminedbyreferencetothecurrentmarketyieldof government bonds. The bulk of the liabilities have a short term, whilst one remaining pensioner has a potentiallyvery long remaining outstanding term.
Allowance for doubtful debts
An impairment loss is recognised in surplus and deficit when there is objective evidence that it is impaired. Theimpairmentismeasuredasthedifferencebetweenthedebtorscarryingamountandthepresentvalueofestimatedfuturecashflowsdiscountedattheeffectiveinterestrate,computedatinitialrecognition.
Statement of Comparison of Budget and Actual AmountsBudget on Cash Basis Approved Adjustments FinalBudget Actual Difference budget amountson betweenfinal comparable budget and basis actual R R R R RStatement of Financial PerformanceRevenue
Revenue from exchange transactions
Accreditation visits 1,190,300 - 1,190,300 1,516,568 326,268Third party contributions 1,190,000 - 1,190,000 1,220,245 30,245Bad debts recovered 100,000 - 100,000 301,815 201,815Disciplinaryfines 25,000 - 25,000 130,000 105,000Appeals - - - 8,798 8,798Other income 63,000 - 63,000 156,261 93,261Profitonsaleoffixedassets 10,000 - 10,000 (2,053) (12,053)Total revenue from exchange transactions 2,578,300 - 2,578,300 3,331,634 753,334
Revenue from non-exchange transactionsAnnual fees 63,473,108 - 63,473,108 68,089,274 4,616,166Application fees 9,965,401 - 9,965,401 10,128,873 163,472Total revenue from non-exchange 73,438,509 - 73,438,509 78,218,147 4,779,638transactions
Total revenue 76,016,809 - 76,016,809 81,549,781 5,532,972
ExpenditurePersonnel (36,918,332) 749,283 (36,169,049) (34,737,844) 1,431,205Depreciation and amortisation - - - (982,427) (982,427)Finance costs (114,061) - (114,061) (2,079,989) (1,965,928)Lease rentals on operating lease (559,959) - (559,959) (425,583) 134,376Debt impairment provision - - - (11,755,105) (11,755,105)Repairs and maintenance (2,719,000) - (2,719,000) (2,070,997) 648,003General Expenses (36,626,748) (749,283) (37,376,031) (32,229,377) 5,146,654Total expenditure (76,938,100) - (76,938,100) (84,281,322) (7,343,222)Operatingdeficit (921,291) - (921,291) (2,731,541) (1,810,250)Investment revenue 1,050,000 - 1,050,000 6,108,589 5,058,589Fair value adjustments - - - 108,475 108,475Actuarial gains/losses - - - 4,687,000 4,687,000 1,050,000 - 1,050,000 10,904,064 9,854,064
Actual Amount on Comparable Basis as 128,709 - 128,709 8,172,523 8,043,814Presented in the Budget and ActualComparative Statement
Pleaserefertonote29forexplanationsonmaterialdifferences.

Financial Information | ECSA Annual Report 2016ECSA Annual Report 2016 | Financial Information124 125
The Engineering Council of South AfricaAnnualfinancialstatementsfortheyearended31March2016
Notes to the financial statements
The Engineering Council of South AfricaAnnualfinancialstatementsfortheyearended31March2016
Notes to the financial statements
1.4 Intangible assets
Anassetisidentifiedasanintangibleassetwhenit:
• iscapableofbeingseparatedordivided fromanentityandsold, transferred, licensed, rentedorexchanged,either individually or together with a related contract, assets or liability; or
• arisesfromcontractualrightsorotherlegalrights,regardlesswhetherthoserightsaretransferableorseparatefrom the entity or from other rights and obligations.
Intangible assets are initially recognised at cost.
Where an intangible asset is acquired through a non-exchange transaction, its initial cost at the date of acquisition is measured at its fair value as at that date.
Expenditure on research (or on the research phase of an internal project) is recognised as an expense when it is incurred.
An intangible asset arising from development (or from the development phase of an internal project) is recognised when::• itistechnicallyfeasibletocompletetheassetsothatitwillbeavailableforuseorsale;• thereisanintentiontocompleteanduseorsellit;• thereisanabilitytouseorsellit;• itwillgenerateprobablefutureeconomicbenefitsorservicepotential;• thereareavailabletechnical,financialandotherresourcestocompletethedevelopmentandtouseorsellthe
asset; and• theexpenditureattributabletotheassetduringitsdevelopmentcanbemeasuredreliably.
Intangible assets are carried at cost less any accumulated amortisation and any impairment losses.
An intangible asset is regarded as having an indefinite useful life when, based on all relevant factors, there isnoforeseeablelimittotheperiodoverwhichtheassetisexpectedtogeneratenetcashinflowsorservicepotential.Amortisation is not provided for these intangible assets, but they are tested for impairment annually and whenever there is an indication that the asset may be impaired. For all other intangible assets amortisation is provided on a straight line basis over their useful life.
The amortisation period and the amortisation method for intangible assets are reviewed at each reporting date. Duringthe year the Council changed its accounting estimate with respect to the useful life of Intangible Assets. The useful lifewasamendedfromthreetofiveyears.
Reassessingtheusefullifeofanintangibleassetwithafiniteusefullifeafteritwasclassifiedasindefiniteisanindicatorthat the asset may be impaired. As a result the asset is tested for impairment and the remaining carrying amount is amortised over its useful life.
Internally generated brands, mastheads, publishing titles, customer lists and items similar in substance are not recognised as intangible assets. Amortisation is provided to write down the intangible assets, on a straight line basis, to their residual values as follows:
Item Useful lifeRegistration system 5 yearsAccounting system 5 years
Intangible assets are derecognised:• ondisposal;or• whennofutureeconomicbenefitsorservicepotentialareexpectedfromitsuseordisposal.
Thegainorlossisthedifferencebetweenthenetdisposalproceeds,ifany,andthecarryingamount.Itisrecognisedinsurplusordeficitwhentheassetisderecognised.
1.3 Property, plant and equipment
Property, plant and equipment are tangible non-current assets that are held for use in the production or supply of goods or services, rental to others, or for administrative purposes, and are expected to be used during more than oneperiod.
The cost of an item of property, plant and equipment is recognised as an asset when:
• itisprobablethatfutureeconomicbenefitsorservicepotentialassociatedwiththeitemwillflowtotheentity;and• thecostoftheitemcanbemeasuredreliably.
Property, plant and equipment is initially measured at cost.
Costs include costs incurred initially to acquire or construct an item of property, plant and equipment and costs incurred subsequently to add to, replace part of, or service it. If a replacement cost is recognised in the carrying amount of an item of property, plant and equipment, the carrying amount of the replaced part is derecognised. All other repairs andmaintenancearechargedtothestatementoffinancialperformanceduringthefinancialperiodinwhichtheyareincurred.
Property, plant and equipment are depreciated on the straight line basis over their expected useful lives to their estimated residual value.
Property, plant and equipment is carried at cost less accumulated depreciation and any impairment losses. Property, plant and equipment is tested for impairment on an annual basis.
The useful lives of items of property, plant and equipment have been assessed as follows:
Item Depreciation method Average useful lifeBuildings Straight line 50 yearsFurnitureandfixtures Straightline 10yearsMotor vehicles Straight line 5 yearsOfficeequipment Straightline 5yearsComputer equipment Straight line 3 yearsImprovements to property Straight line 10 years
The residual values, the useful lives and depreciation methods of assets are reviewed at the end of each reporting date. Iftheexpectationsdifferfrompreviousestimates,thechangeisaccountedforasachangeinaccountingestimate.During the year the Council changed its accounting estimate with regards to the average useful life of Furniture and Fixtures. The useful life was adjusted from six to ten years. It was furthermore decided that, should the useful life of individual Furniture and Fittings and Motor Vehicles were to exceed its average useful life, a residual value of 10% would be retained for those items.
Eachpartofanitemofproperty,plantandequipmentwithacostthatissignificantinrelationtothetotalcostoftheitemis depreciated separately.
Thedepreciationchargeforeachperiodisrecognisedinsurplusordeficitunlessitisincludedinthecarryingamountof another asset.
Property, plant and equipment is assessed for impairment when there are indicators of impairment.
The gain or loss arising from the derecognition of an item of property, plant and equipment is included in surplus or deficitwhentheitemisderecognised.Thegainorlossarisingfromthederecognitionofanitemofproperty,plantandequipmentisdeterminedasthedifferencebetweenthenetdisposalproceeds,ifany,andthecarryingamountoftheitem.Anasset’scarryingamountiswrittendownimmediatelytoitsrecoverableamountiftheasset’scarryingamountis greater than its estimated recoverable amount.

Financial Information | ECSA Annual Report 2016ECSA Annual Report 2016 | Financial Information126 127
The Engineering Council of South AfricaAnnual financial statements for the year ended 31 March 2016
Notes to the financial statements
1.5 Financial instruments (continued)`Class Category
Cash and cash equivalents Financial asset measured at amortised costTrade and other receivables Financial asset measured at amortised costInvestments Financial asset measured at fair value
Theentityhasthefollowingtypesoffinancialliabilities(classesandcategory)asreflectedonthefaceofthestatementoffinancialpositionorinthenotesthereto:`Class Category
Trade and other payables Financial liability measured at amortised costBorrowings Financial liability measured at amortised cost
Initial recognition
The entity recognises a financial asset or a financial liability in its statement of financial position when the entitybecomes a party to the contractual provisions of the instrument.
Theentityrecognisesfinancialassetsusingtradedateaccounting.
Initial measurement of financial assets and financial liabilities
Theentitymeasuresafinancialassetandfinancialliabilityinitiallyatitsfairvalueplustransactioncoststhataredirectlyattributabletotheacquisitionorissueofthefinancialassetorfinancialliability.
Subsequent measurement of financial assets and financial liabilities
Theentitymeasuresallfinancialassetsandfinancialliabilitiesafterinitialrecognitionusingthefollowingcategories:
• Financialinstrumentsatfairvalue.• Financialinstrumentsatamortisedcost.
Allfinancialassetsmeasuredatamortisedcost,orcost,aresubjecttoanimpairmentreview.
Fair value measurement considerations
Thebestevidenceof fairvalue isquotedprices inanactivemarket. If themarket forafinancial instrument isnotactive, the entity establishes fair value by using a valuation technique. The objective of using a valuation technique is to establishwhatthetransactionpricewouldhavebeenonthemeasurementdateinanarm’slengthexchangemotivatedbynormaloperatingconsiderations.Valuationtechniquesincludeusingrecentarm’slengthmarkettransactionsbetweenknowledgeable, willing parties, if available, reference to the current fair value of another instrument that is substantially thesame,discountedcashflowanalysisandoptionpricingmodels.Ifthereisavaluationtechniquecommonlyusedby market participants to price the instrument and that technique has been demonstrated to provide reliable estimates of prices obtained in actual market transactions, the entity uses that technique. The chosen valuation technique makes maximumuseofmarketinputsandreliesaslittleaspossibleonentity-specificinputs.Itincorporatesallfactorsthatmarket participants would consider in setting a price and is consistent with accepted economic methodologies for pricing financialinstruments.Periodically,anentitycalibratesthevaluationtechniqueandtestsitforvalidityusingpricesfromanyobservablecurrentmarkettransactionsinthesameinstrument(i.e.withoutmodificationorrepackaging)orbasedon any available observable market data.
Reclassification
Theentitydoesnotreclassifyafinancialinstrumentwhileitisissuedorheldunlessitis:
• combinedinstrumentthatisrequiredtobemeasuredatfairvalue;or• aninvestmentinaresidualinterestthatmeetstherequirementsforreclassification.
1.5 Financial instruments
Afinancialinstrumentisanycontractthatgivesrisetoafinancialassetofoneentityandafinancialliabilityoraresidualinterest of another entity.
The amortised cost of a financial asset or financial liability is the amount atwhich the financial asset or financialliability is measured at initial recognition minus principal repayments, plus or minus the cumulative amortisation using theeffectiveinterestmethodofanydifferencebetweenthat initialamountandthematurityamount,andminusanyreduction (directly or through the use of an allowance account) for impairment or uncollectibility.
Creditriskistheriskthatonepartytoafinancialinstrumentwillcauseafinanciallossfortheotherpartybyfailingtodischarge an obligation.
Derecognitionistheremovalofapreviouslyrecognisedfinancialassetorfinancialliabilityfromanentity’sstatementoffinancialposition.
Theeffectiveinterestmethodisamethodofcalculatingtheamortisedcostofafinancialassetorafinancialliability(orgroupoffinancialassetsorfinancialliabilities)andofallocatingtheinterestincomeorinterestexpenseovertherelevantperiod.Theeffectiveinterestrateistheratethatexactlydiscountsestimatedfuturecashpaymentsorreceiptsthroughtheexpectedlifeofthefinancialinstrumentor,whenappropriate,ashorterperiodtothenetcarryingamountofthefinancialassetorfinancialliability.Whencalculatingtheeffectiveinterestrate,anentityshallestimatecashflowsconsideringallcontractual termsof thefinancial instrument (forexample,prepayment,callandsimilaroptions)butshall not consider future credit losses. The calculation includes all fees and points paid or received between parties to thecontract thatarean integralpartof theeffective interest rate (see theStandardofGRAPonRevenue fromExchange Transactions), transaction costs, and all other premiums or discounts. There is a presumption that the cash flowsandtheexpectedlifeofagroupofsimilarfinancialinstrumentscanbeestimatedreliably.However,inthoserarecaseswhenitisnotpossibletoreliablyestimatethecashflowsortheexpectedlifeofafinancialinstrument(orgroupoffinancialinstruments),theentityshallusethecontractualcashflowsoverthefullcontractualtermofthefinancialinstrument(orgroupoffinancialinstruments).
Fair value is the amount for which an asset could be exchanged, or a liability settled, between knowledgeable willing partiesinanarm’slengthtransaction.
Afinancialassetis:
• cash;• aresidualinterestofanotherentity;or• acontractualrightto: - receivecashoranotherfinancialassetfromanotherentity;or - exchangefinancialassetsorfinancialliabilitieswithanotherentityunderconditionsthatarefavourableto
the entity.
Afinancialliabilityisanyliabilitythatisacontractualobligationto:
• delivercashoranotherfinancialassettoanotherentity;or• exchangefinancialassetsorfinancialliabilitiesunderconditionsthatarepotentiallyunfavourabletotheentity.
Interestrateriskistheriskthatthefairvalueorfuturecashflowsofafinancial instrumentwillfluctuatebecauseofchanges in market interest rates.
Liquidityriskistheriskencounteredbyanentityintheeventofdifficultyinmeetingobligationsassociatedwithfinancialliabilitiesthataresettledbydeliveringcashoranotherfinancialasset.
Loanspayablearefinancialliabilities,otherthanshort-termpayablesonnormalcreditterms.
Marketriskistheriskthatthefairvalueorfuturecashflowsofafinancialinstrumentwillfluctuatebecauseofchangesin market prices. Market risk comprises three types of risk: currency risk, interest rate risk and other price risk.
Classification
Theentityhasthefollowingtypesoffinancialassets(classesandcategory)asreflectedonthefaceofthestatementoffinancialpositionorinthenotesthereto:
The Engineering Council of South AfricaAnnualfinancialstatementsfortheyearended31March2016
Notes to the financial statements

Financial Information | ECSA Annual Report 2016ECSA Annual Report 2016 | Financial Information128 129
The Engineering Council of South AfricaAnnual financial statements for the year ended 31 March 2016
Notes to the financial statements
1.5 Financial instruments (continued)
Ifthetransferredassetispartofalargerfinancialassetandtheparttransferredqualifiesforderecognitioninitsentirety,thepreviouscarryingamountofthelargerfinancialassetisallocatedbetweenthepartthatcontinuestoberecognisedand the part that is derecognised, based on the relative fair values of those parts, on the date of the transfer. For this purpose,aretainedservicingassetistreatedasapartthatcontinuestoberecognised.Thedifferencebetweenthecarrying amount allocated to the part derecognised and the sum of the consideration received for the part derecognised isrecognisedinsurplusordeficit.
If a transfer does not result in derecognition because the entity has retained substantially all the risks and rewards of ownership of the transferred asset, the entity continue to recognise the transferred asset in its entirety and recognise afinancial liability for theconsideration received. Insubsequentperiods, theentity recognisesany revenueon thetransferredassetandanyexpenseincurredonthefinancialliability.Neithertheasset,andtheassociatedliabilitynortherevenue,andtheassociatedexpensesareoffset.
Financial liabilities
Theentityremovesafinancialliability(orapartofafinancialliability)fromitsstatementoffinancialpositionwhenitisextinguishedi.e.whentheobligationspecifiedinthecontractisdischarged,cancelled,expiresorwaived.
Anexchangebetweenanexistingborrowerandlenderofdebtinstrumentswithsubstantiallydifferenttermsisaccountedforashavingextinguishedtheoriginalfinancialliabilityandanewfinancialliabilityisrecognised.Similarly,asubstantialmodificationof the termsofanexistingfinancial liabilityorapartof it isaccounted forashavingextinguished theoriginalfinancialliabilityandhavingrecognisedanewfinancialliability.
The difference between the carrying amount of a financial liability (or part of a financial liability) extinguished ortransferred to another party and the consideration paid, including any non-cash assets transferred or liabilities assumed, isrecognisedinsurplusordeficit.Anyliabilitiesthatarewaived,forgivenorassumedbyanotherentitybywayofanon-exchange transaction are accounted for in accordance with the South African Standard of GRAP on Revenue from Non-exchange Transactions (Taxes and Transfers).
1.6 Leases
Aleaseisclassifiedasafinanceleaseif it transferssubstantiallyall therisksandrewardsincidental toownership.Aleaseisclassifiedasanoperatingleaseif itdoesnottransfersubstantiallyall therisksandrewardsincidentaltoownership.
Whenaleaseincludesbothlandandbuildingselements,theentityassessestheclassificationofeachelementseparately.
Operating leases - lessor
Operatingleaserevenueisrecognisedasrevenueonastraight-linebasisovertheleaseterm.Thedifferencebetweenthe amounts recognised as an income and the contractual receipts are recognised as an operating lease liability. This liability is not discounted.
Initial direct costs incurred in negotiating and arranging operating leases are added to the carrying amount of the leased asset and recognised as an expense over the lease term on the same basis as the lease revenue.
Income for leases is disclosed under Other Income in the Statement of Financial Performance.
Operating leases - lessee
Operatingleasepaymentsarerecognisedasanexpenseonastraight-linebasisovertheleaseterm.Thedifferencebetween the amounts recognised as an expense and the contractual payments are recognised as an operating lease asset or liability.
Any contingent rents are expensed in the period they are incurred.
1.7 Employee benefits
Employeebenefitsareallformsofconsiderationgivenbyanentityinexchangeforservicerenderedbyemployees.
1.5 Financial instruments (continued)
If fair value can no longer be measured reliably for an investment in a residual interest measured at fair value, the entity reclassifiestheinvestmentfromfairvaluetocost.Thecarryingamountatthedatethatfairvalueisnolongeravailablebecomes the cost.
If a reliable measure becomes available for an investment in a residual interest for which a measure was previously notavailable, and the instrument would have been required to be measured at fair value, the entity reclassifies theinstrument from cost to fair value.
Gains and losses
Againorlossarisingfromachangeinthefairvalueofafinancialassetorfinancialliabilitymeasuredatfairvalueisrecognisedinsurplusordeficit.
Forfinancialassetsandfinancialliabilitiesmeasuredatamortisedcostorcost,againorlossisrecognisedinsurplusordeficitwhenthefinancialassetorfinancialliabilityisderecognisedorimpaired,orthroughtheamortisationprocess.
Impairment and uncollectibility of financial assets
Theentityassessattheendofeachreportingperiodwhetherthereisanyobjectiveevidencethatafinancialassetorgroupoffinancialassetsisimpaired.
Financial assets measured at amortised cost:
Ifthereisobjectiveevidencethatanimpairmentlossonfinancialassetsmeasuredatamortisedcosthasbeenincurred,theamountofthelossismeasuredasthedifferencebetweentheasset’scarryingamountandthepresentvalueofestimated futurecashflows(excluding futurecredit losses thathavenotbeen incurred)discountedat thefinancialasset’soriginaleffectiveinterestrate.Thecarryingamountoftheassetisreduceddirectlyorthroughtheuseofanallowanceaccount.Theamountofthelossisrecognisedinsurplusordeficit.
If, in a subsequent period, the amount of the impairment loss decreases and the decrease can be related objectively toan event occurring after the impairment was recognised, the previously recognised impairment loss is reversed directlyorbyadjustinganallowanceaccount.Thereversaldoesnot result inacarryingamountof thefinancialasset thatexceeds what the amortised cost would have been had the impairment not been recognised at the date the impairmentisreversed.Theamountofthereversalisrecognisedinsurplusordeficit.
Derecognition
Financial assets
Theentityderecognisesfinancialassetsusingtradedateaccounting.
Theentityderecognisesafinancialassetonlywhen:
• thecontractualrightstothecashflowsfromthefinancialassetexpire,aresettledorwaived;• theentitytransferstoanotherpartysubstantiallyalloftherisksandrewardsofownershipofthefinancialasset;or• theentity,despitehavingretainedsomesignificantrisksandrewardsofownershipof thefinancialasset,has
transferred control of the asset to another party and the other party has the practical ability to sell the asset in its entirety to an unrelated third party, and is able to exercise that ability unilaterally and without needing to impose additional restrictions on the transfer. In this case, the entity :
- derecognises the asset; and - recognises separately any rights and obligations created or retained in the transfer.
The carrying amounts of the transferred asset are allocated between the rights or obligations retained and those transferred on the basis of their relative fair values at the transfer date. Newly created rights and obligations are measured at their fair values at that date. Any difference between the consideration received and the amountsrecognisedandderecognisedisrecognisedinsurplusordeficitintheperiodofthetransfer.
Onderecognitionofafinancialasset in itsentirety,thedifferencebetweenthecarryingamountandthesumoftheconsiderationreceivedisrecognisedinsurplusordeficit.
The Engineering Council of South AfricaAnnualfinancialstatementsfortheyearended31March2016
Notes to the financial statements

Financial Information | ECSA Annual Report 2016ECSA Annual Report 2016 | Financial Information130 131
The Engineering Council of South AfricaAnnual financial statements for the year ended 31 March 2016
Notes to the financial statements
1.7 Employee benefits (continued)
Current servicecost is the increase in thepresent valueof thedefinedbenefitobligation resulting fromemployeeservice in the current period.
Interestcostistheincreaseduringaperiodinthepresentvalueofadefinedbenefitobligationwhicharisesbecausethebenefitsareoneperiodclosertosettlement.
Pastservicecost is thechange in thepresentvalueof thedefinedbenefitobligation foremployeeservice inpriorperiods, resulting in the current period from the introduction of, or changes to, post-employment benefits or otherlongtermemployeebenefits.Pastservicecostmaybeeitherpositive(whenbenefitsare introducedorchangedsothatthepresentvalueofthedefinedbenefitobligationincreases)ornegative(whenexistingbenefitsarechangedsothatthepresentvalueofthedefinedbenefitobligationdecreases).Inmeasuringitsdefinedbenefitliabilitytheentityrecognises past service cost as an expense in the reporting period in which the plan is amended.
Planassetscompriseassetsheldbyalong-termemployeebenefitfundandqualifyinginsurancepolicies.
Thepresentvalueofadefinedbenefitobligationisthepresentvalue,withoutdeductinganyplanassets,ofexpectedfuture payments required to settle the obligation resulting from employee service in the current and prior periods.
The return on plan assets is interest, dividends or similar distributions and other revenue derived from the plan assets, together with realised and unrealised gains or losses on the plan assets, less any costs of administering the plan (other than those included in theactuarialassumptionsused tomeasure thedefinedbenefitobligation)and lessany taxpayable by the plan itself.
Theamountrecognisedasadefinedbenefitliabilityisthenettotalofthefollowingamounts:
• thepresentvalueofthedefinedbenefitobligationatthereportingdate;• minusthefairvalueatthereportingdateofplanassets(ifany)outofwhichtheobligationsaretobesettleddirectly;• plusanyliabilitythatmayariseasaresultofaminimumfundingrequirement
Theamountdeterminedasadefinedbenefitliabilitymaybenegative(anasset).Theentitymeasuretheresultingassetat the lower of:
• theamountdeterminedabove;and• thepresentvalueofanyeconomicbenefitsavailableintheformofrefundsfromtheplanorreductionsinfuture
contributionstotheplan.Thepresentvalueoftheseeconomicbenefitsisdeterminedusingadiscountratewhichreflectsthetimevalueofmoney.
Anyadjustmentsarisingfromthelimitaboveisrecognisedinsurplusordeficit.
Theentitydeterminethepresentvalueofdefinedbenefitobligationsandthefairvalueofanyplanassetswithsufficientregularitysuchthattheamountsrecognisedintheannualfinancialstatementsdonotdiffermateriallyfromtheamountsthat would be determined at the reporting date.
Theentity recognises thenet totalof the followingamounts insurplusordeficit,except to theextent thatanotherStandard requires or permits their inclusion in the cost of an asset:
• currentservicecost;• interestcost;• theexpectedreturnonanyplanassetsandonanyreimbursementrights;• actuarialgainsandlosses;• pastservicecost;• theeffectofanycurtailmentsorsettlements;and• theeffectofapplyingthelimitonadefinedbenefitasset(negativedefinedbenefitliability).
TheentityusestheProjectedUnitCreditMethodtodeterminethepresentvalueofitsdefinedbenefitobligationsandthe related current service cost and, where applicable, past service cost. The Projected Unit Credit Method (sometimes knownastheaccruedbenefitmethodpro-ratedonserviceorasthebenefit/yearsofservicemethod)seeseachperiodofserviceasgivingrisetoanadditionalunitofbenefitentitlementandmeasureseachunitseparatelytobuildupthefinalobligation.
1.7 Employee benefits (continued)
Other long-term employee benefits are employee benefits (other than post-employment benefits and terminationbenefits)thatarenotduetobesettledwithintwelvemonthsaftertheendoftheperiodinwhichtheemployeesrenderthe related service.
Short-term employee benefits
Short-termemployeebenefitsareemployeebenefits(otherthanterminationbenefits)thatareduetobesettledwithintwelve months after the end of the period in which the employees render the related service. Short-term employee benefitsincludeitemssuchas:
• wages,salariesandsocialsecuritycontributions;• short-termcompensatedabsences (suchaspaidannual leaveandpaidsick leave)where thecompensation
for the absences is due to be settled within twelve months after the end of the reporting period in which the employees render the related employee service;
• bonus,incentiveandperformancerelatedpaymentspayablewithintwelvemonthsaftertheendofthereportingperiod in which the employees render the related service; and
• non-monetarybenefits(forexample,medicalcare,andfreeorsubsidisedgoodsorservicessuchashousing,cars and cellphones) for current employees.
When an employee has rendered service to the entity during a reporting period, the entity recognise the undiscounted amountofshort-termemployeebenefitsexpectedtobepaidinexchangeforthatservice:
• asaliability(accruedexpense),afterdeductinganyamountalreadypaid.Iftheamountalreadypaidexceedstheundiscountedamountofthebenefits,theentityrecognisethatexcessasanasset(prepaidexpense)totheextentthat the prepayment will lead to, for example, a reduction in future payments or a cash refund; and
• asanexpense,unlessanotherStandardrequiresorpermitstheinclusionofthebenefitsinthecostofanasset.
The entity recognises the expected cost of bonus, incentive and performance related payments when the entity has a present legal or constructive obligation to make such payments as a result of past events and a reliable estimate of the obligation can be made. A present obligation exists when the entity has no realistic alternative but to make the payments.
Post-employment benefits: Defined benefit plans
Post-employment benefits are employee benefits (other than termination benefits) which are payable after thecompletion of employment.
Post-employmentbenefitplansareformalorinformalarrangementsunderwhichanentityprovidespost-employmentbenefitsforoneormoreemployees.
Definedbenefitplansarepost-employmentbenefitplansotherthandefinedcontributionplans.
Actuarialgainsandlossescompriseexperienceadjustments(theeffectsofdifferencesbetweenthepreviousactuarialassumptionsandwhathasactuallyoccurred)andtheeffectsofchangesinactuarialassumptions.Inmeasuringitsdefinedbenefit liability theentityrecogniseactuarialgainsand losses insurplusordeficit in thereportingperiod inwhich they occur.
Assetsheldbyalong-termemployeebenefitfundareassets(otherthannon-transferablefinancialinstrumentsissuedby the reporting entity) that are held by an entity (a fund) that is legally separate from the reporting entity and exists solelytopayorfundemployeebenefitsandareavailabletobeusedonlytopayorfundemployeebenefits,arenotavailable to thereportingentity’sowncreditors(even in liquidation),andcannotbereturnedto thereportingentity,unless either:
• theremainingassetsofthefundaresufficienttomeetalltherelatedemployeebenefitobligationsoftheplanorthe reporting entity; or
• theassetsarereturnedtothereportingentitytoreimburseitforemployeebenefitsalreadypaid.
The Engineering Council of South AfricaAnnualfinancialstatementsfortheyearended31March2016
Notes to the financial statements

Financial Information | ECSA Annual Report 2016ECSA Annual Report 2016 | Financial Information132 133
The Engineering Council of South AfricaAnnual financial statements for the year ended 31 March 2016
Notes to the financial statements
1.9 Revenue
Revenueisthegrossinflowofeconomicbenefitsorservicepotentialduringthereportingperiodwhenthoseinflowsresult in an increase in net assets, other than increases relating to contributions from owners.
Conditionson transferredassetsarestipulations thatspecify that the futureeconomicbenefitsorservicepotentialembodiedintheassetisrequiredtobeconsumedbytherecipientasspecifiedorfutureeconomicbenefitsorservicepotential must be returned to the transferor.
Controlofanassetarisewhentheentitycanuseorotherwisebenefitfromtheassetinpursuitofitsobjectivesandcanexcludeorotherwiseregulatetheaccessofotherstothatbenefit.
Fee income consists of annual fees, applications fees and accreditations of universities.
Professional fees are payable by members who are in the Professional or Registered categories.
Feeincomeisrecordedinthefinancialstatementsintheperiodtowhichitrelates.
CandidatefeesarepayablebymemberswhoarenotyetqualifiedProfessionalorRegisteredpersons.
Applicationfeesareonce-offfeespayableonsubmissionofanapplicationform.Thesefeesaretocompensateforthecosts incurred during the evaluation process and are recognised when received.
1.10 Revenue from exchange transactions
Revenue is measured at the fair value of the consideration received or receivable, net of trade discounts and volume rebates.
An exchange transaction is one in which the entity receives assets or services, or has liabilities extinguished, and directly gives approximately equal value (primarily in the form of goods, services or use of assets) to the other party in exchange.
Fair value is the amount for which an asset could be exchanged, or a liability settled, between knowledgeable, willing partiesinanarm’slengthtransaction.
Accreditation visit revenue is recognised as revenue from exchange transactions.
Interest
Revenue arising from the use by others of entity assets yielding interest, royalties and dividends or similar distributions is recognised when:
• Itisprobablethattheeconomicbenefitsorservicepotentialassociatedwiththetransactionwillflowtotheentityand• Theamountoftherevenuecanbemeasuredreliably.
Interestisrecognised,insurplusordeficit,usingtheeffectiveinterestratemethod.
1.11 Revenue from non-exchange transactions
Non-exchange transactions are transactions that are not exchange transactions. In a non-exchange transaction, an entity either receives value from another entity without directly giving approximately equal value in exchange, or gives value to another entity without directly receiving approximately equal value in exchange.
Transfersareinflowsoffutureeconomicbenefitsorservicepotentialfromnon-exchangetransactions,otherthantaxes.
Application and annual fees are recognised as revenue from non-exchange transactions.
Recognition
Aninflowofresourcesfromanon-exchangetransactionrecognisedasanassetisrecognisedasrevenue,excepttotheextentthataliabilityisalsorecognisedinrespectofthesameinflow.
1.7 Employee benefits (continued)
Indetermining thepresent valueof itsdefinedbenefitobligationsand the related current service costand,whereapplicable,pastservicecost,anentityshallattributebenefit toperiodsofserviceunder theplan’sbenefit formula.However,ifanemployee’sserviceinlateryearswillleadtoamateriallyhigherlevelofbenefitthaninearlieryears,anentityshallattributebenefitonastraight-linebasisfrom:
• thedatewhenservicebytheemployeefirst leadstobenefitsunder theplan(whetherornot thebenefitsareconditional on further service); until
• thedatewhenfurtherservicebytheemployeewillleadtonomaterialamountoffurtherbenefitsundertheplan,other than from further salary increases.
Actuarial valuations are conducted on an annual basis by independent actuaries separately for each plan. The results of the valuation are updated for any material transactions and other material changes in circumstances (including changes in market prices and interest rates) up to the reporting date.
Actuarial assumptions
Actuarial assumptions are unbiased and mutually compatible.
Financial assumptions are based on market expectations, at the reporting date, for the period over which the obligations are to be settled.
Therateusedtodiscountpost-employmentbenefitobligations(bothfundedandunfunded)reflectthetimevalueofmoney.Thecurrencyandtermofthefinancialinstrumentselectedtoreflectthetimevalueofmoneyisconsistentwiththecurrencyandestimatedtermofthepost-employmentbenefitobligations.
Post-employmentbenefitobligationsaremeasuredonabasisthatreflects:
• estimatedfuturesalaryincreases;• thebenefitssetoutinthetermsoftheplan(orresultingfromanyconstructiveobligationthatgoesbeyondthose
terms) at the reporting date; and• estimatedfuturechangesinthelevelofanystatebenefitsthataffectthebenefitspayableunderadefinedbenefit
plan, if, and only if, either:• thosechangeswereenactedbeforethereportingdate;or• pasthistory,orotherreliableevidence,indicatesthatthosestatebenefitswillchangeinsomepredictablemanner,
for example, in line with future changes in general price levels or general salary levels.
1.8 Provisions and contingencies
Provisions are recognised when:
• theentityhasapresentobligationasaresultofapastevent;• itisprobablethatanoutflowofresourcesembodyingeconomicbenefitsorservicepotentialwillberequiredto
settle the obligation; and• areliableestimatecanbemadeoftheobligation.
The amount of a provision is the best estimate of the expenditure expected to be required to settle the present obligation at the reporting date.
Where some or all of the expenditure required to settle a provision is expected to be reimbursed by another party, the reimbursement is recognised when, and only when, it is virtually certain that reimbursement will be received if the Council settles the obligation. The reimbursement is treated as a separate asset. The amount recognised for the reimbursement does not exceed the amount of the provision.
Provisions are not recognised for future operating surpluses.
If an entity has a contract that is onerous, the present obligation (net of recoveries) under the contract is recognised and measured as a provision.
The Engineering Council of South AfricaAnnualfinancialstatementsfortheyearended31March2016
Notes to the financial statements

Financial Information | ECSA Annual Report 2016ECSA Annual Report 2016 | Financial Information134 135
The Engineering Council of South AfricaAnnual financial statements for the year ended 31 March 2016
Notes to the financial statements
2. New standards and interpretations
2.1 Standards and interpretations issued, but not yet effective
The Council has not applied the following standards and interpretations, which have been published and are mandatory fortheCouncil’saccountingperiodsbeginningonorafter01April2016orlaterperiods:
GRAP 20: Related parties
Theobjectiveofthisstandardistoensurethatareportingentity’sannualfinancialstatementscontainthedisclosuresnecessarytodrawattentiontothepossibilitythatitsfinancialpositionandsurplusordeficitmayhavebeenaffectedbythe existence of related parties and by transactions and outstanding balances with such parties.
An entity that prepares and presents financial statements under the accrual basis of accounting (in this standardreferred to as the reporting entity) shall apply this standard in:
• identifyingrelatedpartyrelationshipsandtransactions;• identifyingoutstandingbalances,includingcommitments,betweenanentityanditsrelatedparties;• identifyingthecircumstancesinwhichdisclosureoftheitemsin(a)and(b)isrequired;and• determiningthedisclosurestobemadeaboutthoseitems.
TheCouncilisunabletoreliablyestimatetheimpactofthestandardontheannualfinancialstatements.
GRAP 108: Statutory Receivables
The objective of this Standard is: to prescribe accounting requirements for the recognition, measurement, presentation and disclosure of statutory receivables.
Itfurthermorecovers:Definitions,recognition,derecognition,measurement,presentationanddisclosure,transitionalprovisions,aswellastheeffectivedate.
TheCouncilexpectstoadoptthestandardforthefirsttimewhentheMinistersetstheeffectivedateforthestandard.
The adoption of this standard is not expected to impact on the results of the Council, but may result in more disclosure thaniscurrentlyprovidedintheannualfinancialstatements.
3. Risk management
Capital risk management
TheCouncil’sobjectiveswhenmanagingcapitalaretosafeguardtheCouncil’sabilitytocontinueasagoingconcernin order to provide services as enacted by the Engineering Profession Act 2000, (Act no 46 of 2000) and to maintain an optimal capital structure to reduce the cost of capital.
Thecapital structureof theCouncil consists of debt,which includes theborrowings (excludingderivative financialliabilities) disclosed in notes 10, cash and cash equivalents disclosed in note 9, and equity as disclosed in the Statement of Financial Position. The Council monitors capital on the basis of the gearing ratio.
This ratio is calculated as net debt divided by total capital. Net debt is calculated as total borrowings (including ‘current andnon-currentborrowings’asshown in thestatementoffinancialposition) lesscashandcashequivalents.Totalcapitaliscalculatedas‘equity’asshownintheStatementofFinancialPositionplusnetdebt.
There are no externally imposed capital requirements.
There have been no changes to what the entity manages as capital, the strategy for capital maintenance or externally imposed capital requirements from the previous year.
The gearing ratio at 2016 and 2015 respectively were as follows:
1.11 Revenue from non-exchange transactions (continued)
Astheentitysatisfiesapresentobligationrecognisedasaliabilityinrespectofaninflowofresourcesfromanonexchangetransaction recognised as an asset, it reduces the carrying amount of the liability recognised and recognises an amount of revenue equal to that reduction.
Measurement
Revenue from a non-exchange transaction is measured at the amount of the increase in net assets recognised by the entity.
When, as a result of a non-exchange transaction, the entity recognises an asset, it also recognises revenue equivalent to the amount of the asset measured at its fair value as at the date of acquisition, unless it is also required to recognise a liability. Where a liability is required to be recognised it will be measured as the best estimate of the amount required to settle the obligation at the reporting date, and the amount of the increase in net assets, if any, recognised as revenue. Whenaliabilityissubsequentlyreduced,becausethetaxableeventoccursoraconditionissatisfied,theamountofthereduction in the liability is recognised as revenue.
1.12 Borrowing costs
Borrowing costs are interest and other expenses incurred by an entity in connection with the borrowing of funds.
Borrowing costs are recognised as an expense in the period in which they are incurred.
1.13 Budget information
Council is typically subject to budgetary limits in the form of appropriations or budget authorisations (or equivalent), whichitsetsforitself,asdefinedinitsDelegationofAuthorityFramework.
GeneralpurposefinancialreportingbyCouncilshallprovideinformationonwhetherresourceswereobtainedandusedin accordance with the legally adopted budget.
Theapprovedbudgetcoversthefiscalperiodfrom01/04/2015to31/03/2016.
Theannualfinancialstatementsandthebudgetareonthesamebasisofaccountingthereforeacomparisonwiththebudgeted amounts for the reporting period have been included in the Statement of Comparison of Budget and Actual amounts.
The Engineering Council of South AfricaAnnualfinancialstatementsfortheyearended31March2016
Notes to the financial statements

Financial Information | ECSA Annual Report 2016ECSA Annual Report 2016 | Financial Information136 137
The Engineering Council of South AfricaAnnual financial statements for the year ended 31 March 2016
Notes to the financial statements
3. Risk management (continued) 2016 2015 R RCredit risk
Credit risk consists mainly of cash deposits, cash equivalents and trade debtors. The Council only deposits cash withmajor banks with high quality credit standing and limits exposure to any one counter-party. Refer to table below for quality ratings
Standard BankNational long-term credit rating AA (ZAF)National short-term credit rating F1+ (ZAF)
InvestecNational long-term credit rating AA- (ZAF)National shaort-term credit rating F1+ (ZAF)
Trade receivables comprise a widespread customer base, mainly being registered persons. Management evaluated credit risk relating to registered persons on an ongoing basis. The Council has to comply with statutory obligations and nochoiceisexercisedontheregisteredperson’sabilitytopaymembershipfees.
4. Property, plant and equipment
2016 2015 Cost / Accumulated Carrying Cost / Accumulated Carrying Valuation depreciation value Valuation depreciation value and and accumulated accumulated impairment impairment R R R R R RBuildings 7,691,993 (1,460,162) 6,231,831 7,691,993 (1,306,323) 6,385,670Furnitureandfixtures 1,841,517 (1,311,291) 530,226 1,477,568 (1,339,215) 138,353Motor vehicles 198,064 (178,258) 19,806 198,064 (198,064) -Officeequipment 601,028 (497,703) 103,325 545,713 (450,991) 94,722Computer equipment 2,214,618 (1,934,282) 280,336 2,100,185 (1,546,982) 553,203Improvements to property 2,255,280 (1,082,867) 1,172,413 2,085,572 (873,792) 1,211,780
Total 14,802,500 (6,464,563) 8,337,937 14,099,095 (5,715,367) 8,383,728
Reconciliation of property, plant and equipment - 2016
Opening Additions Depreciation Impairment Total balance loss R R R R RBuildings 6,385,670 - (153,839) - 6,231,831Furnitureandfixtures 138,353 521,089 (122,942) (6,274) 530,226Motor vehicles - - 19,806 - 19,806Officeequipment 94,722 57,115 (48,512) - 103,325Computer equipment 553,203 118,297 (385,925) (5,239) 280,336Improvements to property 1,211,780 169,708 (209,075) - 1,172,413
8,383,728 866,209 (900,487) (11,513) 8,337,937
3. Risk management (continued) 2016 2015 R RTotal borrowingsBorrowings (Refer to Note 10) 587,704 1,433,273Less: Cash and cash equivalents (Refer to Note 9) (12,170,755) (11,194,404)Net debt (11,583,051) (9,761,131)Total equity 36,867,865 28,695,340Total capital 25,284,814 18,934,209Ratio (46)% (52)%
Financial risk management
TheCouncil’sactivitiesexposeittoavarietyoffinancialrisks:marketrisk(includingfairvalueandinterestraterisk),creditriskandliquidityrisk.TheCouncil’soverallriskmanagementprogramfocusesontheunpredictabilityoffinancialmarketsandseekstominimisepotentialadverseeffectsontheCouncil’sfinancialperformance.Riskmanagementis carried out by an audit and risk committee under policies approved by the Council. The Council provides written principlesforoverallriskmanagement,aswellaswrittenpoliciescoveringspecificareas,suchasinterestrateriskandcredit risk and investment of excess liquidity.
Liquidity risk
Cashflow forecasting isperformedby theCouncil.TheCouncil’s financedivisionmonitors rolling forecastsof theCouncil’sliquidityrequirementstoensureithassufficientcashtomeetoperationalneedswhilemaintainingsufficientheadroom on its undrawn committed borrowing facilities at all times so that the company does not breach borrowing limits or covenants (where applicable) on any of its borrowing facilities. The Council invests surplus cash in interest bearing current accounts, time deposits, money market deposits and marketable securities, choosing instruments withappropriatematuritiesorsufficientliquiditytoprovidesufficienthead-roomasdeterminedbytheabovementionedforecasts.
ThetablebelowanalysestheCouncil’snon-derivativefinancialliabilitiesdintorelevantmaturitygroupingsbasedontheremainingperiodattheStatementofFinancialPositiondatetothecontractualmaturitydate.Derivativefinancialliabilities are included in the analysis if their contractual maturities are essential for an understanding of the timing of thecashflows.Theamountsdisclosedinthetablearethecontractualundiscountedcashflows.
At 31 March 2016 Less than 1 Between 1 Between 2 Over 5 years year and 2 years and 5 years R R R RBorrowings 587,704 - - -Trade and other payables 12,816,939 - - -
At 31 March 2015 Less than 1 Between 1 Between 2 Over 5 years year and 2 years and 5 yearsBorrowings 994,613 438,680 - -Trade and other payables 9,958,648 - - -
Interest rate risk
As the Council has no significant interest-bearing assets, the Council’s income and operating cash flows aresubstantially independent of changes in market interest rates. The Council analyses its interest rate exposure on a regularbasis.InterestratefluctuationsthatcouldimpactonitssurplusordeficitaretheratesearnedonCouncil’sshort-term investments. It is not foreseen that the actual revenue earned compared to the budgeted revenue will deviate by morethanR200,000perannum.Thistranslatesintoapossiblefluctuationof0.1%to0.2%intotalrevenue.
The Engineering Council of South AfricaAnnual Financial Statements for the year ended 31 March 2016
Notes to the financial statements2016 2015
R R
3. Risk management (continued)
Total borrowingsBorrowings (Refer to Note 10) 587,704 1,433,273Less: Cash and cash equivalents (Refer to Note 9) (12,170,755) (11,194,404)Net debt (11,583,051) (9,761,131)Total equity 36,867,865 28,695,340Total capital 25,284,814 18,934,209Ratio %(46) %(52)
Financial risk management
TheCouncil’sactivitiesexposeit toavarietyoffinancialrisks:marketrisk(includingfairvalue and interest rate risk),credit risk and liquidity risk.The Council’soverallriskmanagementprogramfocusesontheunpredictabilityoffinancialmarkets and seeks to minimise potential adverse effects on the Council’sfinancialperformance.Riskmanagementiscarried out by an audit and risk committee under policies approved by the Council. The Council provides writtenprinciples for overall risk management, as well as written policies covering specific areas, such as interest rate risk andcredit risk and investment of excess liquidity.
Liquidity risk
Cash flow forecasting is performed by the Council. The Council’s finance divisionmonitors rolling forecasts of theCouncil’s liquidityrequirementstoensureithassufficientcashtomeetoperationalneedswhilemaintaining sufficientheadroom on its undrawn committed borrowing facilities at all times so that the company does not breach borrowinglimits or covenants (where applicable) on any of its borrowing facilities. The Council invests surplus cash in interestbearing current accounts, time deposits, money market deposits and marketable securities, choosing instruments withappropriate maturities or sufficient liquidity to provide sufficient head-room as determined by the abovementionedforecasts.
The table below analyses the Council’snon-derivativefinancialliabilitiesdintorelevantmaturitygroupingsbasedontheremaining period at the Statement of Financial Position date to the contractual maturity date. Derivative financialliabilities are included in the analysis if their contractual maturities are essential for an understanding of the timing ofthe cash flows. The amounts disclosed in the table are the contractual undiscounted cash flows.
At 31 March 2016 Less than 1year
R
Between 1and 2 years
R
Between 2and 5 years
R
Over 5 years
RBorrowings 587,704 - - -Trade and other payables 12,816,939 - - -
At 31 March 2015 Less than 1year
R
Between 1and 2 years
R
Between 2and 5 years
R
Over 5 years
RBorrowings 994,613 438,680 - -Trade and other payables 9,958,648 - - -
Interest rate risk
As the Council has no significant interest-bearing assets, the Council’s income and operating cash flows aresubstantially independent of changes in market interest rates.
The Council analyses its interest rate exposure on a regular basis. Interest rate fluctuations that could impact on itssurplus or deficit are the rates earned on Council's short-term investments. It is not foreseen that the actual revenueearned compared to the budgeted revenue will deviate by more than R200,000 per annum. This translates into apossible fluctuation of 0.1% to 0.2% in total revenue.
25
The Engineering Council of South AfricaAnnualfinancialstatementsfortheyearended31March2016
Notes to the financial statements

Financial Information | ECSA Annual Report 2016ECSA Annual Report 2016 | Financial Information138 139
The Engineering Council of South AfricaAnnual financial statements for the year ended 31 March 2016
Notes to the financial statements
2016 2015 R R5. Intangible assets (continued)
Reconciliation of intangible assets - 2016
Opening Additions Amortisation Total balance R R R RRegistration system 1,834,378 59,500 - 1,893,878Accounting system 493,186 125,152 (81,940) 536,398 2,327,564 184,652 (81,940) 2,430,276
Reconciliation of intangible assets - 2015
Opening Additions Amortisation Total balance R R R RRegistration system 1,426,556 407,822 - 1,834,378Accounting system 294,177 297,646 (98,637) 493,186 1,720,733 705,468 (98,637) 2,327,564
6. Investments
Designated at fair valueSISInflationplus1-3Investments 12,347,620 11,932,256Theseinstrumentsconsistofinvestmentsheldatfinancialinstitutionsandtheirmarket values quoted in the market place.
Non-current assetsFordebtsecuritiesclassifiedasavailable-for-sale,themaximumexposuretocreditrisk at the reporting date is the fair value.Theentityhasnotreclassifiedanyfinancialassetsfromcostoramortisedcosttofairvalue, or from fair value to cost or amortised cost during the current or prior year.
SISInflation–openingbalance 11,932,256 10,748,943Fair value adjustment 108,474 968,799Adjustments in fair value are done at every month-end.
Earnings surplus 306,890 214,514Earnings are declared twice a year.
Fair value at year-end 12,347,620 11,932,256
2016 2015 R R4. Property, plant and equipment (continued)
Reconciliation of property, plant and equipment - 2015
Opening Additions Disposals Transfers Depreciation Total balance R R R R R RBuildings 6,539,510 - - - (153,840) 6,385,670Furnitureandfixtures 172,445 139,646 (14,753) - (158,985) 138,353Motor vehicles - - - - - -Officeequipment 609,790 35,856 (6,836) (595,434) 51,346 94,722Computer equipment 920,059 362,319 (155,501) - (573,674) 553,203Improvements to property 794,663 83,670 (25,268) 595,434 (236,719) 1,211,780 9,036,467 621,492 (202,378) - (1,071,872) 8,383,728
Buildings - Section title deeds held
An undivided share of the common property (Section 5-8, 9-10 and 16) in the scheme apportioned to the said sectionin accordance with the participation quota as endorsed on the said sectional plan
Property is security over borrowings disclosed in note 10. Square 2016 2015 Metres R R
Section 5 (First Floor) 631 - -Section6(Firstfloor) 383 - -Section7(Firstfloor) 237 - -Section8(Firstfloor) 456 - -T013126/2009Purchased 29 Apr 2009 - 6,280,750 6,280,750Section9(Secondfloor) 212 - -Section10(Secondfloor) 329 - -T57554/1999
Purchased 30 Sep 1999 - 1,411,243 1,411,243Section 16 (Basement) 5 - -T044549/2005Purchased 10 Aug 2005 - 5,000 5,000 2,253 7,696,993 7,696,993
5. Intangible assets 2016 2015 Cost / Accumulated Carrying Cost / Accumulated Carrying Valuation amortisation value Valuation amortisation value and and accumulated accumulated impairment impairment R R R R RRegistration system 1,834,378 59,500 1,893,878 1,984,233 (149,855) 1,834,378Accounting system 493,186 43,211 536,397 591,823 (98,637) 493,186Total 2,327,564 102,711 2,430,275 2,576,056 (248,492) 2,327,564
The Engineering Council of South AfricaAnnualfinancialstatementsfortheyearended31March2016
Notes to the financial statements

Financial Information | ECSA Annual Report 2016ECSA Annual Report 2016 | Financial Information140 141
The Engineering Council of South AfricaAnnual financial statements for the year ended 31 March 2016
Notes to the financial statements
2016 2015 R R7. Retirement benefit obligations (continued)
The value determined under par. 64 was R4,484,000 as at 31 March 2014 and the value of par. 68(b) was R1,784,000. Therefore, the net asset as at 31 March 2014 should be limited to R1,784,000.
The fair value of plan assets includes:
Sanlam Matrix 50 portfolioThe assets underlying the Employer Surplus Account and theSolvency Reserve have been included in the asset value.Assets not recognised (GRAP 25, paragraph 68(b)). - 10,417,000
Movement in the defined benefit obligation are as follows
Opening balance 24,281,000 26,065,000Interest cost 1,995,000 (3,523,000)Actuarial (gains)/losses (3,523,000) (2,413,000)Benefitspaid (1,723,000) (1,666,000) 21,030,000 18,463,000
Net expense recognised in the statement of financial performance
Interest cost (1,995,000) (2,295,000)Actuarial gains/(losses) (5,730,000) 7,529,000EffectofthelimitinGRAP25,par.68(b) 10,417,000 (7,717,000)Expected return on plan assets 4,254,000 2,702,000 6,946,000 219,000
The movement in the fair value of plan assets are as follows
Opening balance 36,701,000 30,549,000Expected return 4,254,000 2,702,000Actuarial gains (losses) (9,253,000) 5,116,000Benefitspaid (1,723,000) (1,666,000) 29,979,000 36,701,000
Key assumptions used
The principal actuarial assumptions used were as follows:
Discount rates used 7.87 % 6.68 %Expected rate of return on assets 9.91 % 8.51 %Expected rate of return on reimbursement rights 11.87 % 10.68 %
The assumptions used are consistent with assumptions used in the statutory valuation. However, GRAP 25 requires the valuationtobecarriedoutonaprescribedmarketvaluebasisandanumberoftheassumptionsthereforedifferfromthose used in the statutory valuation.
Valuation rate of interest –GRAP 25 requires rates to be determined by reference to the currentmarket yield ofgovernment bonds. Just for completeness, since the obligation is already settled at 1 March 2015, the yield of the R209 government bond was 9.91% and the long-term liability on the yield of the R202 government bond 1.90% at 31 March 2016. Rates given are the weighted average rates.
The expected return on assets are based on an average balances portfolio.
The expected long term real return is 4%, calculated as follows:
2016 2015 R R7. Retirement benefit obligations
Defined benefit plan
Retirement benefit
Balance sheet obligations forPensionbenefits- non-current liabilities 21,030,000 -
Income statement charge forEmployeebenefitexpense- wages and salaries 34,737,844 31,812,820-pensioncost-definedbenefitplan (6,946,000) (219,000) 27,791,844 31,593,820
Actuariallosses/(gains)recognisedinthestatementoffinancialperformance 5,730,000 (7,529,000)Cumulativeactuariallosses/(gains)recognisedinstatementoffinancialperformance (10,122,000) (2,593,000) (4,392,000) (10,122,000)
Pension benefits
Plan assets are held in a Sanlam Matrix 50 portfolio and the return is based on the performance of the portfolio. The assets underlying the Employer Surplus Account and the Solvency Reserve have been included in the asset value. The funds are administered by a separate legal entity and as a result, the assets belonging to the Fund are credit remote.
Theamountsrecognisedinthestatementoffinancialpositionareasfollows:
Carrying valuePresentvalueofthedefinedbenefitobligation-whollyunfunded (21,030,000) (24,281,000)Fair value of plan assets 29,979,000 36,701,000Asset not recognised - (10,417,000) 8,949,000 2,003,000
Net asset amount recognition was determined on the following basis:
ThedefinitionsoftheFundprovidefortheestablishmentofanEmployerSurplusAccount(”ESA”).Rule13.3.3statesthat future surplus be allocated between the ESA and Member Surplus Account in proportions as determined by the trustees.
Inthesecircumstances,AC504statesthatthepresentvalueoftheeconomicbenefitsavailabletotheemployer(par.68(b) of GRAP 25) is the value of the ESA plus the accounting surplus available as a reduction in future contributions. As confirmed byAbsa Consultants andActuaries, the value of the ESA was R8,949,000 as at 31 March 2016.Furthermore,sincetherearenoactiveDefinedBenefitmembersintheFund(asperthevaluationreport),accountingsurplusavailableasareductioninfuturecontributionsiszero.Thepresentvalueoftheeconomicbenefitsavailabletothe employer is therefore R8,949,000.
Thevalueoftheassetreflectedonthebalancesheetshouldbedeterminedintermsofpar.68ofGRAP25.Thisstatesthat the net asset recognised should be the lower of the value determined under par. 64 and the present value of the economicbenefitsavailabletotheemployer(par.68(b)).Thevaluesforthepastthreeyearsareasfollows(theactuaryprovided the ESA balance as at each date):
The value determined under par. 64 was R8,949,000 as at 31 March 2016 and the value of par. 68(b) was R8,949,000. Therefore, the net asset as at 31 March 2016 should be limited to R8,949,000.
The value determined under par. 64 was R12,424,000 as at 31 March 2015 and the value of par. 68(b) was R2,003,000. Therefore, the net asset as at 31 March 2015 should be limited to R2,003,000.
The Engineering Council of South AfricaAnnualfinancialstatementsfortheyearended31March2016
Notes to the financial statements

Financial Information | ECSA Annual Report 2016ECSA Annual Report 2016 | Financial Information142 143
The Engineering Council of South AfricaAnnual financial statements for the year ended 31 March 2016
Notes to the financial statements
2016 2015 R R 10. Borrowings
Held at amortised costMortgage bond 587,704 1,433,273Bond on Section 5 - 8 from ABSA Bank. Interest at a rate of 9.75 paand is to be repaid within 10 years
Non-current liabilitiesAt amortised cost - 438,660
Current liabilitiesAt amortised cost 587,704 994,613
11. Trade and other payables
Trade payables 5,953,611 6,523,652South African Revenue Services - VAT 2,446,664 642,992Other accrued expenses 2,815,518 1,512,189Other payables 1,155,606 1,279,815 12,371,399 9,958,648
12. Provisions
Reconciliation of provisions - 2016 Opening Movement Total Balance R R RLeave pay provision 1,645,171 (98,003) 1,547,168
Reconciliation of provisions - 2015 Opening Movement Total Balance R R RLeave pay provision 2,186,106 (540,935) 1,645,171
13. Financial instruments
Categories of financial instruments
2016
Financial assets At fair value At amortised Total cost R R RInvestments 12,347,620 - 12,347,620Trade and other receivables - 6,930,682 6,930,682Cash and cash equivalents - 12,170,755 12,170,755 12,347,620 19,101,437 31,449,057
Financial liabilities
2016 2015 R R7. Retirement benefit obligations (continued)
Portfolio Real return Weighted returnEquity 70 % 4.50 % 3.15 %Bonds 30 % 3.00 % 0.90 % 100.00 % 7.50 % 4.05 %
In accordance with the Pension Increase Policy, increases should be granted equal to the increase in the Consumer PriceIndex,subjecttoaffordability.
In respect of the period after retirement, the published a (55) tables for males and females have been used. Thenumber of pensioners as at 31 March 2016, their annual pension and weighted average age, compared to that as at 31 March 2015 were as follows:
Number of pensioners 9 10Annual pension 1,604,000 1,666,000Pension weighted average age 48.5 45
8. Trade and other receivables
Trade debtors 23,440,320 10,803,122Other Debtors 343,878 159,318Employee costs in advance (16,364) 10,465Deposits 2,000 2,000Impairment for bad debts (16,839,152) (5,083,425) 6,930,682 5,891,480
Fair value of trade and other receivablesTrade and other receivables 6,930,682 5,891,480Trade and other receivables impairedThe amount of the provision was (R16,839,152) as of 31 March 2016 (2015: R5,083,425).
Reconciliation of provision for impairment of trade and other receivables
Opening balance 5,083,425 3,996,176Provision for impairment 11,755,727 6,165,491Amountswrittenoffasuncollectible - (5,078,242) 16,839,152 5,083,425
The reason for the large increase in Provision for Impairment is that ECSA had not, as in the past, cancelled anyregisteredpersonsinthefinancialyearwhowereindefaultfornonpaymentoftheirannualfeesforthepasttwoyears.IncludedintheprovisionofR11,755,727isanamountofR9,078,215(2,968defaulters)earmarkedforwrite-off.Afteryear-endtheactualamountwrittenoffasbaddebtswasR8,372,156(2,741defaulters).
9. Cash and cash equivalents
Cash and cash equivalents consist of:Cash on hand 7,201 8,754Bank balances 12,163,554 11,185,650 12,170,755 11,194,404
The Engineering Council of South AfricaAnnualfinancialstatementsfortheyearended31March2016
Notes to the financial statements

Financial Information | ECSA Annual Report 2016ECSA Annual Report 2016 | Financial Information144 145
The Engineering Council of South AfricaAnnual financial statements for the year ended 31 March 2016
Notes to the financial statements
2016 2015 R R
16. General expenses
Acquisitionofsmallfixedassets 39,690 5,117Auditors remuneration - External 428,255 244,712Auditors remuneration - Internal and other accounting services 127,762 311,919Bank charges 303,115 276,652Casual labour 123,556 57,916Committee room expenses 163,842 101,183Consulting fees 3,142,933 2,627,286Council and committee meetings 14,240,965 11,586,196Disciplinarymattersandfines 423,029 75,714Electricity and water 1,370,256 1,151,090IT expenses 1,324,185 422,355Insurance 222,854 231,551Investment fees 138,630 131,925Legal expenses 917,833 760,030Marketing and Branding 1,724,006 2,350,929Membership fees 222,537 153,018Motor vehicle expenses 28,837 29,775Officeexpenditure 707,197 401,417Personnel recruitment 284,904 520,712Printing and stationery 740,546 627,638Project cost 1,737,437 1,919,404Rental expense 330,805 123,338Repairs and maintenance 2,070,997 2,561,419Security 47,965 13,799Staffstudyassistance 139,567 179,010Staffwelfare 1,573,759 892,498Telephone and fax 680,563 752,467Training 126,698 153,938Travel-staff 917,650 718,818 34,300,373 9,381,826
17. Personnel
Basic salary 29,725,190 27,046,268Medical aid - company contributions 1,616,697 1,859,936UIF 129,530 123,637SDL 300,994 279,293Other short term costs 141,335 106,394Definedcontributionplans 2,824,098 2,530,382 34,737,844 31,945,910
18. Other expenses
Provision on trade and other receivables 11,755,727 6,165,491Amortisation on intangible assets 81,940 98,637Depreciation on property, plant and equipment 900,487 1,071,872Operating lease charges (Contractual amounts) 425,583 199,169 13,163,116 7,535,169
2016 2015 R R
Financial instruments (continued) At amortised Total cost R RBorrowings 587,704 587,704Trade and other payables 10,370,275 10,370,275 10,957,979 10,957,979
2015
Financial assets
At fair value At amortised Total cost R R R
Investments 11,932,256 - 1,932,256Trade and other receivables - 5,891,430 5,891,430Cash and cash equivalents - 11,194,404 11,194,404 11,932,256 17,085,834 29,018,090
Financial liabilities
At amortised Total cost R RBorrowings 1,433,273 1,433,273Trade and other payables 9,891,881 9,891,881 11,325,154 11,325,154
14. Operating revenue
Annual fees 68,089,274 59,219,926Application fees 10,128,873 8,283,527Accreditation visits 1,516,568 1,261,000 79,734,715 68,764,453
The amount included in revenue arising from exchanges of goods or services are asfollows:Accreditation visits 1,516,568 1,261,000
The amount included in revenue arising from non-exchange transactions is as follows:Annual fees 68,089,274 59,219,926Application fees 0,128,873 8,283,527 78,218,147 67,503,453
15. Other income
Income from SETAs and other public entities 1,220,245 247,681Bad debts recovered 301,815 71,698Disciplinaryfines 130,000 25,000Rental income 8,798 -Other income 156,261 60,668Profitonsaleoffixedassets (2,053) (46,929) 1,815,066 358,118
The Engineering Council of South AfricaAnnualfinancialstatementsfortheyearended31March2016
Notes to the financial statements
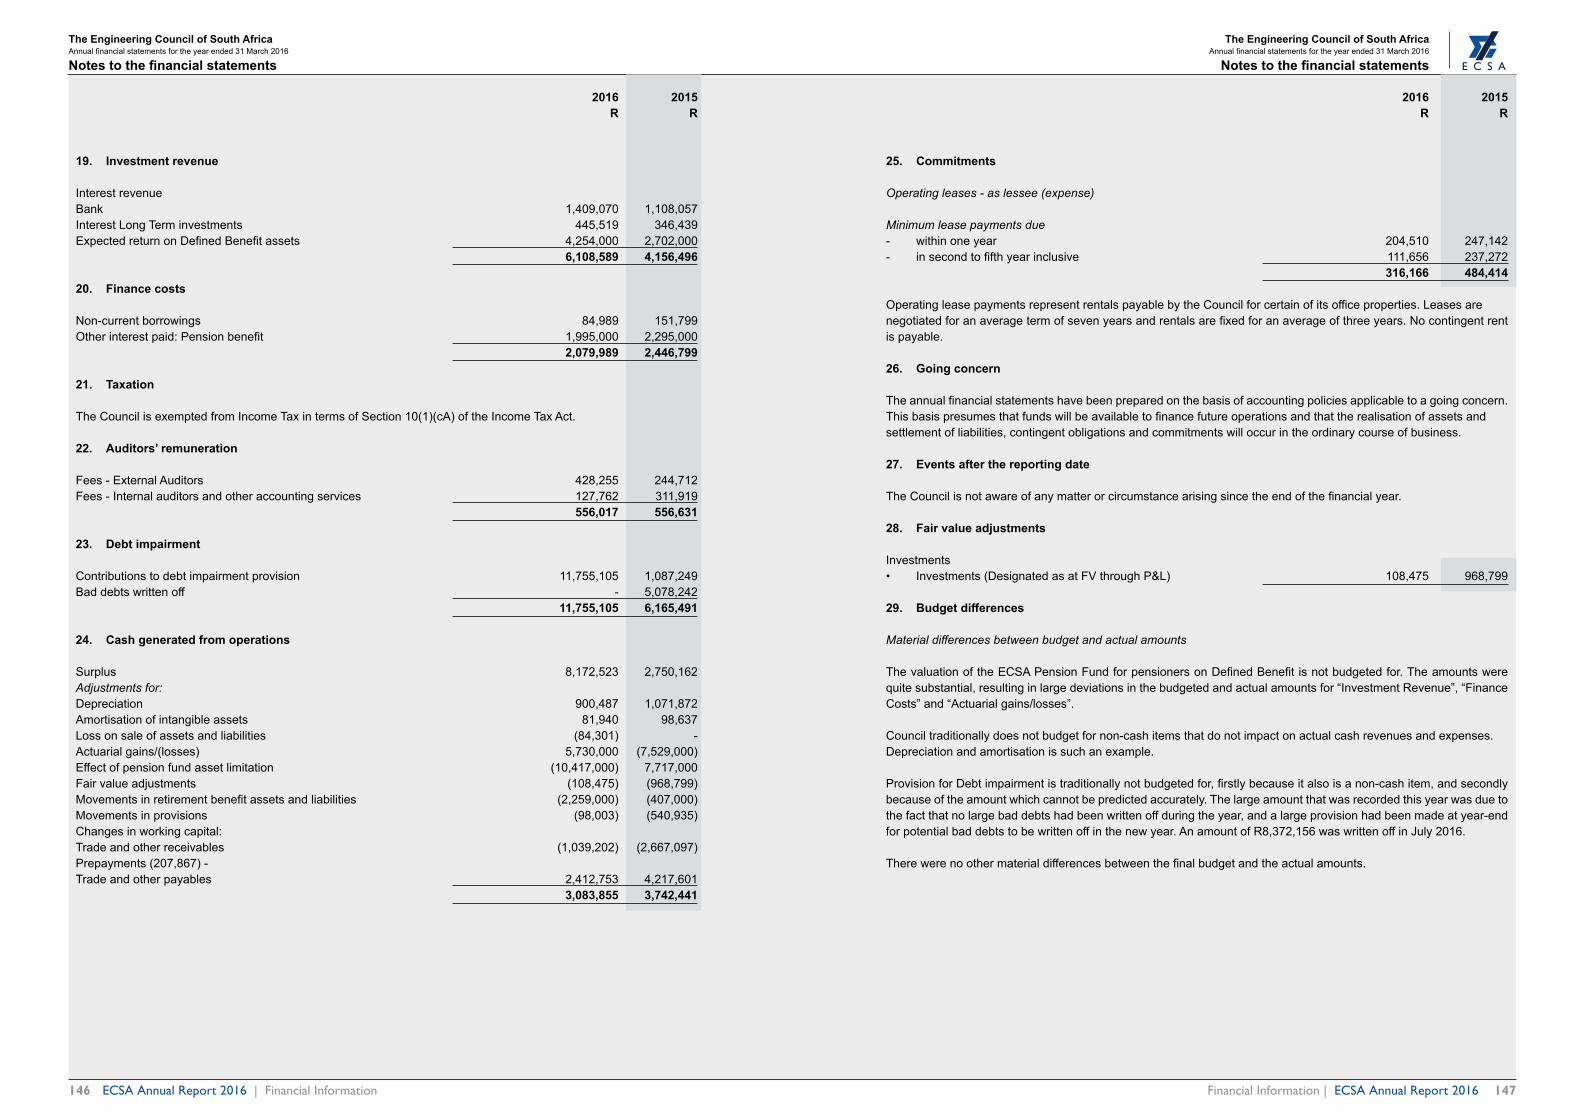
Financial Information | ECSA Annual Report 2016ECSA Annual Report 2016 | Financial Information146 147
The Engineering Council of South AfricaAnnual financial statements for the year ended 31 March 2016
Notes to the financial statements
2016 2015 R R
25. Commitments
Operating leases - as lessee (expense)
Minimum lease payments due- within one year 204,510 247,142- insecondtofifthyearinclusive 111,656 237,272 316,166 484,414
OperatingleasepaymentsrepresentrentalspayablebytheCouncilforcertainofitsofficeproperties.Leasesarenegotiatedforanaveragetermofsevenyearsandrentalsarefixedforanaverageofthreeyears.Nocontingentrentis payable.
26. Going concern
Theannualfinancialstatementshavebeenpreparedonthebasisofaccountingpoliciesapplicabletoagoingconcern.Thisbasispresumesthatfundswillbeavailabletofinancefutureoperationsandthattherealisationofassetsandsettlement of liabilities, contingent obligations and commitments will occur in the ordinary course of business.
27. Events after the reporting date
TheCouncilisnotawareofanymatterorcircumstancearisingsincetheendofthefinancialyear.
28. Fair value adjustments
Investments• Investments(DesignatedasatFVthroughP&L) 108,475 968,799
29. Budget differences
Material differences between budget and actual amounts
ThevaluationoftheECSAPensionFundforpensionersonDefinedBenefitisnotbudgetedfor.Theamountswerequite substantial, resulting in large deviations in the budgeted and actual amounts for “Investment Revenue”, “Finance Costs” and “Actuarial gains/losses”.
Council traditionally does not budget for non-cash items that do not impact on actual cash revenues and expenses.Depreciation and amortisation is such an example.
ProvisionforDebtimpairmentistraditionallynotbudgetedfor,firstlybecauseitalsoisanon-cashitem,andsecondlybecause of the amount which cannot be predicted accurately. The large amount that was recorded this year was due to thefactthatnolargebaddebtshadbeenwrittenoffduringtheyear,andalargeprovisionhadbeenmadeatyear-endforpotentialbaddebtstobewrittenoffinthenewyear.AnamountofR8,372,156waswrittenoffinJuly2016.
Therewerenoothermaterialdifferencesbetweenthefinalbudgetandtheactualamounts.
2016 2015 R R
19. Investment revenue
Interest revenueBank 1,409,070 1,108,057Interest Long Term investments 445,519 346,439ExpectedreturnonDefinedBenefitassets 4,254,000 2,702,000 6,108,589 4,156,496
20. Finance costs
Non-current borrowings 84,989 151,799Otherinterestpaid:Pensionbenefit 1,995,000 2,295,000 2,079,989 2,446,799
21. Taxation
The Council is exempted from Income Tax in terms of Section 10(1)(cA) of the Income Tax Act.
22. Auditors’ remuneration
Fees - External Auditors 428,255 244,712Fees - Internal auditors and other accounting services 127,762 311,919 556,017 556,631
23. Debt impairment
Contributions to debt impairment provision 11,755,105 1,087,249Baddebtswrittenoff - 5,078,242 11,755,105 6,165,491
24. Cash generated from operations
Surplus 8,172,523 2,750,162Adjustments for:Depreciation 900,487 1,071,872Amortisation of intangible assets 81,940 98,637Loss on sale of assets and liabilities (84,301) -Actuarial gains/(losses) 5,730,000 (7,529,000)Effectofpensionfundassetlimitation (10,417,000) 7,717,000Fair value adjustments (108,475) (968,799)Movementsinretirementbenefitassetsandliabilities (2,259,000) (407,000)Movements in provisions (98,003) (540,935)Changes in working capital:Trade and other receivables (1,039,202) (2,667,097)Prepayments (207,867) -Trade and other payables 2,412,753 4,217,601 3,083,855 3,742,441
The Engineering Council of South AfricaAnnualfinancialstatementsfortheyearended31March2016
Notes to the financial statements

Financial Information | ECSA Annual Report 2016ECSA Annual Report 2016 | Financial Information148 149
The Engineering Council of South AfricaAnnual financial statements for the year ended 31 March 2016
Notes to the financial statements
2016 2015 Note(s) R RRevenueAnnual fees 68,089,274 59,219,926Application fees 10,128,873 8,283,527Accreditation visits 1,516,568 1,261,000Disciplinaryfines 130,000 25,000Marketing and branding 1,220,245 247,681Bad debts recovered 301,815 71,698Sundry income 156,261 60,668Profitonsaleoffixedasset (2,053) (46,929)Appeals 8,798 -Total revenue 81,549,781 69,122,571
ExpenditurePersonnel 17 (34,737,844) (31,945,909)Depreciation 4 (900,487) (1,071,872)Amortisation on intangibles 5 (81,940) (98,637)Impairment loss/reversal of impairments 23 (11,755,105) (6,165,491)Finance costs 20 (2,079,989) (2,446,799)General Expenses 16 (34,300,374) (29,381,826)Lease rentals on operating lease (425,583) (199,170)
Total expenditure (84,281,322) (71,309,704)
Operating deficit 18 (2,731,541) (2,187,133)Investment revenue 6,108,589 4,156,496Fair value adjustments 28 108,475 968,799Actuarial gains/(losses) (5,730,000) 7,529,000Effectofpensionfundassetlimitation 10,417,000 (7,717,000) 10,904,064 4,937,295
Surplus for the year 8,172,523 2,750,162
Thissupplementaryinformationbeingpresenteddoesnotformpartofthefinancialstatementsandisunaudited.
2016 2015 R R30. Key personnel emoluments
Remuneration paid to key personnel
2016 Months Emoluments Contributions Total employed to retirement plan R R RSE MadonselaChiefExecutiveOfficer 12 1,607,207 150,268 1,757,4751 April 2015 - 31 March 2016ME Sabela 10 1,050,074 9 4,863 1,144,937Executive: Strategic Services (Resigned 31 Jan 2016)1 April - 31 Jan 2016MC Phalane 12 1,380,010 123,756 1,503,766Executive:ChiefFinancialOfficer(Resigned31Mar2016)1 April - 31 March 2016RN Gaoraelwe 11 1,363,304 46,702 1,410,006Executive: Statutory ServiceResigned as an employee on 31 August 2015 - retained in thesame position on contract until his departure1 April - 29 February 2016TY Machimane 9 1,170,663 - 1,170,663Acting Executive Strategic Services8 July 2015 - 31 Jan 2016 54 6,571,258 4 15,589 6,986,847
2015 Months Emoluments Contributions Total employed to retirement plan R R RSE Madonsela 6 722,876 69,317 792,193ChiefExecutiveOfficer(6October2014–31March2015)ME Sabela 6 704,106 53,194 757,300ActingChiefExecutiveOfficer(1 April 2014 to 6 October 2014)Executive: Strategic Services 6 554,737 53,194 607,931(7 October 2014 to 31 March 2015)MC Phalane 12 1,322,136 115,903 1,438,039Executive:ChiefFinancialOfficer(1 April 2014 to 31 March 2015)RN Gaoraelwe 12 1,052,069 103,034 1,155,103Executive: Statutory Services(1 April 2014 to 31 March 2015)TY Machimane 6 577,445 - 577,445Acting Executive: Strategic Services(1April2014–6October2014) 48 4,933,369 3 94,642 5,328,011
The Engineering Council of South AfricaAnnualfinancialstatementsfortheyearended31March2016
Notes to the financial statements

ECSA Annual Report 2016 | Financial Information150
The Engineering Council of South AfricaAnnualfinancialstatementsfortheyearended31March2016
Notes:

ECSA Annual Report 2016 | Financial Information152
ENGINEERING COUNCIL OF SOUTH AFRICA
1st Floor, Waterview Corner Building
2 Ernest Oppenheimer Avenue
Bruma
2198
POSTAL ADDRESS:
Private Bag X691
Bruma
Johannesburg
2026
ENGINEERING COUNCIL OF SOUTH AFRICA
EN
GIN
EER
ING
CO
UN
CIL
OF S
OU
TH
AFR
ICA
AN
NU
AL R
EPO
RT
20
15
/20
16
Top Related