


Languages
Pages
Legal


Rockefeller UniversityDigital Commons @ RU
Student Theses and Dissertations
2007
Energy Homeostasis During Fasting and FedStates: Foxa2 Regulates Hepatic Amino AcidUptakeVivian M. Lee
Follow this and additional works at: http://digitalcommons.rockefeller.edu/student_theses_and_dissertations
Part of the Life Sciences Commons
This Thesis is brought to you for free and open access by Digital Commons @ RU. It has been accepted for inclusion in Student Theses andDissertations by an authorized administrator of Digital Commons @ RU. For more information, please contact [email protected].
Recommended CitationLee, Vivian M., "Energy Homeostasis During Fasting and Fed States: Foxa2 Regulates Hepatic Amino Acid Uptake" (2007). StudentTheses and Dissertations. Paper 189.

ENERGY HOMEOSTASIS DURING FASTING AND FED STATES:
FOXA2 REGULATES HEPATIC AMINO ACID UPTAKE
A Thesis Presented to the Faculty of
The Rockefeller University
in Partial Fulfillment of the Requirements for
the degree of Doctor of Philosophy
by
Vivian M. Lee
June 2007

© Copyright by Vivian M. Lee 2007

iii
ENERGY HOMEOSTASIS DURING FASTING AND FED STATES: FOXA2 REGULATES HEPATIC AMINO ACID UPTAKE
Vivian M. Lee, Ph.D.
The Rockefeller University 2007
ABSTRACT
In MODY3 patients, as well in the experimental mouse model, the Tcf1 -/-
mouse, there is a defect in arginine-induced insulin secretion. In this thesis, we
examined the role of arginine transporters in the insulin secreting cells in
arginine-induced insulin secretion. We first characterized arginine uptake by
MIN6 cells as having a Km of 102.6μM and being partially Na-dependent and
entirely Cl-dependent. We then examined Tcf1 -/- pancreatic islets, which are
defective for arginine-induced insulin secretion. Using gene expression array
analysis and semi-quantitative RT-PCR analysis on pancreatic islets from Tcf1
+/+ and Tcf1 -/- mice, we found eight arginine transporters expressed in the
pancreatic islets with only two transporters, mNAT3 and CAT3, regulated by
Tcf1 in the islets. Using siRNA-mediated knockdown of both transporters, we
found that these transporters are not required for arginine-induced insulin
secretion in MIN6 cells. We conclude that there is a high level of redundancy for
arginine transport into insulin-secreting cells.
We also examined the regulation of mNAT3 in the liver. The liver is the
main site for gluconeogenesis during fasting, and has been shown to increase
amino acid uptake during periods of low nutrient intake to increase its substrate

iv
pool for glucose production. We found that mNAT3 is upregulated during
fasting, and that this response is abolished with insulin. Using mice injected
with adenovirus expressing either Foxa2 or GFP as a control, we found that
Foxa2 mediates this insulin-sensitive increase in hepatic mNAT3 expression.
Through electrophoretic mobility shift assays and chromatin immuno-
precipitation experiments, we found that Foxa2 binds to promoter elements of
the mNAT3 gene, Slc38a4. We also showed these promoter elements to be
important for Foxa2 transactivation using luciferase reporter gene assays. In
addition, with liver perfusion experiments using mice infected with adenovirus,
we found increased arginine uptake by livers overexpressing Foxa2. Thus, we
have identified Foxa2 as a mediator for increased hepatic amino acid uptake
during fasting.

v
ACKNOWLEDGEMENTS
I am deeply indebted to my mentor, Markus Stoffel. My years in his
laboratory have been ones where I have learned the most about science and
medicine, as well as the practice of both. It has been a privilege to work with
someone whose genuine enthusiasm for science and the application of it I very
much admire.
I am also grateful that he has such excellent taste in selecting his lab
members. The Stoffel Lab has always been a wonderful place to work with
wonderful people. I am thankful to Satoru Kuwajima, David Shih, and Christian
Wolfrum for being there when I first joined the lab, welcoming me and enduring
my many, many questions. I am particularly thankful to Pinar Akpinar, for
being the greatest bay-mate over all these years. And a big thanks to the entire
lab with whom I have enjoyed many laughs about jelly doughnuts.
My happiness throughout these years also would not have been possible
without my MD-PhD classmates. From our first meeting in 1999, they have all
been the most supportive and brilliant group of people I have ever had the
pleasure of being thrown together with. I look forward to many more years
together (though hopefully not so many as students).
I owe everything to my parents, Lou-Chuang and Li-her Lee, and my
sister, Jane, for I cannot even imagine where I would be right now if it were not
for their love, support, and inspiration by example, which I have enjoyed all my
life. I would also like to thank Matteo Ruggiu, the consummate scientist, for
being a constant reminder of all things great in my life.

vi
TABLE OF CONTENTS Page CHAPTER 1 – INTRODUCTION TO ISLET STUDIES....................................... 1 1.1 Introduction .......................................................................................................... 1 1.2 Diabetes Mellitus .................................................................................................. 2 1.3 Maturity-onset diabetes of the young (MODY)................................................... 4 1.4 MODY3 and TCF1............................................................................................... 6 1.5 Insulin secretion mechanisms ............................................................................... 7 1.6 Insulin secretion defects in the Tcf1 -/- pancreatic islets...................................... 12 1.7 Arginine transporters ........................................................................................... 12 1.8 Experimental study............................................................................................... 16 CHAPTER 2 – RESULTS PART I ............................................................................ 18 2.1 Characterization of arginine uptake by MIN6 cells ............................................. 18 2.1.1 Timecourse of arginine uptake by MIN6 cells ............................................. 18 2.1.2 Dose-dependence of arginine uptake by MIN6 cells.................................... 19 2.1.3 Kinetics of arginine uptake by MIN6 cells .................................................. 20 2.1.4 Effect of ion substitution on arginine uptake by MIN6 cells ...................... 21 2.2 Gene expression array analysis of Tcf1 +/+ and Tcf1 -/- pancreatic islets........... 22 2.3 Characterization of arginine transport by Slc38a4 .............................................. 24 2.3.1 Timecourse of arginine transport by mNAT3 ............................................. 24 2.3.2 Dose-dependence of arginine transport by mNAT3 .................................... 25 2.3.3 Kinetics of arginine transport by mNAT3 .................................................. 26 2.3.4 Effect of ion substitution on arginine transport by mNAT3....................... 27 2.4 Tissue expression of arginine transporters ........................................................... 28 2.5 Arginine transporter expression in Tcf1 +/+ and -/- pancreatic islets ................ 29 2.6 Arginine uptake and insulin secretion with Slc38a4 (mNAT3) and Slc7a3 (CAT3) knockdown......................................................................................................
31
2.6.1 Knockdown of Slc38a4 (mNAT3) in MIN6 cells ........................................ 31 2.6.2 Knockdown of Slc7a3 (CAT3) in MIN6 cells.............................................. 33 2.6.3 Knockdown of both Slc38a4 (mNAT3) and Slc7a3 (CAT3) ....................... 35 CHAPTER 3 – DISCUSSION PART I..................................................................... 36 3.1 Characterization of arginine uptake by insulin-secreting cells ............................ 36 3.2 Implications for arginine-induced insulin secretion in Tcf1 -/- mice................... 38 3.3 Tcf1 as a master regulator of transporters............................................................ 40

vii
CHAPTER 4 – INTRODUCTION TO LIVER STUDIES...................................... 42 4.1 Overview of insulin action ................................................................................... 42 4.2 Insulin receptor and insulin receptor substrates .................................................. 44 4.3 Insulin-regulated signaling pathways .................................................................. 46 4.4 Transcription factors involved in insulin-regulated hepatic metabolism............. 49 4.5 Forkhead family of transcription factors............................................................... 51 4.6 Insulin signaling and amino acid uptake ............................................................. 54 4.7 Experimental study............................................................................................... 55 CHAPTER 5 – RESULTS PART II........................................................................... 56 5.1 Tcf1 regulation of Slc38a4 in the pancreatic islets and the liver.......................... 56 5.2 Alternative transcriptional start sites for Slc38a4 ............................................... 56 5.3 Tcf1 regulation of both transcriptional isoforms of Slc38a4................................. 57 5.4 Regulation of Slc38a4 in the liver by metabolic states and insulin...................... 58 5.5 Slc38a4 is regulated by Foxa2 .............................................................................. 60 5.6 Identification of Tcf1 and Foxa2 regulatory elements in the Slc38a4 “islet” isoform promoter ..........................................................................................................
61
5.7 Identification of Tcf1 and Foxa2 regulatory elements in the Slc38a4 “liver” isoform promoter ..........................................................................................................
65
5.8 Synergistic transactivation of Slc38a4 by Tcf1 and Foxa2 .................................. 70 5.9 In vivo binding of Foxa2 to the Slc38a4 promoters .............................................. 71 5.10 Expression of Foxa2 (T156A) increases arginine uptake by perfused mouse livers.............................................................................................................................
72
CHAPTER 6 – DISCUSSION PART II ................................................................... 74 6.1 Alternative splicing as a mechanism for differential regulation of Slc38a4 ......... 74 6.2 Regulation and function of Slc38a4 in the liver ................................................... 77 CHAPTER 7 – EXPERIMENTAL PROCEDURES................................................ 80 7.1 Experimental animals ........................................................................................... 80 7.2 Cell culture ........................................................................................................... 80 7.3 In vitro radioactive ligand uptake assay ............................................................... 80 7.4 Pancreatic islet isolation ....................................................................................... 81 7.5 Gene expression array analysis............................................................................. 82 7.6 RNA interference .................................................................................................. 83 7.7 Protein immunoblotting ....................................................................................... 84 7.8 In vitro insulin secretion and measurement......................................................... 85 7.9 Vectors .................................................................................................................. 85

viii
7.10 Transient transfections and luciferase assay ...................................................... 87 7.11 Whole cell extract preparation for electrophoretic mobility shift assays ............ 87 7.12 Electrophoretic mobility shift assay (EMSA) ..................................................... 88 7.13 Chromatin immunoprecipitation ........................................................................ 89 7.14 Liver perfusion and radioactive ligand uptake assay.......................................... 90 REFERENCES............................................................................................................ 91

ix
LIST OF FIGURES AND TABLES
Page Table 1. MODY-related genes and the clinical phenotypes associated with their mutations ..........................................................................................................
5
Figure 1. Schematic diagram of the insulin secretion pathway ........................ 11 Table 2. Systems of amino acid transporters that mediate arginine transport .....................................................................................................................
13
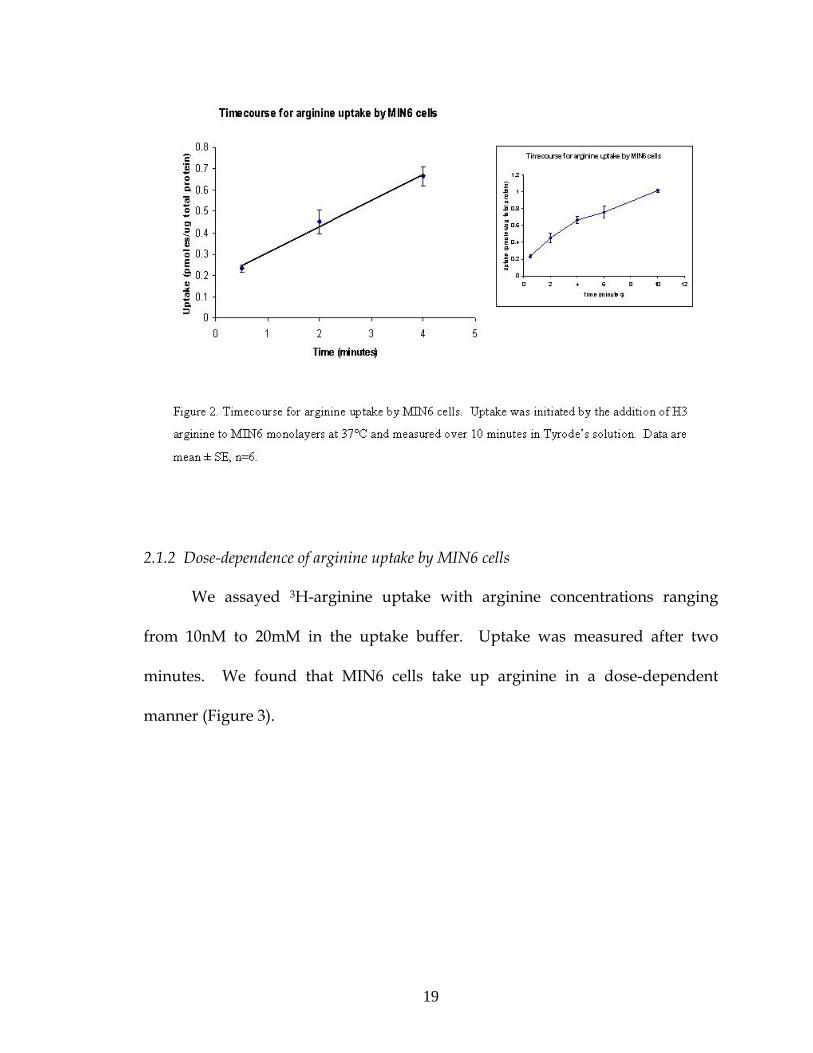
Figure 2. Timecourse for arginine uptake by MIN6 cells................................... 19 Figure 3. Dose-dependent uptake of arginine by MIN6 cells............................ 20 Figure 4. Lineweaver-Burk plot for MIN6 arginine uptake............................... 21 Figure 5. Na- and Cl-dependence of arginine uptake by MIN6 cells............... 22 Table 3. Gene expression array results for arginine transporters in Tcf1 +/+ and Tcf1 -/- pancreatic islets...........................................................................
24
Figure 6. Arginine uptake measurements in COS-7 cells overexpressing mNAT3 .......................................................................................................................
25
Figure 7. Dose-dependent uptake of arginine mediated by mNAT3 in COS-7 cells .................................................................................................................
26
Figure 8. Lineweaver-Burk plot fo mNAT3-mediated arginine transport ...... 27 Figure 9. Na- and Cl-dependence of mNAT3-mediated arginine uptake by COS-7 cells ............................................................................................................
28
Figure 10. Expressing of arginine transporters in various tissues .................... 29 Figure 11. Tcf1 regulation of arginine transporters in pancreatic islets........... 30 Figure 12. mNAT3 knockdown in MIN6 cells ..................................................... 31 Figure 13. Arginine uptake with mNAT3 knockdown in MIN6 cells.............. 32 Figure 14. Insulin secretion with mNAT3 knockdown in MIN6 cells ............. 33 Figure 15. Arginine uptake measurements in MIN6 cells electroporated with Slc7a3 siRNA ....................................................................................................
34
Figure 16. Insulin secretion with Slc7a3 knockdown in MIN6 cells................. 34 Figure 17. Knockdown of both Slc38a4 and Slc7a3 in MIN6 cells .................... 35 Figure 18. Tissue metabolism with low insulin................................................... 43 Figure 19. Main pathways of insulin signaling ................................................... 47 Figure 20. Mechanism of insulin-mediated nuclear exclusion of Foxa2 in liver tissue ..................................................................................................................
53
Figure 21. Slc38a4 is regulated by Tcf1 in both pancreatic islet and liver tissues..........................................................................................................................
56
Figure 22. Slc38a4 has two distinct transcriptional start sites ........................... 57 Figure 23. Both transcriptional isoforms of Slc38a4 are regulated by Tcf1 ..... 58

x
Figure 24. Slc38a4 regulation by fasting and by insulin in the liver of C57Bl/6J mice............................................................................................................
59
Figure 25. Slc38a4 regulation by Foxa2................................................................. 61 Figure 26. Putative Tcf1 and Foxa2 binding sites in the Slc38a4 “islet” isoform promoter ......................................................................................................
62
Figure 27. Mutation of the Tcf1/Foxa2 site leads to decreased transactivation by both transcription factors in a luciferase reporter gene assay............................................................................................................................
63 Figure 28. EMSA using oligonucleotides for the putative Tcf1/Foxa2 binding site in the Slc38a4 “islet” promoter..........................................................
65
Figure 29. Putative Tcf1 and Foxa2 binding sites in the Slc38a4 “liver” promoter.....................................................................................................................
66
Figure 30. Mutation of the Tcf1 and Foxa2 sites leads to decreased transactivation by both transcription factors in a luciferase reporter gene assay............................................................................................................................
67 Figure 31. EMSA using oligonucleotides for the putative Tcf1 and Foxa2 binding sites in the Slc38a4 “liver” promoter .......................................................
69
Figure 32. Tcf1 and Foxa2 act synergistically to transactivate through the Slc38a4 “islet” and “liver” isoform promoters .....................................................
71
Figure 33. Foxa2 binds to the Slc38a4 promoters in vivo................................... 72 Figure 34. Foxa2 leads to increased arginine uptake by perfused mouse livers............................................................................................................................
73

1
CHAPTER 1
INTRODUCTION TO ISLET STUDIES
1.1 Introduction
Insulin is a polypeptide hormone that coordinates energy fuel metabolism
and generation in different tissues of the body. It is produced by the beta-cells of
the islets of Langerhans, which are clusters of cells that make up 1% of the
pancreas. Insulin is secreted by the beta-cells in response to increases in blood
glucose, certain amino acids, and fatty acid levels. Thus, insulin secretion is a
marker for the “fed” state; accordingly, its metabolic effects are anabolic, leading
to synthesis of glycogen from glucose, triacylglycerols from fatty acids, and
protein from amino acids. In a “fasted” state, insulin levels are low in the body.
The body responds by maintaining glucose levels through glycogen breakdown
and gluconeogenesis, as well as by generating ketone bodies through lipolysis
and fatty acid oxidation, in order to maintain a steady source of energy for all the
tissues in the body.
In this thesis, we examined the relationship between insulin and amino
acid transport. As described before, amino acids stimulate the secretion of
insulin. In fact, before the oral glucose tolerance test, insulin secretion defects
were formerly diagnosed in the clinic by a test where a bolus of arginine was
administered and the resulting levels of insulin in the blood were measured.
Despite the fact that arginine-induced insulin secretion has been long-established

2
and used as a diagnostic tool in the clinic, little is known about the mechanism
and the molecules involved. We endeavored to identify genes that may be
involved in arginine-stimulated insulin secretion to gain a better understanding
of the insulin secretion process. Given the current global epidemic of type 2
diabetes, which is characterized by insulin resistance and/or abnormal insulin
secretion, we were interested to learn about alternative pathways leading to
insulin secretion, in hopes that they may either shed light on the pathogenesis of
diabetes or be manipulated for therapeutic purposes.
We also looked at the relationship of insulin signaling and amino acid
transport in the liver in our study. As described before, when the body is in a
“fasted” state, insulin levels are low. This triggers the body to increase glucose
production, either through glycogen breakdown or by gluconeogenesis. The
liver is the site of 90% of gluconeogenesis in the body. Amino acids are used as
substrates for gluconeogenesis. Thus, to address the increase in amino acid
consumption for gluconeogenesis, the liver needs to increase the uptake of amino
acids during periods of fasting. The molecular mechanisms linking insulin
action to hepatic amino acid transport were examined in this thesis, and are
described later in Chapters 4 through 6.
1.2 Diabetes mellitus
Diabetes is an endocrine disorder in which there is a deficiency in insulin
action. There are two main forms of diabetes: type 1 diabetes is characterized by

3
an absolute insulin deficiency due primarily to an autoimmune-mediated
destruction of pancreatic beta-cells, while type 2 diabetes, which comprises about
90% of diabetes cases, is characterized by insulin resistance and/or abnormal
insulin secretion (Zimmet et al., 2001). The number of people worldwide with
either type of diabetes was estimated at 150 million in 2001. The number of affect
people was also predicted to increase to 220 million in 2010 and 300 million in
2025. The increase in the prevalence of diabetes is mostly due to an epidemic of
type 2 diabetes, which is strongly associated with a sedentary lifestyle and
obesity (Zimmet, 1999). Sharp rises in the incidence of type 2 diabetes have been
observed in both developed and developing countries (Zimmet, 1999).
People with diabetes are susceptible to a variety of complications that
cause morbidity and premature death, including accelerated atherosclerosis,
retinopathy, nephropathy, neuropathy, and foot ulcers. In fact, diabetic
retinopathy is the leading cause of blindness in the United States; in addition,
diabetic nephropathy is the leading cause of end-stage renal disease in the U.S.
Because of the morbidity and mortality associated with diabetes, a lot of focus
has been placed prevention of complications. In a study performed by the
Diabetes Control and Complications Trial Research Group in 1993, it was
established that intensive control of blood glucose levels was useful in the
prevention of the retinopathy, neuropathy, and nephropathy associated with
diabetes.

4
In addition to the treatment of diabetes, much attention has also been
placed on the prevention of diabetes. Many studies have been directed at
identifying people who are at an increased risk of developing type 2 diabetes.
Most of these studies have focused on individuals with impaired glucose
tolerance (IGT). Subjects are given an oral glucose load, and blood glucose levels
are determined two hours following the glucose administration. Individuals
with IGT have blood glucose levels intermediate between normal and diabetic
individuals. In addition, people with increased fasting glucose levels have also
been shown to have a greater risk of developing type 2 diabetes.
1.3 Maturity-onset diabetes of the young (MODY)
The understanding of the progression of diabetes also requires an
understanding of the mechanisms that control insulin secretion and mediate
insulin actions. In the study of insulin secretion, animal model systems become
especially important since it is difficult to take pancreatic islet biopsies from
patients to study insulin secretion. In order to understand the changes that occur
in diabetes, diabetic animal models are also important for comparison. Type 2
diabetes is generally a multifactorial disease, associated with ethnicity and
gender, as well as advanced age, making it difficult to model in an animal system
(Groop, 1997). However, there also exists a form of diabetes that is caused by
mutations in a single gene, called maturity-onset diabetes of the young (MODY).
Since diabetes is caused by a single gene mutation in MODY, the MODY genes

5
have been used as targets for genetic mouse manipulations to generate animal
models of diabetes.
MODY accounts for 1-2% of all diabetes cases, and is characterized by
development of diabetes early in life (often before the age of 25) and autosomal
dominant inheritance. So far, six genes have been identified, which lead to
MODY when mutated (Table 1): hepatocyte nuclear factor 1α (HNF1α, TCF1),
hepatocyte nuclear factor 1β (HNF1β, TCF2), hepatocyte nuclear factor 4 (HNF4),
pancreatic and duodenal homeobox gene 1 (PDX1), neuroD1, and glucokinase
(Frayling et al., 2001; Fajans et al., 2001). The glucokinase gene encodes an
enzyme that catalyzes the first step in glycolysis, which is essential for generating
the metabolic signal to stimulate insulin secretion in response to glucose
(Matchinsky, 2000). All of the other MODY genes encode transcription factors
that are important in multiple metabolic pathways (Shih and Stoffel, 2002).

6
Studies of the MODY genes and their function in animal models have
uncovered many diverse processes that are essential for proper maintenance
levels. These processes range from mechanisms by which pancreatic beta-cells
detect glucose, to neuroendocrine tissue development during embryogenesis, to
beta-cell hyperplasia as an adaptive response to maintain normal glucose levels
during physiological growth or in obesity (Matchinsky, 2005; Sander and
German, 1997; Akpinar et al. 2005).
1.4 MODY3 and TCF1
Maturity-onset diabetes of the young type 3 (MODY3) is the most
common of all the MODYs, accounting for 70% of all MODY cases. MODY3 is
caused by mutations in the TCF1 gene. TCF1 encodes a homeodomain
transcription factor composed of an amino-terminal dimerization domain, a
POU-homeobox DNA-binding domain, and a carboxy-terminal transactivation
domain (Mendel and Crabtree, 1991). Tcf1 is expressed in the liver, kidney,
intestines, and pancreatic islets (Blumenfeld et al., 1991). There is no defect in
insulin action in MODY3 patients; thus, impaired beta-cell function appears to be
the primary cause of diabetes in these patients (Fajans et al., 2001). MODY3
patients demonstrate a defect in glucose- and arginine-induced insulin secretion
as well as hypersensitivity to sulfonylurea therapy. In addition, MODY3 patients
may also have glycosuria, resulting from decreased renal reabsorption of glucose
(Menzel et al., 1998; Pontoglio et al., 2000). Depending on glycemic control, these

7
patients may suffer the full spectrum of diabetic complications, including
blindness and kidney failure (Fajans et al., 2001).
Tcf1 has been genetically knocked out in mice (Pontoglio et al., 1996; Lee
et al., 1998). Unlike in humans, where a single defective Tcf1 allele leads to
disease, the Tcf1 +/- mice have no detectable phenotype. Tcf1 -/- mice have
been shown to have a phenotype of defective glucose- and arginine-induced
insulin secretion and hypersensitivity to sulfonylureas, as well as dwarfism,
renal Fanconi-like syndrome, and defects in bile acid and plasma HDL-
cholesterol metabolism (Pontoglio et al., 1996; Lee et al., 1998; Pontoglio et al.,
1998; Shih et al., 2001). When normalized to pancreatic weight, the insulin
content of the Tcf1 -/- mice was 60% that of wild-type littermates (Pontoglio et
al., 1998). However, insulin secretion in response to arginine by Tcf1 -/- islets
was about 13% of the insulin response found in Tcf1 +/+ islets; a similar
decrease in insulin secretion by Tcf1 -/- was found with glucose stimulation
(Pontoglio et al., 1998). Thus, decreased insulin content cannot account for the
decrease in insulin secretion by the Tcf1 -/- islet. Other parts of the insulin
secretion pathway need to be examined.
1.5 Insulin secretion mechanisms
Insulin secretion by pancreatic beta-cells is a physiologic response to
changes in their environment (for example, changes in the extracellular glucose
concentration), that has been adapted to maintain fuel homeostasis in the entire

8
organism. To stimulate insulin secretion, glucose is first taken up and
metabolized by the pancreatic beta-cell. Glycolysis leads to an increase in the
ATP/ADP ratio that leads to closure of ATP-sensitive potassium channels. The
ATP-sensitive potassium channels are normally open for the positively charged
potassium ions to leave the cell, following the electrochemical gradient. Upon
their closure, potassium is sequestered inside the cell, which leads to
depolarization of the cell membrane. Calcium is then released into the cytoplasm
via voltage-dependent calcium channels, which in turn leads to extracellular
release of insulin from the insulin-containing granules of the cell.
In addition, the metabolism of glucose leads to an increase in cAMP, from
the cyclization of the generated ATP by adenylate cyclases. This increase in
cAMP leads to activation of protein kinase A (PKA). PKA inactivates ATP-
sensitive potassium channels, leading to increased membrane depolarization. In
addition, both PKA and cAMP-regulated guanine nucleotide exchange factor II
(cAMP-GEFII) increase mobilization of calcium from intracellular stores, which
further increases the release of insulin granules.
The gastrointestinal tract also secretes hormones as a physiologic response
to changes in food intake, which allow the body to adapt to maintain fuel
homeostasis. The glucose-dependent insulinotropic polypeptide (GIP) and the
glucagon-like peptide 1 (GLP-1) have been the most studied of these gut-derived
peptide hormones. These peptide hormones which cause an augmentation of the

9
insulin secretion response after oral glucose intake compared with intravenous
glucose intake are termed incretin hormones.
GIP is a peptide secreted from K-cells that are found in the small intestinal
mucosa, mostly in the duodenum (Mortensen et al., 2003). GIP plasma
concentration is increased 10- to 20-fold following meal ingestion, with secretion
stimulated by carbohydrates and lipids. Interaction between GIP and its receptor
on islet cells, a type II G protein-coupled receptor, causes an increase in cAMP
levels that lead to increased insulin secretion via the mechanisms described
above.
GLP-1 is secreted by L-cells of the intestinal mucosa. Binding of GLP-1 to
the GLP-1 receptor, a member of the same family as the GIP receptor, causes
activation of adenylate cyclase resulting in an increase in cAMP formation, as
with GIP (Mayo et al., 2003; Holz, 2004). GLP-1 also stimulates gene
transcription and biosynthesis of insulin (Fehmann and Habener, 1992), as well
as transcription of other genes involved in insulin secretion, such as glucokinase
and GLUT2 (Buteau et al., 1999). In addition, GLP-1 has been shown to stimulate
beta-cell proliferation and inhibit beta-cell apoptosis (Stoffers et al., 2000; Xu et
al., 1999; Farilla et al., 2003; Li et al., 2003). Studies with a GLP-1 receptor
antagonist suggest that GLP-1 plays a significant role in controlling post-prandial
glucose levels with oral glucose intake in rats (Kolligs et al., 1995; Wang et al.,
1995), as well as in humans (Edwards et al., 1999).
10
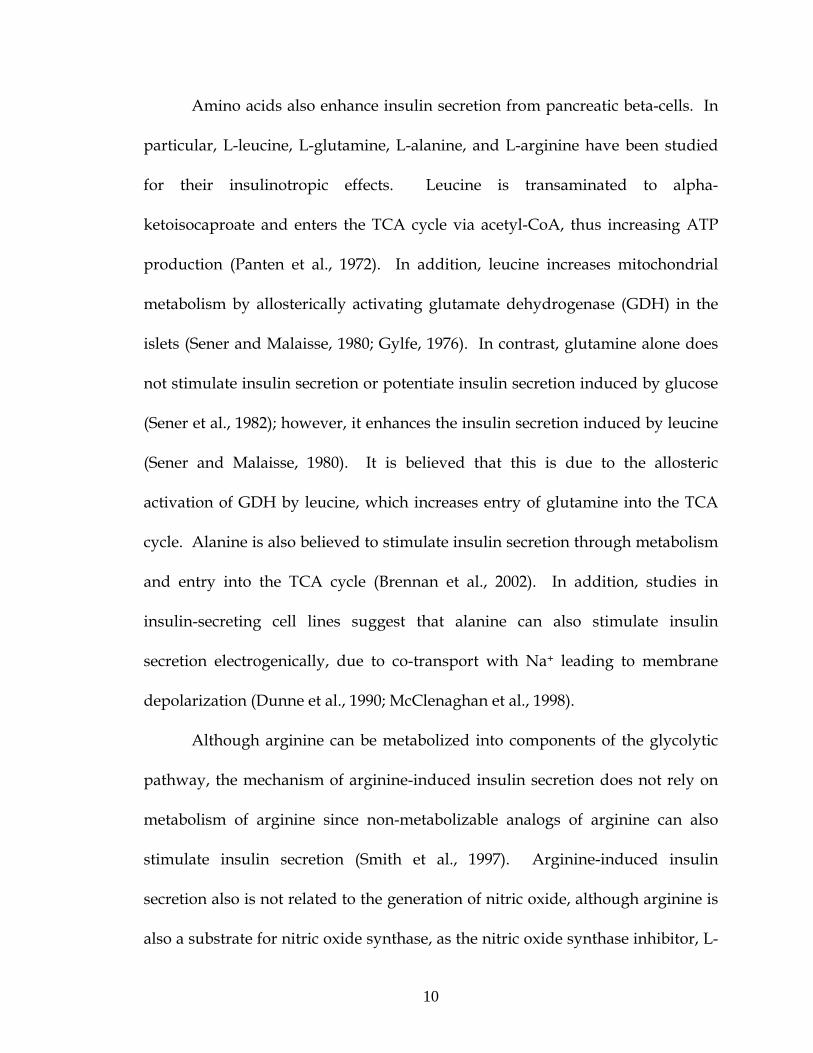
Amino acids also enhance insulin secretion from pancreatic beta-cells. In
particular, L-leucine, L-glutamine, L-alanine, and L-arginine have been studied
for their insulinotropic effects. Leucine is transaminated to alpha-
ketoisocaproate and enters the TCA cycle via acetyl-CoA, thus increasing ATP
production (Panten et al., 1972). In addition, leucine increases mitochondrial
metabolism by allosterically activating glutamate dehydrogenase (GDH) in the
islets (Sener and Malaisse, 1980; Gylfe, 1976). In contrast, glutamine alone does
not stimulate insulin secretion or potentiate insulin secretion induced by glucose
(Sener et al., 1982); however, it enhances the insulin secretion induced by leucine
(Sener and Malaisse, 1980). It is believed that this is due to the allosteric
activation of GDH by leucine, which increases entry of glutamine into the TCA
cycle. Alanine is also believed to stimulate insulin secretion through metabolism
and entry into the TCA cycle (Brennan et al., 2002). In addition, studies in
insulin-secreting cell lines suggest that alanine can also stimulate insulin
secretion electrogenically, due to co-transport with Na+ leading to membrane
depolarization (Dunne et al., 1990; McClenaghan et al., 1998).
Although arginine can be metabolized into components of the glycolytic
pathway, the mechanism of arginine-induced insulin secretion does not rely on
metabolism of arginine since non-metabolizable analogs of arginine can also
stimulate insulin secretion (Smith et al., 1997). Arginine-induced insulin
secretion also is not related to the generation of nitric oxide, although arginine is
also a substrate for nitric oxide synthase, as the nitric oxide synthase inhibitor, L-

11
NMMA, does not inhibit insulin secretion (Smith et al., 1997; Henningsson and
Lundquist, 1998). Instead, it is believed that arginine stimulates insulin secretion
by directly depolarizing the cell through its entry, since it is a basic amino acid
carrying a positive charge (Figure 1). In agreement with this theory, it has been
shown that arginine cannot further stimulate insulin secretion in maximally
depolarized islet cells. Furthermore, arginine analogs that still carry a positive
charge, such as the nitric oxide inhibitor L-NMMA, can also stimulate insulin
secretion (Smith et al., 1997; Sener et al., 2000).

12
1.6 Insulin secretion defects in the Tcf1 -/- pancreatic islets
As described before, Tcf1 -/- mice have a defect in glucose-induced
insulin secretion. Through whole-cell voltage clamp experiments, it was found
that the ability of glucose to induce closure of ATP-dependent potassium
channels is significantly reduced in Tcf1 -/- beta-cells compared to Tcf1 +/+ and
+/- beta-cells (Dukes et al., 1998). In contrast, the ability for membrane
depolarization to trigger calcium influx is intact in the Tcf1 -/- islets (Pontoglio et
al., 1998). Thus, the defect in Tcf1 -/- insulin secretion pathway lies upstream of
membrane depolarization.
Tcf1 -/- mice also have a defect in arginine-induced insulin secretion. In
contrast to glucose, which depolarizes the beta-cell via closure of ATP-dependent
potassium channels, arginine is believed to depolarize the beta-cell itself upon
entry. Since the insulin secretion pathway downstream of membrane
depolarization is intact in Tcf1 -/- beta-cells, the defect in arginine-induced
insulin secretion may be due to a decrease in arginine uptake. Thus, the study of
arginine transporters and their regulation by Tcf1 may be the key to identifying
the molecular players involved in arginine-induced insulin secretion and
understanding the Tcf1 -/- beta-cell pathology.
1.7 Arginine transporters
Arginine transport into cells can be mediated by four established classes
of cationic amino acid transporters: system y+, system y+L, system b0+, and

13
system B0+ (Deves and Boyd, 1998). These classes have been defined based on
ion dependency, substrate specificity, and relative affinity. In addition to these
four systems, there is also a member of system N that has is reported to transport
arginine; however, arginine transport by this transporter has not been well-
characterized. The general characteristics of each family is outlined in Table 2.
System y+ is made up of four members: CAT1, CAT2, CAT3, and CAT4,
which are encoded by Slc7a1, Slc7a2, Slc7a3, and Slc7a4, respectively. In contrast
to members of the other classes, these transporters are selective for cationic
amino acids only (Verrey et al., 2004). Each transporter has 14 putative
transmembrane domains and is glycosylated. Cationic amino acid transport
mediated by these transporters is Na-independent. Within this family, CAT1,
CAT2, and CAT3 are more closely related to each other (~60% identity) than to

14
CAT4 (~40% identity) (Verrey et al., 2004). The function of CAT4 has been under
debate: while it was first characterized as being able to mediate cationic amino
acid transport (Sperandeo et al., 1998), other groups have not been able to detect
this activity (Wolf et al., 2002).
System y+L activity is mediated by heterodimeric transporters, comprised
of a heavy chain subunit, 4F2hc, encoded by Slc3a2, linked via disulfide bonds to
a light chain subunit, either y+LAT-2 or y+LAT-1, encoded by Slc7a6 and Slc7a7,
respectively. The light chain subunits contain 12 putative membrane-spanning
domains and are not glycosylated. The heavy chain subunit, 4F2hc, is a single
membrane-spanning glycoprotein, and is required for surface expression of the
light chains (Wagner et al., 2001). These transporters mediate Na-independent
transport of cationic amino acids, as well as the Na-dependent uptake of neutral
amino acids (Deves et al., 1992; Torrents et al., 1998). While the physiological
role of y+LAT-2 is not clear at present, mutations in y+LAT-1 have been found to
be the underlying cause of the hereditary lysinuric protein intolerance disease
(Shoji et al., 2002; Sperandeo et al., 2005).
System b0+ activity is mediated through a heterodimer of b0+AT
(encoded by Slc7a9) and rBAT (encoded by Slc3a1). It is characterized by Na-
independent transport of cationic and neutral amino acids. The heterodimer is
primarily expressed in the small intestine and the kidney, where it is localized to
the basolateral membrane, as well as in the pancreas (Bertran et al., 1993). Like
y+LAT-1 and y+LAT-2, b0+AT has 12 putative transmembrane domains. rBAT,

15
similar to 4F2hc, has only one transmembrane domain and is glycosylated.
Mutations in rBAT have been linked to cystinuria, a hereditary disease that
involves defective transepithelial transport of cystine and dibasic amino acids in
the kidney and intestine (Calonge et al., 1994).
System B0+ activity is mediated by ATB0+ (encoded by Slc6a14), a
member of the neurotransmitter transporter family, and is characterized by Na-
and Cl-dependent cationic and neutral amino acid transport. It has been shown
that the SLC6A14 is associated with obesity through genetic screening of obese
Finnish families (Suviolahti et al., 2003). It was hypothesized that the transporter
may be important for increasing the availability of tryptophan, which is used to
synthesize serotonin, a neurotransmitter that increases satiety. This would be
due either to an increase of amino acid absorption from the intestinal tract, or to
increased uptake by target cells. In addition, ATB0+ is believed to play a key
role in transepithelial transport of arginine in airway cells, which is important for
providing a substrate for nitric oxide synthase to airway cells, as well as
regulating the amino acid concentration in airway surface fluids (Galietta et al.,
1998; Rotoli et al., 2005).
mNAT3 (encoded by Slc38a4) was first characterized by Sugawara et al. as
an amino acid transporter expressed mainly in the liver. The transporter was
named ATA3, since they had classified it originally as a system A amino acid
transporter (2000). The group further characterized the transporter as mediating
both neutral and cationic amino acid transport, with a higher affinity for cationic

16
amino acids (Hatanaka et al., 2001). However, uptake at different doses and
kinetic studies of cationic amino acid transport was not performed in these
studies. Slc38a4 was later classified as a system N amino acid transporter, due to
its inability to transport methylaminoisobutyric acid, which is a characteristic of
the system A transporters. In addition, in these later studies there was no
detectable transport of cationic amino acids by mNAT3 (Gu et al., 2003). Thus,
the ability of mNAT3 to mediate cationic transport is unclear.
1.8 Experimental study
We were interested in understanding the mechanism of arginine-induced
insulin secretion and the molecules involved. Tcf1 -/- mice provided us with a
unique model to identify molecules that are involved in arginine uptake by
pancreatic beta-cells. Tcf1 -/- mice have a defect in arginine-induced insulin
secretion and functional analysis of the Tcf1 -/- beta-cells have demonstrated
that this defect is upstream of membrane depolarization. Since arginine is
believed to stimulate insulin secretion by direct depolarization of the beta-cell
upon uptake, a defect in arginine-induced insulin secretion may be cause by
decreased arginine uptake.
We hypothesized that the defective arginine-induced insulin secretion in
Tcf1 -/- mice is due to a defect in arginine uptake. In this thesis, we sought to
identify the transporters that may be involved in uptake of arginine by beta-cells.
We characterized arginine uptake by insulin secreting cells, as well as arginine

17
transport by the Slc38a4 gene product, mNAT3, which had not been well-
characterized but was believed to mediate cationic amino acid transport. In
addition, we examined the expression and regulation by Tcf1 of arginine
transporters in insulin-secreting cells through both gene expression arrays
analysis and RT-PCR screening.

18
CHAPTER 2 -- RESULTS PART I
2.1 Characterization of arginine uptake by MIN6 cells
We hypothesized that cellular entry of arginine into the pancreatic islet
cell and the subsequent membrane depolarization were sufficient to stimulate
insulin secretion. Since arginine transport is the key step in arginine-induced
insulin secretion, we first sought to characterize arginine uptake by insulin-
secreting cells. Radioactive ligand uptake assays were performed on monolayers
of mouse insulinoma cells (MIN6).
2.1.1 Timecourse of arginine uptake by MIN6 cells
We assayed the amount of arginine uptake by MIN6 cells over ten
minutes using uptake buffer containing 10μM arginine. Uptake of 3H-arginine in
Tyrode’s solution was found to be linear over four minutes (Figure 2).
Thereafter, arginine uptake assays were measured after two minutes.
19
2.1.2 Dose-dependence of arginine uptake by MIN6 cells
We assayed 3H-arginine uptake with arginine concentrations ranging
from 10nM to 20mM in the uptake buffer. Uptake was measured after two
minutes. We found that MIN6 cells take up arginine in a dose-dependent
manner (Figure 3).

20
2.1.3 Kinetics of arginine uptake by MIN6 cells
To determine the Michaelis-Menten constant, Km, and the maximum
velocity, Vmax, of arginine uptake by MIN6 cells, we measured the uptake of
arginine after two minutes with varying concentrations of arginine. Inverse
velocity was plotted against inverse arginine concentration to obtain a
Lineweaver-Burk plot (Figure 4). The inverse y-intercept, taken as Vmax, was
0.154 pmoles/μg total protein per second. By multiplying the Vmax to the slope
of the line, we calculated the Km of MIN6 arginine uptake to be 102.6μM.

21
2.1.4 Effect of ion substitution on arginine uptake by MIN6 cells
In addition to determining the kinetics of arginine uptake by MIN6 cells,
we wanted to further characterize uptake based on Na- and Cl-dependence. To
address this, we modified the uptake buffer to be either Na- or Cl-free and
determined the effect on arginine uptake. For the Na-free experimental buffer,
we replaced NaCl with choline chloride and used KOH instead of NaOH to
adjust the pH. For the Cl-free experimental buffer, we replaced Cl with
gluconate for NaCl, KCl, and CaCl2; MgCl2 was replaced with MgSO4. We found
a 37% decrease in arginine uptake with the Na-free buffer, while substitution of

22
Cl lead to no significant change in uptake (p>0.05 by student’s t-test). Thus,
arginine uptake by MIN6 cells is partly Na-dependent and is Cl-independent.
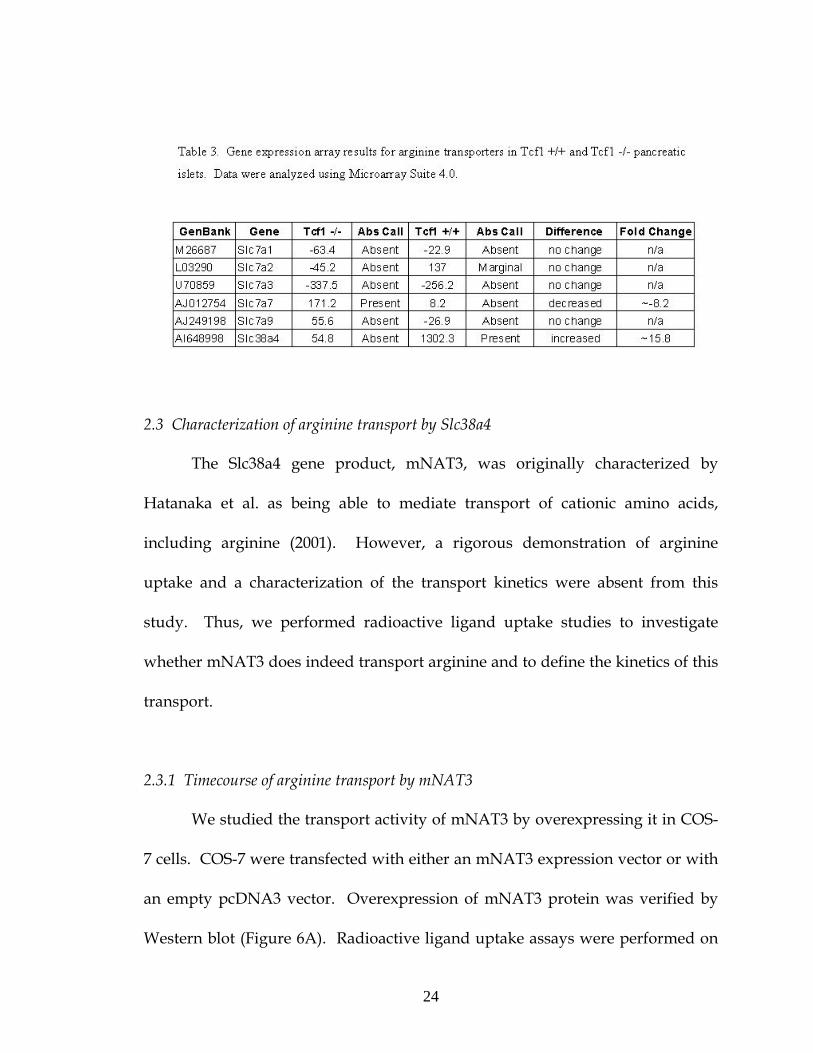
2.2 Gene expression array analysis of Tcf1 +/+ and Tcf1 -/- pancreatic islets
Since arginine-induced insulin secretion depends on the depolarization
upon cellular entry, we hypothesized that the arginine-induced insulin secretion
defect in the Tcf1 -/- mice may be due to a defect in arginine uptake. Thus, by
studying the transport of arginine into insulin-secreting cells and the
transporters that mediate it, we may better understand the molecular basis of this
phenotype. To identify any factors that may contribute to the defect in insulin
secretion in the Tcf1 -/- mice, we analyzed gene expression in pancreatic islets

23
using Affymetrix oligonucleotide expression probe arrays, MG-U74A, MG-U74B,
and MG-U74C.
Two RNA samples were generated from pancreatic islets of either Tcf1
+/+ or Tcf1 -/- mice. The RNA from the islets of roughly fifty mice was pooled
to generate each RNA sample. Two probe sets were made from each RNA
sample, and each probe was analyzed on separate chips. Gene expression
analysis values differed by less than 2% for the two probe sets generated from
the Tcf1 +/+ RNA, and by less than 10% for the two probes generated from the
Tcf1 -/- RNA, verifying consistency in probe generation and in gene chip
hybridization. Comparison of gene expression levels between Tcf +/+ and -/-
samples were performed using Microarray Suite 4.0.
Since Tcf1 is known to be a transcriptional activator, only genes that were
expressed at higher levels in Tcf1 +/+ islets were considered as potential direct
targets of Tcf1. We identified the amino acid transporter gene, Slc38a4, which
encodes mNAT3, as a potential target of Tcf1 through the gene chip screen with
approximately 15.8-fold increased expression in the Tcf1 +/+ samples compared
to Tcf1 -/- samples (Table 3). Five other genes of arginine transporters were
represented on the gene chips: Slc7a1, Slc7a2, Slc7a3, Slc7a7, and Slc7a9. All of
these other transporters represented on the microarray showed too low levels of
expression to demonstrate a difference in expression levels between Tcf1 +/+
and Tcf1 -/- samples upon data analysis, except for Slc7a7, which had
“decreased” levels in the Tcf1 +/+ samples.
24
2.3 Characterization of arginine transport by Slc38a4
The Slc38a4 gene product, mNAT3, was originally characterized by
Hatanaka et al. as being able to mediate transport of cationic amino acids,
including arginine (2001). However, a rigorous demonstration of arginine
uptake and a characterization of the transport kinetics were absent from this
study. Thus, we performed radioactive ligand uptake studies to investigate
whether mNAT3 does indeed transport arginine and to define the kinetics of this
transport.
2.3.1 Timecourse of arginine transport by mNAT3
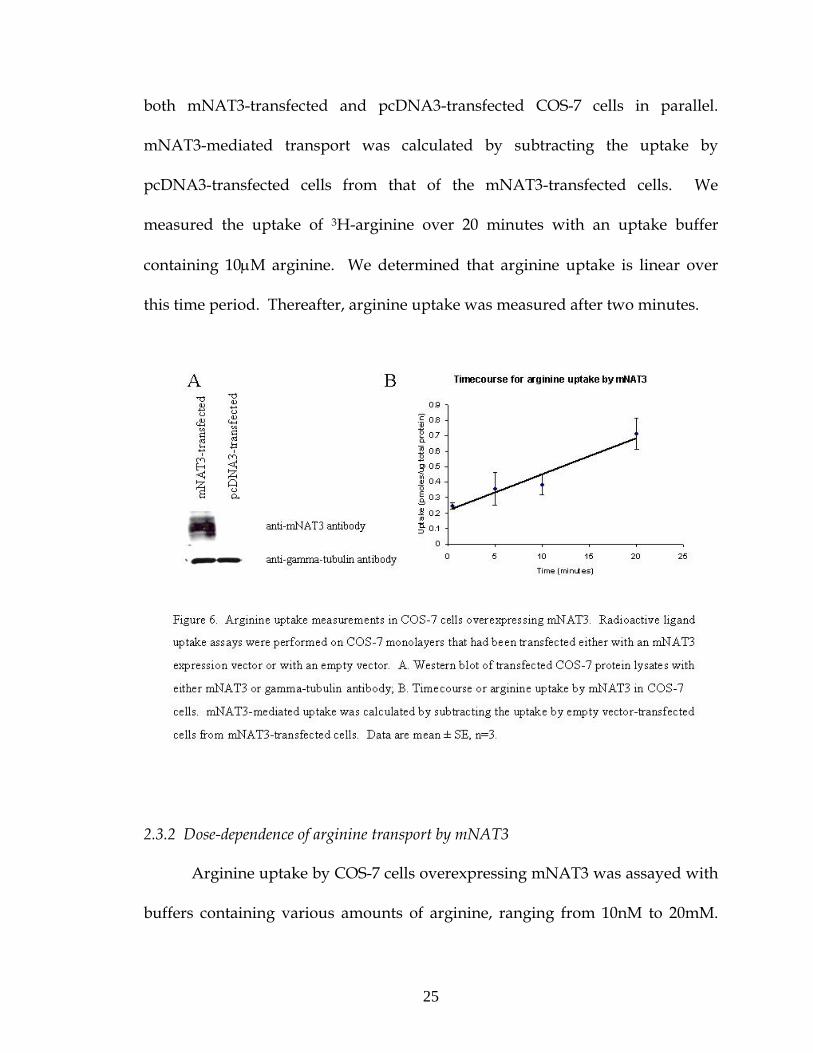
We studied the transport activity of mNAT3 by overexpressing it in COS-
7 cells. COS-7 were transfected with either an mNAT3 expression vector or with
an empty pcDNA3 vector. Overexpression of mNAT3 protein was verified by
Western blot (Figure 6A). Radioactive ligand uptake assays were performed on
25
both mNAT3-transfected and pcDNA3-transfected COS-7 cells in parallel.
mNAT3-mediated transport was calculated by subtracting the uptake by
pcDNA3-transfected cells from that of the mNAT3-transfected cells. We
measured the uptake of 3H-arginine over 20 minutes with an uptake buffer
containing 10μM arginine. We determined that arginine uptake is linear over
this time period. Thereafter, arginine uptake was measured after two minutes.
2.3.2 Dose-dependence of arginine transport by mNAT3
Arginine uptake by COS-7 cells overexpressing mNAT3 was assayed with
buffers containing various amounts of arginine, ranging from 10nM to 20mM.

26
Uptake was assayed after two minutes, and the 3H-arginine uptake by pcDNA-
transfected COS-7 cells was subtracted from the uptake of mNAT3-transfected
cells to obtain the arginine uptake due to mNAT3. We determined that arginine
uptake mediated by mNAT3 is dose-dependent (Figure 7).
2.3.3 Kinetics of arginine transport by mNAT3
We measured the mNAT3-mediated uptake of arginine with varying
concentrations of arginine and plotted the inverse velocity against inverse
arginine concentration to obtain a Lineweaver-Burk plot (Figure 8). From this

27
plot, we determined the Vmax of mNAT3-mediated arginine uptake to be 0.039
pmoles/s per μg total protein. The Km was calculated to be 53μM.
2.3.4 Effect of ion substitution on arginine transport by mNAT3
We also measured mNAT3-mediated arginine uptake in COS-7 cells using
Na- and Cl-free buffers to determine whether this transport is Na- or Cl-
dependent. In the absence of sodium, we found that arginine uptake by mNAT3
was decreased by 55%. In the absence of chloride, arginine uptake was
decreased by 32%. Thus, arginine transport by mNAT3 is partly both Na- and
Cl-dependent.

28
2.4 Tissue expression of arginine transporters
We established that mNAT3 is a transporter of arginine. To better
understand its role in arginine uptake in insulin-secreting cells, we wanted to see
which, if any, other arginine transporters were expressed in insulin-secreting
cells. We generated a cDNA tissue panel, to be able to look at relative RNA
expression levels of the various amino acid transporters in different tissues.
Using gene-specific primers, we performed RT-PCR with the tissue panel for
each arginine transporter. We found that of the eleven known arginine
transporters, eight were expressed in islets and MIN6 cells (Figure 10). In

29
addition to Slc38a4, insulin-secreting cells were determined to also express the
Slc7a1, Slc7a2, Slc7a3, Slc7a4, Slc7a6, Slc7a7, and Slc3a2 genes.
2.5 Arginine transporter expression in Tcf1 +/+ and -/- pancreatic islets
Since we were interested in determining whether the arginine-induced
insulin secretion defect in Tcf1 -/- mice could be due to a defect in arginine
uptake by the insulin-secreting cells, we sought to determine which of these eight
arginine transporters were regulated by Tcf1. Using semi-quantitative RT-PCR,
we examined the expression levels of each arginine transporter in a pancreatic

30
islet cDNA panel from Tcf1 +/+ and Tcf1 -/- mice. Of the eight arginine
transporters expressed in the islets, we found only Slc7a3, Slc7a7, and Slc38a4 to
be expressed at significantly different levels in Tcf1 +/+ and Tcf1 -/- islets
(Figure 11). In good correlation to the results of the gene expression array
results, Slc38a4 was found to be downregulated in the Tcf1 -/- islets compared to
Tcf1 +/+. In similar agreement to the gene expression array results, we found
Slc7a7 to be upregulated in the Tcf1 -/- islets. While the expression levels of
Slc7a3 were too low to be able to yield a comparison between Tcf1 +/+ and -/-
expression levels in the gene chip study, we found through RT-PCR that Slc7a3,
like Slc38a4, is downregulated in the Tcf1 -/- islets.

31
2.6 Arginine uptake and insulin secretion with Slc38a4 (mNAT3) and Slc7a3 (CAT3)
knockdown
We were interested to know whether a defect in arginine uptake by
insulin-secreting cells was the cause of the defect in arginine-induced insulin
secretion in Tcf1 -/- mice. Since mNAT3 and CAT3 were the only arginine
transporters whose gene expression was downregulated in Tcf1 -/- islets, we
decided to knockdown expression of these two transporters in MIN6 cells to see
if we could affect arginine uptake and insulin secretion.
2.6.1 Knockdown of Slc38a4 (mNAT3) in MIN6 cells
We electroporated two siRNAs designed to target Slc38a4 into MIN6 cells
to test the effect of Slc38a4 knockdown. We confirmed knockdown of mNAT3 by
Western blot (Figure 12).
Radioactive ligand uptake assays with 3H-arginine were performed on
MIN6 cells to compare arginine transport in cells electroporated with Slc38a4

32
siRNA with cells electroporated with a control siRNA. We found a small but
significant decrease in arginine uptake by MIN6 cells with Slc38a4 siRNA (Figure
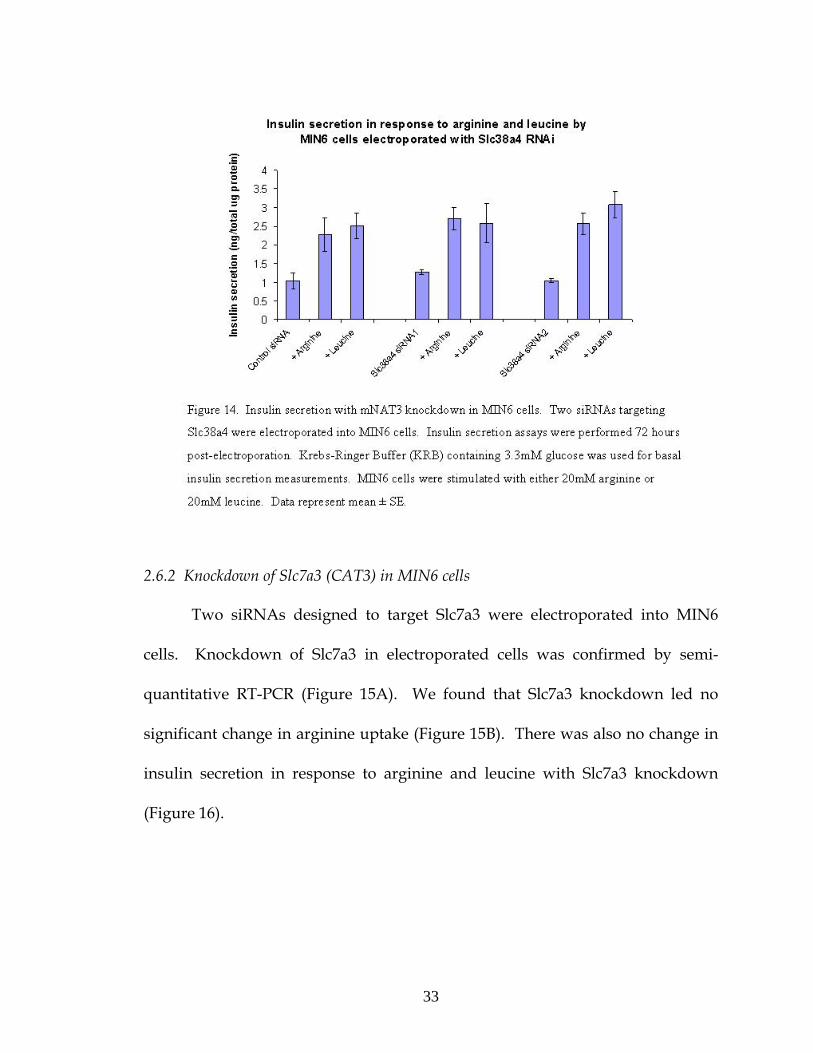
13). Insulin secretion in response to arginine and leucine were also measured
and was found to be unaffected by mNAT3 knockdown (Figure 14).
33
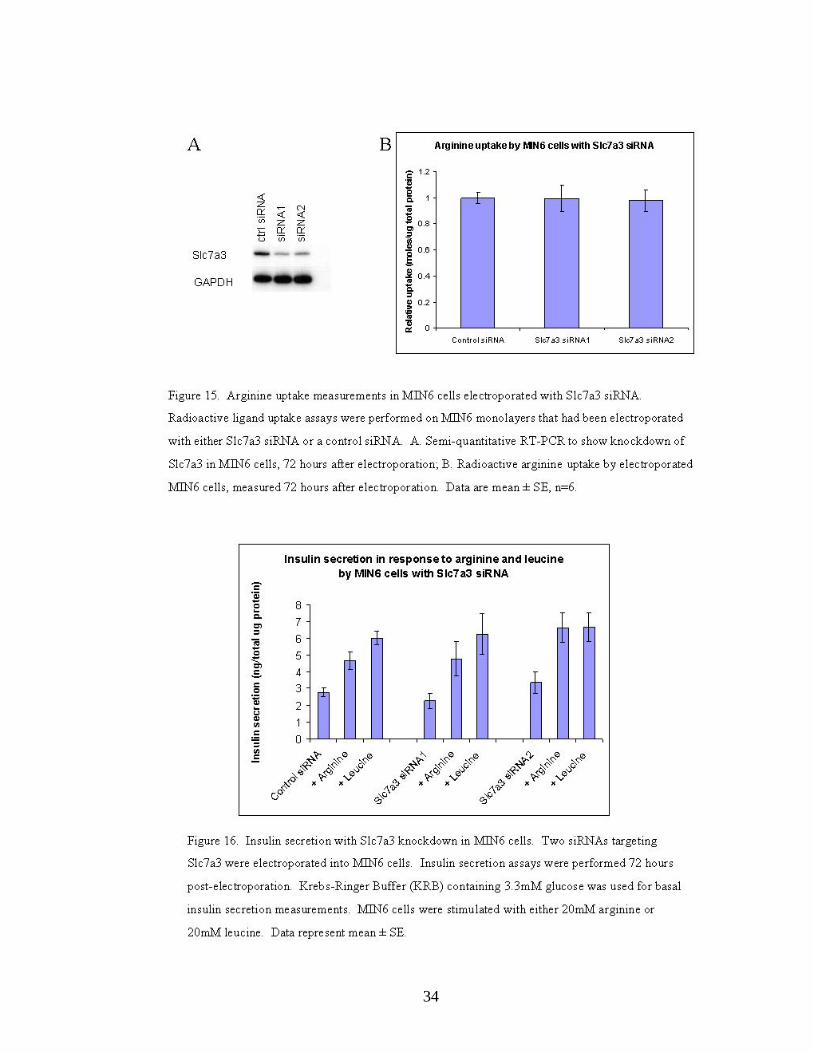
2.6.2 Knockdown of Slc7a3 (CAT3) in MIN6 cells
Two siRNAs designed to target Slc7a3 were electroporated into MIN6
cells. Knockdown of Slc7a3 in electroporated cells was confirmed by semi-
quantitative RT-PCR (Figure 15A). We found that Slc7a3 knockdown led no
significant change in arginine uptake (Figure 15B). There was also no change in
insulin secretion in response to arginine and leucine with Slc7a3 knockdown
(Figure 16).
34

35
2.6.3 Knockdown of both Slc38a4 (mNAT3) and Slc7a3 (CAT3)
We also electroporated MIN6 cells with both Slc38a4 and Slc7a3 siRNA
and examined arginine uptake and insulin secretion. Using the maximal amount
of siRNA for electroporation, we were unable to detect a change arginine uptake
by cells with both Slc38a4 and Slc7a3 siRNA compared with cells with control
siRNA. When we performed insulin secretion assays on these cells, we found no
change in glucose or leucine-induced insulin secretion, and a small increase in
arginine-induced insulin secretion in the cells electroporated with Slc38a4 and
Slc7a3 siRNAs (Figure 17).

36
CHAPTER 3 – DISCUSSION PART I
3.1 Characterization of arginine uptake by insulin-secreting cells
In this study, we identified eight arginine transporters to be expressed in
pancreatic islet tissue. All of these transporters, with the exception of y+LAT-1
encoded by the Slc7a7 gene, are also expressed in MIN6 cells, a mouse
insulinoma cells that constitute a more beta-cell-specific test sample. Thus, we
believe that y+LAT-1 may be exclusively expressed in the non-beta-cells of the
pancreatic islets, such as the glucagon- or somatostatin-producing cells of the
islet.
The expression of seven different arginine transporters in MIN6 cells
suggests that arginine uptake may be a highly redundant function in insulin-
secreting cells. We also characterized the uptake of arginine by insulin-secreting
cells using radioactive ligand uptake studies with MIN6 cells. We determined
the Km for arginine uptake by MIN6 cells to be 102.6μM. This value for uptake
kinetics is consistent with the notion that all seven arginine transporters
expressed may be active in arginine uptake by insulin-secreting cells. The
reported Km values for the seven arginine transporters we have identified to be
expressed in MIN6 cells range from 43μM to 120μM, with the exception of the
CAT2A transporter encoded by Slc7a2 (Kim et al., 1991; Habermeier et al., 2003;
Hosokawa et al., 1997; Pfeiffer et al. 1999; Wells et al., 1992). The CAT2A
transporter has a Km of 3mM, over ten-fold higher than the Km values of

37
arginine uptake by the other expressed transporters and of arginine uptake by
MIN6 cells (Habermeier et al., 2003). This significantly lower substrate affinity
suggests that CAT2A may not have a large role in arginine uptake by insulin-
secreting cells.
We also determined that arginine uptake by MIN6 cells is partly Na-
dependent. This finding is particularly striking because of the seven transporters
expressed in MIN6 cells, all have been reported to be Na-independent for
arginine transport except for mNAT3 encoded by the Slc38a4 gene, which we
had characterized in this study as having partial Na-dependence. This suggests
that mNAT3 normally has a significant role in arginine uptake by MIN6 cells.
However, our experiments with siRNA-mediated knockdown of mNAT3
expression in MIN6 cells have demonstrated that mNAT3 activity is not crucial
for proper arginine uptake and arginine-induced insulin secretion. This further
demonstrates the redundancy of arginine transport activity and the ability for the
other arginine transporters to compensate for the loss of activity of one.
The redundancy of arginine transport function, which is directly linked to
arginine-induced insulin secretion activity, is particularly interesting considering
the clinical use of the arginine bolus test, in which a bolus of arginine is delivered
to patients intravenously and resultant plasma insulin levels are determined.
This test was commonly used in the clinic to diagnose insulin secretion defects,
before the oral glucose tolerance test was developed. Not much was then
understood about the mechanism of arginine-induced insulin secretion and what

38
the test was measuring exactly. Recent studies that have shown that arginine-
induced insulin secretion is due to electrogenic uptake of arginine into the cells
have allowed the possibility that arginine-induced insulin secretion defects may
result from defects in arginine uptake. Our study, which shows seven arginine
transporters that are expressed in insulin secreting cells and that are able to
maintain normal levels of arginine uptake and arginine-induced insulin secretion
with knockdown of two arginine transporters, suggests that arginine uptake in
insulin-secreting cells is highly robust. Thus, it is highly unlikely that any defect
in insulin production from the arginine bolus test would be due to a defect in
arginine uptake. Instead, a defect would most likely be due to a decrease in
insulin content, which is closely linked to islet mass within the pancreas.
3.2 Implications for arginine-induced insulin secretion in Tcf1 -/- mice
Of the eight arginine transporter genes found to be expressed in islets,
only Slc38a4 and Slc7a3 were found to be regulated by Tcf1, using semi-
quantitative RT-PCR analysis of pancreatic islet tissue. Using siRNAs to knock
down expression of these two transporter genes in MIN6 cells, we found that
decreased expression of these genes had no effect on either arginine uptake or
insulin secretion. Thus, we were unable to mimic the insulin secretion defects
found with Tcf1 deficiency with knockdown of these two transporters. These
results suggest that mNAT3 and CAT3 activity is not crucial to maintain normal
arginine uptake and arginine-induced insulin secretion in insulin-secreting cells.

39
We cannot exclude the possibility that the level of siRNA-mediated
knockdown in our study was insufficient to see the effects of total loss of activity
by these transporters. It may be possible that the loss of transport activity by
mNAT3 and CAT3 causes the defect in arginine-induced insulin secretion in the
Tcf1 -/- mice, but that this cannot be modeled using siRNAs in MIN6 cells due to
insufficient transporter knockdown in the MIN6 cells. It is important to note,
however, that even in the Tcf1 -/- islets, there is not complete knockdown of
either transporter.
If loss of mNAT3 and CAT3 activity is not the cause of the arginine-
induced insulin secretion defect in the Tcf1 -/- mice, it is possible that there are
other yet unidentified arginine transporters that are expressed in insulin-
secreting cells and are regulated by Tcf1, which we have not studied. It is also
possible that there is post-transcriptional regulation of arginine transporter
expression and/or function that is affected in the Tcf1 -/- islets of the other
arginine transporters. mNAT3 and CAT3 were identified as the only arginine
transporters downregulated in Tcf1 -/- pancreatic islets through RT-PCR of a
cDNA panel from islets of Tcf1 +/+ and Tcf1 -/- mice. Since Tcf1 is well-
characterized as a transcriptional activator, we sought to identify genes regulated
by Tcf1 at the transcriptional level. However it is possible that Tcf1 may either
directly or indirectly affect the protein expression or activity of arginine
transporters by a mechanism as yet unidentified. Thus, impaired activity of
another arginine transporter, which has no decrease in cDNA expression levels
40
in the Tcf1 -/- islets, may be the cause of defective arginine-induced insulin
secretion in the Tcf1 -/- mice.
To begin examining this possibility, it would be useful to systematically
design siRNAs targeting the other arginine transporters expressed in MIN6 cells,
and assay changes in arginine uptake and insulin secretion. While this would
not identify what causes the arginine-induced insulin secretion defect in Tcf1 -/-
mice, it would identify any transporters with activity that is important for uptake
and insulin-secretion function.
3.3 Tcf1 as a master regulator of transporters
We have demonstrated that Tcf1 regulates the expression of amino acid
transporters, encoded by the genes Slc7a3, Slc7a7, and Slc38a4. As we were
unable to mimic the arginine-induced insulin secretion defect with knockdown
of Slc7a3 and Slc38a4, it is possible that Tcf1 regulates arginine uptake through
regulation of additional transporters. In addition to the defect in arginine-
induced insulin secretion, other characteristics of the Tcf1 -/- mouse suggest an
important role for Tcf1 in regulating transmembrane transport of various
compounds.
Tcf1 -/- mice also have elevated plasma bile acid levels (Shih et al., 2001).
This was found to be due to decreased expression of bile acid transporters on the
basolateral membrane of hepatocytes, leading to decreased uptake of bile acids
from the blood into the liver. Bile acid transporter genes that have been shown

41
to be regulated by Tcf1 include Slc10a1, Slc21a3, Slc21a5, and Slc21a6 (Shih et al.,
2001; Jung et al., 2001). In addition, Tcf1 -/- mice also have increased urinary
and fecal bile acid excretion, which is believed to be secondary to decreased bile
acid uptake in the ileum as well as in the kidneys from decreased expression of
the bile acid transporter Slc10a2 expressed in these tissues (Shih et al., 2001).
Tcf1 -/- mice also exhibit a renal Fanconi-like syndrome (Pontoglio et al., 1996).
This is characterized by a defect in reabsorption of glucose, phosphate, and
amino acids in the renal tubules, leading to glucosuria, phosphaturia, and
aminoaciduria. Tcf1 has been shown to regulate expression of the glucose
transporter Slgt2, as well as sodium/phosphate cotransporters Npt1 and Npt4
(Pontoglio et al., 2000; Cheret et al., 2002). In addition to the Tcf1 -/- mouse
model, MODY3 patients are also characterized by severe glucosuria, due to
reduced glucose reabsorption in the renal proximal tubule. Thus, the relevance
of Tcf1 in regulating transmembrane transport exists not only in the mouse
model, but also in actual MODY3 patients.

42
CHAPTER 4
INTRODUCTION TO LIVER STUDIES
4.1 Overview of insulin action
As discussed in Chapter 1, insulin is a polypeptide hormone that is
secreted in response to increases in blood glucose, amino acids, and fatty acids
levels. Once secreted into the bloodstream, it is able to signal to different organs
to adjust their fuel metabolism to maintain homeostasis in the organism. Thus,
in large part due to the action of insulin, plasma glucose remains in a range
between 4mM and 7mM in normal individuals, despite periods of fasting and
feeding (Saltiel and Kahn, 2001). The metabolic effects of insulin are generally
anabolic: as it signals a “fed” state in the organism, it promotes the synthesis of
glycogen from glucose, triacylglycerols from fatty acids, and protein from amino
acids. Insulin also stimulates the insertion of glucose transporters into the cell
membrane in tissues, such as muscle, to allow for glucose uptake by these
tissues. Since glucose is available from external sources, the organism does not
need to generate glucose; thus, gluconeogenesis and glycogenolysis are shut off
by insulin. In the absence of insulin when nutrient intake is low, the body acts to
maintain glucose levels through both glycogen breakdown and de novo
synthesis of glucose. In addition, the body generates ketone bodies through
lipolysis and fatty acid oxidation, as an energy source for tissues.

43
A major target for insulin action is the liver. When insulin levels are low,
the liver becomes a site of hepatic glycogen breakdown, gluconeogenesis, β-
oxidation, and ketogenesis (Nordlie et al., 1999; Pilkis et al., 1992; Laffel, 1999).
While gluconeogenesis also occurs in the kidneys, the liver is the site of 90% of
gluconeogenesis in the body. Hepatic glucose production is a key mechanism for
providing the organism with glucose during periods of fasting, and is affected by
the levels of available glucogenic substrates and the activity of regulatory
enzymes. Insulin is known to inhibit gluconeogenesis predominantly by
decreasing the expression of genes or by changing the activity (by changing

44
phosphorylation states) for key enzymes in the gluconeogenesis pathway
(Barthel and Schmoll, 2003). Insulin also inhibits β-oxidation of fatty acids and
promotes lipogenesis, mainly through regulating the transcription of genes for
enzymes involved in those pathways. We will discuss the molecular
mechanisms of these insulin-regulated effects.
4.2 Insulin receptor and insulin receptor substrates
Insulin mediates its actions by binding to its receptor on target tissues.
The insulin receptor is a member of a subfamily of receptor tyrosine kinases that
includes the insulin-like growth factor-I receptor (IGFIR) and the insulin
receptor-related receptor (IRR) (Patti and Kahn, 1998). Two alpha-subunits and
two beta-subunits make up the insulin receptor (reviewed by De Meyts and
Whittaker, 2002). The alpha-subunits are entirely extracellular and contain the
hormone-binding domains. The alpha-subunits are each linked to a beta-subunit
and to each other by disulfide bonds (White and Kahn, 1994). The beta-subunits,
which contain the ATP-binding and tyrosine kinase domains, pass through the
cellular membrane. In the absence of ligand, the alpha-subunit inhibits the
tyrosine kinase activity of the beta-subunit. Upon insulin binding to the alpha-
subunit, this repression of the beta-subunit kinase activity is released. The two
beta-subunits of the insulin receptor then transphosphorylate each other, leading
to a conformational change that further increases kinase activity (Patti and Kahn,
1998).

45
There are at least 11 intracellular substrates of the insulin receptor and the
IGF1R kinases. Of these, six belong to the family of insulin-receptor substrate
(IRS) proteins. Other substrates include Grb2-associated binder-1 (Gab1), Cas-
Br-M ecotropic retroviral transforming sequence homologue (Cbl), adaptor
protein with a pleckstrin homology (PH) and Src homology 2 (SH2) domain
(APS), and the SH2-containing protein (Shc) isoforms (Pessin and Saltiel, 2000).
The IRS proteins have both PH domains and phosphotyrosine-binding
(PTB) domains. The PTB domains allow the IRS proteins to have high binding
affinities for the activated insulin receptors. The PH domains allow for binding
to membrane phospholipids, and have also been found to be important for
activation of downstream signaling molecules (Vainshtein et al., 2000). In
addition, the IRS proteins contain up to 20 potential tyrosine-phosphorylation
sites, allowing for interactions with other molecules containing SH2 domains
once they are phosphorylated by the insulin receptor tyrosine kinase. IRS-1 and
IRS-2 are widely expressed and implicated in regulation of metabolism. IRS-3 is
mainly expressed in the adipocytes and brain; IRS-4 is expressed primarily in
embryonic tissues; IRS5/DOK4 is ubiquitously expressed, but most highly in the
liver and kidney; and IRS6/DOK5 is most highly expressed in skeletal muscle
(Taniguchi et al., 2006; Cai et al., 2003).
While the IRS proteins are highly homologous to each other, knockout
and knockdown studies have shown that they do not perform redundant roles.
Biochemical studies have shown that IRS proteins have different binding

46
affinities for various SH2 proteins (Sun et al., 1997), providing at least one
explanation for their differential functions. In a study using adenovirus-
mediated RNA interference to knockdown IRS-1 and IRS-2 expression
specifically in the livers of wild-type mice, it was found that knockdown of IRS-1
was associated with a increase in gene expression of gluconeogenic enzymes
glucose-6 phosphatase (G-6-P) and phosphoenolpyruvate carboxykinase
(PEPCK), and a trend toward increased blood glucose levels (Taniguchi et al.,
2005). In contrast, knockdown of IRS-2 in the liver resulted in increased hepatic
lipid accumulation. While IRS-1 and IRS-2 are implicated in different insulin
signaling effects, they also play complementary roles and are able to compensate
for the loss of the other to some extent. For example, the upregulation of
gluconeogenic enzymes observed with knockdown of IRS-1 was less than that
observed with concommitant knockdown of IRS-2. The hepatic knockdown of
both IRS-1 and IRS-2 resulted in systemic insulin resistance, glucose intolerance,
and hepatic steatosis (Taniguchi et al., 2005).
4.3 Insulin-regulated signaling pathways
Insulin binding to the insulin receptor leads to activation of two separate
signal transduction cascades: 1. the mitogen-activated protein kinase (MAPK)
cascade; and 2. the phsophatidylinositol 3-kinase (PI3K) cascade (Figure 19).

47
The adaptor molecule growth-factor-receptor-bound protein 2 (Grb2)
binds to phophorylated IRS proteins. Grb2 constitutively associates with son-of-
sevenless (Sos), the guanine nucleotide exchange factor for Ras, which is located
on the plasma membrane. Binding of Grb2 to phosphorylated IRS proteins
brings Sos to the plasma membrane to Ras, activating its GTPase, which then
stimulates Raf-1. Raf-1 is a serine/threonine kinase that activates mitogenic
effector kinase (MEK), which in turn activates MAPK (Myers et al., 1994).
Activation of this pathway by phorbol myristate acetate (PMA) was found to
suppress the transcription of the PEPCK and G-6-P genes (Schmoll et al., 2001;
Gabbay et al., 1996). However, neither pharmacological inhibitors of MAPK (PD-

48
98059, PD-184352, and U-0126) nor overexpression of dominant negative mutants
of Ras affects the regulation by insulin of PEPCK and G-6-P gene expression
(Agati et al., 1998; Schmoll et al., 2001, Gabbay et al., 1996; Sutherland et al.,
1998). Thus, the physiological importance of the MAPK pathway in insulin-
regulated hepatic metabolism is unclear.
PI3K is comprised of a regulatory subunit and a catalytic subunit. Kinase
activity of the enzyme requires interaction of the SH2 domains in the regulatory
subunit with phosphotyrosines in the IRS proteins. PI3K catalyzes the formation
of phospholipid PIP3 via phosphorylation of PI(4,5)P2. Proteins with PH
domains that bind PIP3 are then recruited to the cell membrane, where they are
activated. Among those proteins activated via the PI3K pathway are members of
the AGC superfamily of serine/threonine protein kinases, such as 3-
phophoinositide-dependent protein kinase 1 (PDK1), which phosphorylates and
activates the serine/theonine kinase Akt/PKB, glycogen synthase kinase-3 (GSK-
3), as well as atypical forms of protein kinase C, aPKCs, such as PKCλ and PKBξ.
Many transcription factors are regulated via the PI3K signaling pathway.
Pharmacological inhibitors of PI3K (wortmannin and LY-294002) can abolish the
insulin-induced suppression of PEPCK and G-6-P gene expression (Agati et al.,
1998; Dickens et al., 1998). Adenovirus-mediated overexpression of a dominant
negative mutant of the PI3K regulatory subunit, which cannot bind to the
catalytic subunit, increases PEPCK and G-6-P gene expression and hepatic

49
glucose production (Miyake et al., 2002). Thus, the PI3K pathway is a key
mediator of hepatic insulin effects.
4.4 Transcription factors involved in insulin-regulated hepatic metabolism
Many of insulin’s effects in the liver are mediated through transcriptional
regulation of genes involved in metabolic processes. A number of transcription
factors and coactivator proteins have been identified as being involved in the
insulin signaling process. In this section, we will describe the sterol response
element-binding protein (SREBP)-1c, the liver X-activated receptor (LXR)α and
LXRβ, and peroxisome proliferator-activated receptor-γ coactivator-1 (PGC-1).
The forkhead members of transcription factors, which may be regulated by
insulin via the PI3K pathway, will be discussed in the next section.
Through activation of PI3K, insulin stimulates transcription of the SREBP-
1c gene in hepatocytes, as well as in adipose and muscle cells (Foufelle and Ferre,
2002). In addition, activation of Akt/PKB in vitro was found to be sufficient for
upregulation of SREBP-1c gene expression (Fleischmann and Iynedjian, 2000).
Adenovirus-mediated overexpression of SREBP-1c has been found to decrease
gene expression of PEPCK in vitro and in vivo (Chakravarty et al., 2001; Becard
et al., 2001). SREBP-1c overexpression also decreases hyperglycemia in diabetic
mice (Becard et al., 2001). SREBP-1c can also increase transcription of lipogenic
genes, such as acetyl-CoA synthetase, fatty acid synthase, acetyl-CoA
carboxylase (Edwards et al., 2000; Osborne, 2000). Thus, by increasing

50
expression of SREBP-1c, insulin can decrease gluconeogenesis and increase
lipogenesis.
Insulin signaling also induces expression of LXRs. LXRα, which is
expressed mainly in liver, kidney, and intestines, and LXRβ, which is expressed
ubiquitously, belong to the nuclear receptor superfamily (Edwards et al., 2002).
The endogenous activating ligands of the LXRs are oxysterols, allowing the
factors to sense changes in cholesterol levels. In fact, LXRα has been found to be
important for the response to administration of cholesterol-enriched diets in mice
(Peet et al., 1998). LXRs form heterodimers with the retinoic acid receptor-α
(RXR) to bind to response elements in their target genes, activating expression of
genes involved in lipogenesis, bile acid formation, and cholesterol transport,
such as fatty acid synthase, cholesterol 7α-hydroxylase, and ABCA1. In addition,
LXR has been shown to also increase expression of SREBP-1c. LXR agonists can
decrease blood glucose in rodent models, at least in part through suppression of
gluconeogenic enzyme expression (Cao, et al., 2003; Stulnig et al., 2002). This
may be through direct interaction of LXR with these target genes, or through an
indirect mechanism, such as through regulation of SREBP-1c.
PGC-1 is a coactivator protein that is positively regulated by glucagon via
cAMP. In vitro studies using PGC-1 promoter-reporter gene plasmids
transfected into HepG2 cells show that insulin suppresses PGC-1 promoter
activity and that this suppression can be mimicked with coexpression with
Akt/PKB (Daitoku et al., 2003). In addition, these in vitro studies suggest that
51
PGC-1 is a direct target of Foxo1, a forkhead transcription factor that is
inactivated by Akt/PKB. PGC-1 acts to increase gluconeogenesis, by increasing
transcription of gluconeogenic enzymes.
4.5 Forkhead family of transcription factors
Foxo1 and Foxa2 are two other transcription factors that are regulated by
insulin. Foxo1 and Foxa2 are both members of the forkhead family of
transcription factors. Forkhead proteins are a large family of functionally diverse
transcription factors, which are involved in a variety of cellular processes, such
as cranial and neural development, immune regulation, pancreatic and liver
development, as well as liver metabolism (Lehmann et al., 2003; Coffer and
Burgering, 2004; Lee, et al., 2004; Lee et al., 2005; Nakae et al., 2002; Wolfrum et
al., 2004).
The original fork head (fkh) gene was identified in Drosophila melanogaster,
through a screen of embryonic lethal mutants. It was found to be required for
terminal pattern formation in the embryo (Weigel et al., 1989). The year
following the identification of fork head, a novel group of liver-specific
transcription factors was identified whose members have DNA-binding domains
with a high degree of homology to that of the fkh gene product (Lai et al., 1990).
This family was called the hepatic nuclear factor 3 (HNF3) family. Since then,
many transcription factors with this forkhead motif have been identified in a
whole range of organisms, from yeast to humans.

52
More than a hundred members of the forkhead transcription factor family
have been identified to date, leading to a change in the nomenclature (Kaestner
et al., 2000). Fox (for “forkhead box”) is now used to name all chordate forkhead
transcription factors, followed by a letter denoting its subfamily based on
phlyogenetic analysis (not based on function). Each gene from a subfamily of
Fox proteins is then identified by a number. Fox proteins all share a highly
conserved DNA-binding domain, which forms a butterfly-like structure when
bound to DNA, giving it the description “winged helix” (Clark et al., 1993).
Since most of the amino acids within this DNA-binding domain are conserved, it
is not understood how Fox transcription factors have different DNA sequence
specificity. In contrast to the highly conserved DNA-binding domain, the
transactivation or transrepression domains of the Fox family have little
homology.
Foxo1 and Foxa2 are forkhead family transcription factors that are
regulated by insulin. Foxo1 promotes gluconeogenesis (Nakae et al., 2001; Nakae
et al., 2002), while Foxa2 regulates fatty acid metabolism (Wolfrum et al., 2004).
Insulin signaling results in activation of Akt/PKB, which then phosphorylates
Foxo1 and Foxa2 (Brunet et al., 1999; Biggs et al., 1999; Wolfrum et al., 2003).
Phosphorylation leads to nuclear exclusion of these transcription factors, thus
inhibiting their transcriptional activity (Figure 20).

53
A mutant form of Foxa2 was generated, changing the phosphorylated
threonine at position 156 to alanine. This resulted in a constitutively active form
of Foxa2, which could remain localized in the nucleus even with insulin present
(Wolfrum et al., 2004). When adenovirus expressing this constitutively active
form of Foxa2, called Foxa2 (T156A), was injected into hyperinsulinemic mice,
where endogenous Foxa2 is permanently inactive due to the high amounts of
insulin present, decreases in hepatic triglyceride content, increases in plasma
triglyceride levels, and increases in ketone bodies in the plasma were noted. On
the other hand, haploinsufficient Foxa2 +/- mice have decreased levels of

54
ketogenesis and β-oxidation (Wolfrum et al., 2004). The data suggest that Foxa2
is an important insulin-regulated mediator of lipid metabolism, actively
promoting ketogenesis and β-oxidation during fasting when insulin levels are
low.
4.6 Insulin signaling and amino acid uptake
Insulin promotes an anabolic state in the organism, leading to increased
amino acid uptake by muscle cells for protein synthesis (Biolo et al., 1995). In the
absence of insulin, or in insulin-resistant states, muscle breakdown increases
without this anabolic stimulus. In fact, age-related insulin resistance has recently
been proposed to be a cause of the loss of muscle mass and strength (sarcopenia)
observed in elderly individuals (Rasmussen et al., 2006). Because of this
regulation, during times of fasting, when insulin in not present, protein synthesis
is decreased and less amino acids are taken up by skeletal muscle.
In contrast, studies have shown that hepatic amino acid uptake and
metabolism increases in the liver during periods of fasting (Low et al., 1992;
Grofte et al., 1999; Gu et al., 2005). This effect helps to provide more amino acids
to the liver cells, which need to increase gluconeogenesis during fasting. It was
found that hepatic nitrogen clearance, a measure of hepatic amino acid
metabolism, decreases with a hyperinsulinemic and euglycemic clamp in normal
and healthy individuals, suggesting that insulin plays a direct role in regulation
(Grofte et al., 1999). However, with a hyperinsulinemic and hypoglycemic

55
clamp, hepatic nitrogen clearance increases despite the high insulin levels,
suggesting that there is another level of regulation that hypoglycemia may
trigger, to counteract the effect of insulin.
While these effects of fasting and feeding on hepatic amino acid uptake
and metabolism have been long known, the molecular mechanisms governing
these processes had not been studied until recently with a study on a system N
amino acid transporter, SNAT3, encoded by Slc38a3 (Gu et al., 2005). In this
study, it was found that SNAT3 expression is downregulated by insulin. This
downregulation could be blocked by the PI3K inhibitor, LY294002, but not by the
MAPK inhibitor, PD98059. This data not only demonstrate that insulin that
regulate expression of an amino acid transporter, but that it is through the PI3K
signaling pathway that insulin induces this effect.
4.7 Experimental study
We had identified the Slc38a4 gene, encoding the amino acid transporter
mNAT3, as being expressed in pancreatic islet cells and regulated by the
transcription factor Tcf1. We had also shown that Slc38a4 is highly expressed in
the liver as well. In this study, we analyzed the regulation of Slc38a4 by Tcf1 in
the liver as well as the pancreatic islets. We also hypothesized that Slc38a4 may
be regulated by metabolic states and endeavored to identify the molecular basis
for this regulation.

56
CHAPTER 5 -- RESULTS PART II
5.1 Tcf1 regulation of Slc38a4 in the pancreatic islets and the liver
We examined the expression and regulation of Slc38a4 in the liver, where
it was strongly expressed in addition to in the pancreatic islets (Figure 10). By
semi-quantitative RT-PCR using liver tissue from Tcf1 +/+ and -/- mice, we
found that Slc38a4 is also regulated in the liver, but not as strongly as in the
pancreatic islets (Figure 21). We were interested in this difference in Tcf1
regulation, and wanted to discover the basis for this.
5.2 Alternative transcriptional start sites for Slc38a4
One possibility we examined for the difference in Tcf1 regulation of
Slc38a4 was differential transcriptional start sites. We performed 5’ RACE on
RNA from pancreatic islets. Sequencing of the 5’ end of the islet Slc38a4
transcript revealed an alternative first and second exon of Slc38a4, compared

57
with the Slc38a4 mRNA sequence from liver cDNA libraries (Genbank accession
no. BC024123). These two transcript isoforms differ only in their 5’ untranslated
region; the open reading frames are identical, and hence, they encode identical
proteins (Figure 22A). RT-PCR using isoform-specific primers showed that while
the liver contains both transcript isoforms of Slc38a4, the islet contains only one
isoform, which we termed the “islet” isoform (Genbank accession no. AY027919)
(Figure 22B). We termed the originally identified Slc38a4 transcriptional isoform
the “liver” isoform.
5.3 Tcf1 regulation of both transcriptional isoforms of Slc38a4
We investigated if both transcriptional isoforms of Slc38a4 were regulated
by Tcf1. To address this question, we performed RT-PCR of the two isoforms in

58
a panel of liver Tcf1+/+ and Tcf1-/- mice. We found that the “islet” isoform of
Slc38a4 (which is present in both liver and islet) is strongly regulated by Tcf1,
while the “liver” isoform is regulated as well, but to a lesser degree (Figure 23).
5.4 Regulation of Slc38a4 in the liver by metabolic states and insulin
The liver responds to fasting by increasing the uptake of amino acids,
which are then used as carbon skeletons for the generation of glucose. Since we
had shown that Slc38a4 mediated the uptake of arginine into cells, as well as
neutral amino acids (shown by other groups), we questioned whether it could
have a role in the hepatic response to fasting. We generated a panel of liver
cDNA from mice that had been fasted overnight, fed control mice, and
overnight-fasted mice that had been injected with 10ng insulin by portal vein
injection.

59
We found that Slc38a4 expression is upregulated during fasting. In
addition, using isoform-specific primers, we found that both Slc38a4 transcript
isoforms were upregulated by fasting (Figure 24A). Furthermore, this
upregulation of Slc38a4 was dependent on the absence of insulin, since it is
abolished with the injection of insulin into the overnight-fasted mice.
Interestingly, this upregulation of Slc38a4 by fasting was not observed in the
pancreatic islets (Figure 24B).

60
5.5 Slc38a4 is regulated by Foxa2
We then examined Foxa2 as a potential regulator of this upregulation of
Slc38a4 during fasting. In the liver, Foxa2 is negatively regulated by insulin.
Insulin signaling stimulates a kinase cascade that leads to phosphorylation of a
threonine residue of Foxa2, leading to Foxa2 nuclear exclusion. Thus, during
fasting, when insulin levels are low, Foxa2 is present in the nucleus and active;
when insulin is present, Foxa2 is phosphorylated and shuttled out of the nucleus.
This shuttling of Foxa2 does not occur in the pancreatic islets, where Foxa2 is not
insulin-responsive. Since Foxa2 is a transcriptional activator that is inhibited by
insulin in the liver, but not in islet, we considered Foxa2 as a candidate regulator
of Slc38a4, which we found to be upregulated in the liver during fasting, but not
in pancreatic islets.
To study Foxa2 regulation, we used mice that were injected with either a
GFP-expressing adenovirus, or an adenovirus that expresses a constitutively
active form of Foxa2, which has the phophorylated Thr residue mutated to Ala.
Through RT-PCR of a liver cDNA panel from overnight-fasted GFP-adenovirus-
and Foxa2 (T156A)-adenovirus-infected C57Bl6 mice, we found upregulation of
Slc38a4 with Foxa2. We also looked for Foxa2 regulation of Slc38a4 expression in
hyperinsulinemic and diabetic mouse models, transgenic mice overexpressing
Srebp-1c in adipose tissue (Srebp-1c) and ob/ob mice, where Foxa2 is constutively
inactive due to nuclear exclusion. We found that infection of these mice with
adenovirus expressing constitutively active Foxa2 at nuclear levels that are

61
similar to the fasted state led to even more pronounced upregulation of Slc38a4.
In addition, we found that expression of both transcript isoforms of Slc38a4 are
regulated by Foxa2 in all mouse models. Thus, we have found that Foxa2 is a
mediator of the insulin-responsive regulation of Slc38a4.
5.6 Identification of Tcf1 and Foxa2 regulatory elements in the Slc38a4 “islet” isoform
promoter
We wanted to determine the promoter elements responsible for Tcf1 and
Foxa2 regulation. We began by analyzing the Slc38a4 “islet” isoform promoter,
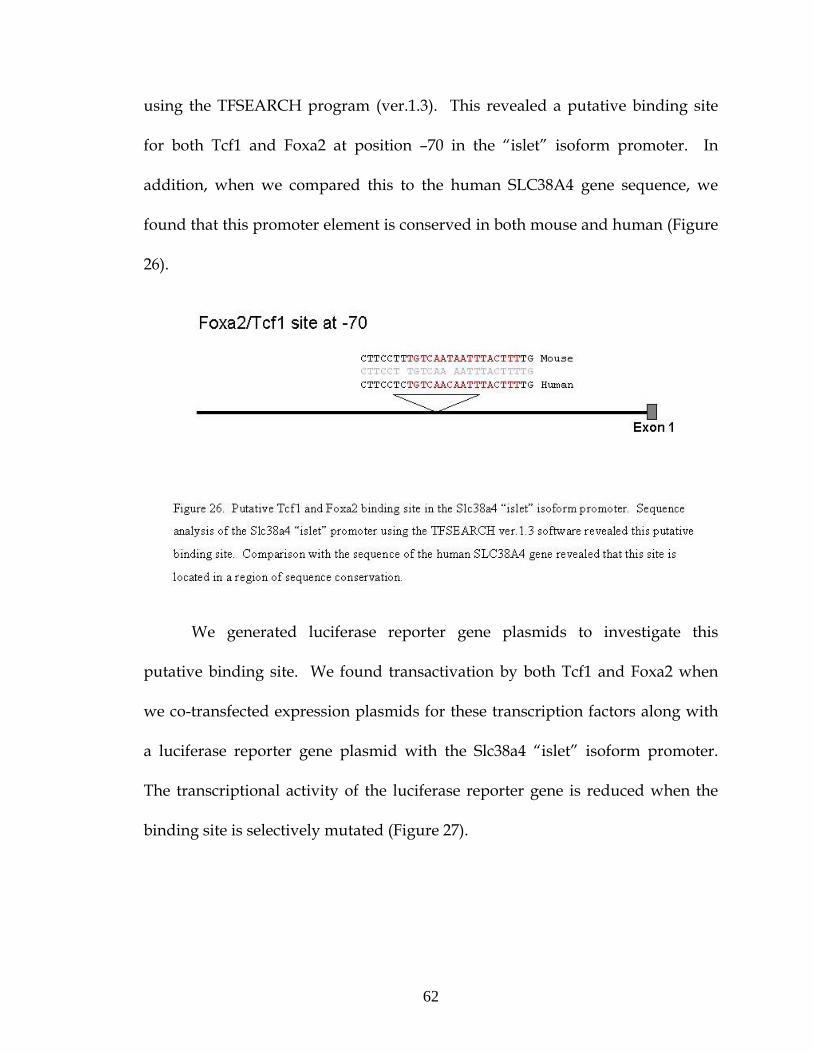
62
using the TFSEARCH program (ver.1.3). This revealed a putative binding site
for both Tcf1 and Foxa2 at position –70 in the “islet” isoform promoter. In
addition, when we compared this to the human SLC38A4 gene sequence, we
found that this promoter element is conserved in both mouse and human (Figure
26).
We generated luciferase reporter gene plasmids to investigate this
putative binding site. We found transactivation by both Tcf1 and Foxa2 when
we co-transfected expression plasmids for these transcription factors along with
a luciferase reporter gene plasmid with the Slc38a4 “islet” isoform promoter.
The transcriptional activity of the luciferase reporter gene is reduced when the
binding site is selectively mutated (Figure 27).

63
64
In addition, we performed electrophoretic mobility shift assays to
determine whether Tcf1 and Foxa2 bind directly to this site. We generated 32P-
labeled double-stranded oligonucleotides containing the putative Tcf1/Foxa2
binding site. Incubating this probe with Hepa 1-6 (mouse liver cell line) extract,
we were able to see specific radioactive band shifts corresponding to Tcf1 and
Foxa2 binding (Figure 28). Using cold oligonucleotides containing known Tcf1
and Foxa2 sites, we were able to inhibit the radioactive band shifts in a specific
manner, while a cold probe containing the mutated binding site was unable to
inhibit the shift even at 100-fold excess. The binding of both Tcf1 and Foxa2 to
the site was further demonstrated by supershifting their respective bands using
anti-Tcf1 and anti-Foxa2 antibodies. An anti-c-jun antibody was also used as a
negative control, which was unable to supershift any bands.

65
5.7 Identification of Tcf1 and Foxa2 regulatory elements in the Slc38a4 “liver” isoform
promoter
We performed a similar analysis of the Slc38a4 “liver” promoter to
determine the promoter elements important for Tcf1 and Foxa2 regulation of this
isoform. Sequence analysis revealed two Tcf1 binding sites at positions –1000
and –40 in the “liver” isoform promoter (Figure 29). A Foxa2 binding site was

66
also identified in the promoter at position -220. By comparing the mouse
promoter sequence with the sequence upstream of the human SLC38A4 gene, we
found that these elements are located in regions of sequence conservation
between mouse and human.
We performed luciferase reporter gene assays with the Slc38a4 “liver”
promoter, and compared levels of transactivation when we mutated the various
Tcf1 and Foxa2 sites (Figure 30).

67

68
We found that mutating the putative Tcf1 binding site at position –1000 or
–40 significantly decreases the level of transactivation by Tcf1 (Figure 30A).
When we mutate both sites, we eliminate all transactivation by Tcf1. We also
found that mutating the Foxa2 binding site at position –220 also decreases the
transactivation by Foxa2 in luciferase reporter gene assays (Figure 30B).
EMSA analysis was also performed using radioactively labeled
oligonucleotides of all three of these putative binding sites in the Slc38a4 “liver”
promoter, to determine whether Tcf1 or Foxa2 directly bind to these sites (Figure
31). We were able to see radioactive band shifts for the oligonucleotide probes
for each site with the addition of Hepa 1-6 cell extract. With the addition of anti-
Tcf1 and anti-Foxa2 antibodies, we were able to demonstrate that Tcf1 directly
binds to the probe of the position –40 and –1000 Tcf1 binding sites, and that
Foxa2 directly binds to the probe of the position –220 Foxa2 binding site. We
also found a strong band shift with the –1000 Tcf1 binding site, and found that
this is due to direct binding by Foxa2 by supershifting this band with anti-Foxa2
antibodies; however, through luciferase reporter gene assays, we found that this
site is not important for Foxa2 transactivation, as mutation of the putative Foxa2
site does not affect luciferase expression. The specificity of the radioactive band
shift by either Tcf1 or Foxa2 binding to the oligonucleotide probes was also
demonstrated by the inhibition of this shift by the addition of cold probes
containing known Tcf1 and Foxa2 sites.

69

70
5.8 Synergistic transactivation of Slc38a4 by Tcf1 and Foxa2
We were interested to see if Tcf1 and Foxa2 have a synergistic effect on
transactivation of Slc38a4. To determine this, we performed luciferase reporter
gene assays, co-transfecting both Tcf1 and Foxa2 expression vectors with the
reporter gene plasmids containing either the Slc38a4 “islet” or “liver” isoform
promoters. We found significantly higher transactivation through both the
Slc38a4 “islet” and “liver” isoform promoters with Tcf1 and Foxa2, than we
found by co-transfecting either factor singly with the promoter-reporter gene
plasmids (Figure 32). Thus, Tcf1 and Foxa2 are able to transactivate through
both Slc38a4 promoters in a synergistic manner.

71
5.9 In vivo binding of Foxa2 to the Slc38a4 promoters
We wanted to see whether Foxa2 binds to the Slc38a4 promoters in vivo.
We performed chromatin immunoprecipitation analysis on liver tissue from
C57Bl/6J and ob/ob mice infected with either Foxa2 (T156A)-adenovirus or GFP-
adenovirus. Through chromatin immunoprecipitation with an anti-Foxa2
antibody, we found that Foxa2 interacts with the promoters of both Slc38a4
isoforms in fasted C57Bl/6J mice and the ob/ob mice infected with the Foxa2

72
(T156A)-adenovirus (Figure 33). However, Foxa2 does not interact with these
promoters in ob/ob mice infected with the GFP-adenovirus. In addition, Foxo1, a
related transcription factor, does not interact with either promoter in any of the
conditions tested, as we are unable to amplify any of these promoter regions
after chromatin immunoprecipitation with Foxo1.
5.10 Expression of Foxa2 (T156A) increases arginine uptake by perfused mouse livers
Since we had shown Foxa2 regulation of an amino acid transporter gene,
we wanted to demonstrate that Foxa2 activation does indeed lead to a change in
amino acid uptake in vivo. For this experiment, we infected C57Bl/6J mice with
either adenovirus that expresses the constitutively active Foxa2 (T156A) or GFP-

73
adenovirus as a control. We perfused the liver of these mice with Krebs-
Henseleit buffer containing 3H-labeled arginine to assay the uptake of arginine
by these livers. We found significantly increased uptake of arginine by the livers
of mice infected with the Foxa2 (T156A)-adenovirus (Figure 34).

74
CHAPTER 6 – DISCUSSION PART II
6.1 Alternative splicing as a mechanism for differential regulation of Slc38a4
In this study, we examined the regulation of the Slc38a4 gene, which we
had previously identified as being highly regulated by the transcription factor,
Tcf1, in pancreatic islets. We found that Slc38a4 was also regulated by Tcf1 in
liver tissue as well; however, the level of regulation in the liver was less than that
observed in the pancreatic islets. We identified alternative transcriptional start
sites leading to two transcript isoforms for Slc38a4. While the liver expresses
both Slc38a4 transcripts, islet tissue expresses only one transcript. Furthermore,
while both transcripts were found to be positively regulated by Tcf1, the “islet”
transcript was more strongly upregulated by Tcf1. We believe that these data
together suggest that the differential expression of these two transcript isoforms
and their differences in Tcf1 regulation may be the basis of the regulatory
differences observed between the liver and islet expression of Slc38a4.
The existence of alternative transcripts for the Slc38a4 gene is interesting,
however not entirely surprising. Recent studies show that alternative splicing
seems to be the rule for human genes rather than the exception, which explains
how the number of human proteins outnumbers that of genes several-fold.
Increasingly more studies have shown how alternative transcripts may also
mediate tissue-specific regulation. The regulation of Slc38a4 in the pancreatic
beta-cell and in the liver that we have observed is such an example. Yet another
75
example is the HNF4α gene. HNF4α gene expression in pancreatic endocrine
and exocrine cells is dependent on Tcf1, while HNF4α expression is not affected
by the absence of Tcf1 in the liver. Similar to our findings with Slc38a4, it was
shown that HNF4α has two alternate tissue-specific promoters, one of which is
mainly expressed in the islet and is highly regulated by Tcf1, while the other is
expressed in the liver and is not affected by Tcf1 (Boj et al., 2001).
In addition to having distinct regulatory properties through the alternative
promoters, the two Slc38a4 transcripts may have different functional properties
conferred by their sequence differences. The alternative transcripts of the Slc38a4
gene that we have identified do not differ in sequence in their translated regions
and encode proteins of identical sequence. However, it is possible that these
transcripts may still differ in their gene product activity through their sequence
differences within the 5’-untranslated regions (UTR). An intriguing example of
activity regulation through the 5’-UTR is the Slc7a1 gene, which encodes the Cat1
amino acid transporter. It has been shown that the mRNA for the Slc7a1 gene
contains an internal ribosome entry site (IRES) in its 5’-UTR (Fernandez et al.,
2001). With amino acid starvation, general cap-dependent protein synthesis is
inhibited (Pain, 1994); however, the IRES-mediated translation of the Slc7a1
mRNA increases under conditions of amino acid starvation, providing a
mechanism by which cells may preferentially translate only mRNAs that are
essential for cell survival during periods of limited nutrient supply (Fernandez et
al., 2001).
76
It would be interesting to test the hypothesis that the 5’-UTRs of the two
alternative transcripts of Slc38a4 may yield different translational properties. For
example, one may perform similar studies as Fernandez et al. (2001), and clone
the two Slc38a4 5’-UTRs into bicistronic mRNA, where one reporter gene is
translated through a cap-dependent scanning mechanism, while a second
reporter gene encoded downstream of the 5’-UTR insert is translated only if it is
preceded by an IRES. Differences in 5’-UTR function may also be elucidated
with cell lysate fractionation to purify polysomes and the transcripts associated
with the polysomes. One may then perform RT-PCR to determine the presence
of either the “islet” or “liver” Slc38a4 transcripts to see if there is a difference in
their association with the ribosomes. These studies would elucidate potential
differences in transcript interactions within the 5’-UTRs that may have
translational consequences.
While increasingly more examples of alternative transcripts and promoters
are being discovered to mediate tissue-specific expression and regulation, it is
still unclear what mechanism causes a transcript to be predominantly expressed
in one tissue rather than another. Using the Slc38a4 gene as an example, the
complete absence of the “liver” transcript in pancreatic islet tissue is a striking
observation. It would be interesting to study potential mechanisms for this
phenomenon, particularly the possibility of differences in histone structure in the
two different tissues. This may be elucidated with additional chromatin
immunoprecipitation assays with antibodies to acetylated histones and with

77
antibodies to un-acetylated histones to test for binding of the “islet” and “liver”
promoter sequences in the two tissues. It is possible that differences in histone
structure and modification may be a general mechanism for tissue-specific
transcript silencing.
6.2 Regulation and function of Slc38a4 in the liver
In this study, we have also shown that Slc38a4 expression is upregulated
in the liver of overnight fasted mice, and that this upregulation is inhibited by
insulin. Through in vitro and in vivo experiments, we have also demonstrated
that Slc38a4 is a direct target of the transcription factor, Foxa2, as well as Tcf1.
Furthermore, we have shown that Foxa2 overexpression in the liver can increase
arginine uptake in liver perfusion studies, thus correlating the increase in Slc38a4
gene expression with increase Slc38a4 transporter activity.
Our study is the first to identify an insulin-regulated transcription factor
to regulate a member of the Slc38a family. Previous work by Gu et al. (2005) had
shown regulation of Slc38a3 to also be negatively regulated by insulin on a
molecular level via the PI3-kinase pathway. It is possible that Foxa2 may
mediate the insulin-sensitive gene expression of Slc38a3, as well as other
transporter genes.
We have found that both Tcf1 and Foxa2 regulate both alternative
transcripts of Slc38a4, and that their transactivation is synergistic. We also
showed that Tcf1 expression does not change with fed or fasted states, while it
78
has been shown that Foxa2 activity is dependent on the absence of insulin
signaling. Our results suggest that while both transcription factors are important
for Slc38a4 expression, they have distinct regulatory functions. Tcf1 plays a role
mainly in mediating basal expression levels of Slc38a4, while Foxa2 modulates
Slc38a4 expression with changes in the metabolic state of the organism and
insulin levels.
Foxa2 has already been shown to mediate other metabolic pathways in the
liver, dependent on the metabolic state of the organism. For example, it was
demonstrated that Foxa2 mediates the increased hepatic fatty acid oxidation that
occurs during fasting, which provides energy from fat stores for the organism
while other energy sources are not available (Wolfrum et al., 2004). We have
now shown that Foxa2 may also mediate the liver response to fasting by
increasing amino acid uptake, which may be broken down to carbon skeletons
for the generation of glucose, as well as used for protein renewal.
In the ob/ob and Srebp-1c mouse models, Foxa2 is permanently excluded
from the nucleus and inactive, due to the hyperinsulinemia (Wolfrum et al.,
2004). In contrast, a related forkhead family transcription factor, Foxo1, shows
resistance to insulin and may remain in the nucleus driving transcription of its
target genes. Foxo1 is normally responsible for increasing expression of genes
involved in gluconeogenesis during fasting. Thus, development of Foxo1 insulin
resistance in hyperinsulinemic states results in exacerbation of hyperglycemia
from inappropriate activation of the gluconeogenic pathways. The insulin

79
sensitivity of Foxa2 in type 2 diabetic and hyperinsulinemic models may also
contribute to the disease state: permanently inactive Foxa2 leads to decreased
fatty acid oxidation, which leads to hepatic steatosis that may also increase
insulin resistance. However, in this study, we have shown another arm of Foxa2
function that may help alleviate the type 2 diabetic state. With hyperinsulinemia
inactivating Foxa2, amino acid uptake will be lower, decreasing the amount of
amino acid-derived substrates for gluconeogenesis. Thus, Foxa2 nuclear
exclusion in the type 2 diabetic and hyperinsulinemic models helps to decrease
the gluconeogenesis that is being inappropriately driven by insulin-resistant
Foxo1.

80
CHAPTER 7 – EXPERIMENTAL PROCEDURES
7.1 Experimental animals
All animal models were housed in Laboratory of Animal Research Center
(LARC), a pathogen-free animal facility at the Rockefeller University. The
animals were maintained on a 12-hour light/dark cycle and fed a standard
rodent chow. Genotyping of transgenic mice was performed on DNA isolated
from three-week old mice by PCR (Lee et al., 1998).
7.2 Cell culture
MIN6 cells were cultured with DMEM medium containing 25mM glucose,
15% fetal bovine serum, and 5μM 2-mercaptoethanol. COS-7, Hepa 1-6, and
HepG2 cells were cultured with DMEM medium containing 25mM glucose and
10% fetal bovine serum. Collagenized plates were used for culturing HepG2
cells. All cells were maintained in a humidified incubator at 5% CO2.
7.3 In vitro radioactive ligand uptake assay
MIN6 monolayers were plated at a concentration of 500,000 cells/well in
six-well plates and assayed for arginine uptake the following day. On the day of
the assay, MIN6 monolayers were washed and pre-equilibrated in control
Tyrode’s solution (135mM NaCl, 5mM KCl, 1.8mM CaCl2, 1mM MgCl2, 10mM
Hepes, and 5.6mM glucose, pH 7.4) at 37ºC for 30-40 minutes. To assay arginine
81
uptake, the cells were incubated with Tyrode’s solution containing 3H-arginine
for a fixed amount of time. Cells were then washed twice with ice-cold control
Tyrode’s solution and lysed with RIPA buffer (50mM Tris, 1% NP-40, 0.25% Na-
deoxycholate, 150mM NaCl, 1mM EDTA, pH 7.4) for 20 minutes on ice. Cell
lysates were measured for 3H radioactivity content as well as protein content for
normalization. For ion dependence experiments, the Tyrode’s buffer used for
uptake assays was made substituting either Na with choline, or Cl with
gluconate. For the uptake experiments, all incubations and washes were timed
to the second.
Assays for the mNAT3 protein transport activity were performed in COS-7
cells. COS-7 cells were transfected using Fugene 6 at 50% confluency in six-well
plates with either mNAT3 expression vector or with pcDNA3.1 (Invitrogen) as a
control empty vector. Radioactive ligand uptake assays were performed two
days post-transfection. Uptake assays were performed as described for MIN6.
7.4 Pancreatic islet isolation
Pancreatic islets were isolate from 6 to 8-week old mice. The mouse
pancreas was first perfused with Hank’s Buffered Salt Solution (HBSS) through
the bile duct. Perfused pancreata were dissected out and placed in a solution of
HBSS containing 1-1.5mg/mL collagenase, type XI (Sigma) and digested at 37ºC
for 10-12 minutes. Digested pancreata were washed two times with HBSS. The
tissue was then applied to a Ficoll gradient (25%, 23%, 20.5%, and 11% layers)

82
and centrifuged at 800 x g for 10 minutes. Islet tissue at the interface between the
23% and 20.5% layers was taken and washed once with HBSS before being
resuspended in culture medium. Islets were cultured overnight in RPMI
medium containing 11.1mM glucose and 10% fetal bovine serum. Total RNA
was extracted from picked islets using TRIzol reagent (Gibco-BRL).
For experiments examining gene expression in the islets during fasting
and fed states, pancreatic islets were isolated as above. However, islets were
resuspended in cold HBSS following the final HBSS wash, and never cultured in
the RPMI medium. Islets were then picked directly from the HBSS suspension
and used immediately for RNA extraction with TRIzol.
7.5 Gene expression array analysis
RNA was pooled from 20 Tcf1 +/+ and 30 Tcf1 -/- mice. A small aliquot
of each sample was analyzed on a denaturing formaldehyde gel to assess RNA
sample integrity. RNA was purified using RNeasy columns (Qiagen), and then
used for cDNA synthesis using the Superscript Choice cDNA Synthesis Protocol
(GibcoBRL), except that an HPLC-purified T7-Promoter-dT24 primer (Genset)
was used to initiate the first-strand reaction. Biotin-labeled cRNA was
synthesized from T7-cDNA using the RNA transcript labeling kit Bio Array
(Enzo), supplemented with biotin 11-CTP and biotin-16-UTP (Enzo) as specified
in the Affymetrix technical manual. The sample was cleaned with RNeasy
columns (Qiagen) to remove free nucleotides and quantitated
83
spectrophotometrically. Biotin-labeled cRNA was fragmented in 40mM Tris (pH
8.0), 100mM KOAc, and 30mM MgOAc for 30 minutes at 94°C. Hybridization
samples were prepared according to the Affymetrix manual with a final
concentration of fragmented cRNA of 0.05μg/μL.
Affymetrix Genechip MG-U74A, MG-U74B, and MG-U74C probe arrays
were prehybridized with 100mM MES (Sigma) pH 6.6, 1M[Na+], 20mM EDTA,
and 0.01% Tween-20 (Sigma) for 10 minutes at 45°C. Hybridization samples
were heated to 99 C for 5 minutes, equilibrated to 45 C for 5 minutes, and
centrifuged at 14,000 x g for 5 minutes to sediment any particulate matter. The
prehybridization solution was removed and the sample was added to the probe
array and allowed to hybridize for 16 hours, rotating at 60 rpm at 45 C. Probe
arrays were subsequently washed and stained according to the Affymetrix
technical manual in an Affymetrix fluidics station. The arrays were scanned
using a Hewlett-Packard confocal laser scanner and visualized using Affymetrix
Genechip 3.1 software. Comparison of gene expression levels between the
different groups were carried out using software Microarray Suite 4.0.
7.6 RNA interference
Synthetic siRNAs were synthesized by Proligo. Sequences were designed
to target Slc38a4 and Slc7a3. The sequences targeting Slc7a3 are: siRNA1 5’-
GUAUUGUGAUCUCGAUGUUTT-3’, and siRNA2 5’-GCGUUCUCAUCCUCA
GAUATT-3’. The sequences targeting Slc38a4 are: siRNA1 5’-GAUGCCGAAA

84
GUCAGAAGUTT-3’, and siRNA2 5’-CCAUCUACAGCGAGCUUAATT-3’.
siRNAs were transfected into MIN6 cells by electroporation using the
Nucleofector Kit V (Amaxa), according to the manufacturer’s protocol. For
electroporation into 3-5x10⁶ cells, 0.5 nmoles of siRNA was used.
7.7 Protein immunoblotting
We prepared cell extracts for immunoblotting by lysing in RIPA buffer for
20 minutes on ice, and centrifuging at 13,000 x g to remove debris. Samples were
loaded onto SDS-glycine 4-15% polyacrylamide gradient gels (Biorad) and
transferred onto a nitrocellulose membrane (Schleicher & Schuell) by
electroblotting. Membranes were first incubated with TBS with 0.1% Tween 20
(Sigma) and 5% milk for one hour at room temperature. Membranes were then
incubated with primary antibodies overnight at 4°C. The antibody to mNAT3,
the Slc38a4 gene product, (a generous gift from Dr. J. X. Jiang, Department of
Biochemistry, University of Texas Health Science Center) was used at a
concentration of 1:3000. We used anti-gamma-tubulin antibody (Sigma) as a
loading control at a concentration of 1:10,000. Membranes were then washed
three times for five minutes each with TBS with 0.1% Tween 20 (TBST) before
incubating with TBST with 5% milk and either anti-mouse (for gamma-tubulin
detection) or anti-rabbit (for Slc38a4 protein detection) HRP-conjugated
antibodies (Calbiochem).

85
7.8 In vitro insulin secretion and measurement
MIN6 cells were washed once and preincubated for 30 minutes in Krebs
Ringer Buffer (KRB; 135mM NaCl, 1.5mM CaCl2, 0.5mM KH2PO4, 3.6mM KCl,
0.5mM MgSO4, 2mM NaHCO3, 10mM Hepes, 0.1% BSA, pH 7.38) containing
2.5mM glucose. Cells were then washed once and incubated for one hour with
KRB containing 3.3mM glucose for basal insulin secretion measurements, 3.3mM
glucose plus 20mM arginine or leucine, or 25mM glucose for stimulated insulin
secretion measurements. Insulin secretion assay samples were taken from each
well following the incubation and centrifuged for five minutes at 400 x g to pellet
any loose cells in the sample. The supernatant was carefully taken off and
measured for insulin content using an insulin radioimmunoassay kit (Linco
Research).
7.9 Vectors
The mNAT3 expression vector was generated by cloning the cDNA for
Slc38a4 (Genbank accession no. BC024123) into the pcDNA3.1 vector
(Invitrogen). The reporter plasmid Islet/luc-wt was generated by first
performing PCR to amplify a 600-bp fragment of the promoter for the Slc38a4
“islet” isoform (Genbank accession no. AY027919), using primers with the
sequences TGCTCACTATGTTCTTAGCAGGTG and GGGTCTTTTAAGCTGA
TTGCACGCC. The amplified fragment was cloned into the vector, pCR®II-
TOPO using the TOPO TA cloning kit from Invitrogen, according to the

86
manufacturer’s instructions. Plasmids with the promoter fragment in a forward
orientation were selected after sequencing. The insert was then cut out of the
pCR®II-TOPO vector with the restriction enzymes Kpn I and Xho I and ligated
into the pGL2-Enhancer vector (Promega) cut with the same enzymes.
The reporter gene plasmid Islet/luc-mut is identical to Islet/luc-wt, except
that the sequence at position –74 to –65 has been mutated from AATAATTTAC
to GTGTATCTCT. The reporter plasmid Liver/luc-wt was generated by first
performing PCR to amplify a 1200-bp fragment of the promoter for the Slc38a4
“liver” isoform (Genbank accession no. BC024123), using primers with the
sequences GAAAGATGACAATTAAGCAGCCAA and CTGAACTTTTTGGAA
AGCAAGACA. The amplified fragment was cloned into the pCR®II-TOPO
vector using the TOPO TA cloning kit from Invitrogen. The insert was then cut
out of the pCR®II-TOPO vector with the restriction enzymes Kpn I and Xho I and
ligated into the pGL2-Enhancer vector (Promega) cut with the same enzymes.
The reporter gene plasmids with mutated Tcf1 binding sites in the “liver”
promoter are identical to Liver/luc-wt except that Liver/luc-1000M has the
sequence from -1000 to -992 changed from TTAATAAAT to CCAATAAGG,
Liver/luc-40M has the sequence from -45 to -42 changed from ATTG to CGCG,
and Liver/luc-40,1000M has both of the previously described sequence
exchanges. The reporter gene plasmids with mutated Foxa2 binding sites in the
“liver promoter” are also identical to Liver/luc-wt except that Liver/luc-220M
87
has the sequence from –225 to –209 changed from AAAGCCAAAATTCCAAA to
CCAGCCACCATTCCACC.
7.10 Transient transfections and luciferase assay
Fugene 6 reagent (Roche) was used to transfect HepG2 cells, according to
the manufacturer’s directions. The total transfected DNA amount per well in a
six-well plate was 0.5μg, using equal amounts of the luciferase reporter
construct, transcription factor expression vector, and CMV-LacZ plasmid.
Luciferase activity was measured two days following transfection and was
normalized for transfection efficiency, assayed by β-galactosidase activity (Shih
et al., 2001).
7.11 Whole cell extract preparation for electrophoretic mobility shift assays
HepG2 cells were grown to confluency in 150mm tissue culture dishes.
Cells were washed once with ice-cold PBS and scraped into 3mL PBS. Cells were
centrifuged at 4,000 x g for four minutes and resuspended in two volumes of
high-salt extraction buffer consisting of 400mM KCl, 20mM Tris pH 7.5, 20%
glycerol, 2mM DTT, 1x Complete TM Protease Inhibitors (Boehringer
Mannheim), and 20ug/mL aprotinin (Sigma). Cell lysis was performed by
freezing and thawing. Cellular debris was removed by centrifugation at 15,000 x
g for ten minutes at 4ºC. Whole cell extracts were stored at -80ºC.
88
7.12 Electrophoretic mobility shift assay (EMSA)
EMSA analysis was performed as described previously (Shih et al., 2001)
with minor modifications. Each assay contained 10μg of whole cell extracts and
2μg poly-dIdC (Sigma), sonicated to be 200-400 basepairs in length, in binding
buffer (20mM Hepes pH 7.9, 10% glycerol, 150mM NaCl, 1mM DTT). Whole
cells extracts were incubated with 32P-labeled double-stranded oligonucleotide
probes containing the wild-type or mutant Tcf1 or Foxa2 binding sites in Slc38a4
promoters. For the Slc38a4 islet promoter Tcf1/Foxa2 binding site, probe
sequences were: WT 5’-TCTTCCTTTGTCAATAATTTACTTTTGT, and Mut 5’-
TCTTCCTTTGTCGTGTATCTCTTTTTGT-3’. For the Slc38a4 liver promoter Tcf1
binding sites, probe sequences were: -1000 WT 5’-ATCTCAGAGTTAATAAA
TCAAATGGGCACAA-3’, -1000 Mut 5’-ATCTCAGAGCCAATAAGGCAAATG
GGCACAA-3’, -40 WT 5’-GGTCTTTAAATCATTGTCTTGCTTTCCA-3’, and –40
Mut 5’-GGTCTTTAAATCCGCGTCTTGCTTTCCA-3’. For the Slc38a4 “liver”
promoter Foxa2 binding sites, probe sequences were: -220 WT 5’-
GCCAAAATTCCAAAAGCAAATAGAAATT-3’, and -220 Mut 5’- GCCACCA
TTCCACCAGCAAATAGAAATT-3’. The cold competitor for Tcf1 binding was
an unlabeled double-stranded oligonucleotide containing the Tcf1 binding site in
the TMEM27 promoter (sequence: 5’-GGAGATTTTCGTAAATAACTGACA-3’;
Akpinar et al., 2005). The cold competitor for Foxa2 binding was an unlabeled
double-stranded oligonucleotide containing the Foxa2 consensus site (sequence:
5’-GTTGACTAAGTCAATAATCAGAATCAG-3’). Supershifts were carried out

89
with an anti-Tcf1 antibody (Geneka Biotechnology Inc.) or an anti-Foxa2
antibody (generous gift from Dr. J. E. Darnell). As a control, anti-c-jun antibody
was used (Santa Cruz Biotechnology).
For each reaction, 10μg whole cell extract was first incubated at room
temperature for ten minutes in binding buffer with 2μg poly-dIdC. Cold
inhibitors and antibodies were then added to the reactions, and all samples were
incubated for another five minutes at room temperature. Radioactive probes
were finally added to each reaction, and the samples were incubated for another
15 minutes at room temperatures. Samples were then loaded onto a 4%
polyacrylamide gel (0.25X TBE) and run at 200-250V.
7.13 Chromatin immunoprecipitation
Chromatin immunoprecipitation was performed on liver tissue from
C57Bl/6J mice and ob/ob mice that had been infected with either Foxa2 (T156A)-
adenovirus or GFP-adenovirus (1011) via tail vein injection ten days prior to the
experiment. Liver tissue was homogenized in phosphate-buffered saline (PBS;
Sigma) containing 1x Complete TM Protease Inhibitors (Boehringer Mannheim),
and cross-linked with 1% formaldehyde for ten minutes at room temperature.
Cross-linking was stopped with the addition of glycine to a final concentration of
0.125M. Cells were washed twice with PBS containing protease inhibitors. The
Chromatin Immunoprecipitation Assay Kit from Upstate Cell Signaling
Solutions (Lake Placid, NY) was used for the rest of the procedure, according to

90
the manufacturer’s instructions. Anti-Foxa2 antibody and anti-Foxo1 antibody
(Cell Signaling) were used for immunoprecipitation. Primers were used to
amplify the Slc38a4 “islet” promoter region from –180 to –1, and the Slc38a4
“liver” promoter region from –230 to –1.
7.14 Liver perfusion and radioactive ligand uptake assay
Mice were infected with either Foxa2 (T156A)-adenovirus or GFP-
adenovirus (1011 particles per mouse) ten days before the perfusion experiment.
Mice were fasted overnight, and anesthetized with intraperitoneal injection of
pentobarbitone sodium (60mg/kg body weight). The portal vein and the inferior
vena cava were cannulated. The liver was perfused with Krebs-Henseleit (KH)
buffer (119 mM NaCl, 4.7 mM KCl, 2.5 mM CaCl2, 1.2mM MgSO4, 1.2mM
KH2PO4, 25mM NaHCO3, 5mM glucose) with 20ng/mL insulin, equilibrated
with 95% O2/5% CO2. The rate of perfusion was maintained at 1 mL/minute.
Once blood was flushed out of the liver with KH buffer, we began a timed
perfusion with KH buffer with 20ng/mL insulin and 300uM arginine labeled
with 3H. The outflow was collected and radioactivity levels were measured.
Uptake was measured by subtracting the CPM from the outflow from the input
perfusion buffer CPM. Cumulative uptake was normalized by the radioactivity
of the input perfusion buffer.

91
REFERENCES Agati, J.M.,Yeagley, D., and Quinn, P.G. (1998). Assessment of the roles of mitogen-activated protein kinase, phosphatidylinositol 3-kinase, protein kinase B, and protein kinase C in insulin inhibition of cAMP-induced phosphoenolpyruvate carboxykinase gene transcription. J. Biol. Chem. 273: 18751-18759. Akpinar, P., Kuwajima, S., Krutzfeldt, J., and Stoffel, M. (2005). Tmem27: A cleaved and shed plasma membrane protein that stimulates pancreatic b cell proliferation. Cell Metab. 2, 385-397. Barthel, A., and Schmoll, D. (2003). Novel concepts in insulin regulation of hepatic gluconeogenesis. Am. J. Physiol. Endocrinol. Metab. 285, E685-E692. Becard, D., Hainault, I., Azzout-Marniche, D., Bertry-Coussot, L., Ferre, P., and Foufelle, F. (2001). Adenovirus-mediated overexpression of sterol regulatory element binding protein-1c mimics insulin effects on hepatic gene expression and glucose homeostasis in diabetic mice. Diabetes 50, 2425-2430. Bertran, J., Werner, A., Chillaron, J., Nunes, V., Biber, J., Testar, X., Zorzano, A., Estivill, X., Murer, H., and Palacin, M. (1993). Expression cloning of a human renal cDNA that induces high affinity transport of L-cystine share with dibasic amino acids in Xenopus oocytes. J. Biol. Chem. 268(20), 14842-14849. Biggs, W.H.R., Meisenhelder, J., Hunter, T., Cavenee, W.K., and Arden, K.C. (1999). Protein kinase B/Akt-mediated phophorylation promotes nuclear exclusion of the winged helix transcription factor FKHR1. Proc. Natl. Acad. Sci. USA 96, 7421-7426. Biolo, G., Declan Fleming, R.Y., and Wolfe, R.R. (1995). Physiologic hyperinsulinemia stimulates protein synthesis and enhances transport of selected amino acids in human skeletal muscle. J. Clin. Invest. 95, 811-819. Blumenfeld, M., Maury, M., Chouard, T., Yaniv, M., and Condamine, H. (1991). Hepatic nuclear factor 1 (HNF1) shows a wider distribution than products of its known target genes in the developing mouse. Development 113, 589-599. Boj, S.F., Parrizas, M., Maestro, M.A., and Ferrer, J. (2001). A transcription factor regulatory circuit in differentiated pancreatic cells. PNAS 98(25), 14481-14486.
92
Brunet, A., Bonni, A., Zigmond, M.J., Lin, M.Z., Juo, P., Hu, L.S., Anderson, M.J., Arden, K.C., Blenis, J., and Greenberg, M.E. (1999). Akt promotes cell survival by phosphorylating and inhibiting a Forkhead transcription factor. Cell 96, 857-868. Buteau, J., Roduit, R., Susini, S., and Prentki, M. (1999). Glucagon-like peptide-1 promotes DNA synthesis, activates phophatidylinositol 3-kinase and increases transcription factor pancreatic and duodenal homeobox gene 1 (PDX-1) DNA binding activity in beta (INS-1)-cells. Diabetologia 42, 856-864. Cai, D., Dhe-Paganon, S., Melendez, P.A., Lee, J., and Shoelson, S.E. (2003). Two new substrates in insulin signaling, IRS5/DOK4 and IRS6/DOK5. J. Biol. Chem. 278, 25323-25330. Calonge, M.J., Gasparini, P., Chillaron, J., Chillon, M., Gallucci, M., Rousaud, F., Zelante, L., Testar, X., Dallapiccola, B., DiSilverio, F., et al. (1994). Cystinuria cause by mutations in rBAT, a gene involved in the transport of cystine. Nat. Genet. 6(4), 420-425. Cao, G., Liang, Y., Broderick, C.L., Oldham, B.A., Beyer, T.P., Schmidt, R.J., Zhang, Y., Stayrook, K.R., Suen, C., Otto, K.A., Miller, A.R., Dai, J., Foxworthy, P., Gao, H., Ryan, T.P., Jiang, X.C., Burris, T.P., Eacho, P.I., and Etgen, G.J. (2003). Antidiabetic action of a liver X receptor agonist mediated by inhibition of hepatic gluconeogenesis. J. Biol. Chem. 278, 1131-1136. Chakravarty, K., Leahy, P., Becard, D., Hakimi, P., Foretz, M., Ferre, P., Foufelle, F., and Hanson, R.W. (2001). Sterol regulatory element-binding protein-1c mimics the negative effect of insulin on phosphoenolpyruvate carboxykinase gene expression. J. Biol. Chem. 276, 34816-34823. Cheret, C., Doyen, A., Yaniv, M., and Pontoglio, M. (2002). Hepatocyte nuclear factor 1α controls renal expression of the Npt1-Npt4 anionic transporter locus. J. Mol. Biol. 322, 929-941. Clark, K.L., Halay, E.D., Lai, E., and Burley, S.K. (1993). Co-crystal structure of the HNF-3/fork head DNA-recognition motif resembles histone H5. Nature 364, 412-420. Coffer, P.J., and Burgering, B.M.T. (2004). Forkhead-box transcription factors and their role in the immune system. Nature Rev. Immun. 4, 889-899. Daitoku, H., Yamagata, K., Matsuzaki, H., Hatta, M., and Fukamizu, A. (2003) Regulation of PGC-1 promoter activity by protein kinase B and the forkhead transcription factor FKHR. Diabetes 52, 642-649.

93
De Meyts, P., and Whittaker, J. (2002). Structural biology of insulin and IGF1 receptors: implications for drug design. Nature Reviews Drug Discovery 1, 769-783. Deves, R., and Boyd, C.A. (1998). Transporters for cationic amino acids in animal cells: discovery, structure, and function. Physiol. Rev. 78(2), 487-545. Deves, R., Chavez, P., and Boyd, C.A. (1992). Identification of a new transport system (y+L) in human erythrocytes that recognizes lysine and leucine with high affinity. J. Physiol. 454, 491-501. Diabetes Control and Complications Trial Research Group (1993). The effect of intensive treatment of diabetes on the development and progression of long-term complications in insulin-dependent diabetes mellitus. N. Engl. J. Med. 329, 977-986. Dickens, M., Svitek, C.A., Culbert, A.A., O’Brien, R.M., and Tavare, J.M. (1998). Central role for phosphatidylinositide 3-kinase in the repression of glucose-6-phosphatase gene transcription by insulin. J. Biol. Chem. 273, 20144-20149. Dukes, I.D., Sreenan, S., Roe, M.W., Levisetti, M., Zhou, Y.-P., Ostrega, D., Bell, G.I., Pontoglio, M., Yaniv, M., Philipson, L., and Polonsky, K. (1998). Defective pancreatic β-cell glycolytic signaling in hepatocyte nuclear factor-1a-deficient mice. J. Biol. Chem. 273(38), 24457-24464. Dunne, M.J., Yule, D.I., Gallacher, D.V., and Petersen, O.H. (1990). Effects of alanine on insulin-secreting cells: patch-clamp and single cell intracellular Ca2+ measurements. Biochim. Biophys. Acta 1055, 157-164. Edwards, C.M., Todd, J.F., Mahmoudi, M., Wang, Z., Wang, R.M., Ghatei, M.A., and Bloom, S.R. (1999). Glucagon-like peptide 1 has a physiological role in the control of postprandial glucose in humans: studies with the antagonist exendin 9-39. Diabetes 48, 86-93. Edwards, P.A., Kast, H.R., and Anisfeld, A.M. (2002). BAREing it all: the adoption of LXR and FXR and their roles in lipid homeostasis. J. Lipid Res. 43, 2-12. Edwards, P.A., Tabor, D., Kast, H.R., and Venkateswaran, A. (2000). Regulation of gene expression by SREBP and SCAP. Biochim. Biophys. Acta 1529, 103-113.
94
Fajans, S., Bell, G., Polonsky, K. (2001). Molecular mechanisms and clinical pathophysiology of maturity-onset diabetes of the young. N. Engl. J. Med. 345(13), 971-980. Farilla, L., Bulotta, A., Hirshberg, B., Li, C.S., Khoury, N., Noushmehr, H., Bertolotto, C., Di Mario, U., Harlan, D.M., and Perfetti, R. (2003). GLP-1 inhibits cell apoptosis and improves glucose responsiveness of freshly isolated human islets. Endocrinology 144, 5149-5158. Fehmann, H.C., and Habener, J.F. (1992). Insulinotropic hormone glucagons-like peptide-I (7-37) stimulation of proinsulin gene expression and proinsulin biosynthesis in insulinoma beta TC-1 cells. Endocrinology 130, 159-166. Fernandez, J., Yaman, I., Mishra, R., Merrick, W.C., Snider, M.D., Lamers, W.H., and Hatzoglou, M. (2001). Internal ribosome entry site-mediated translation of a mammalian mRNA is regulated by amino acid availability. J. Biol. Chem. 276, 12285-12291. Fleischmann, M., and Iynedjian, P.B. (2000). Regulation of sterol regulatory-element binding protein 1 gene expression in liver: role of insulin and protein kinase B/cAkt. Biochem. J. 349, 13-17. Foufelle, F., and Ferre, P. (2002). New perspectives in the regulation of hepatic glycolytic and lipogenic genes by insulin and glucose: a role for the transcription factor sterol regulatory element binding-protein-1c. Biochem. J. 366, 377-391. Frayling, T.M., Evans, J.C., Bulman, M.P., Pearson, E., Allen, L., Owen, K., Bingham, C., Hannemann, M., Shepherd, M., Ellard, S., and Hattersley, A.T. (2001). Beta-cell genes and diabetes: molecular and clinical characterization of mutations in transcription factors. Diabetes 50, S94-100. Gabbay, R.A., Sutherland, C., Gnudi, L., Kahn, B.B., O’Brien, R.M., Granner, D.K., and Flier, J.S. (1996). Insulin regulation of phosphoenolpyruvated carboxykinase gene expression does not require activation of the Ras/mitogen-activated protein kinase signaling pathway. J. Biol. Chem. 271, 1890-1897. Galietta, L.J., Musante, L., Romio, L., Caruso, U., Fantasia, A., Gazzolo, A., Romano, L., Sacco, O., Rossi, G.A., Varesio, L., and Zegarra-Moran, O. (1998). An electrogenic amino acid transporter in the apical membrane of cultured human bronchial epithelial cells. Am. J. Physiol. 275, L917-923. Grofte, T., Wolthers, T., Jorgensen, J.O., Poulsen, P.L., Vilstrup, H., and Moller, N. (1999). Hepatic amino- to urea-N clearance and forearm amino-N exchange

95
during hypoglycemic and euglycemic hyperinsulinemia in normal man. J. Hepatol. 30, 819-825. Groop, L. (1997). The molecular genetics of non-insulin dependent diabetes mellitus. J. Intern. Med. 241, 95-100. Gu, S., Langlais, P., Liu, F., and Jiang, J.X. (2003). Mouse system-N amino acid transporter, mNAT3, expressed in hepatocytes and regulated by insulin-activated and phosphoinositide 3-kinase-dependent signaling. Biochem. J. 371, 721-731. Gu, S., Villegas, C.J., and Jiang, J.X. (2005). Differential regulation of amino acid transporter SNAT3 by insulin in hepatocytes. J. Biol. Chem. 280, 26055-26062. Gylfe, E. (1976). Comparison of the effects of leucines, non-metabolizable leucine analogues and other insulin secretagogues on the activity of glutamate dehydrogenase. Acta Diabetol. Lat. 13, 20-24. Habermeier, A., Wolf, S., Martine, U., Graf, P., and Closs, E.I. (2003). Two amino acid residues determine the low substrate affinity of human cationic amino acid transporter-2A. J. Biol. Chem. 278, 19492-19499. Hatanaka, T., Huang, W., Ling, R., Prasad, P.D., Sugawara, M., Leibach, F.H., and Ganapathy, V. (2001). Evidence for the transport of neutral as well as cationic amino acids by ATA3, a novel and liver-specific subtype of amino acid system A. Biochimica et Biophysica Acta 1510, 10-17. Henningsson, R., and Lundquist, I. (1998). Arginine-induced insulin release is decreased and glucagons increased in parallel with islet NO production. Am. J. Physiol. 275, E500-506. Holz, G.G. (2004). Epac: a new cAMP-binding protein in support of glucagon-like peptide-1 receptor-mediated signal transduction in the pancreatic beta-cell. Diabetes 53, 5-13. Hosokawa, H., Sawamura, T., Kobayashi, S., Ninomiva, H., Miwa, S., and Masaki, T. (1997). Cloning and characterization of a brain-specific cationic amino acid transporter. J. Biol. Chem. 272, 8717-8722. Iynedjian, P.B., Pilot, P.-R., Nouspikel, T., Milburn, J.L., Quaade, C., Hughes, S. Ucla, C., and Newgard, C.B. (1989). Differential expression and regulation of the glucokinase gene in liver and islets of Langerhans. Proc. Natl. Acad. Sci. USA 86, 7838-7842.

96
Jung, D., Hagenbuch, B., Gresh, L., Pontoglio, M., Meier, P.J., and Kullak-Ublick, G.A. (2001). Characterization of the human OATP-C (SLC21A6) gene promoter and regulation of liver-specific OATP genes by hepatocyte nuclear factor 1 alpha. J. Biol. Chem. 276(40), 37206-37214. Kaestner, K.H., Knochel, W., and Martinez, D.E. (2000). Unified nomenclature for the winged helix/forkhead transcription factors. Genes Dev. 14, 142-146. Kim, J.W., Closs, E.I., Albritton, L.M., and Cunningham, J.M. (1991). Transport of cationic amino acids by the mouse ecotropic retrovirus receptor. Nature 352, 725-728. Kolligs, F., Fehmann, H.C., Goke, R., and Goke, B. (1995). Reduction of the incretin effect in rats by the glucagon-like peptide 1 receptor antagonist exendin (9-39) amide. Diabetes 44, 16-19. Lai, E., Prezioso, V.R., Smith, E., Litvin, O., Costa, R.H., and Darnell, J.E. (1990). HNF-3A, a hepatocyte-enriched transcription factor of novel structure is regulated transcriptionally. Genes Dev. 4, 1427-1436. Laffel, L. (1999). Ketone bodies: a review of physiology, pathophysiology and application of monitoring to diabetes. Diabetes Metab. Res. Rev. 15, 412-426. Lehmann, O.J., Sowden, J.C., Carlsson, P., Jordan, T., and Battacharya, S.S. (2003). Fox’s in development and disease. Trends Genet. 19, 339-344. Lee, C.S., Friedman, J.R., Fulmer, J.T., and Kaestner, K.H. (2005). The initiation of liver development is dependent on Foxa transcription factors. Nature 435, 944-947. Lee, C.S., Sund, N.J., Behr, R., Herrera, P.L., and Kaestner, K.H. (2004). Foxa2 is required for the differentiation of pancreatic a-cells. Dev. Biol. 278, 484-495. Lee, Y.-H., Sauer, B., and Gonzalez, F.J. (1998). Laron dwarfism and non-insulin-dependent diabetes mellitus in the Hnf-1a knockout mouse. Mol. Cell. Biol. 18(5), 3059-3068. Li, Y., Hansotia, T., Yusta, B., Ris, F., Halban, P.A., and Drucker, D.J. (2003). Glucagon-like peptide-1 receptor signaling modulates beta cell apoptosis. J. Biol. Chem. 278, 471-478.

97
Low, S.Y., Taylor, P.M., Hundal, H.S., Pogson, C.I., and Rennie, M.J. (1992). Transport of L-glutamine and L-glutamate across sinusoidal membranes of rat liver. Biochem. J. 284, 333-340. Magnuson, M.A., and Shelton, K.D. (1989). An alternate promoter in the glucokinase gene is active in the pancreatic β cell. J. Biol. Chem. 264, 15936-15942. Matschinsky, F. (1990). Glucokinase as glucose sensor and metabolic signal generator in pancreatic beta-cells and hepatocytes. Diabetes 39, 647-652. Matchinsky, F.M. (2005). Glucokinase, glucose homeostasis, and diabetes mellitus. Curr. Diab. Rep. 5, 171-6. Mayo, K.E., Miller, L.J., Bataille, D., Dalle, S., Goke, B., Thorens, B., and Drucker, D.J. (2003). International Union of Pharmacology. XXXV. The glucagon receptor family. Pharmacol. Rev. 55, 167-194. McClenaghan, N.H., Barnett, C.R., and Flatt, P.R. (1998). Na+ cotransport by metabolizable and nonmetabolizable amino acids stimulates a glucose-regulated insulin-secretory response. Biochem. Biophys. Res. Commun. 249, 299-303. Mendel, D.B., and Crabtree, G.R. (1991). A member of a novel class of dimerizing homeodomain proteins. J. Biol. Chem. 266, 677-680. Menzel, R., Kaisaki, P.J., Rjasanowski, I., Heinke, P., Kerner, W., and Menzel, S. 1998. A low renal threshold for glucose in diabetic patients with a mutation in the hepatocyte nuclear factor-alpha (HNF-1alpha) gene. Diabet. Med. 15, 816-820. Miyake, K., Ogawa, W., Matsumoto, M., Nakamura, T., Sakaue, H., and Kasuga, M. (2002). Hyperinsulinemia, glucose intolerance, and dyslipidemia induced by acute inhibition of phosphoinositide 3-kinase signaling in the liver. J. Clin. Invest. 110, 1483-1491. Mortensen, K., Christensen, L.L., Holst, J.J., and Orskov, C. (2003). GLP-1 and GIP are colocalized in a subset of endocrine cells in the small intestine. Regul. Pept. 114, 189-196. Myers, M.G., Jr., Wang, L.M., Sun, X.J., Zhang, Y., Yenush, L., Schlessinger, J., Pierce, J.H., and White, M.F. (1994). Role of IRS-1-GRB-2 complexes in insulin signaling. Mol. Cell. Biol. 14, 3577-3587. Nakae, J., Biggs, W.H., III, Kitamura, T., Cavenee, W.K., Wright, C.V.E., Arden, K.C., and Accili, D. (2002). Regulation of insulin action and pancreatic b-cell
98
function by mutated alleles of the gene encoding forkhead transcription factor Foxo1. Nature Gen. 32, 245-253. Nakae, J., Kitamura, T., Silver, D.L., and Accili, D. (2001). The forkhead transcription factor Foxo1 (Fkhr) confers insulin sensitivity onto glucose-6-phosphatase expression. J. Clin. Invest. 108, 1359-1367. Nordlie, R.C., Foster, J.D., and Lange, A.J. (1999). Regulation of glucose production by the liver. Annu. Rev. Nutr. 19, 379-406. Osborne, T.F. (2000). Sterol regulatory element-binding proteins (SREBPs): key regulators of nutritional homeostasis and insulin action. J. Biol. Chem. 275, 32379-32382. Pain, V.M. (1994). Biochimie (Paris) 76, 718-728. Panten, U., Kriegstein, E., Poser, W., Schonborn, J., and Hasselblatt, A. (1972). Effects of L-leucine and a-ketoisocaproic acid upon insulin secretion and metabolism of isolated pancreatic islets. FEBS Lett. 20, 225-228. Patti, M.E., and Kahn, C.R. (1998). The insulin receptor – a critical link in glucose homeostasis and insulin action. J. Basic Clin. Physiol. Pharmacol. 9, 89-109. Peet, D.J., Turley, S.D., Ma, W., Janowski, B.A., Lobaccaro, J.M., Hammer, R.E., and Mangelsdorf, D.J. (1998). Cholesterol and boil acid metabolism are impaired in mice lacking the nuclear oxysterol receptor LXR alpha. Cell 93, 693-704. Pessin, J.E., and Saltiel, A.R. (2000) Signaling pathways in insulin action: molecular targets of insulin resistance. J. Clin. Invest. 106, 165-169. Pfeiffer, R., Rossier, G., Spindler, B., Meier, C., Kuhn, L., and Verrey, F. (1999). Amino acid transport of y+L-type by heterodimers of 4F2hc/CD98 and members of the glycoprotein-associated amino acid transporter family. EMBO J. 18, 49-57. Pilkis, S.J., and Granner, D.K. (1992). Molecular physiology of the regulation of hepatic gluconeogenesis and glycolysis. Annu. Rev. Physiol. 54, 885-909. Pontoglio, M., Barra, J., Hadchouel, M., Doyen, A., Kress, C., Bach, J.P., Babinet, C., and Yaniv, M. (1996). Hepatocyte nuclear factor 1 inactivation results in hepatic dysfunction, phenylketonuria, and renal Fanconi syndrome. Cell 84(4), 575-585.

99
Pontoglio, M., Prie, D., and Cheret, C. (2000). HNF1alpha controls renal glucose reabsorption in mouse and man. EMBO Rep 4, 359-365. Pontoglio, M., Sreenan, S., Roe, M., Pugh, W., Ostrega, D., Doyen, A., Pick, A.J., Baldwin, A., Velho, G., Froguel, P., Levisetti, M., Bonner-Weir, S., Bell, G.I., Yaniv, M., and Polonsky, K.S. (1998). Defective insulin secretion in hepatocyte nuclear factor 1alpha-deficient mice. J. Clin. Invest. 101(10), 2215-2222. Rasmussen, B.B., Fujita, S., Wolfe, R.R., Mittendorfer, B., Roy, M., Rowe, V.L., and Volpi, E. (2006). Insulin resistance of muscle protein metabolism in aging. FASEB J. 20, 768-9. Rotoli, B.M., Bussolati, O., Sala, R., Gazzola, G.C., and Dall’Asta, V. (2005). The transport of cationic amino acids in human airway cells: expression of system y+L activity and transepithelial delivery of NOS inhibitors. FASEB J. 19(7), 810-812. Saltiel, A.R., and Kahn, C.R. (2001). Insulin signaling and the regulation of glucose and lipid metabolism. Nature 414, 799-806. Sander, M., and German, M.S. (1997). The beta cell transcription factors and development of the pancreas. J. Mol. Med. 75, 327-40. Schmoll, D., Grempler, R., Barthel, A., Joost, H.G., and Walther, R. (2001). Phorbol ester-induced activation of mitogen-activated protein kinase/extracellular-signal-regulated kinase kinase and extra-cellular-sign-regulated protein kinase decreases glucose-6-phosphatase gene expression. Biochem. J. 357, 867-873. Sener, A., Best, L.C., Yates, A.P., Kadiata, M.M., Olivares, E., Louchami, K., Jijakli, H., Ladriere, L., and Malaisse, W.J. (2000). Stimulus-secretion coupling of arginine-induced insulin release: comparison between the cationic amino acid and its methyl ester. Endocrine 13(3), 329-340. Sener, A., and Malaisse, W.J. (1980). L-Leucine and a nonmetabolized analogue activate pancreatic islet glutamate dehydrogenase. Nature 288, 187-189. Sener, A., Malaisse-Lagae, F., and Malaisse, W.J. (1982). The stimulus-secretion coupling of glucose-induced insulin release. Environmental influences on L-glutamine oxidation in pancreatic islets. Biochem. J. 202, 309-316. Shih, D.Q., Bussen, M., Sehayek, E., Ananthanarayanan, M., Shneider, B.L., Suchy, F.J., Shefer, S., Bollileni, J.S., Gonzalez, F.J., Breslow, J.L., and Stoffel, M.

100
(2001). Hepatocyte nuclear factor-1alpha is an essential regulator of bile acid and plasma cholesterol metabolism. Nat. Genet. 27(4), 375-382. Shih, D.Q., and Stoffel, M. (2002). Molecular etiologies of MODY and other early-onset forms of diabetes. Curr. Diab. Rep. 2, 125-34. Shoji, Y., Noguchi, A., Shoji, Y., Matsumori, M., Takasago, Y., Takayanagi, M., Yoshida, Y., Ihara, K., Hara, T., Yamaguchi, S., Yoshino, M., Kaji, M., Yamamoto, S., Nakai, A., Koizumi, A., Hokezu, Y., Nagamatsu, K., Mikami, H., Kitajima, I., and Takada, G. (2002). Five novel SLC7A7 variants and y+L gene-expression pattern in cultured lymphoblasts from Japanese patients with lysinuric protein intolerance. Hum. Mutat. 20(5), 375-381. Smith, P.A., Sakura, H., Coles, B., Gummerson, N., Proks, P., and Ashcroft, F.M. (1997). Electrogenic arginine transport mediates stimulus-secretion coupling in mouse pancreatic beta-cells. J. Physiol. 499, 625-635. Sperandeo, M.P., Annunziata, P., Ammendola, V., Fiorito, V., Pepe, A., Soldovieri, M.V., Taglialatela, M., Andria, G., and Sebastio, G. (2005). Lysinuric protein intolerance: identification and functional analysis of mutations of the SLC7A7 gene. Hum. Mutat. 25(4): 410. Sperandeo, M.P., Borsani, G., Incerti, B., Zollo, M., Rossi, E., Zuffardi, O., Castaldo, P., Taglialetela, M., Andria, G., and Sebastio, G. (1998). The gene encoding a cationic amino acid transporter (SLC7A4) maps to the region deleted in the velocardiofacial syndrome. Genomics 49(2), 230-236. Stoffers, D.A., Kieffer, T.J., Hussain, M.A., Drucker, D.J., Bonner-Weir, S., Habener, J.F., and Egan, J.M. (2000). Insulinotropic glucagon-like peptide 1 agonists stimulate expression of homeodomain protein IDX-1 and increase islet size in mouse pancreas. Diabetes 49, 741-748. Sugawara, M., Nakanishi, T., Fei, Y.J., Martindale, R.G., Ganapathy, M.E., Leibach, F.H., and Ganapathy, V. (2000). Structure and function of ATA3, a new subtype of amino acid transport system A, primarily expressed in the liver and skeletal muscle. Biochim. Biophys. Acta. 1509(1-2), 7-13. Sun, X.J., Pons, S., Wang, L.M., Zhang, Y., Yenush, L., Burks, D., Myers, M.G., Jr., Glasheen, E., Copeland, N.G., Jenkins, N.A., Pierce, J.H., and White, M.F. (1997). The IRS-2 gene on murine chromosome 8 encodes a unique signaling adapter for insulin and cytokine action. Mol. Endocrinol. 11, 251-262.

101
Sutherland, C., Waltner-Law, M., Gnudi, L., Kahn, B.B., and Granner, D.K. (1998). Activation of the ras mitogen-activated protein kinase-ribosomal protein kinase pathway is not required for the repression of phosphoenolpyruvate carboxykinase gene transcription by insulin. J. Biol. Chem. 273, 3198-3204. Suviolahti, E., Oksanen, L.J., Ohman, M., Cantor, R.M., Ridderstrale, M., Tuomi, T., Kaprio, J., Rissanen, A., Mustajoki, P., Jousilahti, P., Vartiainen, E., Silander, K., Kilpikari, R., Salomaa, V., Groop, L., Kontula, K., Peltonen, L., and Pajukanta, P. (2003). The SLC6A14 gene shows evidence of association with obesity. J. Clin. Invest. 112(11), 1762-1772. Taniguchi, C.M., Emanuelli, B., and Kahn, C.R. (2006). Critical nodes in signalling pathways: insights into insulin action. Nat. Rev. Mol. Cell Biol. 7, 85-96. Taniguchi, C.M., Ueki, K., and Kahn, C.R. (2005). Complementary roles of IRS-1 and IRS-2 in the hepatic regulation of metabolism. J. Clin. Invest. 115, 718-727. Torrents, D., Estevez, R., Pineda, M., Fernandez, E., Lloberas, J., Shi, Y., Zorzano, A., and Palacin, M. (1998). Identification and characterization of a membrane protein (y+L amino acid transporter-1) that associates with 4F2hc to encode the amino acid transport activity y+L – a candidate gene for lysinuric protein intolerance. J. Biol. Chem. 273, 32437-32445. Vainshtein, I., Kovacina, K.S., and Roth, R.A. (2000). The Insulin Receptor Substrate (IRS)-1 Pleckstrin Homology Domain Functions in Downstream Signaling. J. Biol. Chem. 276, 8073-8078. Verrey, F., Closs, E.I., Wagner, C.A., Palacin, M., Endou, H., and Kanai, Y. (2003). CATs and HATs: the SLC7 family of amino acid transporters. Pflugers Arch. 447(5), 532-542. Wagner, C.A., Roca, R., Valencia, A., Zorzano, A., and Palacin, M. (2001). Heteromeric amino acid transporters: biochemistry, genetics and physiology. Am. J. Physiol. Renal Physiol. 281, F995-F1018. Wang, Z., Wang, R.M., Owji, A.A., Smith, D.M., Ghatei, M.A., and Bloom, S.R. (1995). Glucagon-like peptide-1 is a physiological incretin in rat. J. Clin. Invest. 95, 417-421. Weigel, D., Jurgens, G., Kuttner, F., Seifert, E., and Jackle, H. (1989). The homeotic gene fork head encodes a nuclear protein and is expressed in the terminal regions of the Drosophila embryo. Cell 57, 645-658.

102
Wells, R.G., Lee, W.S., Kanai, Y., Leiden, J.M., and Hediger, M.A. (1992). The 4F2 antigen heavy chain induces uptake of neutral and dibasic amino acids in Xenopus oocytes. J. Biol. Chem. 267, 15285-15288. White, M.F., and Kahn, C.R. (1994). The insulin signaling system. J. Biol. Chem. 269, 1-4. Wolf, S., Janzen, A., Vekony, N., Martine, U., Strand, D., and Closs, E.I. (2002). Expression of solute carrier 7A4 (SLC7A4) in the plasma membrane is not sufficient to mediate amino acid transport activity. Biochem. J. 364, 767-775. Wolfrum, C., Asilmaz, E., Luca, E., Friedman, J.M., and Stoffel, M. (2004). Foxa2 regulates lipid metabolism and ketogenesis in the liver during fasting and in diabetes. Nature 432, 1027-1032. Wolfrum, C., Besser, D., Luca, E., and Stoffel, M. (2003). Insulin regulates the activity of forkhead transcription factor Hnf-3b/Foxa2 by Akt-mediated phosphorylation and nuclear/cytosolic localization. Proc. Natl. Acad. Sci. USA 100, 11624-11629. Xu, G., Stoffers, D.A., Habener, J.F., and Bonner-Weir, S. (1999). Exendin-4 stimulates both beta-cell replication and neogenesis, resulting in increased beta-cell mass and improved glucose tolerance in diabetic rats. Diabetes 48, 2270-2276. Zhang, L., Rubins, N.E., Ahima, R.S., Greenbaum, L.E., and Kaestner, K.H. (2005). Foxa2 integrates the transcriptional response of the hepatocyte to fasting. Cell Metab. 2, 141-148. Zimmet, P. (1999). Diabetes epidemiology as a trigger to diabetes research. Diabetologia 42, 499-518. Zimmet, P., Alberti, K.G., and Shaw, J. (2001). Global and societal implications of the diabetes epidemic. Nature 414, 782-787.
Top Related