


Languages
Pages
Legal


FY2012FY2012 2Q2Q((Ended September 2012Ended September 2012))
Financial Results((Ended September 2012Ended September 2012))
Financial Results& Business Update& Business Update
Nov 20 2012
((Security CodeSecurity Code::67876787))
Nov. 20, 2012
DisclaimerDisclaimer
This presentation contains forwardThis presentation contains forward--looking statements concerning looking statements concerning Meiko Group’s future plans, strategies and performance. However, Meiko Group’s future plans, strategies and performance. However, Meiko does not publish this presentation as a disclosure document Meiko does not publish this presentation as a disclosure document based on the Financial Instruments and Exchange Act of Japan.based on the Financial Instruments and Exchange Act of Japan.
These forwardThese forward--looking statements are not historical facts, rather they looking statements are not historical facts, rather they represent assumptions and beliefs based on comprehensive data represent assumptions and beliefs based on comprehensive data currently available.currently available.
Furthermore, the PWB business is subject to a number of risks and Furthermore, the PWB business is subject to a number of risks and uncertainties that relate to raw material price, conditions of customers’ uncertainties that relate to raw material price, conditions of customers’ market technological trends foreign currency exchange rates taxmarket technological trends foreign currency exchange rates taxmarket, technological trends, foreign currency exchange rates, tax market, technological trends, foreign currency exchange rates, tax rules, regulations, disasters, international conflicts and other factors. rules, regulations, disasters, international conflicts and other factors. Meiko therefore wishes to caution that actual results may differ Meiko therefore wishes to caution that actual results may differ materially from our expectationsmaterially from our expectationsmaterially from our expectations.materially from our expectations.
-1-
1. Highlights 1. Highlights of FY2012 of FY2012 2Q2Q
PagePage
11-- 11 Outline of 1Q & 2Q Business ResultsOutline of 1Q & 2Q Business Results 3311 1.1. Outline of 1Q & 2Q Business ResultsOutline of 1Q & 2Q Business Results
11-- 2.2. Consolidated Financial Results (Consolidated Financial Results (YoYYoY))
33
44
11-- 3.3. NonNon--Consolidated Financial Results (Consolidated Financial Results (YoYYoY))
11-- 4.4. Major Sections ResultsMajor Sections Results
55
66jj
11-- 5.5. Net Net Sales (by businessSales (by business)) 77
8811-- 6.6. Net Net Sales (by marketSales (by market))
11-- 7.7. Net Net Sales (by productsSales (by products))
88
99
-2-
11-- 1. Outline of 1Q & 2Q Business Results1. Outline of 1Q & 2Q Business Results
-3-
11-- 2.2. Consolidated Financial Results (Consolidated Financial Results (YoYYoY))
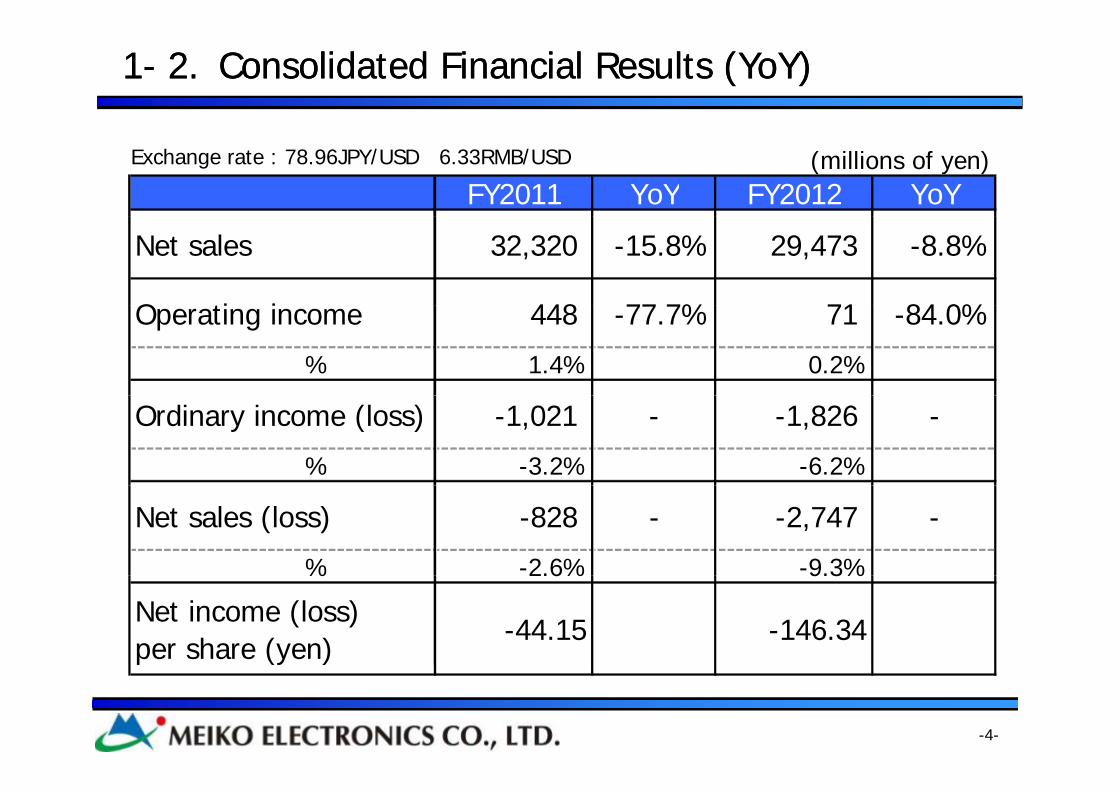
Exchange rate : 78.96JPY/USD 6.33RMB/USD (millions of yen)FY2011 YoY FY2012 YoY
Net sales 32,320 -15.8% 29,473 -8.8%
O ti i 448 77 7% 71 84 0%Operating income 448 -77.7% 71 -84.0%
% 1.4% 0.2%
Ordinary income (loss) -1,021 - -1,826 -
% -3.2% -6.2%
Net sales (loss) -828 - -2,747 -
% -2.6% -9.3%% 2.6% 9.3%
Net income (loss)per share (yen)
-44.15 -146.34
-4-

11-- 3.3. NonNon--Consolidated Financial Results (Consolidated Financial Results (YoYYoY))
Exchange rate : 78.96JPY/USD 6.33RMB/USD (millions of yen)FY2011 YoY FY2012 YoY
Net sales 17,001 -27.6% 14,957 -12.0%
O ti i 1 264 13 3% 620 50 9%Operating income 1,264 13.3% 620 -50.9%
% 7.4% 4.1%
Ordinary income (loss) -317 - 429 -
% -1.9% 2.9%
Net sales (loss) 106 -78.7% 401 276.6%
% 0.6% 2.7%% 0.6% 2.7%
Net income (loss)per share (yen)
5.68円 21.41円
-5-

11-- 4.4. Major Sections ResultsMajor Sections Results
Exchange rate : 78.96JPY/USD 6.33RMB/USD (millions of yen)Guangzhou Plant FY2011 YoY FY2012 YoYNet sales 13,725 -15.2% 14,362 4.6%
Operating income (loss) -18 - 1,050 -% -0.1% 7.3%
Wuhan Plant FY2011 YoY FY2012 YoYN l 11 584 11 0% 8 476 26 8%Net sales 11,584 -11.0% 8,476 -26.8%
Operating income (loss) 579 -48.5% -888 -% 5.0% -10.5%
Vietnam Plant FY2011 YoY FY2012 YoYNet sales 149 820 450 1%Net sales 149 - 820 450.1%
Operating income (loss) -209 - -829 -% 140 3% 101 1%
-6-
% -140.3% -101.1%
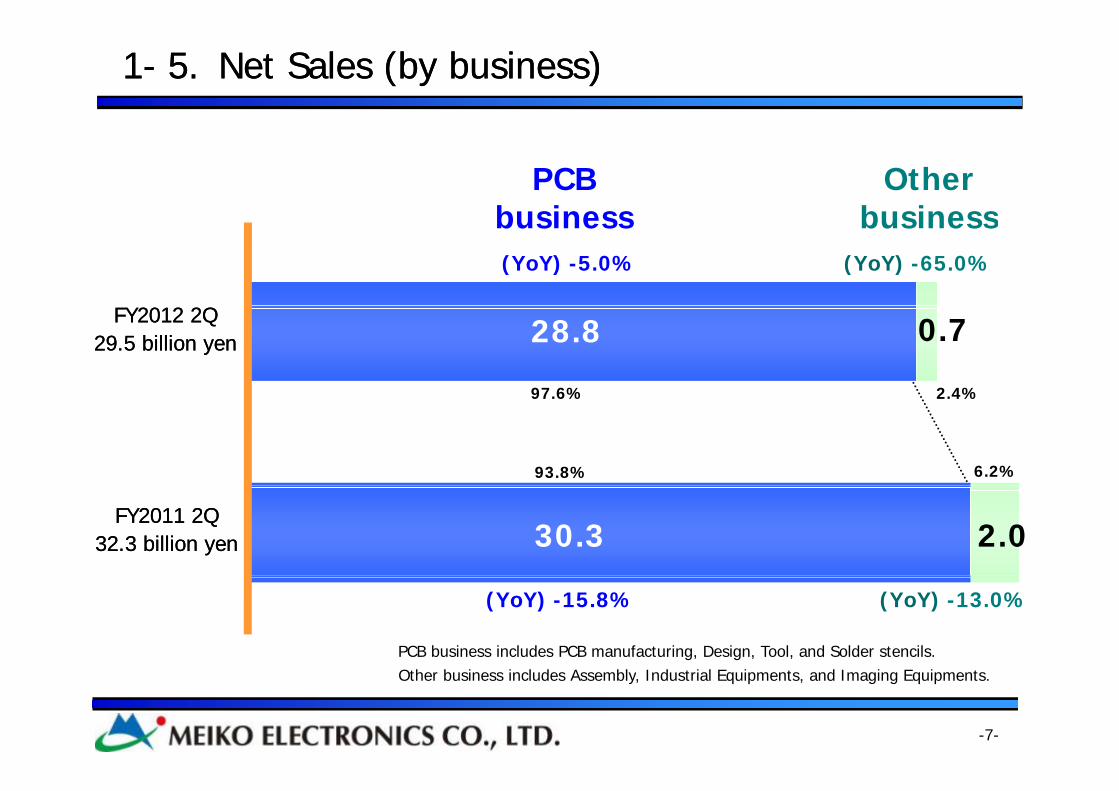
11-- 5.5. Net Net Sales (by businessSales (by business))
PCB business
Other businessbusiness business
(YoY) -65.0%(YoY) -5.0%
28.8 0.7FY2012 FY2012 2Q2Q29.5 billion yen29.5 billion yen
97 6% 2 4%
93.8% 6.2%
97.6% 2.4%
FY2011 FY2011 2Q2Q32.3 billion yen32.3 billion yen 2.030.3
(YoY) -15.8% (YoY) -13.0%
PCB business includes PCB manufacturing, Design, Tool, and Solder stencils.
-7-
Other business includes Assembly, Industrial Equipments, and Imaging Equipments.
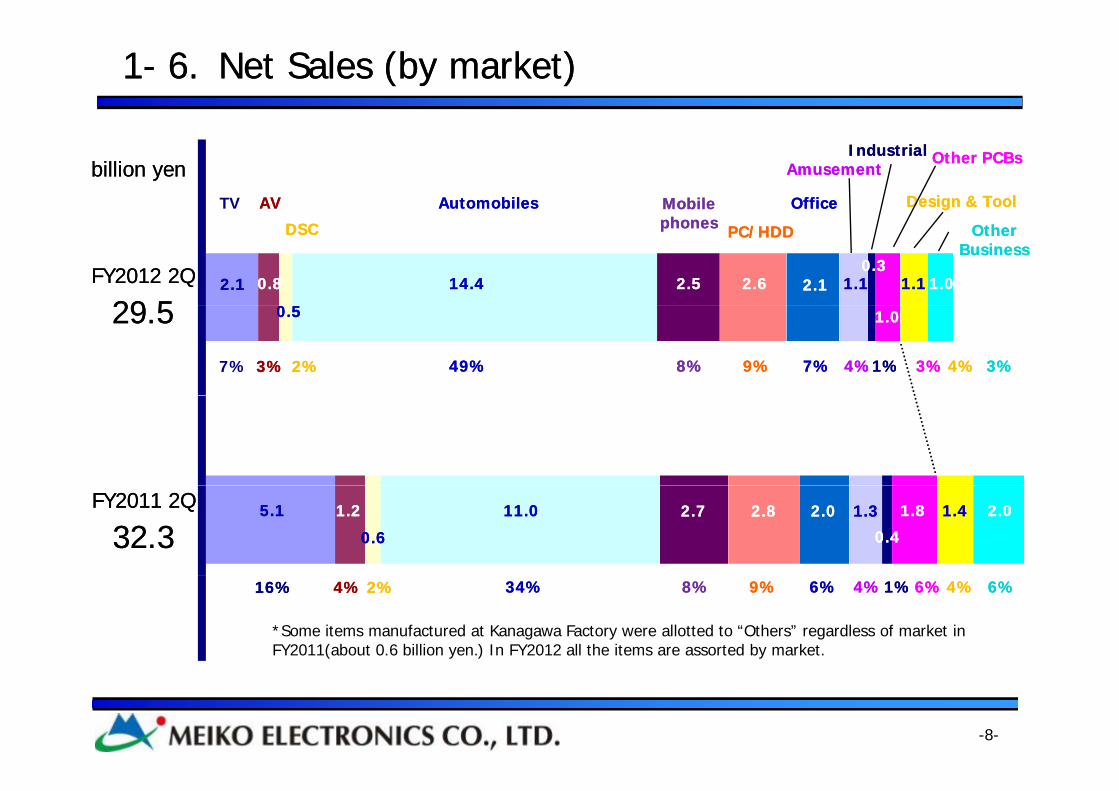
11-- 6.6. Net Net Sales (by marketSales (by market))
TV AVAV AutomobilesAutomobiles Mobile Mobile OfficeOffice
AmusementAmusementIndustrialIndustrial Other PCBsOther PCBs
Design & ToolDesign & Tool
billion yenbillion yen
DSCDSC phonesphones PC/HDDPC/HDD Other Other BusinessBusiness
2.12.1 0.80.8
0 50 5
14.414.4 2.52.5 2.62.6 2.12.1 1.11.10.30.3
1.01.01.11.1FY2012 2QFY2012 2Q
29 529 5 0.50.5 1.01.0
7% 3%3% 2%2% 49%49% 8%8% 9%9% 7%7% 4%4%1%1% 3%3% 4%4% 3%3%
29.529.5
1.21.2
0.60.6
11.011.0 2.72.7 2.82.8 2.02.0 1.31.3 1.81.8
0.40.4
1.41.4 2.02.05.15.1FY2011 2QFY2011 2Q
32.332.316%16% 4%4% 2%2% 34%34% 8%8% 9%9% 6%6% 4%4%1%1%6%6% 4%4% 6%6%
*Some items manufactured at Kanagawa Factory were allotted to “Others” regardless of market in FY2011(about 0.6 billion yen.) In FY2012 all the items are assorted by market.
-8-

HH
11-- 7.7. Net Net Sales (by products)Sales (by products)
DoubleDouble-- 4 layers 4 layers 6 or more 6 or more HDIHDI
An
y Layer HA
ny Layer H
Mod
Mod
FPC
/FP
C/
Heavy C
oppH
eavy Copp
Heat D
issipatH
eat Dissipat
Design
& T
Design
& T
Oth
Oth
billion yenbillion yen
3.63.6 10.810.8 5.55.5 4.84.8 0.30.3
0.40.4
0.80.8
0.60.6
1.11.1 1.01.0
sided sided yy
layerslayersHDIHDI
HD
IH
DI
ule
ule
/FR/FRperper
tiontionToolTool
ersers
FY2012 2QFY2012 2Q
29 529 50.60.6
12%12% 37%37% 19%19% 16%16% 1%1% 2%2% 2%2% 3%3%1%1% 3%3%
4%4%
29.529.5
0 50 5 0 60 6
4.14.1 13.013.0 4.64.6 4.54.5 0.80.8
0.50.5
0.30.3
0.50.5
0.60.6
1.41.4 2.02.0FY2011 2QFY2011 2Q
32.332.3
13%13% 40%40% 14%14% 14%14%2%2% 1%1% 2%2% 6%6%
2%2% 2%2%
4%4%
-9-
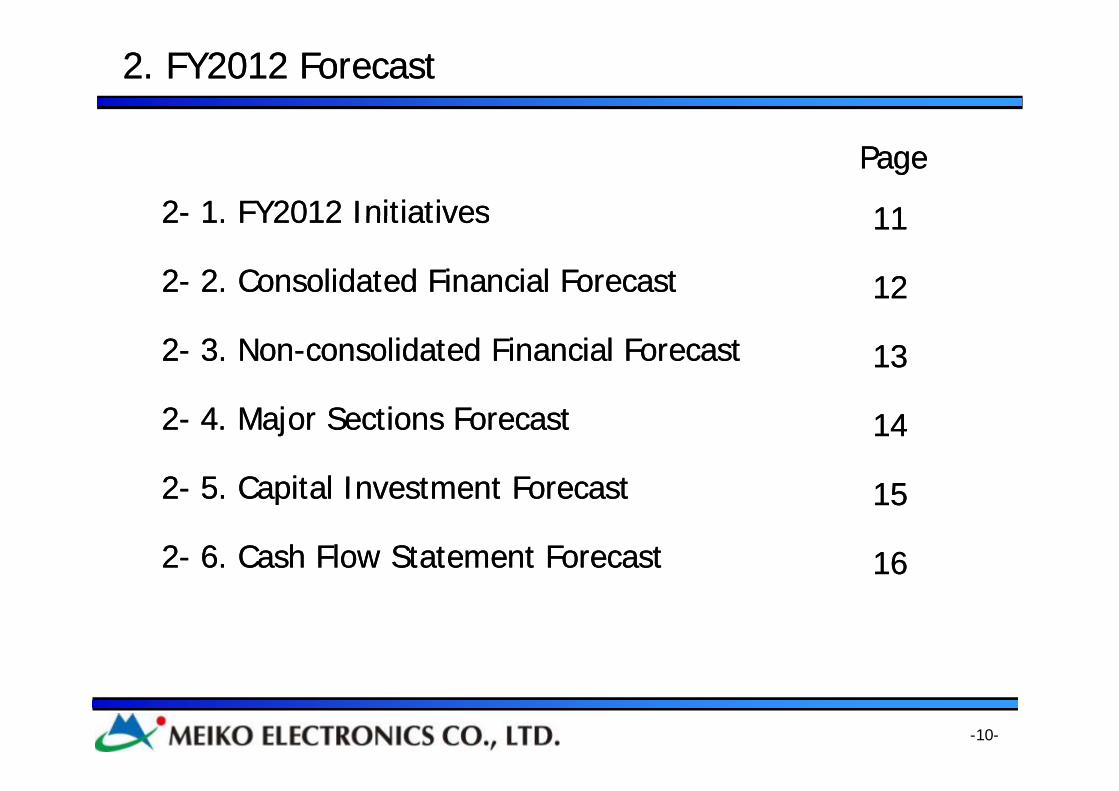
2. FY2012 Forecast2. FY2012 Forecast
22-- 1 FY2012 Initiatives1 FY2012 Initiatives
PagePage
111122 1. FY2012 Initiatives1. FY2012 Initiatives
22-- 2. Consolidated Financial Forecast2. Consolidated Financial Forecast
1111
1212
22-- 3. Non3. Non--consolidated Financial Forecastconsolidated Financial Forecast 1313
22-- 4. 4. Major Sections Major Sections ForecastForecast
22 5 Capital Investment Forecast5 Capital Investment Forecast
1414
151522-- 5. Capital Investment Forecast5. Capital Investment Forecast
22-- 6. Cash Flow Statement Forecast6. Cash Flow Statement Forecast
1515
1616
-10-

22-- 1. FY2012 1. FY2012 InitiativesInitiatives
-11-
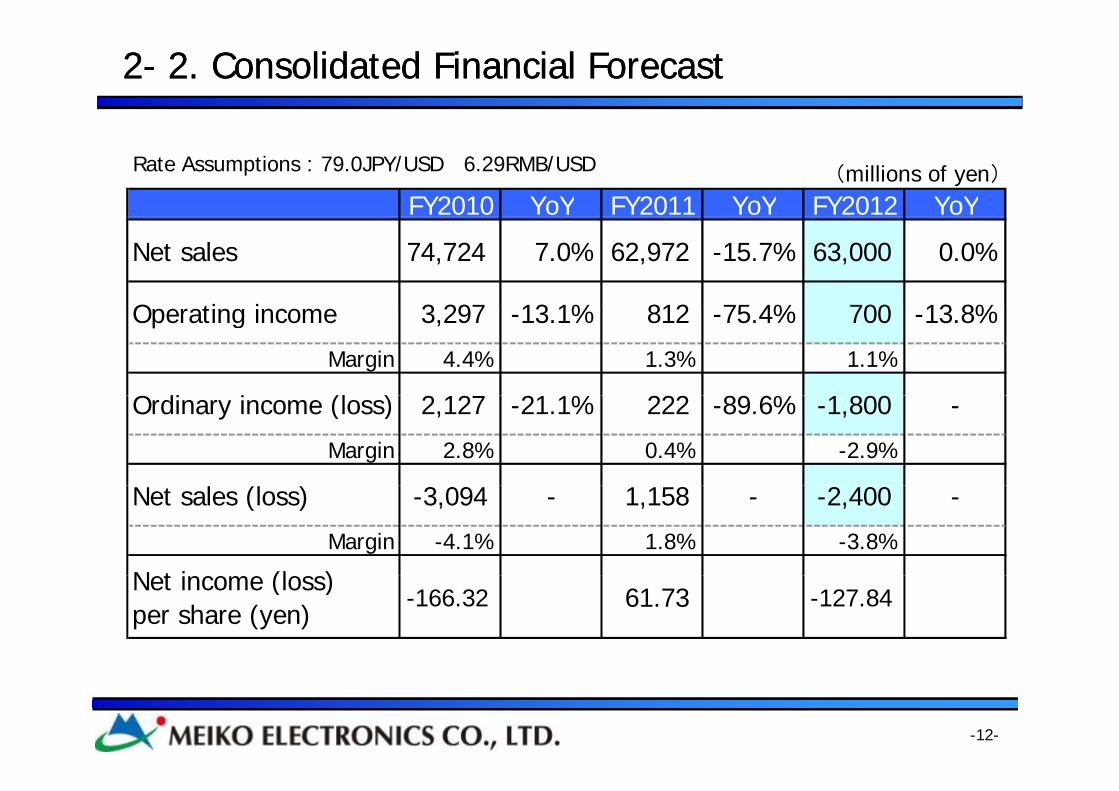
22-- 2. Consolidated Financial 2. Consolidated Financial ForecastForecast
(millions of yen)FY2010 YoY FY2011 YoY FY2012 YoY
Rate Assumptions : 79.0JPY/USD 6.29RMB/USD
Net sales 74,724 7.0% 62,972 -15.7% 63,000 0.0%
O ti i 3 297 13 1% 812 75 4% 700 13 8%Operating income 3,297 -13.1% 812 -75.4% 700 -13.8%
Margin 4.4% 1.3% 1.1%
O di i (l ) 2 127 21 1% 222 89 6% 1 800Ordinary income (loss) 2,127 -21.1% 222 -89.6% -1,800 -
Margin 2.8% 0.4% -2.9%
l (l )Net sales (loss) -3,094 - 1,158 - -2,400 -
Margin -4.1% 1.8% -3.8%
N t i (l )Net income (loss)per share (yen)
-166.32 61.73 -127.84
-12-

22-- 3. Non3. Non--consolidated Financial consolidated Financial ForecastForecast
(millions of yen)FY2010 YoY FY2011 YoY FY2012 YoY
Rate Assumptions : 79.0JPY/USD 6.29RMB/USD
Net sales 44,634 3.5% 33,802 -24.3% 30,000 -11.2%
O ti i 2 661 619 1% 2 569 3 5% 1 200 53 3%Operating income 2,661 619.1% 2,569 -3.5% 1,200 -53.3%
Margin 6.0% 7.6% 4.0%
O di i (l ) 1 822 116 5% 2 204 21 0% 900 59 2%Ordinary income (loss) 1,822 116.5% 2,204 21.0% 900 -59.2%
Margin 4.1% 6.5% 3.0%
l (l )Net sales (loss) -2,909 - 3,677 - 1,350 -63.3%
Margin -6.5% 10.9% 4.5%
N t i (l )Net income (loss)per share (yen)
-156.35 195.89 71.91
-13-
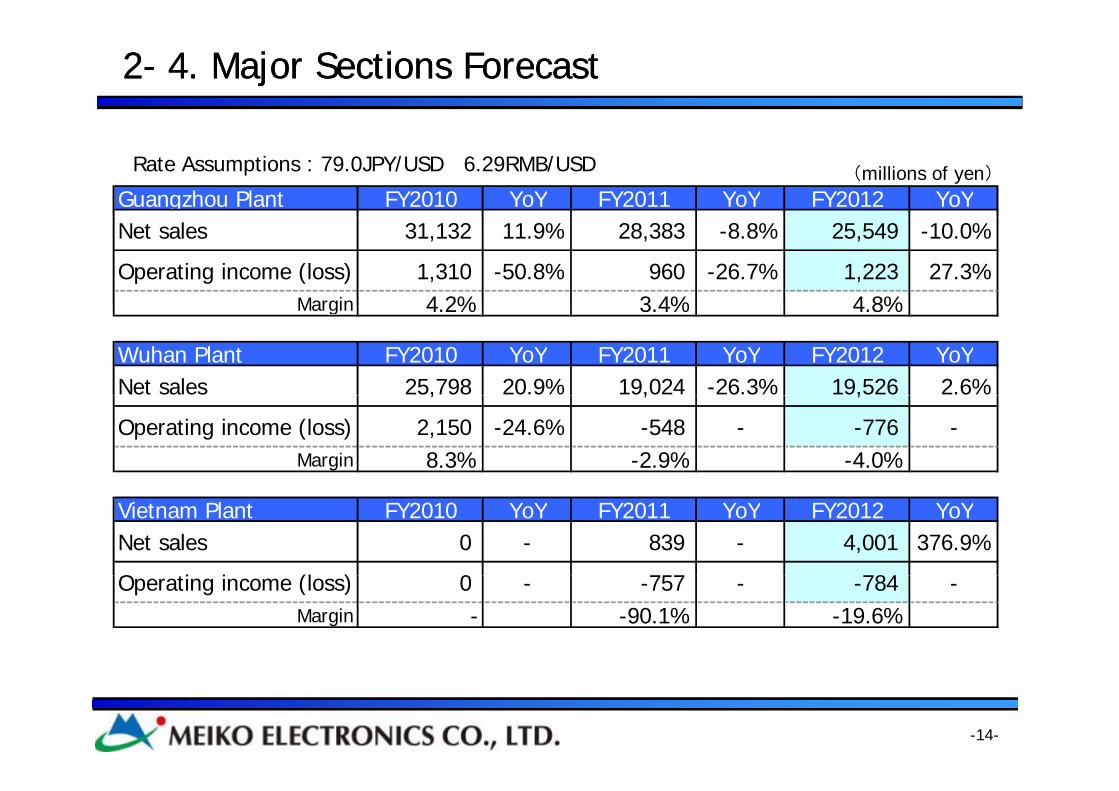
22-- 4. 4. Major Sections Major Sections ForecastForecast
(millions of yen)Guangzhou Plant FY2010 YoY FY2011 YoY FY2012 YoY
Rate Assumptions : 79.0JPY/USD 6.29RMB/USD
Net sales 31,132 11.9% 28,383 -8.8% 25,549 -10.0%
Operating income (loss) 1,310 -50.8% 960 -26.7% 1,223 27.3%Margin 4 2% 3 4% 4 8%Margin 4.2% 3.4% 4.8%
Wuhan Plant FY2010 YoY FY2011 YoY FY2012 YoYNet sales 25,798 20.9% 19,024 -26.3% 19,526 2.6%, , ,
Operating income (loss) 2,150 -24.6% -548 - -776 -Margin 8.3% -2.9% -4.0%
Vietnam Plant FY2010 YoY FY2011 YoY FY2012 YoYNet sales 0 - 839 - 4,001 376.9%
O ti i (l ) 0 757 784Operating income (loss) 0 - -757 - -784 -Margin - -90.1% -19.6%
-14-

22-- 5. Capital Investment 5. Capital Investment ForecastForecast
19 Capital investment for outside JapanCapital investment for outside Japan
Capital investment for inside JapanCapital investment for inside Japan
(billion yen)(billion yen)
178.7178.7
15
17
p pp p
21.021.0
11
13
15
96 196 19
11 157.7157.7
6.06.096.196.1
67.867.860 060 0
5
7 12.012.090.190.155 855 8
67.867.8
5.05.055 055 0
60.060.0
3 55.855.8
FY2010FY2010 FY2011FY2011 FY2012FY2012
55.055.0
FY2013FY2013forecastforecast
-15-
forecastforecast

22-- 6. Cash Flow Statement 6. Cash Flow Statement ForecastForecast
20
10
15
Cash flow from Cash flow from financingfinancing activitiesactivities
23.623.610.610.6
86.886.8
0
5Cash flow from Cash flow from operating operating activitiesactivities
financing financing activitiesactivities
79.279.2 92.592.555.455.4
65 965 9
10
-5
Cash flow from Cash flow from investing investing activitiesactivities
--179.1179.1--103.8103.8 --65.965.9
-15
-10
-20
FY2010FY2010--13.113.1--99.999.9
Net CFNet CF
Free CFFree CF
FY2011FY2011
--11.311.3+12.3+12.3
FY2012FY2012
--10.510.5+0.1+0.1
-16-
0 00 0 00 00ForecastForecast

3. Market Trends3. Market Trends
33-- 1 Global Market (1)1 Global Market (1)-- Mobile Phone & PCMobile Phone & PC
PagePage
181833 1. Global Market (1)1. Global Market (1) Mobile Phone & PCMobile Phone & PC
33-- 2. 2. Global Market Global Market (2)(2)-- HDD HDD & & SSDSSD
1818
1919
33-- 3. 3. Global Market Global Market (3)(3)-- Automobile & HVAutomobile & HV 2020
-17-
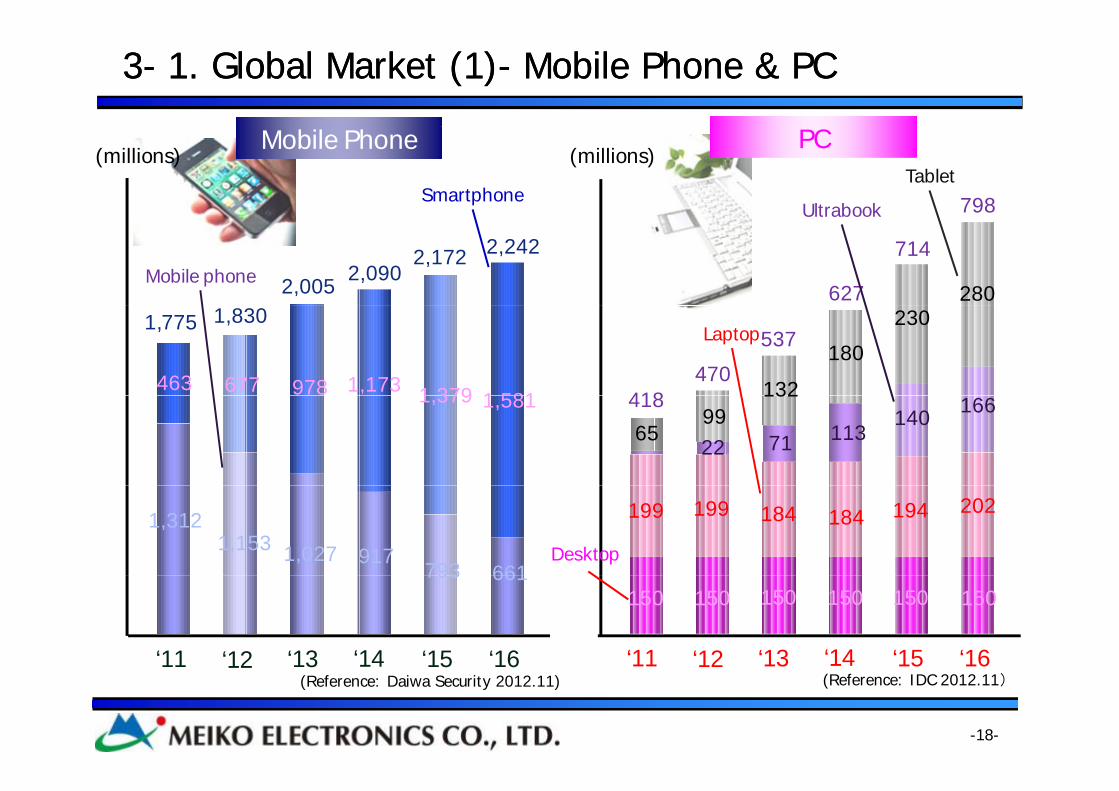
33-- 1. Global Market (1)1. Global Market (1)-- Mobile Phone & Mobile Phone & PCPC
Mobile Phone(millions)
Smartphone 798Ultrabook
Tablet
PC(millions)
Mobile phone627
714
280
Ultrabook
2,0052,090
2,172 2,242
463 677 978 1,173 1 379 1 581 418
537
470180
230
132
Laptop1,775 1,830
1,379 1,581 418 132
6599
113140 166
7122
1,3121,153 1,027 917
793 661
199 184 194 202184199
Desktop
‘11 ‘12 ‘13 ‘14 ‘15 ‘16
793 661
‘11 ‘12 ‘13 ‘14 ‘15 ‘16
150 150 150 150150150
-18-
11 12 13 14 15 16(Reference: Daiwa Security 2012.11)
11 12 13 14 15 16(Reference: IDC 2012.11)
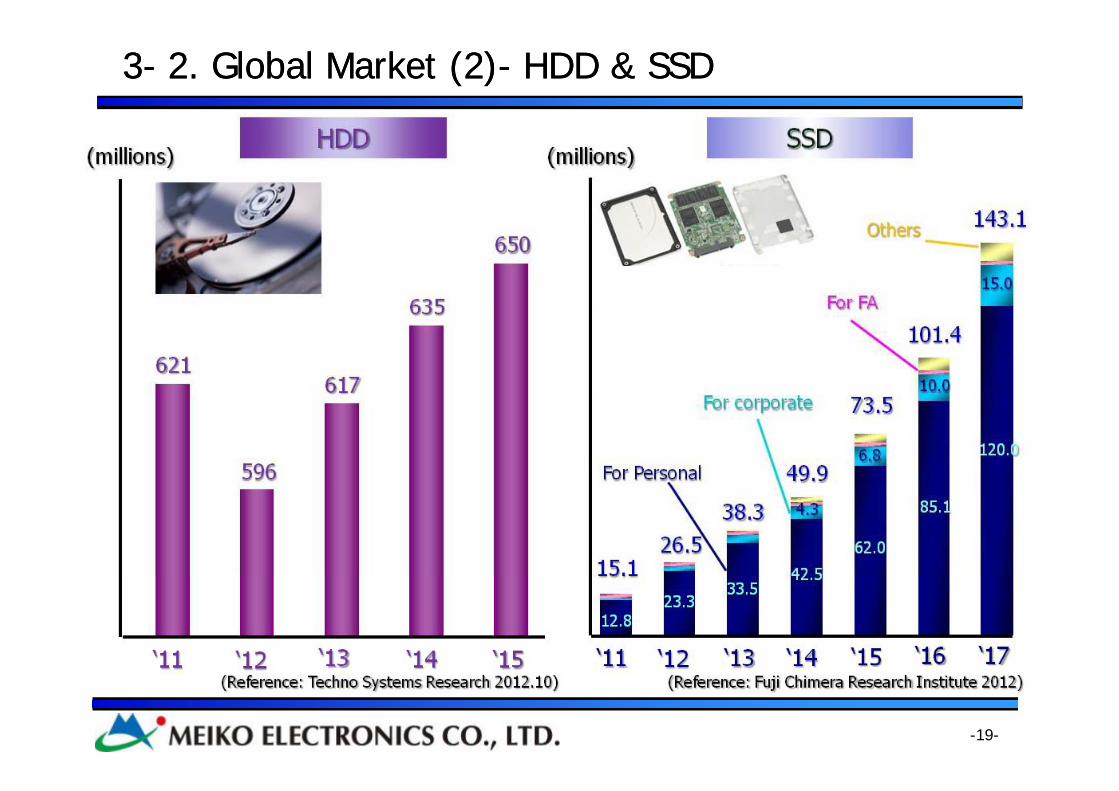
33-- 2. Global Market (2)2. Global Market (2)-- HDD & HDD & SSDSSD
-19-

33-- 3. Global Market (3)3. Global Market (3)-- Automobile & Automobile & HVHV
HV and others
110 000
(thousands) Automobile (thousands)
9,200
93,000
110,000
63,19571,528
75,35077,000 *The sum of Hybrid vehicles, Plug-in
hybrid vehicles, and Electric vehicles.
3,830
63,195
75 06089,170
100,800
759 9211,190
1,94062,43670,607
74,16075,060
‘09 ‘10 ‘11 ‘12 ‘15 ‘20
759 921
3,830 9,200
‘09 ‘10 ‘11 ‘12 ‘15 ‘20
-20-
09 10 11 12 15 2009 10 11 12 15 20(Reference: Daiwa Security Analyst Report 2012.5) (Reference: Daiwa Security Analyst Report 2012.5)
4. Business Strategy4. Business Strategy
44-- 1. Initiatives from the next fiscal year1. Initiatives from the next fiscal year 2222
PagePage
yy
44-- 2. Initiatives of overseas production bases2. Initiatives of overseas production bases 2323
44-- 3. Resumption plan of Miyagi Factory3. Resumption plan of Miyagi Factory
44-- 4. FY2013 prospects overview4. FY2013 prospects overview
2424
2525p pp p
44-- 5. 5. FY2013 FY2013 prospects (by market)prospects (by market) 2626
44-- 6. 6. FY2013 prospects (by FY2013 prospects (by production base)production base)
44-- 7.7. FY2013 prospects (FY2013 prospects (by products)by products)
2727
282844 7. 7. FY2013 prospects (FY2013 prospects (by products)by products)
44-- 8. 8. FY2013 prospects (by FY2013 prospects (by nationality)nationality)
2828
2929
-21-

44-- 1. Initiatives from the next fiscal 1. Initiatives from the next fiscal yearyear
-22-

44-- 2. Initiatives of overseas production 2. Initiatives of overseas production basesbases
Wuhan Plant• Expansion of PCBs for smartphones• Expansion of PCBs for automobiles• Launching of brand-new PCBs Guangzhou Plant
• Specialization in PCBs for automobiles• Securing the high qualitySecuring the high quality• Strengthening the profitability through optimization
Vietnam Plant• Expansion of PCBs for smartphones• Expansion of production line for automobiles
-23-

44-- 3. Resumption plan of Miyagi 3. Resumption plan of Miyagi FactoryFactory
Floor area : Using 25% of the total floor area(=4,000m2)
Investment : 1 billion yen
Products : Embedded devices PCBs, Module PCBs
Employees : 30 peopleEmployees : 30 people
Schedule : April 2013
-24-

44-- 4. FY2013 prospects 4. FY2013 prospects overviewoverview
-25-
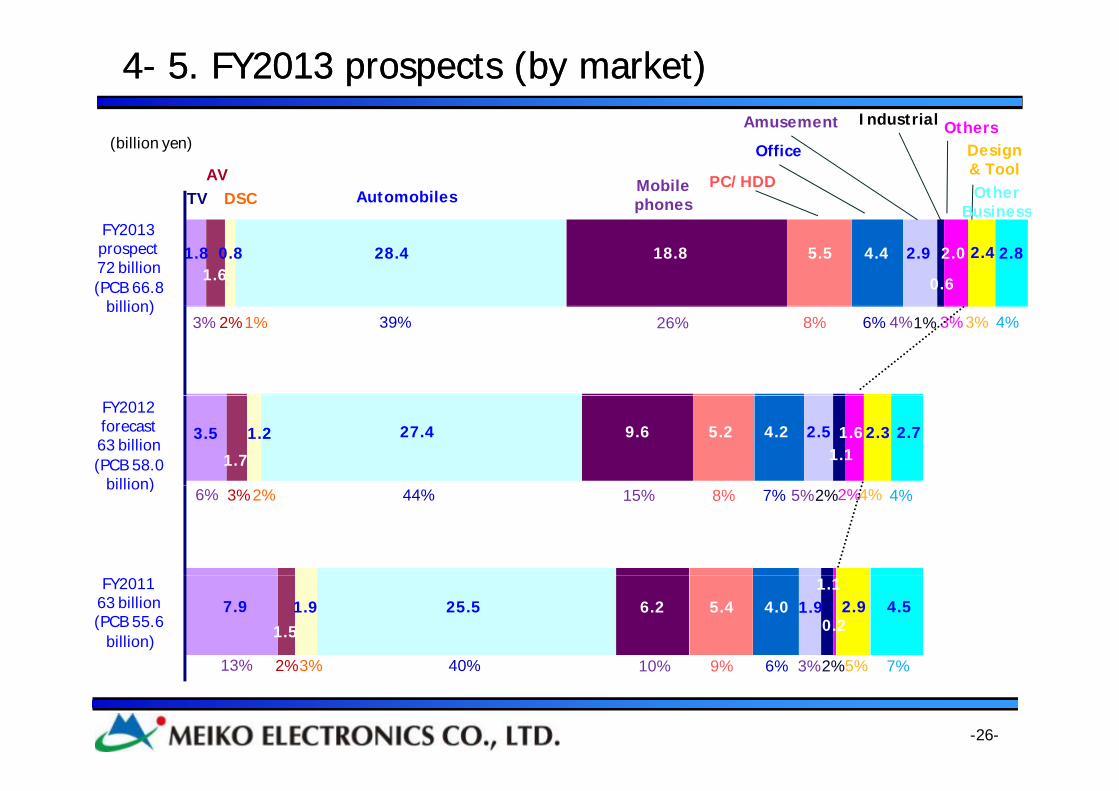
44-- 5. FY2013 prospects (by market5. FY2013 prospects (by market))Amusement OthersIndustrial
(billion yen)
TVAV
DSC AutomobilesMobile phones
PC/HDD
Office
Amusement OthersDesign & ToolOther
Business
1.81.6
0.8 28.4 18.8 5.5 4.4 2.9
0.6
2.0 2.4 2.8FY2013 prospect72 billion(PCB 66.8
billion)
Business
3%2%1% 39% 26% 8% 6%4%1% 3% 4%3%billion)
3.5
1.7
1.2 27.4 9.6 5.2 4.2 2.51.1
1.62.3 2.7
FY2012 forecast63 billion(PCB 58.0
billion)6% 3%2% 44% 15% 8% 7% 5%2% 4% 4%2%
billion)
FY201163 billion(PCB 55.6
billion) 1.51.9 25.5 6.2 5.4 4.0 1.9
1.17.9
0.22.9 4.5
13% 2%3% 40% 10% 9% 6% 3%2%5% 7%
-26-
13% 2%3% 40% 10% 9% 6% 3%2%5% 7%
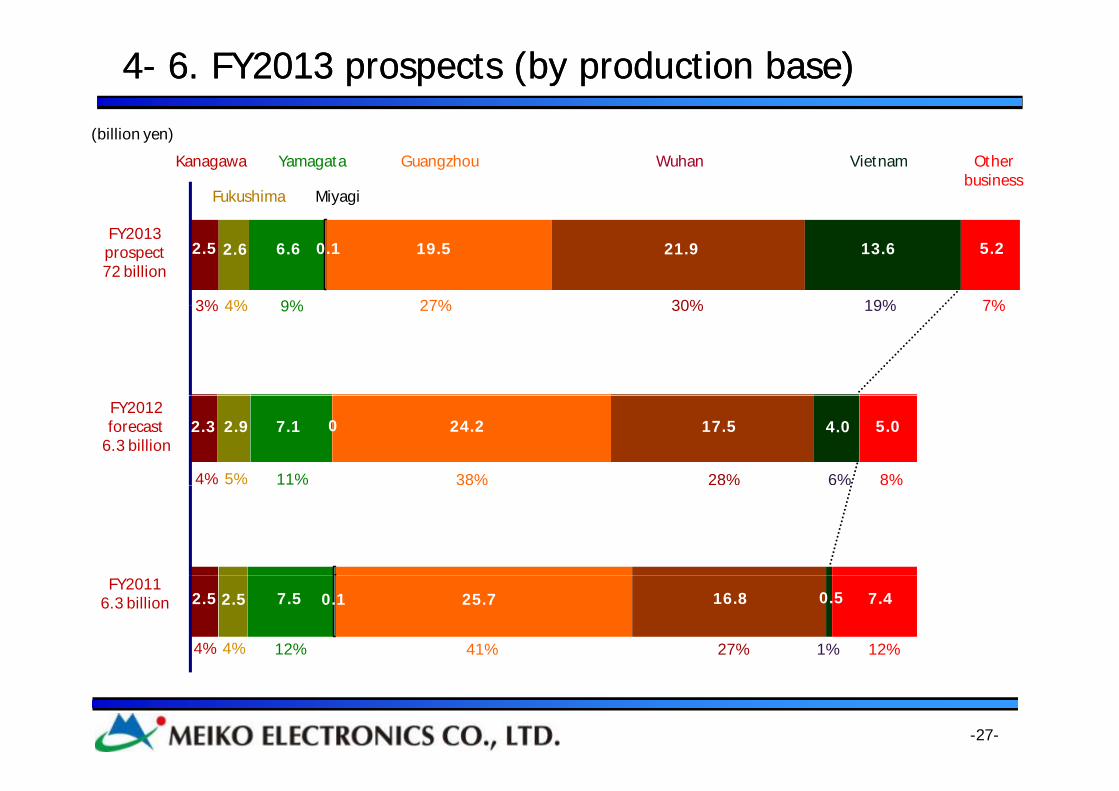
44-- 6. FY2013 prospects (by production base6. FY2013 prospects (by production base))
Kanagawa
Fukushima
Yamagata Guangzhou Wuhan Vietnam Other business
Miyagi
(billion yen)
FY2013 prospect72 billion
6.6 19.52.62.5 21.9 13.6 5.2
3% 4% 9% 27% 30% 19% 7%
0.1
3% 4% 9% 27% 30% 19% 7%
FY2012 forecast
6.3 billion5.04.017.524.27.12.92.3
4% 5% 11% 38% 28% 6% 8%
0
FY20116.3 billion 7.40.516.825.77.52.5 2.5 0.1
4% 4% 12% 41% 27% 1% 12%
-27-

44-- 7. FY2013 prospects (by products7. FY2013 prospects (by products))
H
(billion yen)
Double- 6 or more HDI
An
y Layer HD
Mo
du
FPC
/FH
eavy Co
pp
Heat D
issipatio
Desig
n &
To
Oth
e
5.2 19.4 12.2 20.2 4.50.9
1.31.7
1.42.82.4
FY2013 prospect72 billion
sided 4 layers layers HDI
DI
ule
FRp
er
on
oo
l
ers
8% 28% 18% 26% 6%1%2%
3%
2%3% 4%
72 billion
6.2 20.6 11.3 12.4 3.10.7
0.91.5
1.32.72.3
FY2012 forecast63 billion
1.1 1.1
10% 34% 18% 20% 5%
1%
1%
1%
2%4% 4%
7.7 23.5 9.6 9.0 1.61.1
0.8
1.21.1
4.52.9
12% 37% 15% 14% 3%1% 2%5% 7%
FY201163 billion
-28-
2% 2%

44-- 8. FY2013 prospects (by nationality8. FY2013 prospects (by nationality))
Ko
Japa
Ch
Euro
Am
e
Japanese 62% Non-Japanese 38%
(billion yen)
orean
anese
hinese
opean
North
erican
41 1 3 8 11 6 4 3 6 0
FY2013 prospect
72 0 billion
6%
41.1 3.8 11.6 4.3
62% 17% 6% 9%
6.072.0 billionPCB 66.8billion)
43.2 0.4 7.2 2.7 4.5
FY2012 forecast
63.0 billion(PCB 58.0
b ll )74% 12% 5% 8%1%
FY2011
billion)
47.0 2.02.0 4.6
85% 4% 4% 8%
FY201163 billion(PCB 55.6
billion)
-29-
http://www.meikohttp://www.meiko--elec.com/elec.com/
November 20 2012
-30-
November 20, 2012
Top Related