


Languages
Pages
Legal

Emission Reduction Offset
Transaction Costs
Summary Report for 2017
ERC Bank Stationary Source Offsets
ERC Trading
California Environmental Protection Agency
State of California
California Environmental Protection Agency
AIR RESOURCES BOARD
Emission Reduction Offset Transaction Costs Summary Report for 2017
December 2018
This report has been reviewed by the staff of the California Air Resources Board. Publication does not signify that the contents necessarily reflect the views and policies
of the Air Resources Board.
[This Page Intentionally Left Blank]
0
Table of Contents
Section Content Page Number
EXECUTIVE SUMMARY 1 A. Background 1 B. Summary of 2017 Data 1 C. Data Trends 1 I. INTRODUCTION 4 II. NEW SOURCE REVIEW & CALIFORNIA’S AIR QUALITY
MANAGEMENT PROGRAM 4
III. REQUIREMENTS TO REPORT COST OF OFFSETS 5 IV. DATA COLLECTION PROCESS 6 V. DESCRIPTION OF 2017 STATEWIDE DATA 7 VI. DESCRIPTION OF 2017 DATA BY DISTRICT 14
A. Bay Area 14 B. Imperial County 16 C. Placer 19 D. San Joaquin Valley 20 E. San Luis Obispo 23 F. Santa Barbara 23 G. South Coast 24 H. Ventura 27 I. Yolo Solano 28
APPENDIX A HEALTH & SAFETY CODE SECTIONS 40709 & 40709.5 AND GOVERNMENT CODE SECTION 6245.7
30
H≻ 40709 DISTRICT BANKING AND OFFSET SYSTEM 30 H≻ 40709.5 REVIEW OF EMISSION CREDIT SYSTEMS 31 GOVERNMENT CODE SECTION 6254.7 32
APPENDIX B REPORTING FORM AND INSTRUCTIONS 33 APPENDIX C GLOSSARY OF TERMS 37
[This Page Intentionally Left Blank]
1
EXECUTIVE SUMMARY
A. Background Since 1993, Health and Safety Code Sections 40709 and 40709.5 have required local air quality management and air pollution control districts (district) to collect information regarding the cost of offset transactions from stationary source owners who purchase offsets as required by New Source Review (NSR) programs. State law also requires districts to adopt emission reduction credit (ERC) banking programs. Districts are required to collect specific information about offset transactions, including the price paid in dollars per ton, the pollutant traded, the amount traded, and the year of the transaction. Districts are also required to annually publish this information without disclosing the identity of the parties involved with the transaction. Districts that are not required to submit a plan for attainment of State ambient air quality standards and those that also meet federal air quality standards are exempt from such requirements.
B. Summary of 2017 Data The California Air Resources Board (CARB) has compiled information regarding NSR offset transactions collected from all 35 districts and assembled it into this report. This report summarizes statewide emission reduction offset transactions in California for the year 2017. Districts that submit a plan for attainment of State ambient air quality standards and those that do not meet federal air quality standards are required to report their emission reduction offset transactions. A total of 219 transactions were reported to have taken place in California in 2017. This report does not include 23 hydrocarbon1 (HC) transactions occurred in South Coast where there were no monetary costs. Of the remaining 196 transactions, two were for carbon monoxide (CO), three for sulfur oxides (SOx), 63 were for particulate matter with aerodynamic diameter less than 10 microns (PM10), 51 were for hydrocarbons (HC), and 77 were for oxides of nitrogen (NOx). A specific breakdown of all transactions by district is presented in Table V-1 (beginning on page 8). Unless otherwise noted, these transactions represent trades of offsets that are valid for the lifetime of the permitted source. This is in contrast to other types of credits that are valid for much shorter time frames (e.g., Regional Clean Air Incentives Market (RECLAIM) trading credits that are valid for one year).
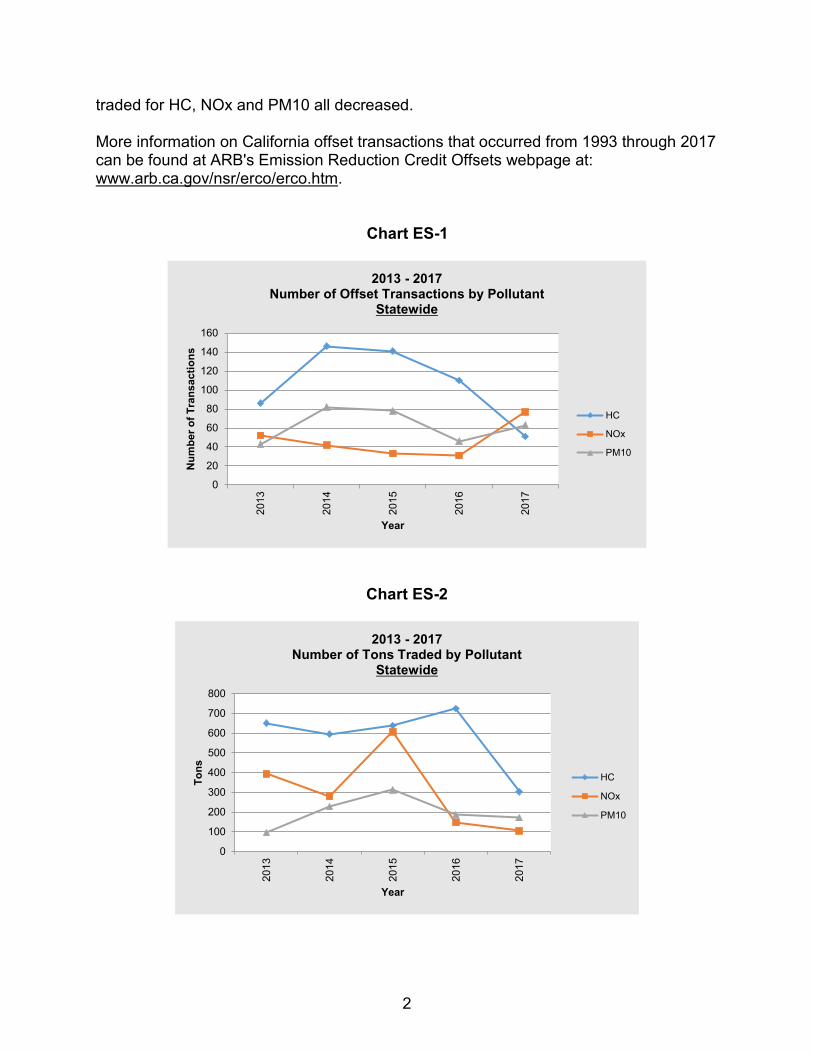
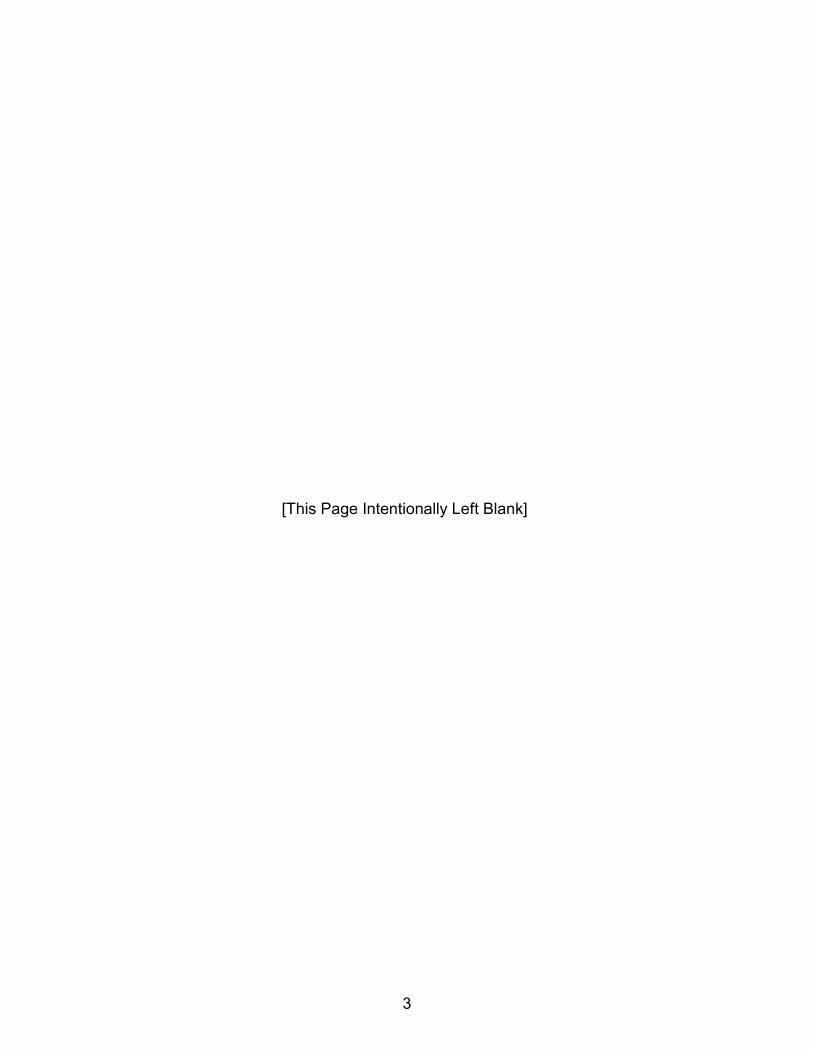
C. Data Trends Charts ES-1 and ES-2 illustrate the trends for the number of transactions and the number of tons traded during the past five years for the three most traded pollutants (HC, NOx, and PM10). Chart ES-1 shows that in 2017, the number of reported transactions decreased for HC, but increased for NOx and PM10. Chart ES-2 shows that in 2017, the number of tons 1 The term of hydrocarbon, as used in this report, includes volatile organic compounds and reactive organic compounds.
2
traded for HC, NOx and PM10 all decreased. More information on California offset transactions that occurred from 1993 through 2017 can be found at ARB's Emission Reduction Credit Offsets webpage at: www.arb.ca.gov/nsr/erco/erco.htm.
Chart ES-1
Chart ES-2
0
20
40
60
80
100
120
140
160
2013
2014
2015
2016
2017
Num
ber o
f Tra
nsac
tions
Year
2013 - 2017Number of Offset Transactions by Pollutant
Statewide
HC
NOx
PM10
0
100
200
300
400
500
600
700
800
2013
2014
2015
2016
2017
Tons
Year
2013 - 2017Number of Tons Traded by Pollutant
Statewide
HC
NOx
PM10
3
[This Page Intentionally Left Blank]
4
I. INTRODUCTION Section 40709.5(e) of the Health and Safety Code mandates that districts that are not exempt under Health and Safety Code Section 40709 collect information regarding the cost of offsets from stationary source owners who purchased offsets as required by district NSR programs. This report presents a compilation of the transactions in California from January 1 through December 31, 2017, as provided by the districts. California's NSR programs are designed to accommodate industrial growth while protecting public health and the environment. The use of ERCs that are purchased on the open market to offset emissions from new or modified sources provides industry the flexibility to mitigate emissions in the most cost-effective manner, while ensuring that net emissions do not increase. This report summarizes the prices paid for offsets, and the number and type of transactions taking place in California's emission credit market. This report does not attempt to analyze the cost data collected or attempt to predict future prices or ERC availability. As required by Health and Safety Code Section 40709.5(e), this report does not contain information that identifies the parties involved in the transactions. Trading credits from the South Coast Air Quality Management District’s Regional Clean Air Incentives Market (RECLAIM) program are not included because they are not directly comparable to ERCs used to satisfy NSR requirements. Also, tables and calculations do not include data on the cost of leasing credits from the Solutions for the Environment and Economic Development (SEED) program of the Sacramento Metropolitan Air Quality Management District. II. NEW SOURCE REVIEW AND CALIFORNIA'S AIR QUALITY MANAGEMENT PROGRAM The responsibility for controlling emissions from stationary sources of air pollution rests with California's local districts. The California Clean Air Act requires districts to adopt a NSR program that results in no net increase in emissions from new and modified stationary sources that have the potential to emit over a specified amount of nonattainment pollutants or their precursors. As part of NSR, stationary sources are required to apply the Best Available Control Technology (BACT) to reduce emissions. In some cases, stationary sources must also provide emission reduction credits (ERCs) to offset or mitigate the impact of emissions that remain from the source after the application of BACT. In order to qualify as mitigation, offsets must meet certain criteria: the emission reductions must be surplus to any federal, State or local laws or regulations and must be real, enforceable, quantifiable and permanent. California’s offset requirements, reflected in district rules, are more stringent than federal offset requirements because they apply at lower emissions thresholds.
5
A. Emission Reduction Credit Banking and Trading Emission reduction credit banking is defined as "a system by which reductions in emissions may be banked or otherwise credited to offset future increases... or a calculation method which enables internal emission reductions to be credited against increases” (Health and Safety Code Section 40709.5). Once created, ERCs may be banked with the district for future use by the source that generated them, used concurrently to offset new projects, or sold to other sources for use as mitigation. The most common method of creating ERCs is to voluntarily control or curtail the emissions from an existing stationary source beyond that which is required by any regulation or rule. Curtailment could be from a change in operating hours of a source, the voluntary installation of additional pollution controls or through the shutdown of a source. Other less common methods of generating ERCs may include curtailing field burning of agricultural wastes. Credits must be generated pursuant to district rules and regulations, and must be reviewed and certified by the district. The legal requirements of credit generating programs are specified in the Health and Safety Code and further defined by rules in place in each district. III. REQUIREMENTS TO REPORT COST OF OFFSETS Sections 40709 and 40709.5 of the Health and Safety Code require districts that are not exempt to establish banking programs for ERCs and establish a mechanism to collect data regarding the price paid for offsets. The text of Health and Safety Code Sections 40709 and 40709.5 and Government Code Section 6254.7 can be found in Appendix A. The following is a summary of the requirements of those sections of the Government Code and the Health and Safety Code: • Section 6254.7(f) of the Government Code authorizes districts to obtain information
on the cost of offsets from applicants. • Section 40709 of the Health and Safety Code makes an emission reduction
banking system mandatory in every district except any district that is not required to submit a plan for attainment of State ambient air quality standards and if
o The district is not in a federal nonattainment area for any national ambient air quality standard unless the sole reason for nonattainment is air pollutant transport and
o A source has not petitioned the district to establish a banking system. • Section 40709(c) of the Health and Safety Code specifies that emission reductions
proposed to offset simultaneous emissions increases within the same stationary source need not be banked prior to use as offsets.
• Section 40709.5(e) requires that any district that has established a banking system is required to develop a program that provides the following information as public record:
o Annual publication of the costs in dollars per ton, of emission offsets purchased for new and modified emission sources, excluding the identity of the parties involved.
6
o The annual publication shall specify for each offset purchase transaction: The date of the offset transaction (year only) The amount of offset purchased by pollutant The total cost, by pollutant of the offsets purchased
o Each application for use of emission reductions banked shall provide sufficient information, as determined by the district, to perform the cost analysis.
IV. DATA COLLECTION PROCESS In 1994, a subcommittee of the California Air Pollution Control Officers Association Engineering Managers worked with CARB to develop a uniform reporting form for collecting data from the districts for this report. The reporting form was designed to transmit information to CARB without disclosing the names of the transaction parties. The form distinguishes between ERC categories: stationary, mobile, and agricultural offsets. The prices paid for credits may be affected by the type of source from which reductions are obtained. This is particularly true with mobile and agricultural sources that may have a finite lifespan. The lifespan of the credit may significantly affect their price. For transactions involving credits with limited lifespans, the reporting form allows the districts to report the remaining useful life of those credits. Mobile source credits and lease agreement transactions for agricultural operations can also be distinguished using this section of the form. The reporting form records the type of payment agreement, such as a direct sale of the credit, a barter for services or equipment, a transaction between subsidiary parties, or an assets transfer within a company. In each case, the type of transaction agreement may affect the price of the transaction. Knowing these facts about each transaction will aid interested parties wishing to analyze credit market values. A copy of the reporting form and instructions is in Appendix B. A glossary of terms is located in Appendix C.
7
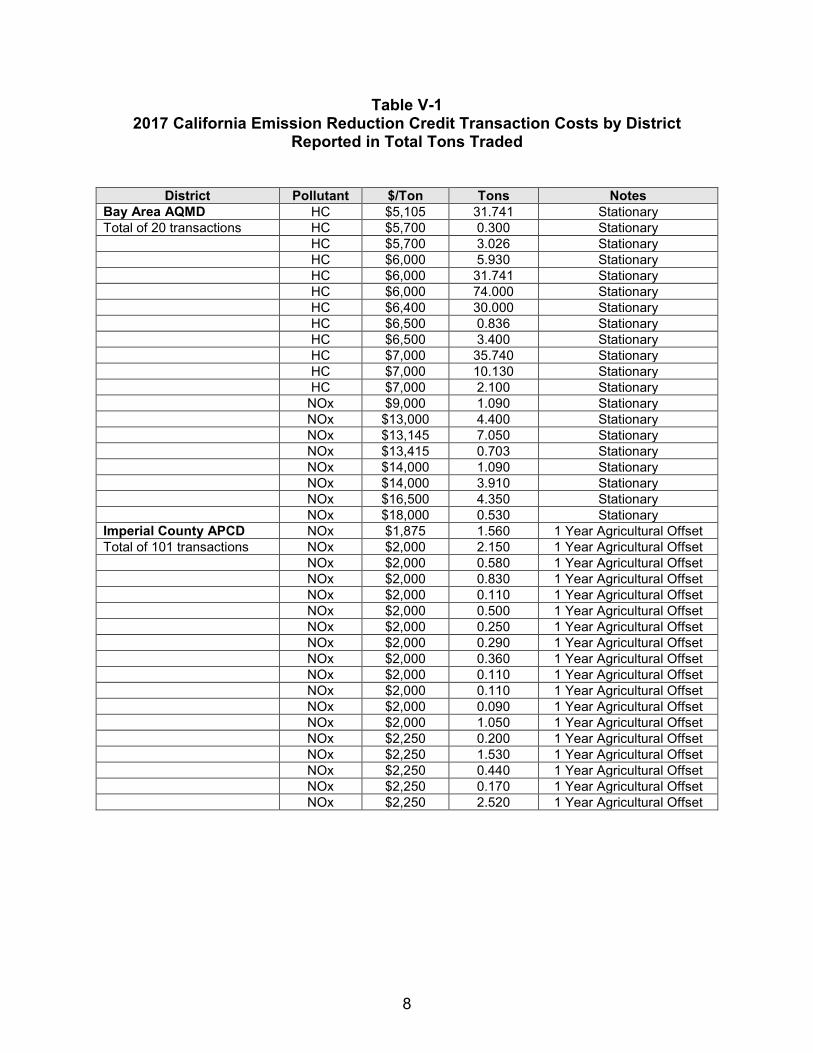
V. DESCRIPTION OF 2017 STATEWIDE DATA Table V-1 presents 196 transactions required to be reported that took place in California in 2017 listed alphabetically by individual district. Leased and quarterly transaction costs are annualized for inclusion in the average cost figures presented throughout the report. The methodology used to annualize transactions can be found starting on page 33. Per Health and Safety Code, affected districts must report to ARB regardless of whether any offset transactions occurred. Table V-2 lists the districts that reported no transactions in 2017. In 2017, nine districts reported transactions. Tables A-1, B-1, C-1, D-1, E-1, F-1, G-1, H-1 and I-1 present information, by district, for CO, HC, NOx, PM10 and SOx reported by each district. Each table lists the pollutant, cost per ton of pollutant, and the total tons of pollutant traded. The price paid per ton was calculated by dividing the cost of the transaction by the number of tons traded in that transaction. The information is presented individually for each district since offset markets and costs per ton vary between districts and between transactions within the same district. Tables A-2, B-2, C-2, D-2, E-2, F-2, G-2, H-2 and I-2 provide the total tons traded and the average, median, high and low prices paid per transaction per ton of pollutant. These tables exclude asset transfer, subsidiary, barter, and other non-monetary transactions. For each district that reported monetary transactions for the three most actively traded criteria pollutants (HC, NOx, and PM10), Charts 1 - 11 illustrate the average cost of offsets per transaction for the past five years.
8
Table V-1 2017 California Emission Reduction Credit Transaction Costs by District
Reported in Total Tons Traded
District Pollutant $/Ton Tons Notes
Bay Area AQMD HC $5,105 31.741 Stationary Total of 20 transactions HC $5,700 0.300 Stationary HC $5,700 3.026 Stationary HC $6,000 5.930 Stationary HC $6,000 31.741 Stationary HC $6,000 74.000 Stationary HC $6,400 30.000 Stationary HC $6,500 0.836 Stationary HC $6,500 3.400 Stationary HC $7,000 35.740 Stationary HC $7,000 10.130 Stationary HC $7,000 2.100 Stationary NOx $9,000 1.090 Stationary NOx $13,000 4.400 Stationary NOx $13,145 7.050 Stationary NOx $13,415 0.703 Stationary NOx $14,000 1.090 Stationary NOx $14,000 3.910 Stationary NOx $16,500 4.350 Stationary NOx $18,000 0.530 Stationary Imperial County APCD NOx $1,875 1.560 1 Year Agricultural Offset Total of 101 transactions NOx $2,000 2.150 1 Year Agricultural Offset NOx $2,000 0.580 1 Year Agricultural Offset NOx $2,000 0.830 1 Year Agricultural Offset NOx $2,000 0.110 1 Year Agricultural Offset NOx $2,000 0.500 1 Year Agricultural Offset NOx $2,000 0.250 1 Year Agricultural Offset NOx $2,000 0.290 1 Year Agricultural Offset NOx $2,000 0.360 1 Year Agricultural Offset NOx $2,000 0.110 1 Year Agricultural Offset NOx $2,000 0.110 1 Year Agricultural Offset NOx $2,000 0.090 1 Year Agricultural Offset NOx $2,000 1.050 1 Year Agricultural Offset NOx $2,250 0.200 1 Year Agricultural Offset NOx $2,250 1.530 1 Year Agricultural Offset NOx $2,250 0.440 1 Year Agricultural Offset NOx $2,250 0.170 1 Year Agricultural Offset NOx $2,250 2.520 1 Year Agricultural Offset
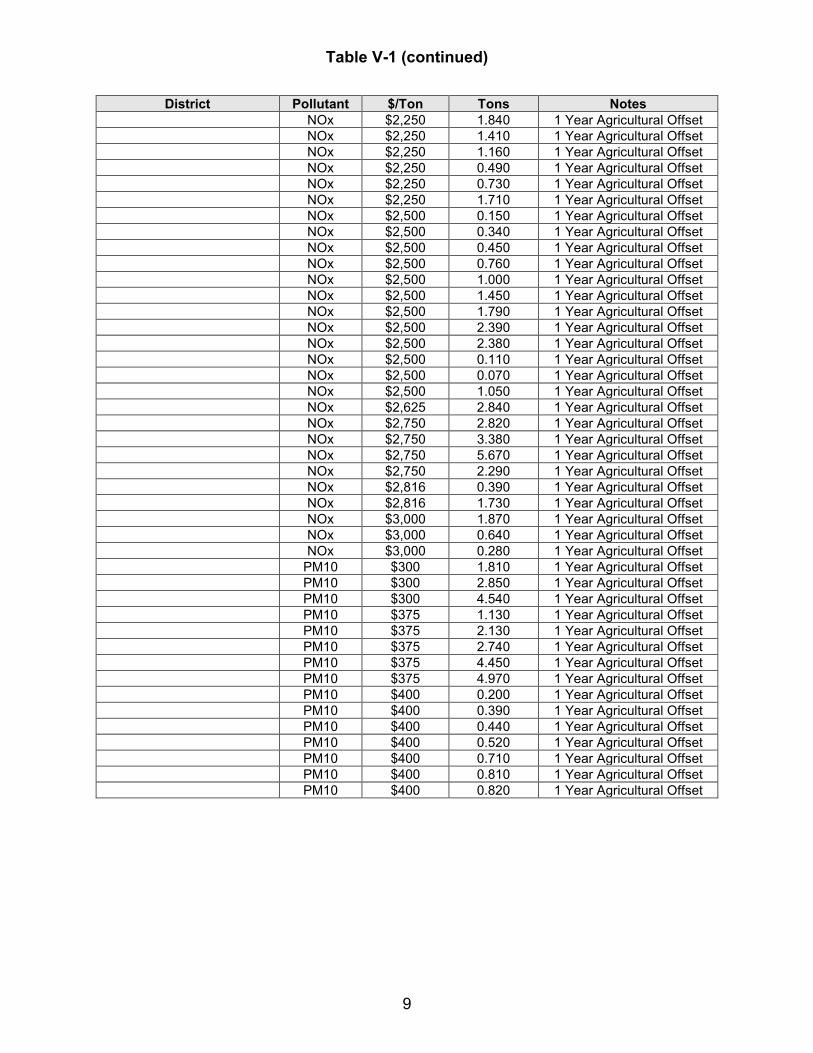
Table V-1 (continued)
9
District Pollutant $/Ton Tons Notes NOx $2,250 1.840 1 Year Agricultural Offset NOx $2,250 1.410 1 Year Agricultural Offset NOx $2,250 1.160 1 Year Agricultural Offset NOx $2,250 0.490 1 Year Agricultural Offset NOx $2,250 0.730 1 Year Agricultural Offset NOx $2,250 1.710 1 Year Agricultural Offset NOx $2,500 0.150 1 Year Agricultural Offset NOx $2,500 0.340 1 Year Agricultural Offset NOx $2,500 0.450 1 Year Agricultural Offset NOx $2,500 0.760 1 Year Agricultural Offset NOx $2,500 1.000 1 Year Agricultural Offset NOx $2,500 1.450 1 Year Agricultural Offset NOx $2,500 1.790 1 Year Agricultural Offset NOx $2,500 2.390 1 Year Agricultural Offset NOx $2,500 2.380 1 Year Agricultural Offset NOx $2,500 0.110 1 Year Agricultural Offset NOx $2,500 0.070 1 Year Agricultural Offset NOx $2,500 1.050 1 Year Agricultural Offset NOx $2,625 2.840 1 Year Agricultural Offset NOx $2,750 2.820 1 Year Agricultural Offset NOx $2,750 3.380 1 Year Agricultural Offset NOx $2,750 5.670 1 Year Agricultural Offset NOx $2,750 2.290 1 Year Agricultural Offset NOx $2,816 0.390 1 Year Agricultural Offset NOx $2,816 1.730 1 Year Agricultural Offset NOx $3,000 1.870 1 Year Agricultural Offset NOx $3,000 0.640 1 Year Agricultural Offset NOx $3,000 0.280 1 Year Agricultural Offset PM10 $300 1.810 1 Year Agricultural Offset PM10 $300 2.850 1 Year Agricultural Offset PM10 $300 4.540 1 Year Agricultural Offset PM10 $375 1.130 1 Year Agricultural Offset PM10 $375 2.130 1 Year Agricultural Offset PM10 $375 2.740 1 Year Agricultural Offset PM10 $375 4.450 1 Year Agricultural Offset PM10 $375 4.970 1 Year Agricultural Offset PM10 $400 0.200 1 Year Agricultural Offset PM10 $400 0.390 1 Year Agricultural Offset PM10 $400 0.440 1 Year Agricultural Offset PM10 $400 0.520 1 Year Agricultural Offset PM10 $400 0.710 1 Year Agricultural Offset PM10 $400 0.810 1 Year Agricultural Offset PM10 $400 0.820 1 Year Agricultural Offset
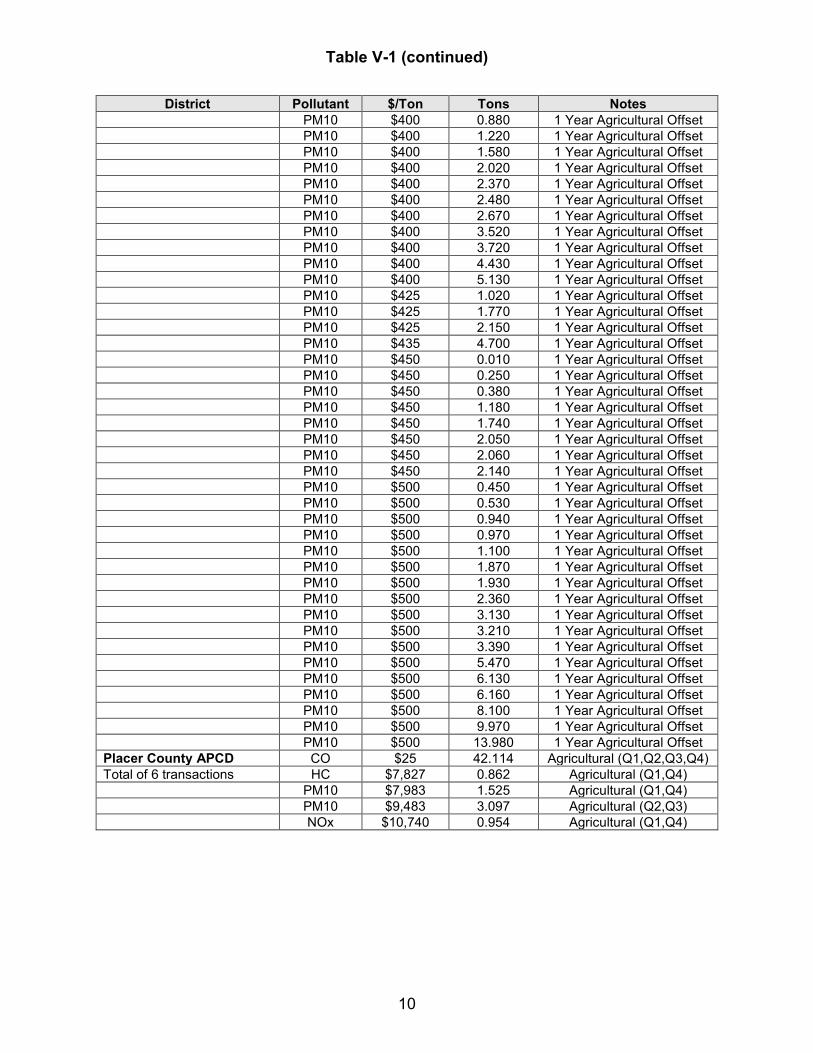
Table V-1 (continued)
10
District Pollutant $/Ton Tons Notes PM10 $400 0.880 1 Year Agricultural Offset PM10 $400 1.220 1 Year Agricultural Offset PM10 $400 1.580 1 Year Agricultural Offset PM10 $400 2.020 1 Year Agricultural Offset PM10 $400 2.370 1 Year Agricultural Offset PM10 $400 2.480 1 Year Agricultural Offset PM10 $400 2.670 1 Year Agricultural Offset PM10 $400 3.520 1 Year Agricultural Offset PM10 $400 3.720 1 Year Agricultural Offset PM10 $400 4.430 1 Year Agricultural Offset PM10 $400 5.130 1 Year Agricultural Offset PM10 $425 1.020 1 Year Agricultural Offset PM10 $425 1.770 1 Year Agricultural Offset PM10 $425 2.150 1 Year Agricultural Offset PM10 $435 4.700 1 Year Agricultural Offset PM10 $450 0.010 1 Year Agricultural Offset PM10 $450 0.250 1 Year Agricultural Offset PM10 $450 0.380 1 Year Agricultural Offset PM10 $450 1.180 1 Year Agricultural Offset PM10 $450 1.740 1 Year Agricultural Offset PM10 $450 2.050 1 Year Agricultural Offset PM10 $450 2.060 1 Year Agricultural Offset PM10 $450 2.140 1 Year Agricultural Offset PM10 $500 0.450 1 Year Agricultural Offset PM10 $500 0.530 1 Year Agricultural Offset PM10 $500 0.940 1 Year Agricultural Offset PM10 $500 0.970 1 Year Agricultural Offset PM10 $500 1.100 1 Year Agricultural Offset PM10 $500 1.870 1 Year Agricultural Offset PM10 $500 1.930 1 Year Agricultural Offset PM10 $500 2.360 1 Year Agricultural Offset PM10 $500 3.130 1 Year Agricultural Offset PM10 $500 3.210 1 Year Agricultural Offset PM10 $500 3.390 1 Year Agricultural Offset PM10 $500 5.470 1 Year Agricultural Offset PM10 $500 6.130 1 Year Agricultural Offset PM10 $500 6.160 1 Year Agricultural Offset PM10 $500 8.100 1 Year Agricultural Offset PM10 $500 9.970 1 Year Agricultural Offset PM10 $500 13.980 1 Year Agricultural Offset Placer County APCD CO $25 42.114 Agricultural (Q1,Q2,Q3,Q4) Total of 6 transactions HC $7,827 0.862 Agricultural (Q1,Q4) PM10 $7,983 1.525 Agricultural (Q1,Q4) PM10 $9,483 3.097 Agricultural (Q2,Q3) NOx $10,740 0.954 Agricultural (Q1,Q4)
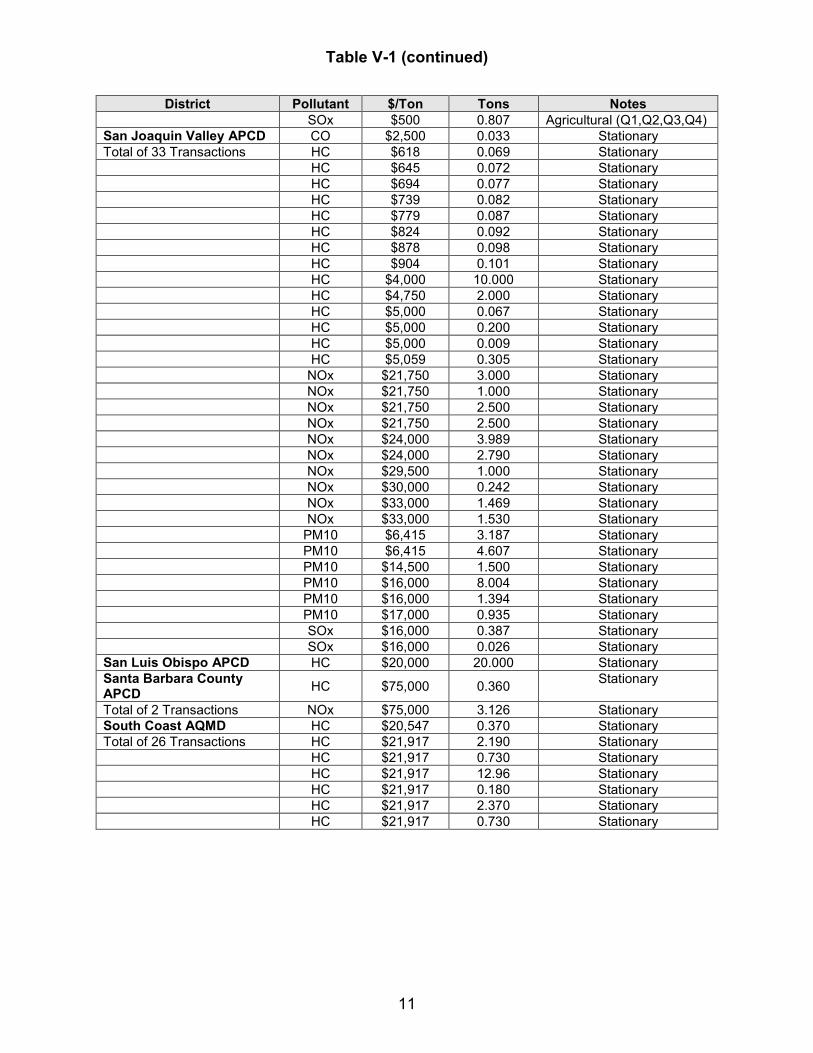
Table V-1 (continued)
11
District Pollutant $/Ton Tons Notes SOx $500 0.807 Agricultural (Q1,Q2,Q3,Q4) San Joaquin Valley APCD CO $2,500 0.033 Stationary Total of 33 Transactions HC $618 0.069 Stationary HC $645 0.072 Stationary HC $694 0.077 Stationary HC $739 0.082 Stationary HC $779 0.087 Stationary HC $824 0.092 Stationary HC $878 0.098 Stationary HC $904 0.101 Stationary HC $4,000 10.000 Stationary HC $4,750 2.000 Stationary HC $5,000 0.067 Stationary HC $5,000 0.200 Stationary HC $5,000 0.009 Stationary HC $5,059 0.305 Stationary NOx $21,750 3.000 Stationary NOx $21,750 1.000 Stationary NOx $21,750 2.500 Stationary NOx $21,750 2.500 Stationary NOx $24,000 3.989 Stationary NOx $24,000 2.790 Stationary NOx $29,500 1.000 Stationary NOx $30,000 0.242 Stationary NOx $33,000 1.469 Stationary NOx $33,000 1.530 Stationary PM10 $6,415 3.187 Stationary PM10 $6,415 4.607 Stationary PM10 $14,500 1.500 Stationary PM10 $16,000 8.004 Stationary PM10 $16,000 1.394 Stationary PM10 $17,000 0.935 Stationary SOx $16,000 0.387 Stationary SOx $16,000 0.026 Stationary San Luis Obispo APCD HC $20,000 20.000 Stationary Santa Barbara County APCD HC $75,000 0.360 Stationary
Total of 2 Transactions NOx $75,000 3.126 Stationary South Coast AQMD HC $20,547 0.370 Stationary Total of 26 Transactions HC $21,917 2.190 Stationary HC $21,917 0.730 Stationary HC $21,917 12.96 Stationary HC $21,917 0.180 Stationary HC $21,917 2.370 Stationary HC $21,917 0.730 Stationary
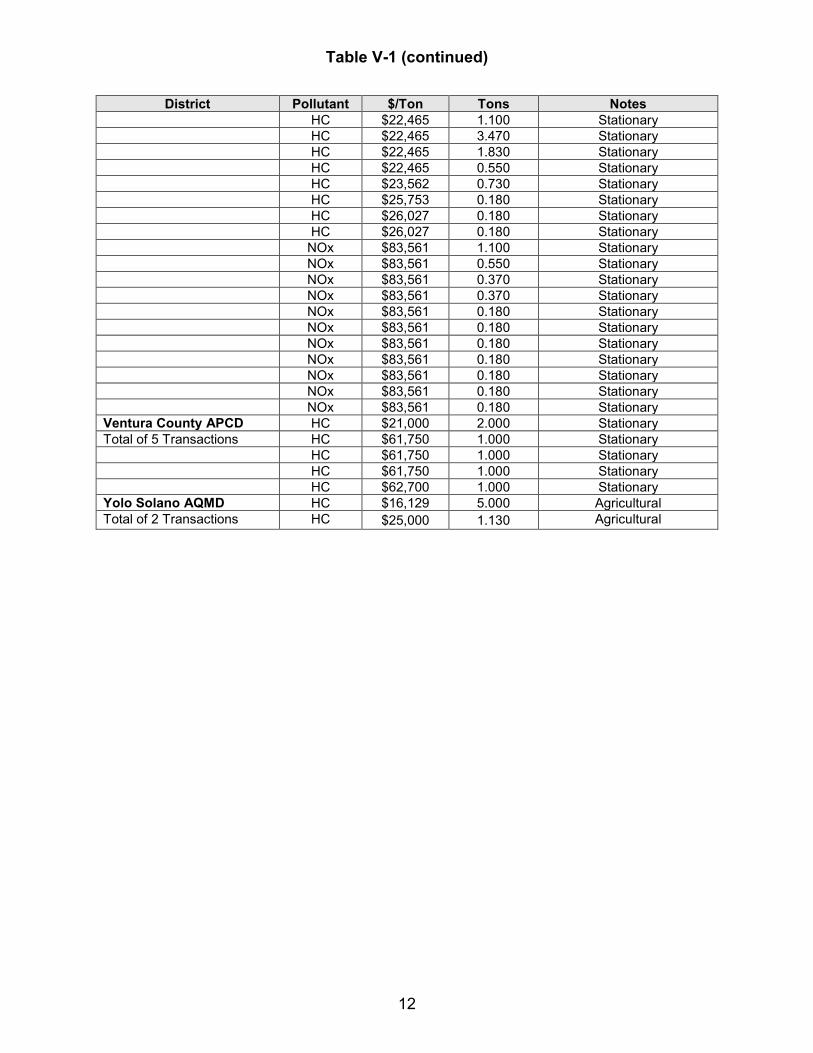
Table V-1 (continued)
12
District Pollutant $/Ton Tons Notes HC $22,465 1.100 Stationary HC $22,465 3.470 Stationary HC $22,465 1.830 Stationary HC $22,465 0.550 Stationary HC $23,562 0.730 Stationary HC $25,753 0.180 Stationary HC $26,027 0.180 Stationary HC $26,027 0.180 Stationary NOx $83,561 1.100 Stationary NOx $83,561 0.550 Stationary NOx $83,561 0.370 Stationary NOx $83,561 0.370 Stationary NOx $83,561 0.180 Stationary NOx $83,561 0.180 Stationary NOx $83,561 0.180 Stationary NOx $83,561 0.180 Stationary NOx $83,561 0.180 Stationary NOx $83,561 0.180 Stationary NOx $83,561 0.180 Stationary Ventura County APCD HC $21,000 2.000 Stationary Total of 5 Transactions HC $61,750 1.000 Stationary HC $61,750 1.000 Stationary HC $61,750 1.000 Stationary HC $62,700 1.000 Stationary Yolo Solano AQMD HC $16,129 5.000 Agricultural Total of 2 Transactions HC $25,000 1.130 Agricultural
13
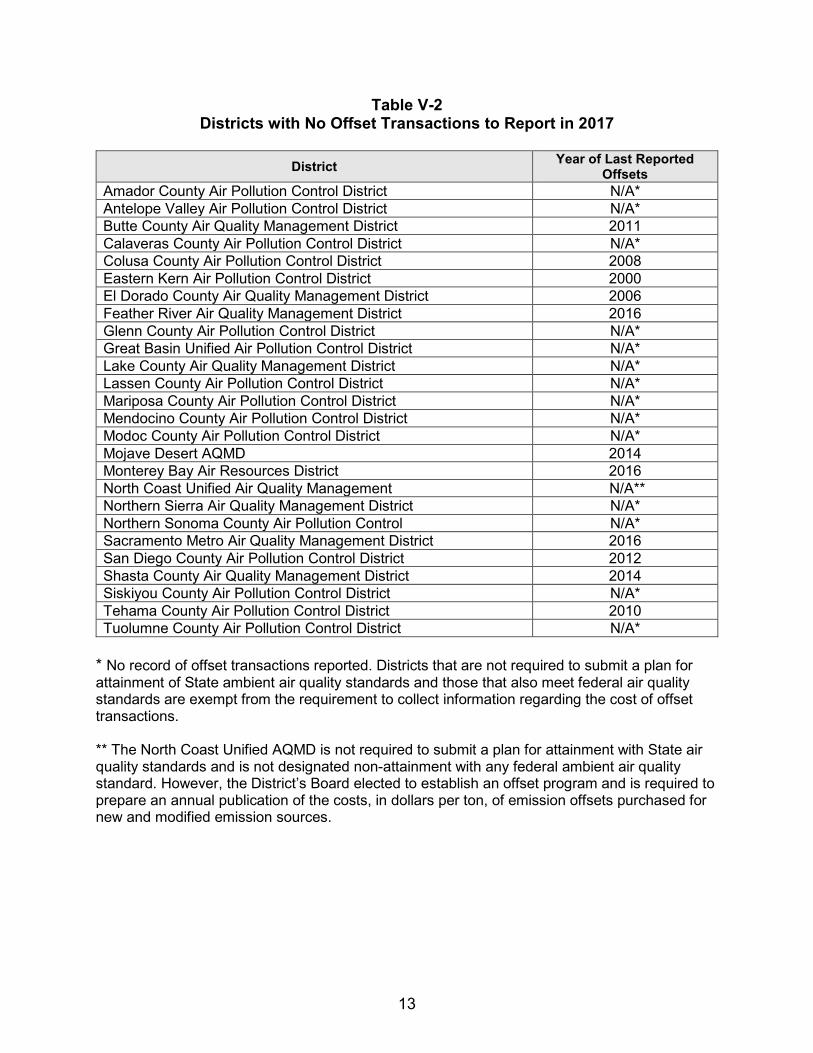
Table V-2 Districts with No Offset Transactions to Report in 2017
District Year of Last Reported
Offsets Amador County Air Pollution Control District N/A* Antelope Valley Air Pollution Control District N/A* Butte County Air Quality Management District 2011 Calaveras County Air Pollution Control District N/A* Colusa County Air Pollution Control District 2008 Eastern Kern Air Pollution Control District 2000 El Dorado County Air Quality Management District 2006 Feather River Air Quality Management District 2016 Glenn County Air Pollution Control District N/A* Great Basin Unified Air Pollution Control District N/A* Lake County Air Quality Management District N/A* Lassen County Air Pollution Control District N/A* Mariposa County Air Pollution Control District N/A* Mendocino County Air Pollution Control District N/A* Modoc County Air Pollution Control District N/A* Mojave Desert AQMD 2014 Monterey Bay Air Resources District 2016 North Coast Unified Air Quality Management N/A** Northern Sierra Air Quality Management District N/A* Northern Sonoma County Air Pollution Control N/A* Sacramento Metro Air Quality Management District 2016 San Diego County Air Pollution Control District 2012 Shasta County Air Quality Management District 2014 Siskiyou County Air Pollution Control District N/A* Tehama County Air Pollution Control District 2010 Tuolumne County Air Pollution Control District N/A*
* No record of offset transactions reported. Districts that are not required to submit a plan for attainment of State ambient air quality standards and those that also meet federal air quality standards are exempt from the requirement to collect information regarding the cost of offset transactions. ** The North Coast Unified AQMD is not required to submit a plan for attainment with State air quality standards and is not designated non-attainment with any federal ambient air quality standard. However, the District’s Board elected to establish an offset program and is required to prepare an annual publication of the costs, in dollars per ton, of emission offsets purchased for new and modified emission sources.
14
VI. DESCRIPTION OF 2017 DATA BY DISTRICT
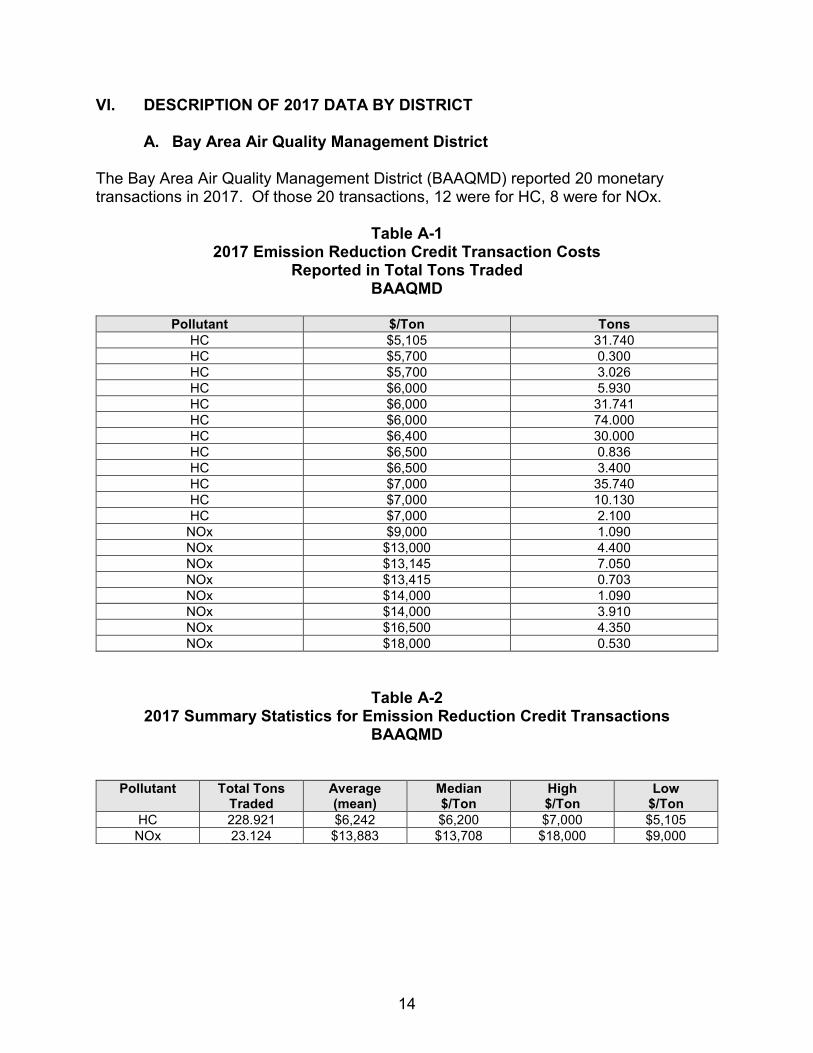
A. Bay Area Air Quality Management District The Bay Area Air Quality Management District (BAAQMD) reported 20 monetary transactions in 2017. Of those 20 transactions, 12 were for HC, 8 were for NOx.
Table A-1 2017 Emission Reduction Credit Transaction Costs
Reported in Total Tons Traded BAAQMD
Pollutant $/Ton Tons
HC $5,105 31.740 HC $5,700 0.300 HC $5,700 3.026 HC $6,000 5.930 HC $6,000 31.741 HC $6,000 74.000 HC $6,400 30.000 HC $6,500 0.836 HC $6,500 3.400 HC $7,000 35.740 HC $7,000 10.130 HC $7,000 2.100
NOx $9,000 1.090 NOx $13,000 4.400 NOx $13,145 7.050 NOx $13,415 0.703 NOx $14,000 1.090 NOx $14,000 3.910 NOx $16,500 4.350 NOx $18,000 0.530
Table A-2 2017 Summary Statistics for Emission Reduction Credit Transactions
BAAQMD
Pollutant Total Tons Traded
Average (mean)
Median $/Ton
High $/Ton
Low $/Ton
HC 228.921 $6,242 $6,200 $7,000 $5,105 NOx 23.124 $13,883 $13,708 $18,000 $9,000
15
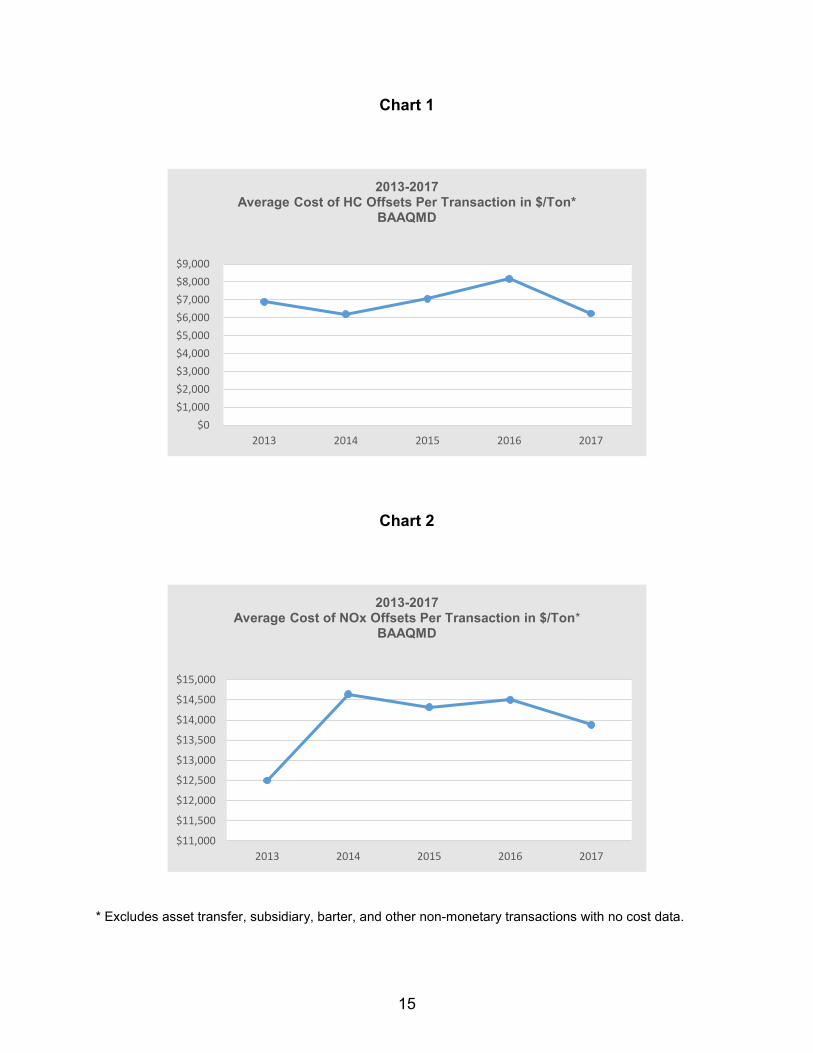
Chart 1
Chart 2
* Excludes asset transfer, subsidiary, barter, and other non-monetary transactions with no cost data.
$0$1,000$2,000$3,000$4,000$5,000$6,000$7,000$8,000$9,000
2013 2014 2015 2016 2017
2013-2017Average Cost of HC Offsets Per Transaction in $/Ton*
BAAQMD
$11,000
$11,500
$12,000
$12,500
$13,000
$13,500
$14,000
$14,500
$15,000
2013 2014 2015 2016 2017
2013-2017Average Cost of NOx Offsets Per Transaction in $/Ton*
BAAQMD
16
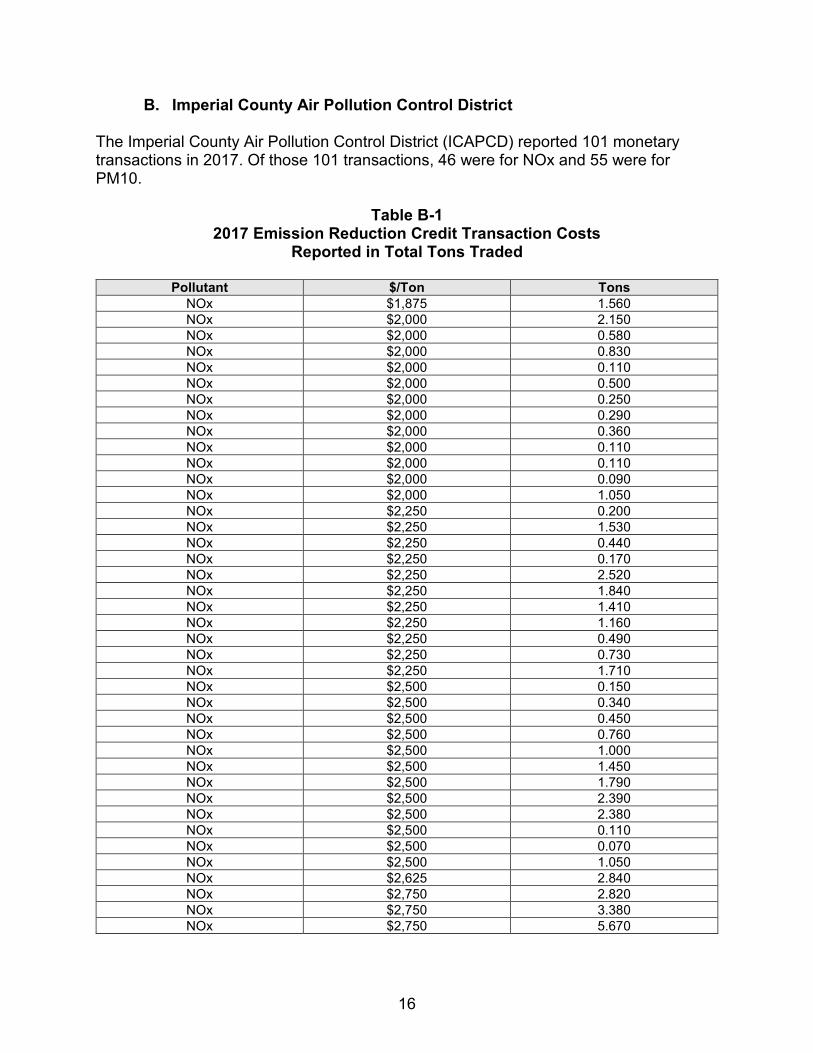
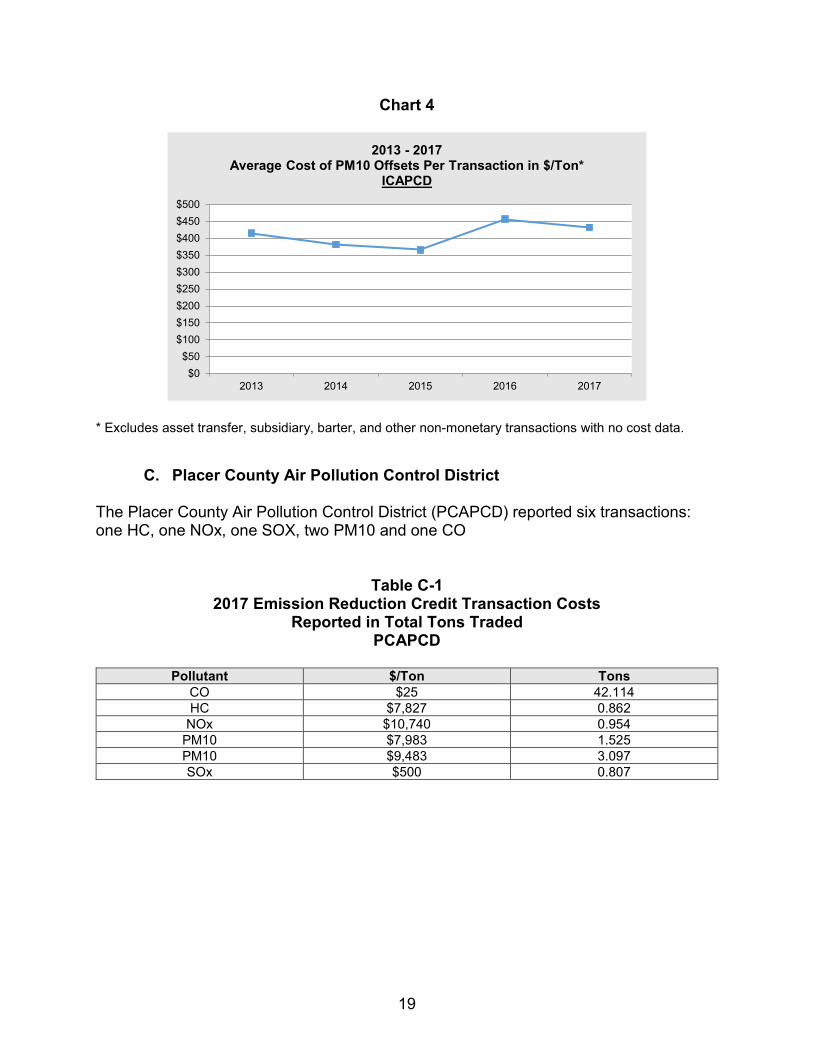
B. Imperial County Air Pollution Control District The Imperial County Air Pollution Control District (ICAPCD) reported 101 monetary transactions in 2017. Of those 101 transactions, 46 were for NOx and 55 were for PM10.
Table B-1 2017 Emission Reduction Credit Transaction Costs
Reported in Total Tons Traded
Pollutant $/Ton Tons NOx $1,875 1.560 NOx $2,000 2.150 NOx $2,000 0.580 NOx $2,000 0.830 NOx $2,000 0.110 NOx $2,000 0.500 NOx $2,000 0.250 NOx $2,000 0.290 NOx $2,000 0.360 NOx $2,000 0.110 NOx $2,000 0.110 NOx $2,000 0.090 NOx $2,000 1.050 NOx $2,250 0.200 NOx $2,250 1.530 NOx $2,250 0.440 NOx $2,250 0.170 NOx $2,250 2.520 NOx $2,250 1.840 NOx $2,250 1.410 NOx $2,250 1.160 NOx $2,250 0.490 NOx $2,250 0.730 NOx $2,250 1.710 NOx $2,500 0.150 NOx $2,500 0.340 NOx $2,500 0.450 NOx $2,500 0.760 NOx $2,500 1.000 NOx $2,500 1.450 NOx $2,500 1.790 NOx $2,500 2.390 NOx $2,500 2.380 NOx $2,500 0.110 NOx $2,500 0.070 NOx $2,500 1.050 NOx $2,625 2.840 NOx $2,750 2.820 NOx $2,750 3.380 NOx $2,750 5.670
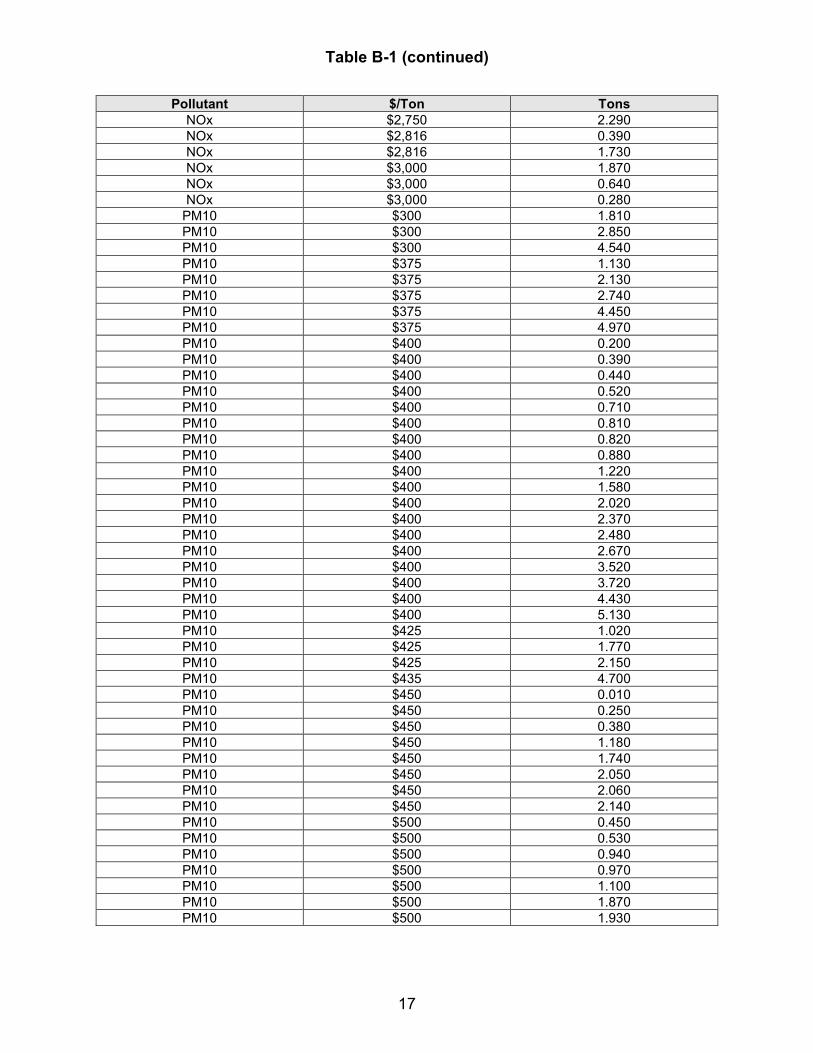
Table B-1 (continued)
17
Pollutant $/Ton Tons NOx $2,750 2.290 NOx $2,816 0.390 NOx $2,816 1.730 NOx $3,000 1.870 NOx $3,000 0.640 NOx $3,000 0.280
PM10 $300 1.810 PM10 $300 2.850 PM10 $300 4.540 PM10 $375 1.130 PM10 $375 2.130 PM10 $375 2.740 PM10 $375 4.450 PM10 $375 4.970 PM10 $400 0.200 PM10 $400 0.390 PM10 $400 0.440 PM10 $400 0.520 PM10 $400 0.710 PM10 $400 0.810 PM10 $400 0.820 PM10 $400 0.880 PM10 $400 1.220 PM10 $400 1.580 PM10 $400 2.020 PM10 $400 2.370 PM10 $400 2.480 PM10 $400 2.670 PM10 $400 3.520 PM10 $400 3.720 PM10 $400 4.430 PM10 $400 5.130 PM10 $425 1.020 PM10 $425 1.770 PM10 $425 2.150 PM10 $435 4.700 PM10 $450 0.010 PM10 $450 0.250 PM10 $450 0.380 PM10 $450 1.180 PM10 $450 1.740 PM10 $450 2.050 PM10 $450 2.060 PM10 $450 2.140 PM10 $500 0.450 PM10 $500 0.530 PM10 $500 0.940 PM10 $500 0.970 PM10 $500 1.100 PM10 $500 1.870 PM10 $500 1.930
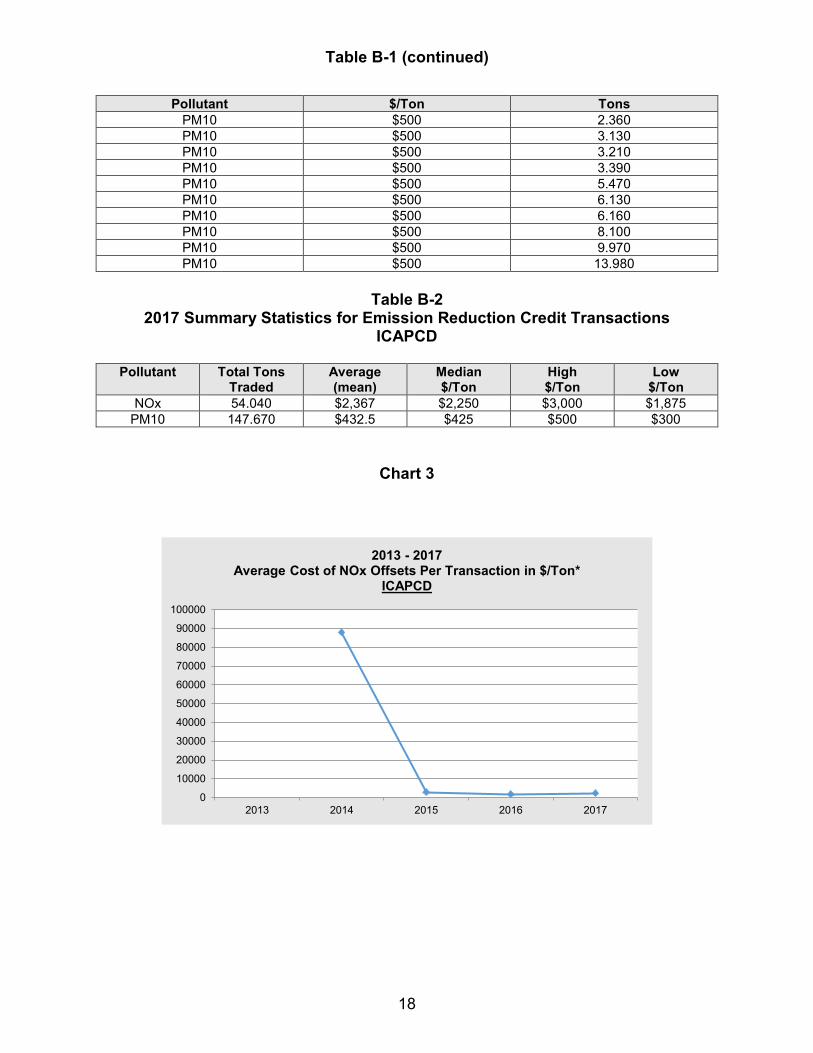
Table B-1 (continued)
18
Pollutant $/Ton Tons PM10 $500 2.360 PM10 $500 3.130 PM10 $500 3.210 PM10 $500 3.390 PM10 $500 5.470 PM10 $500 6.130 PM10 $500 6.160 PM10 $500 8.100 PM10 $500 9.970 PM10 $500 13.980
Table B-2
2017 Summary Statistics for Emission Reduction Credit Transactions ICAPCD
Pollutant Total Tons
Traded Average (mean)
Median $/Ton
High $/Ton
Low $/Ton
NOx 54.040 $2,367 $2,250 $3,000 $1,875 PM10 147.670 $432.5 $425 $500 $300
Chart 3
0
10000
20000
30000
40000
50000
60000
70000
80000
90000
100000
2013 2014 2015 2016 2017
2013 - 2017Average Cost of NOx Offsets Per Transaction in $/Ton*
ICAPCD
19
Chart 4
* Excludes asset transfer, subsidiary, barter, and other non-monetary transactions with no cost data.
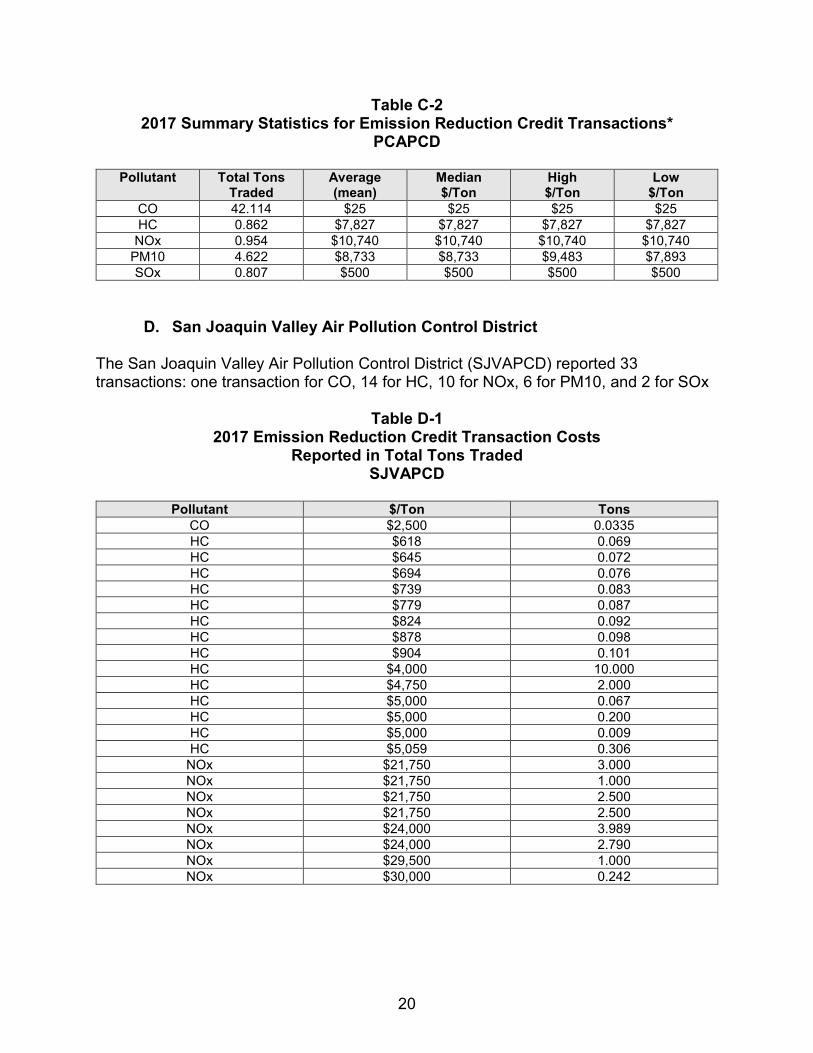
C. Placer County Air Pollution Control District The Placer County Air Pollution Control District (PCAPCD) reported six transactions: one HC, one NOx, one SOX, two PM10 and one CO
Table C-1
2017 Emission Reduction Credit Transaction Costs Reported in Total Tons Traded
PCAPCD
Pollutant $/Ton Tons CO $25 42.114 HC $7,827 0.862
NOx $10,740 0.954 PM10 $7,983 1.525 PM10 $9,483 3.097 SOx $500 0.807
$0$50
$100$150$200$250$300$350$400$450$500
2013 2014 2015 2016 2017
2013 - 2017Average Cost of PM10 Offsets Per Transaction in $/Ton*
ICAPCD
20
Table C-2 2017 Summary Statistics for Emission Reduction Credit Transactions*
PCAPCD
Pollutant Total Tons Traded
Average (mean)
Median $/Ton
High $/Ton
Low $/Ton
CO 42.114 $25 $25 $25 $25 HC 0.862 $7,827 $7,827 $7,827 $7,827 NOx 0.954 $10,740 $10,740 $10,740 $10,740
PM10 4.622 $8,733 $8,733 $9,483 $7,893 SOx 0.807 $500 $500 $500 $500
D. San Joaquin Valley Air Pollution Control District The San Joaquin Valley Air Pollution Control District (SJVAPCD) reported 33 transactions: one transaction for CO, 14 for HC, 10 for NOx, 6 for PM10, and 2 for SOx
Table D-1 2017 Emission Reduction Credit Transaction Costs
Reported in Total Tons Traded SJVAPCD
Pollutant $/Ton Tons
CO $2,500 0.0335 HC $618 0.069 HC $645 0.072 HC $694 0.076 HC $739 0.083 HC $779 0.087 HC $824 0.092 HC $878 0.098 HC $904 0.101 HC $4,000 10.000 HC $4,750 2.000 HC $5,000 0.067 HC $5,000 0.200 HC $5,000 0.009 HC $5,059 0.306
NOx $21,750 3.000 NOx $21,750 1.000 NOx $21,750 2.500 NOx $21,750 2.500 NOx $24,000 3.989 NOx $24,000 2.790 NOx $29,500 1.000 NOx $30,000 0.242
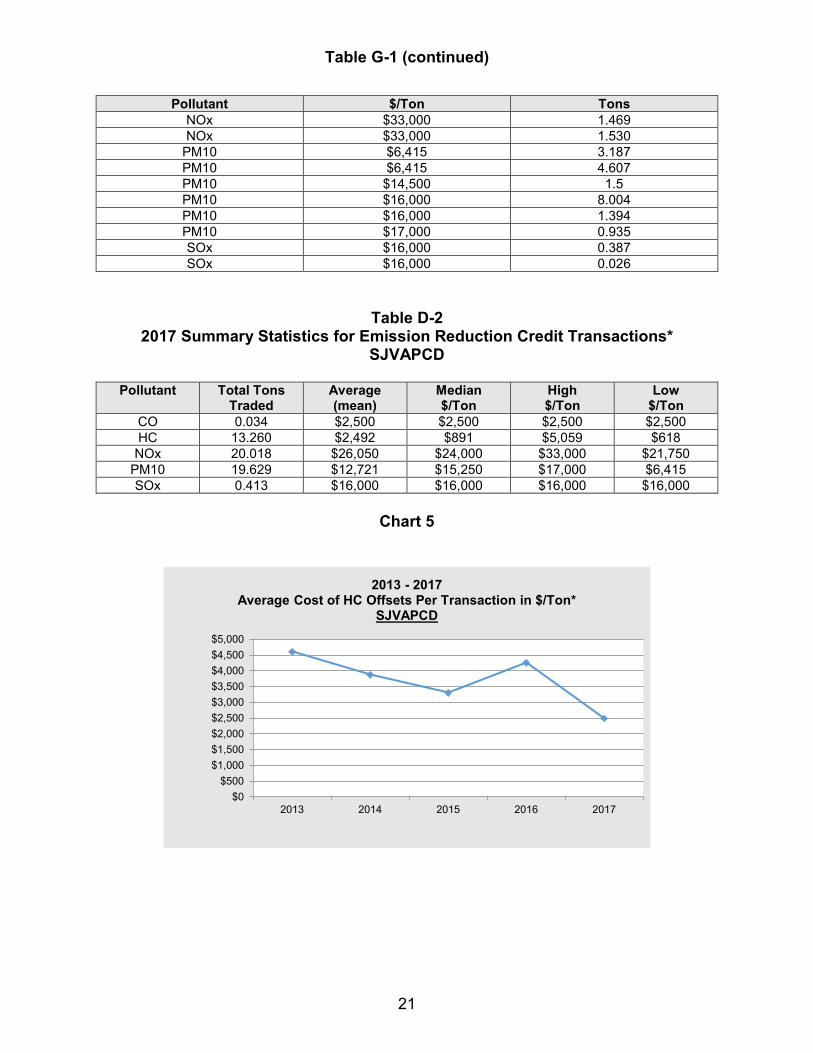
Table G-1 (continued)
21
Pollutant $/Ton Tons NOx $33,000 1.469 NOx $33,000 1.530
PM10 $6,415 3.187 PM10 $6,415 4.607 PM10 $14,500 1.5 PM10 $16,000 8.004 PM10 $16,000 1.394 PM10 $17,000 0.935 SOx $16,000 0.387 SOx $16,000 0.026
Table D-2 2017 Summary Statistics for Emission Reduction Credit Transactions*
SJVAPCD
Pollutant Total Tons Traded
Average (mean)
Median $/Ton
High $/Ton
Low $/Ton
CO 0.034 $2,500 $2,500 $2,500 $2,500 HC 13.260 $2,492 $891 $5,059 $618 NOx 20.018 $26,050 $24,000 $33,000 $21,750
PM10 19.629 $12,721 $15,250 $17,000 $6,415 SOx 0.413 $16,000 $16,000 $16,000 $16,000
Chart 5
$0$500
$1,000$1,500$2,000$2,500$3,000$3,500$4,000$4,500$5,000
2013 2014 2015 2016 2017
2013 - 2017Average Cost of HC Offsets Per Transaction in $/Ton*
SJVAPCD
22
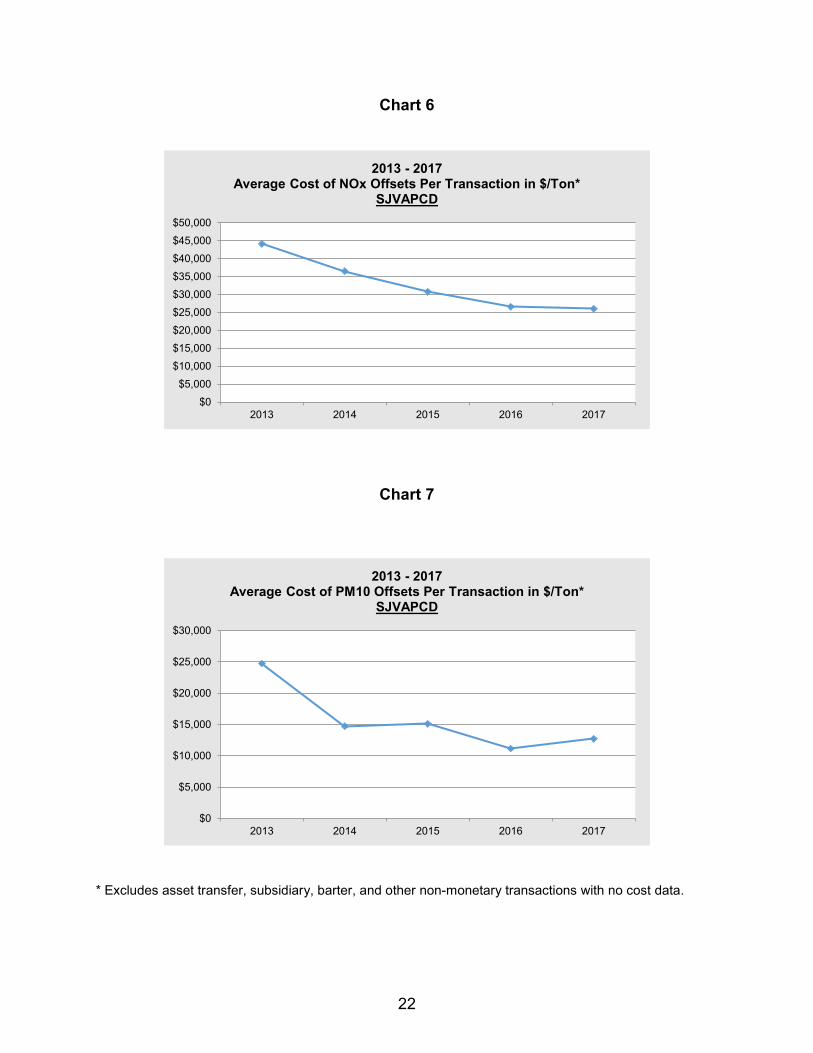
Chart 6
Chart 7
* Excludes asset transfer, subsidiary, barter, and other non-monetary transactions with no cost data.
$0$5,000
$10,000$15,000$20,000$25,000$30,000$35,000$40,000$45,000$50,000
2013 2014 2015 2016 2017
2013 - 2017Average Cost of NOx Offsets Per Transaction in $/Ton*
SJVAPCD
$0
$5,000
$10,000
$15,000
$20,000
$25,000
$30,000
2013 2014 2015 2016 2017
2013 - 2017Average Cost of PM10 Offsets Per Transaction in $/Ton*
SJVAPCD
23
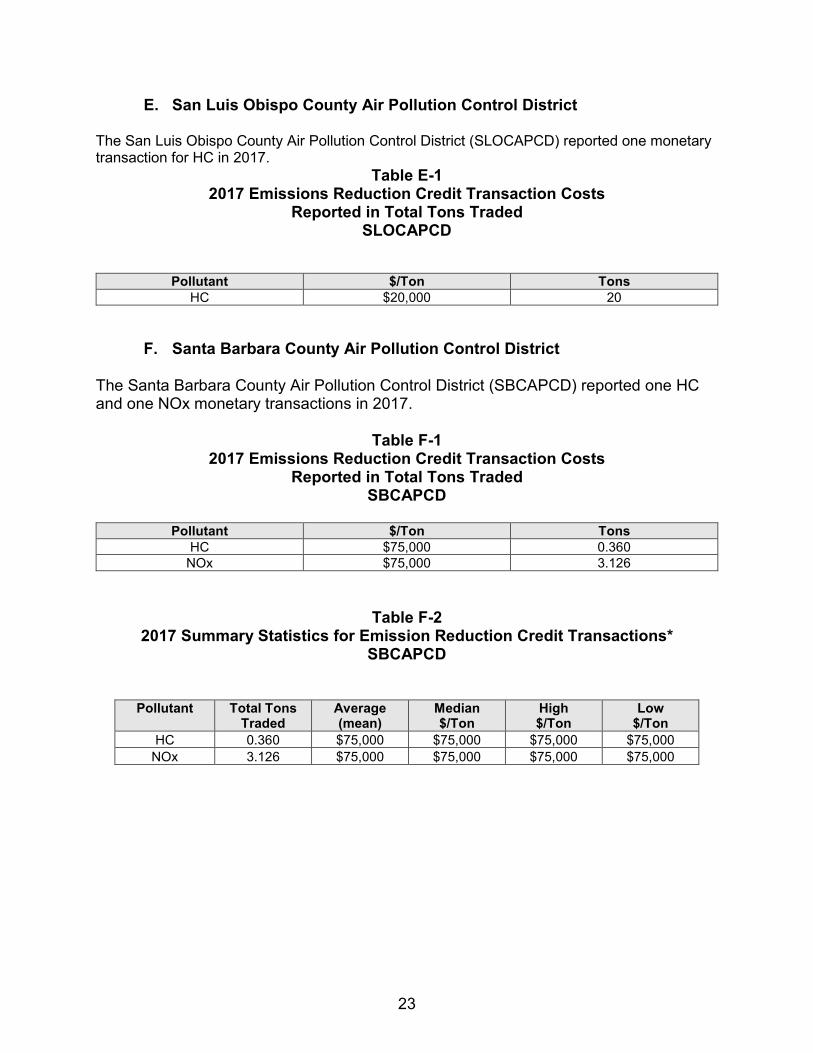
E. San Luis Obispo County Air Pollution Control District
The San Luis Obispo County Air Pollution Control District (SLOCAPCD) reported one monetary transaction for HC in 2017.
Table E-1 2017 Emissions Reduction Credit Transaction Costs
Reported in Total Tons Traded SLOCAPCD
Pollutant $/Ton Tons HC $20,000 20
F. Santa Barbara County Air Pollution Control District The Santa Barbara County Air Pollution Control District (SBCAPCD) reported one HC and one NOx monetary transactions in 2017.
Table F-1 2017 Emissions Reduction Credit Transaction Costs
Reported in Total Tons Traded SBCAPCD
Pollutant $/Ton Tons
HC $75,000 0.360 NOx $75,000 3.126
Table F-2 2017 Summary Statistics for Emission Reduction Credit Transactions*
SBCAPCD
Pollutant Total Tons Traded
Average (mean)
Median $/Ton
High $/Ton
Low $/Ton
HC 0.360 $75,000 $75,000 $75,000 $75,000 NOx 3.126 $75,000 $75,000 $75,000 $75,000
24
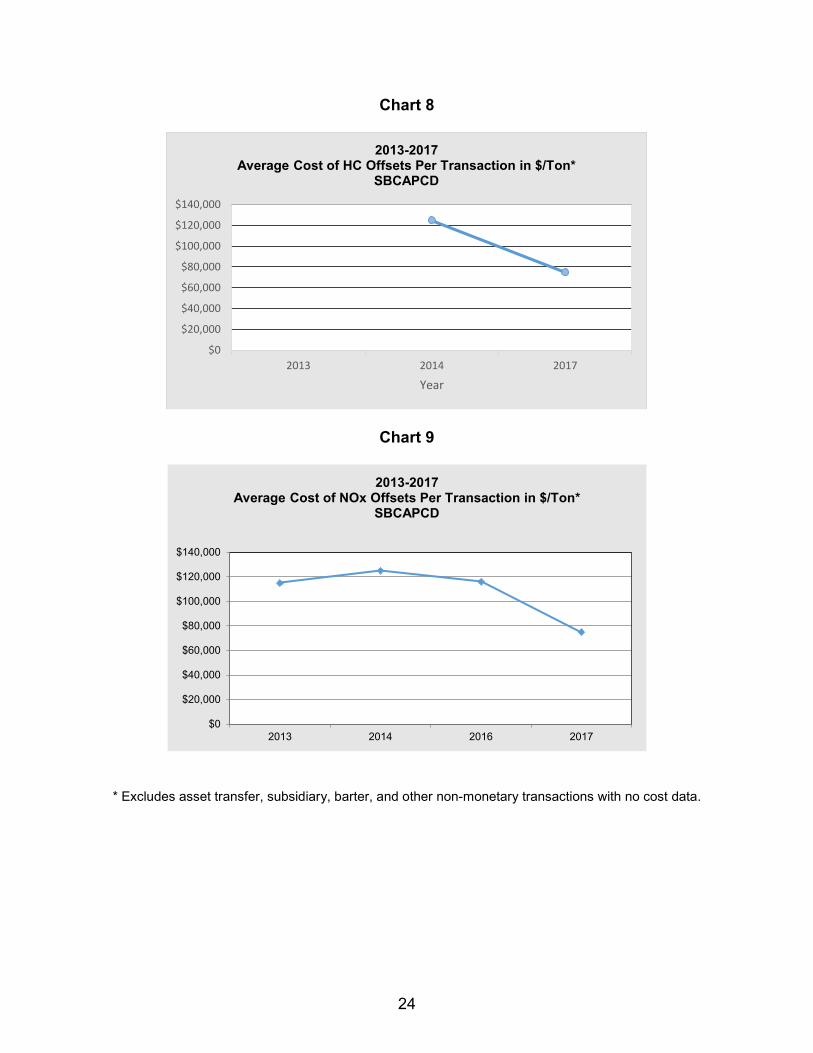
Chart 8
Chart 9
* Excludes asset transfer, subsidiary, barter, and other non-monetary transactions with no cost data.
$0
$20,000
$40,000
$60,000
$80,000
$100,000
$120,000
$140,000
2013 2014 2017
Year
2013-2017Average Cost of HC Offsets Per Transaction in $/Ton*
SBCAPCD
$0
$20,000
$40,000
$60,000
$80,000
$100,000
$120,000
$140,000
2013 2014 2016 2017
2013-2017Average Cost of NOx Offsets Per Transaction in $/Ton*
SBCAPCD
25
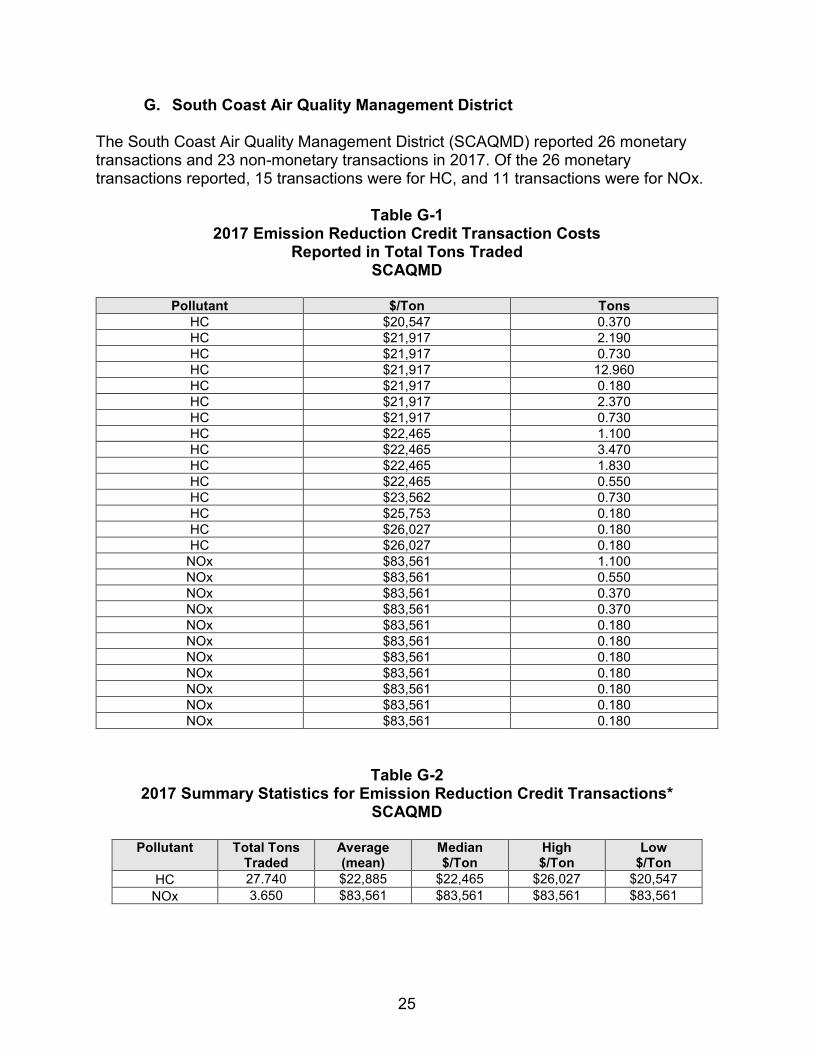
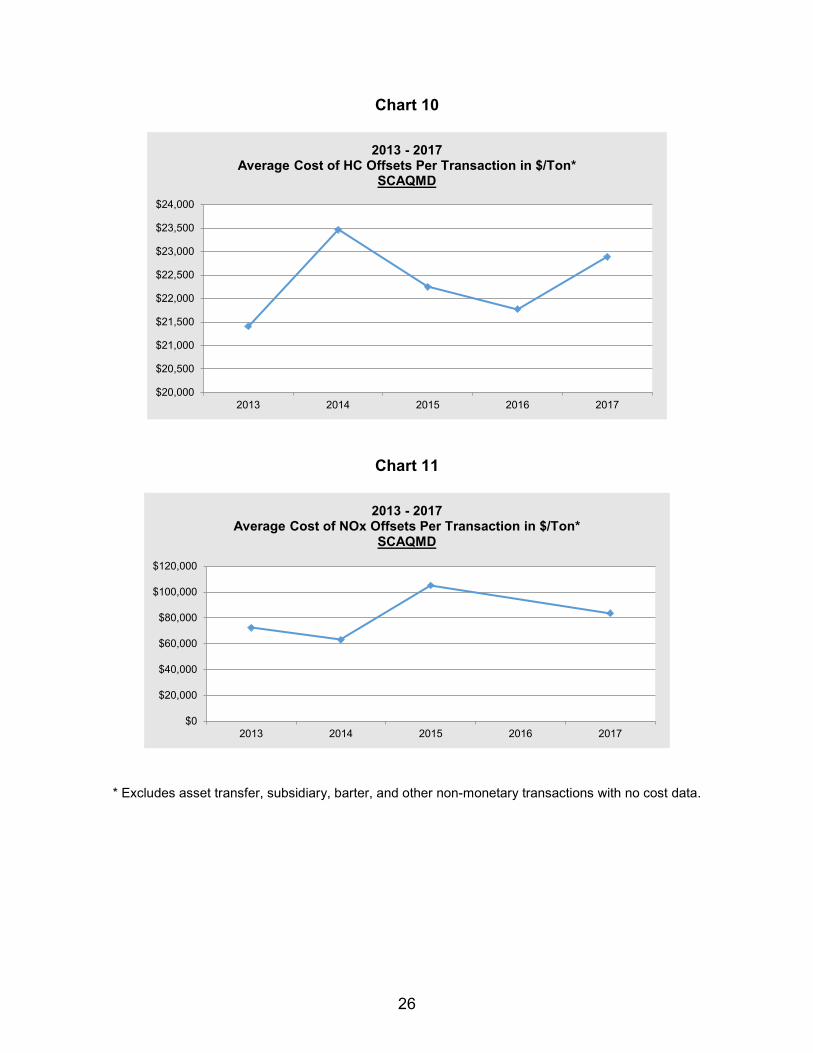
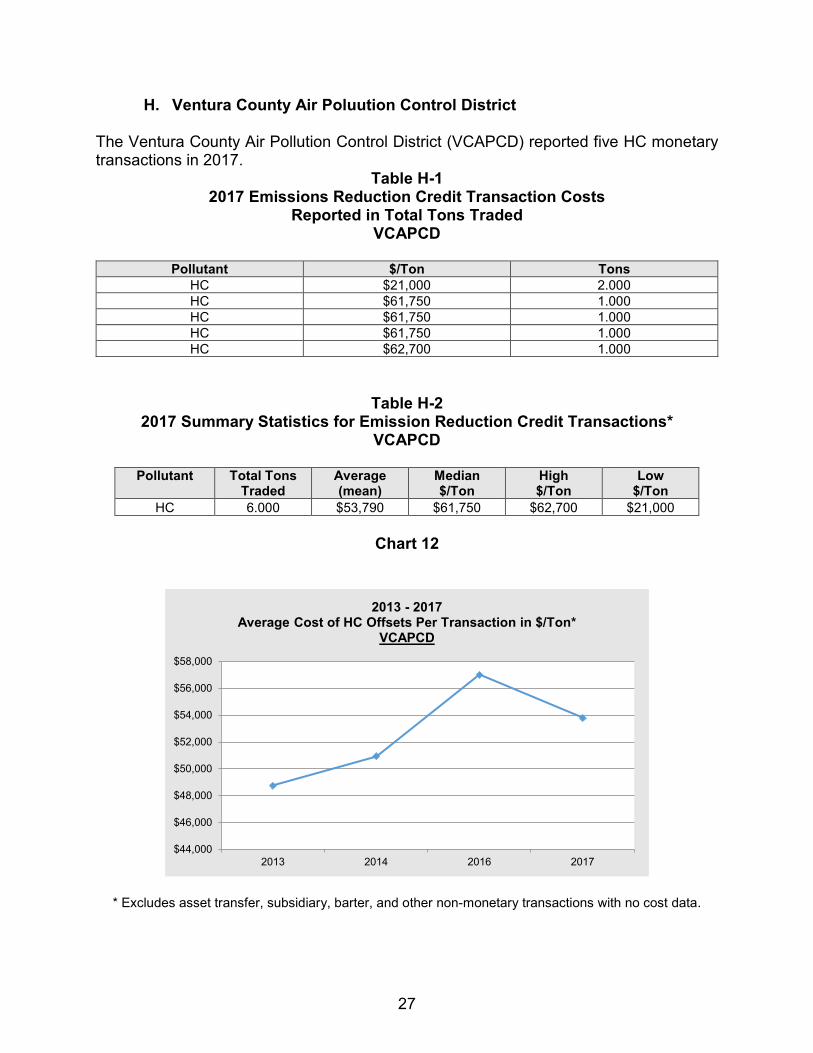
G. South Coast Air Quality Management District The South Coast Air Quality Management District (SCAQMD) reported 26 monetary transactions and 23 non-monetary transactions in 2017. Of the 26 monetary transactions reported, 15 transactions were for HC, and 11 transactions were for NOx.
Table G-1 2017 Emission Reduction Credit Transaction Costs
Reported in Total Tons Traded SCAQMD
Pollutant $/Ton Tons
HC $20,547 0.370 HC $21,917 2.190 HC $21,917 0.730 HC $21,917 12.960 HC $21,917 0.180 HC $21,917 2.370 HC $21,917 0.730 HC $22,465 1.100 HC $22,465 3.470 HC $22,465 1.830 HC $22,465 0.550 HC $23,562 0.730 HC $25,753 0.180 HC $26,027 0.180 HC $26,027 0.180
NOx $83,561 1.100 NOx $83,561 0.550 NOx $83,561 0.370 NOx $83,561 0.370 NOx $83,561 0.180 NOx $83,561 0.180 NOx $83,561 0.180 NOx $83,561 0.180 NOx $83,561 0.180 NOx $83,561 0.180 NOx $83,561 0.180
Table G-2 2017 Summary Statistics for Emission Reduction Credit Transactions*
SCAQMD
Pollutant Total Tons Traded
Average (mean)
Median $/Ton
High $/Ton
Low $/Ton
HC 27.740 $22,885 $22,465 $26,027 $20,547 NOx 3.650 $83,561 $83,561 $83,561 $83,561
26
Chart 10
Chart 11
* Excludes asset transfer, subsidiary, barter, and other non-monetary transactions with no cost data.
$20,000
$20,500
$21,000
$21,500
$22,000
$22,500
$23,000
$23,500
$24,000
2013 2014 2015 2016 2017
2013 - 2017Average Cost of HC Offsets Per Transaction in $/Ton*
SCAQMD
$0
$20,000
$40,000
$60,000
$80,000
$100,000
$120,000
2013 2014 2015 2016 2017
2013 - 2017 Average Cost of NOx Offsets Per Transaction in $/Ton*
SCAQMD
27
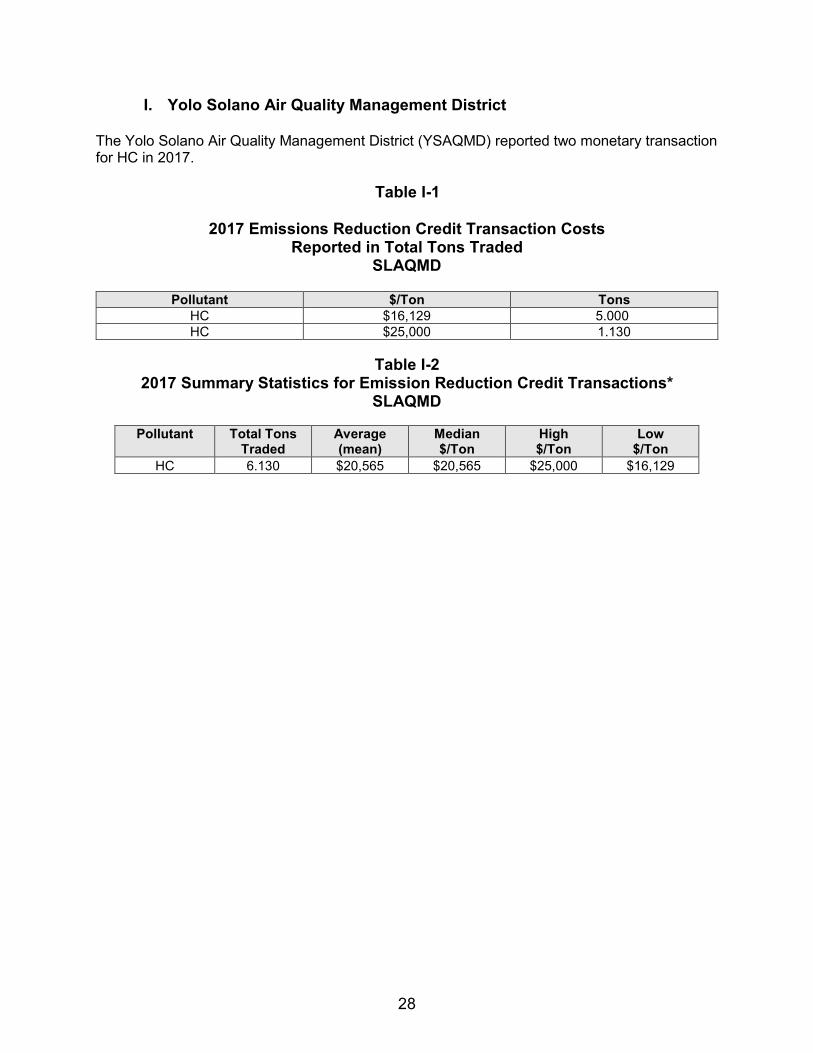
H. Ventura County Air Poluution Control District The Ventura County Air Pollution Control District (VCAPCD) reported five HC monetary transactions in 2017.
Table H-1 2017 Emissions Reduction Credit Transaction Costs
Reported in Total Tons Traded VCAPCD
Pollutant $/Ton Tons
HC $21,000 2.000 HC $61,750 1.000 HC $61,750 1.000 HC $61,750 1.000 HC $62,700 1.000
Table H-2 2017 Summary Statistics for Emission Reduction Credit Transactions*
VCAPCD
Pollutant Total Tons Traded
Average (mean)
Median $/Ton
High $/Ton
Low $/Ton
HC 6.000 $53,790 $61,750 $62,700 $21,000
Chart 12
* Excludes asset transfer, subsidiary, barter, and other non-monetary transactions with no cost data.
$44,000
$46,000
$48,000
$50,000
$52,000
$54,000
$56,000
$58,000
2013 2014 2016 2017
2013 - 2017Average Cost of HC Offsets Per Transaction in $/Ton*
VCAPCD
28
I. Yolo Solano Air Quality Management District
The Yolo Solano Air Quality Management District (YSAQMD) reported two monetary transaction for HC in 2017.
Table I-1
2017 Emissions Reduction Credit Transaction Costs Reported in Total Tons Traded
SLAQMD
Pollutant $/Ton Tons HC $16,129 5.000 HC $25,000 1.130
Table I-2
2017 Summary Statistics for Emission Reduction Credit Transactions* SLAQMD
Pollutant Total Tons
Traded Average (mean)
Median $/Ton
High $/Ton
Low $/Ton
HC 6.130 $20,565 $20,565 $25,000 $16,129
29
[This Page Intentionally Left Blank]
30
APPENDIX A
HEALTH & SAFETY CODE SECTIONS 40709 & 40709.5, AND GOVERNMENT CODE SECTION 6254.7
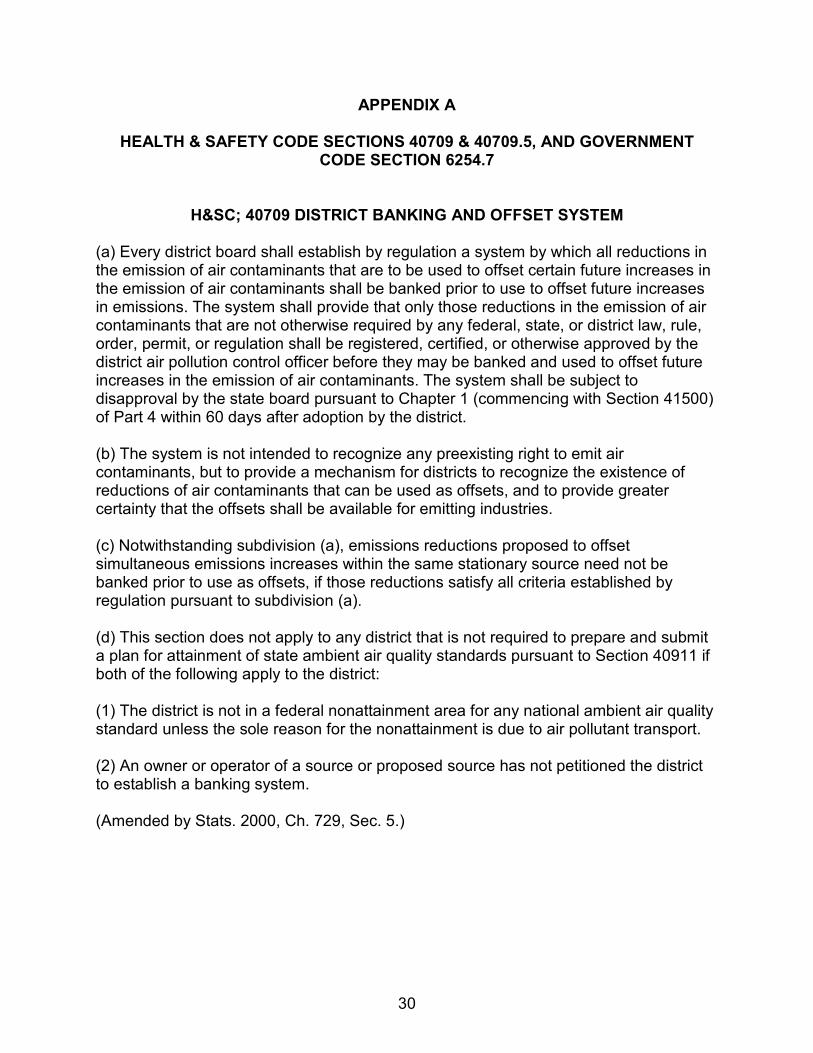
H≻ 40709 DISTRICT BANKING AND OFFSET SYSTEM
(a) Every district board shall establish by regulation a system by which all reductions in the emission of air contaminants that are to be used to offset certain future increases in the emission of air contaminants shall be banked prior to use to offset future increases in emissions. The system shall provide that only those reductions in the emission of air contaminants that are not otherwise required by any federal, state, or district law, rule, order, permit, or regulation shall be registered, certified, or otherwise approved by the district air pollution control officer before they may be banked and used to offset future increases in the emission of air contaminants. The system shall be subject to disapproval by the state board pursuant to Chapter 1 (commencing with Section 41500) of Part 4 within 60 days after adoption by the district. (b) The system is not intended to recognize any preexisting right to emit air contaminants, but to provide a mechanism for districts to recognize the existence of reductions of air contaminants that can be used as offsets, and to provide greater certainty that the offsets shall be available for emitting industries. (c) Notwithstanding subdivision (a), emissions reductions proposed to offset simultaneous emissions increases within the same stationary source need not be banked prior to use as offsets, if those reductions satisfy all criteria established by regulation pursuant to subdivision (a). (d) This section does not apply to any district that is not required to prepare and submit a plan for attainment of state ambient air quality standards pursuant to Section 40911 if both of the following apply to the district: (1) The district is not in a federal nonattainment area for any national ambient air quality standard unless the sole reason for the nonattainment is due to air pollutant transport. (2) An owner or operator of a source or proposed source has not petitioned the district to establish a banking system. (Amended by Stats. 2000, Ch. 729, Sec. 5.)
31
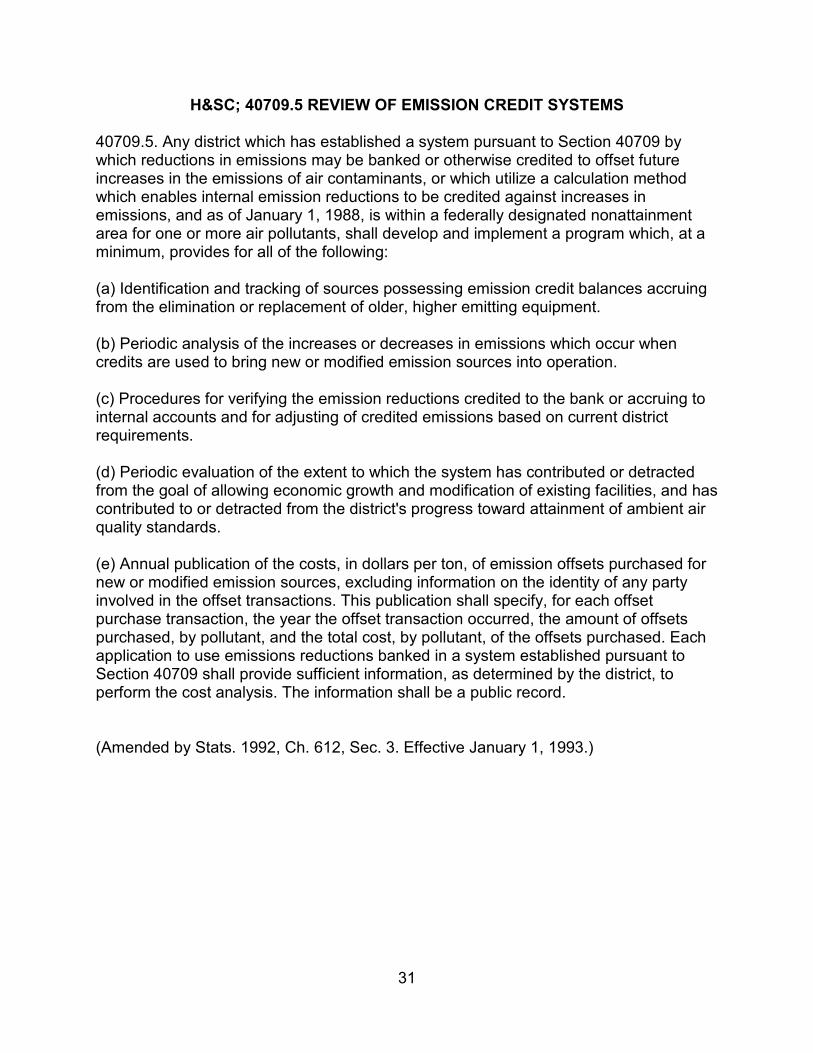
H≻ 40709.5 REVIEW OF EMISSION CREDIT SYSTEMS 40709.5. Any district which has established a system pursuant to Section 40709 by which reductions in emissions may be banked or otherwise credited to offset future increases in the emissions of air contaminants, or which utilize a calculation method which enables internal emission reductions to be credited against increases in emissions, and as of January 1, 1988, is within a federally designated nonattainment area for one or more air pollutants, shall develop and implement a program which, at a minimum, provides for all of the following: (a) Identification and tracking of sources possessing emission credit balances accruing from the elimination or replacement of older, higher emitting equipment. (b) Periodic analysis of the increases or decreases in emissions which occur when credits are used to bring new or modified emission sources into operation. (c) Procedures for verifying the emission reductions credited to the bank or accruing to internal accounts and for adjusting of credited emissions based on current district requirements. (d) Periodic evaluation of the extent to which the system has contributed or detracted from the goal of allowing economic growth and modification of existing facilities, and has contributed to or detracted from the district's progress toward attainment of ambient air quality standards. (e) Annual publication of the costs, in dollars per ton, of emission offsets purchased for new or modified emission sources, excluding information on the identity of any party involved in the offset transactions. This publication shall specify, for each offset purchase transaction, the year the offset transaction occurred, the amount of offsets purchased, by pollutant, and the total cost, by pollutant, of the offsets purchased. Each application to use emissions reductions banked in a system established pursuant to Section 40709 shall provide sufficient information, as determined by the district, to perform the cost analysis. The information shall be a public record. (Amended by Stats. 1992, Ch. 612, Sec. 3. Effective January 1, 1993.)
32
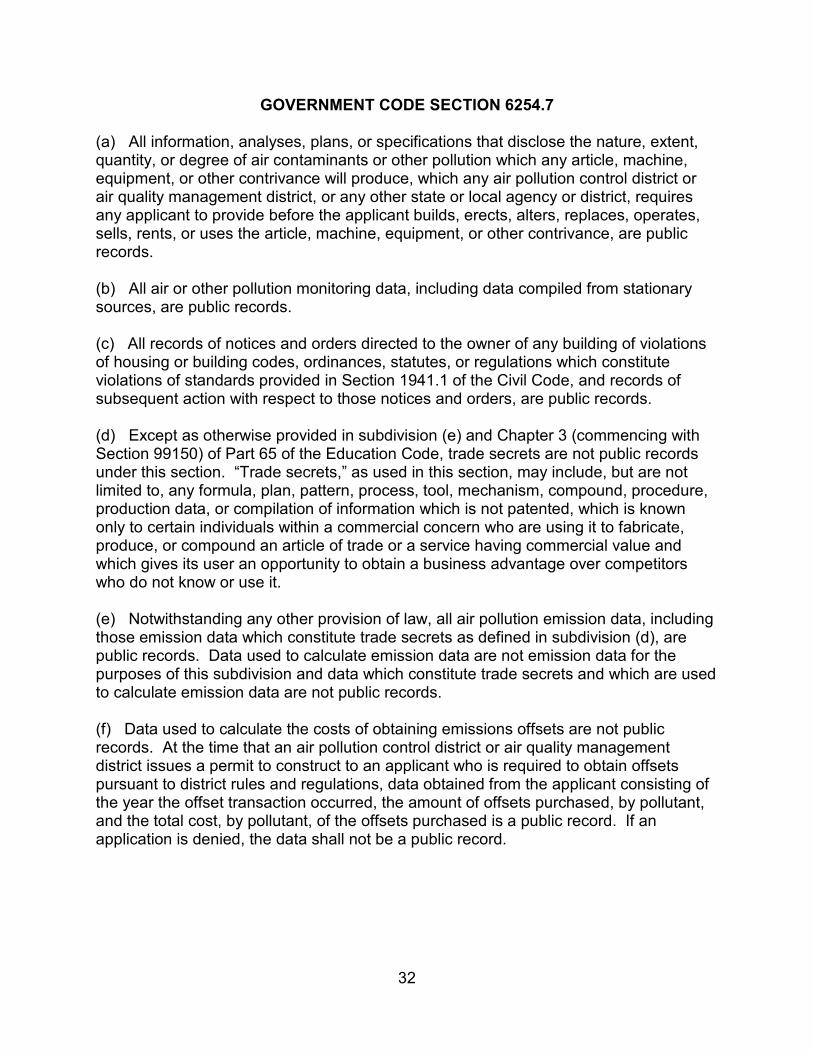
GOVERNMENT CODE SECTION 6254.7 (a) All information, analyses, plans, or specifications that disclose the nature, extent, quantity, or degree of air contaminants or other pollution which any article, machine, equipment, or other contrivance will produce, which any air pollution control district or air quality management district, or any other state or local agency or district, requires any applicant to provide before the applicant builds, erects, alters, replaces, operates, sells, rents, or uses the article, machine, equipment, or other contrivance, are public records. (b) All air or other pollution monitoring data, including data compiled from stationary sources, are public records. (c) All records of notices and orders directed to the owner of any building of violations of housing or building codes, ordinances, statutes, or regulations which constitute violations of standards provided in Section 1941.1 of the Civil Code, and records of subsequent action with respect to those notices and orders, are public records. (d) Except as otherwise provided in subdivision (e) and Chapter 3 (commencing with Section 99150) of Part 65 of the Education Code, trade secrets are not public records under this section. “Trade secrets,” as used in this section, may include, but are not limited to, any formula, plan, pattern, process, tool, mechanism, compound, procedure, production data, or compilation of information which is not patented, which is known only to certain individuals within a commercial concern who are using it to fabricate, produce, or compound an article of trade or a service having commercial value and which gives its user an opportunity to obtain a business advantage over competitors who do not know or use it. (e) Notwithstanding any other provision of law, all air pollution emission data, including those emission data which constitute trade secrets as defined in subdivision (d), are public records. Data used to calculate emission data are not emission data for the purposes of this subdivision and data which constitute trade secrets and which are used to calculate emission data are not public records. (f) Data used to calculate the costs of obtaining emissions offsets are not public records. At the time that an air pollution control district or air quality management district issues a permit to construct to an applicant who is required to obtain offsets pursuant to district rules and regulations, data obtained from the applicant consisting of the year the offset transaction occurred, the amount of offsets purchased, by pollutant, and the total cost, by pollutant, of the offsets purchased is a public record. If an application is denied, the data shall not be a public record.
33
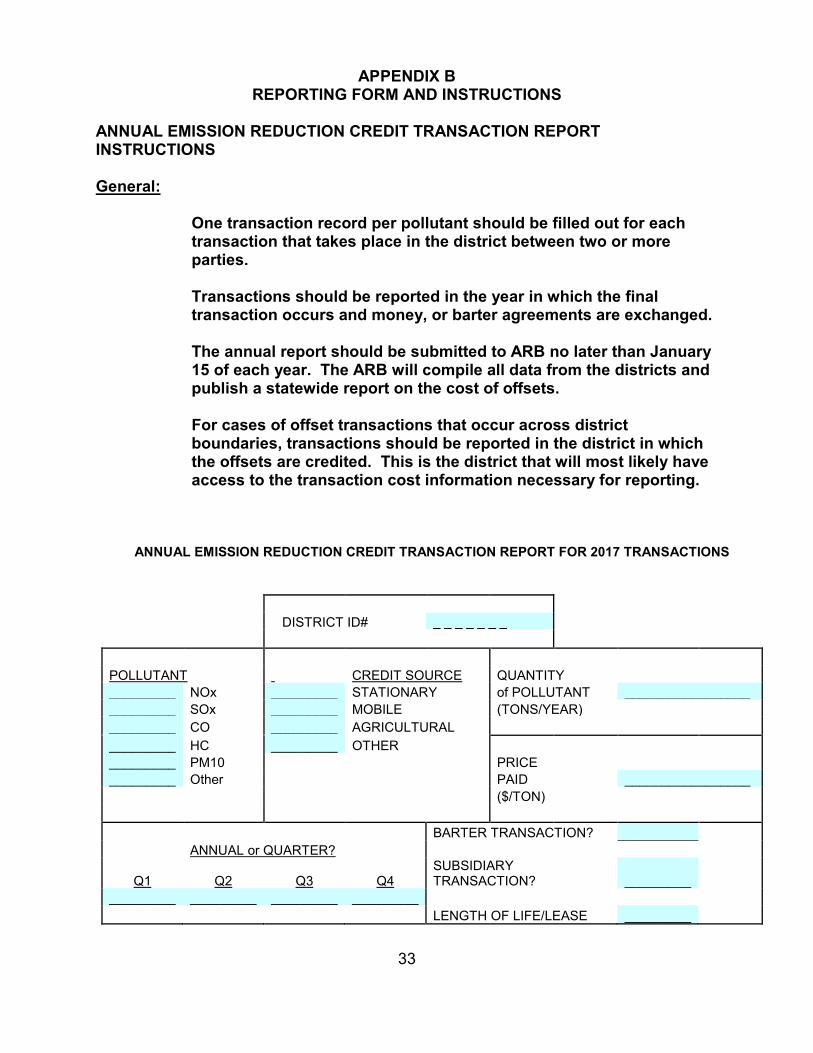
APPENDIX B REPORTING FORM AND INSTRUCTIONS
ANNUAL EMISSION REDUCTION CREDIT TRANSACTION REPORT INSTRUCTIONS
General:
One transaction record per pollutant should be filled out for each transaction that takes place in the district between two or more parties.
Transactions should be reported in the year in which the final transaction occurs and money, or barter agreements are exchanged.
The annual report should be submitted to ARB no later than January 15 of each year. The ARB will compile all data from the districts and publish a statewide report on the cost of offsets.
For cases of offset transactions that occur across district boundaries, transactions should be reported in the district in which the offsets are credited. This is the district that will most likely have access to the transaction cost information necessary for reporting.
ANNUAL EMISSION REDUCTION CREDIT TRANSACTION REPORT FOR 2017 TRANSACTIONS
DISTRICT ID# _ _ _ _ _ _ _ POLLUTANT CREDIT SOURCE QUANTITY _________ NOx _________ STATIONARY of POLLUTANT _________________ _________ SOx _________ MOBILE (TONS/YEAR) _________ CO _________ AGRICULTURAL _________ HC _________ OTHER _________ PM10 PRICE _________ Other PAID _________________ ($/TON) BARTER TRANSACTION? ANNUAL or QUARTER?
Q1 Q2 Q3 Q4 SUBSIDIARY TRANSACTION? _________
_________ _________ _________ _________ LENGTH OF LIFE/LEASE _________

34
yeartons0.1825=
lbston
20001X
yeardaysX365
daylb1=
daylb1
1. District ID #: The district ID # should be in the format:
AAYYXXX
Where AA is a two letter district code (a list of district codes is attached), YY is a two digit year (in which the transaction occurs) identifier (e.g. 13 for 2013), and XXX is a three-digit transaction number from 001 to 999. This ID number will only be used to track the origin of data and for data validation. The assignment of a transaction number will ensure quality control of data transfer between the district and the Air Resources Board. Individual transactions will not be identified in Air Resources Board summary reports.
2. Pollutant: Please check one pollutant per transaction. If trade involved
more than one pollutant, use separate transaction records for each pollutant traded. HC is equivalent to other acronyms used for hydrocarbons such as POC, ROC, ROG and VOC.
3. Credit Source: Please indicate the source of emission reduction credits
(ERC). This information will aid in the analysis of ERC prices paid. Stationary source credits typically do not have a finite useful life, whereas mobile and agricultural source ERCs have specific limiting conditions that limit useful life. It is important that a distinction be made between these kinds of offsets when analyzing the cost of offsets.
4. Annual/Quarter: Please indicate if credits are valid on an annual basis or
quarterly. Additionally, if credits are valid quarterly, indicate in which quarter they can be used. This applies to seasonal credits or credits that are only valid in a specific quarter.
5. Quantity of Pollutant: Regardless of district recording practices or the
transaction agreement, please provide the quantity of pollutant in tons/year.
Example 1: For Data Given as a Single Quarter Transactions
Example 2: For Data Provided as an Annual Transactions
Example 3: For Quarterly Credits Used to Offset Annual Sources
yearlbs=)Q+Q+Q+Q( 4321
yeartons0.0020=
lbston
20001X
yearquartersX4
quarterlb1=
quarterlb1
35
Convert to tons per year 6. Price Paid: This is the bottom line price paid by the purchaser to the owner
of the credit. Government Code Section 6254.7 authorizes the district to obtain this information from applicants. Net present value should not be calculated for lease transactions. If price is given in dollars per pound, please convert to dollars per ton by multiplying by 2000 lb/ton.
7. Barter and Subsidiary Transactions: If barter was involved and/or no
money was exchanged for the offsets, the district should request the applicant to calculate a dollars/ton value for the credit transaction. Barters can include one company (A) placing controls on another (B) to generate credits. The price paid should then reflect what company A paid to install equipment at company B and any additional fees paid to company B as part of the agreement. The price paid for offsets should be the value of the offset at the time of the transaction.
If a transaction occurred between two subsidiaries of the same parent company, check the subsidiary transaction box. This also applies to transactions that occur between agencies of the same governmental system for example between two agencies of the county. Since the price charged in barter and subsidiary transactions may not reflect the market value of credits, this information will be helpful in analyzing prices paid for credits.
8. Length of Use/Lease: Please indicate the valid length of credit life for this
transaction. This applies to stationary source credits that are sold as a limited life lease agreement, or to other types of credit that have a finite useful life. If no limit is placed on the useful life, leave this box blank.
36
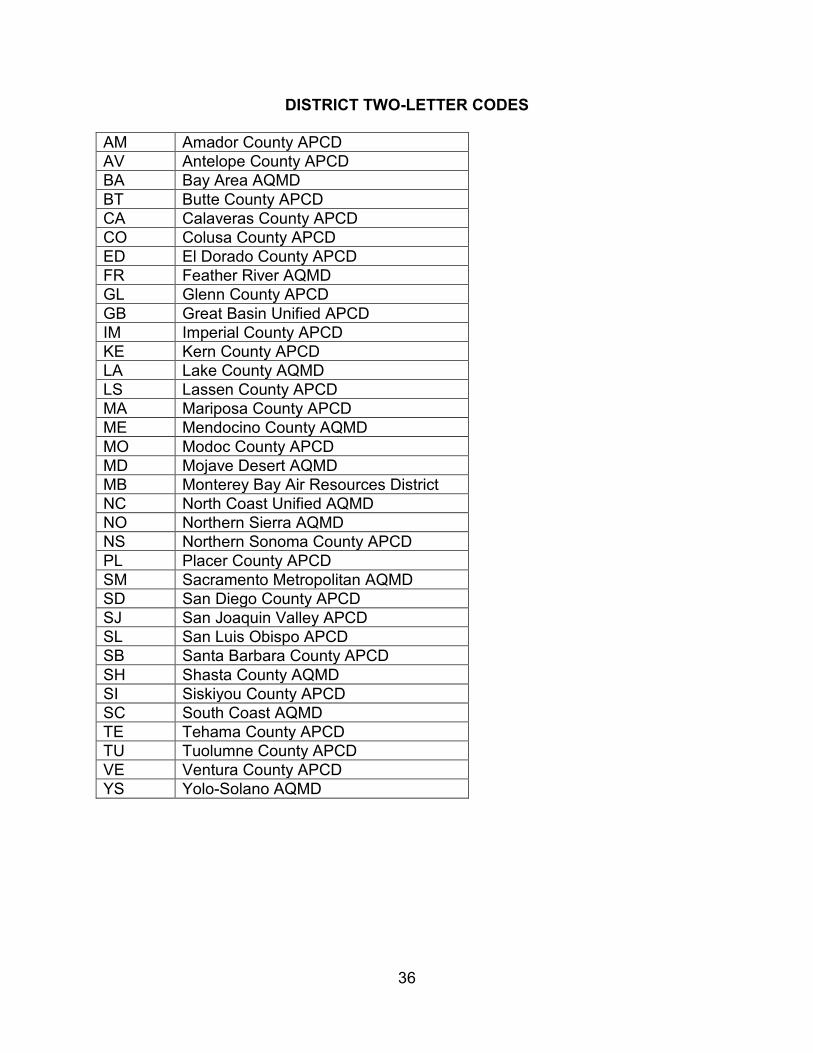
DISTRICT TWO-LETTER CODES AM Amador County APCD AV Antelope County APCD BA Bay Area AQMD BT Butte County APCD CA Calaveras County APCD CO Colusa County APCD ED El Dorado County APCD FR Feather River AQMD GL Glenn County APCD GB Great Basin Unified APCD IM Imperial County APCD KE Kern County APCD LA Lake County AQMD LS Lassen County APCD MA Mariposa County APCD ME Mendocino County AQMD MO Modoc County APCD MD Mojave Desert AQMD MB Monterey Bay Air Resources District NC North Coast Unified AQMD NO Northern Sierra AQMD NS Northern Sonoma County APCD PL Placer County APCD SM Sacramento Metropolitan AQMD SD San Diego County APCD SJ San Joaquin Valley APCD SL San Luis Obispo APCD SB Santa Barbara County APCD SH Shasta County AQMD SI Siskiyou County APCD SC South Coast AQMD TE Tehama County APCD TU Tuolumne County APCD VE Ventura County APCD YS Yolo-Solano AQMD
37
APPENDIX C
GLOSSARY OF TERMS Agricultural Source: Source of air pollution used in the production of crops, or the raising of fowl or animals located on contiguous property under common ownership. Barter: To trade without using money. Leased: A legal agreement that lets someone use an asset for a period of time in return for payment. Mobile source: Sources of air pollution such as automobiles, motorcycles, trucks, off-road vehicles, boats and airplanes. Stationary source: Non-mobile sources such as power plants, refineries and manufacturing facilities which emit air pollutants. Subsidiary: Serving to assist or supplement.
Top Related