


Languages
Pages
Legal


2013
EmailMarketingStatisticsforResidentialRealEstateAgents
NeedSales?UseOure‐ProspectingSolution!

EmailMarketingStatisticsforResidentialRealEstateAgents
©2011‐2013HomeActions,LLC.AllRightsReserved. 2of20 www.homeactions.net
NeedSales?UseOure‐ProspectingSolution!
TABLE OF CONTENTS LetterFromOurCEO.............................................................................................................................................................................................3
OpenRates.................................................................................................................................................................................................................4
OpenRatesIntroduction.................................................................................................................................................................................4
OpenRatesByQuarter.....................................................................................................................................................................................5
OpenRatesByRegion.......................................................................................................................................................................................6
OpenRatesByListSize....................................................................................................................................................................................7
ClickThroughRates...............................................................................................................................................................................................8
ClickThroughRateIntroduction.................................................................................................................................................................8
ClickThroughRatesByQuarter...................................................................................................................................................................9
ClickThroughRatesByRegion...................................................................................................................................................................10
ClickThroughRatesByListSize................................................................................................................................................................11
DailySendRates....................................................................................................................................................................................................12
EmailsSentByDayoftheWeek.................................................................................................................................................................12
DailySendRatesByRegion..........................................................................................................................................................................13
DailySendRatesByListSize.......................................................................................................................................................................14
UnsubscribeRates.................................................................................................................................................................................................15
UnsubscribeRatesIntroduction................................................................................................................................................................15
UnsubscribeRatesByRegion......................................................................................................................................................................16
UnsubscribeRatesByListSize...................................................................................................................................................................16
Definitions&Tips..................................................................................................................................................................................................17
AboutHomeActions.............................................................................................................................................................................................20

EmailMarketingStatisticsforResidentialRealEstateAgents
©2011‐2013HomeActions,LLC.AllRightsReserved. 3of20 www.homeactions.net
NeedSales?UseOure‐ProspectingSolution!
LETTER FROM OUR CEO
We are proud to release our first annual report onEmailMarketing Statistics forResidentialRealEstateAgents. This report covers statistics for the calendar yearsendingDecember31,2011andDecember31,2012.HomeActionsisane‐publishingcompanythatspecializesincontentdeliveryforthereal estate industry. We deliver e‐marketing, home advocacy and industry bestpractices content via email, newsletters and other electronic channels. Since weproduce themajority of the content for our newsletter product line, this study isuniqueanddefinitive.Goingforwardwewillproduceannualstudies,inadditiontotrackingtrendsinrealestate,andreportingonindustrybestpractices.Thisstudyisbasedsolelyonourcustomerbaseandincludesmorethan10millionemails delivered by real estate agents to their clients and prospects. This reportexaminesseveralcriticalemailmarketingmetrics,includingclickthroughratesandopenrates,over thecourseof twoyears. Italsoexplores theperformanceofeachgeographicregionbasedonvariouslistsizesaswellaslaunchday.Theworldofemailmarketingcontinuestobethemosteffectiveandleastexpensivemethodofmarketing.Thisisparticularlytruewithrealestateagentswhohavetheformidable task of staying in touchwith clients and prospects for long periods oftime. A system that "touches" their contacts twice per month with outstandingarticlesisthebasicstrategyoftheHomeActionsplatform.TheHomeActionsEmailMarketingStatisticsforResidentialRealEstateAgentsreinforcestheimportanceofemailmarketingasameansforrealestateagentstoreachtheirclientsandprospects.Managingeffectivelythepipelineofclientsandprospectsofrealestateagentsisperhapsoneofthemostimportantactionplansforasuccessfulrealestateagent.OurgoalatHomeActionsistohelprealestateagentssucceedandgrowtheirbusiness.Wewelcomeallcommentsandhopeyoufindthisreportmeaningful.
BarryJ.Friedman,CEOHomeActions,LLCwww.homeactions.netNote‐ThisreportcontainsstatisticsofHomeActionsclientsandexcludesthefollowing: 1‐RealEstateagentswithlessthan25emailaddressesintheirplatform 2‐AllmarketingemailsofHomeActions
BarryJ.Friedman
EmailMarketingStatisticsforResidentialRealEstateAgents
©2011‐2013HomeActions,LLC.AllRightsReserved. 4of20 www.homeactions.net
NeedSales?UseOure‐ProspectingSolution!
OPEN RATES
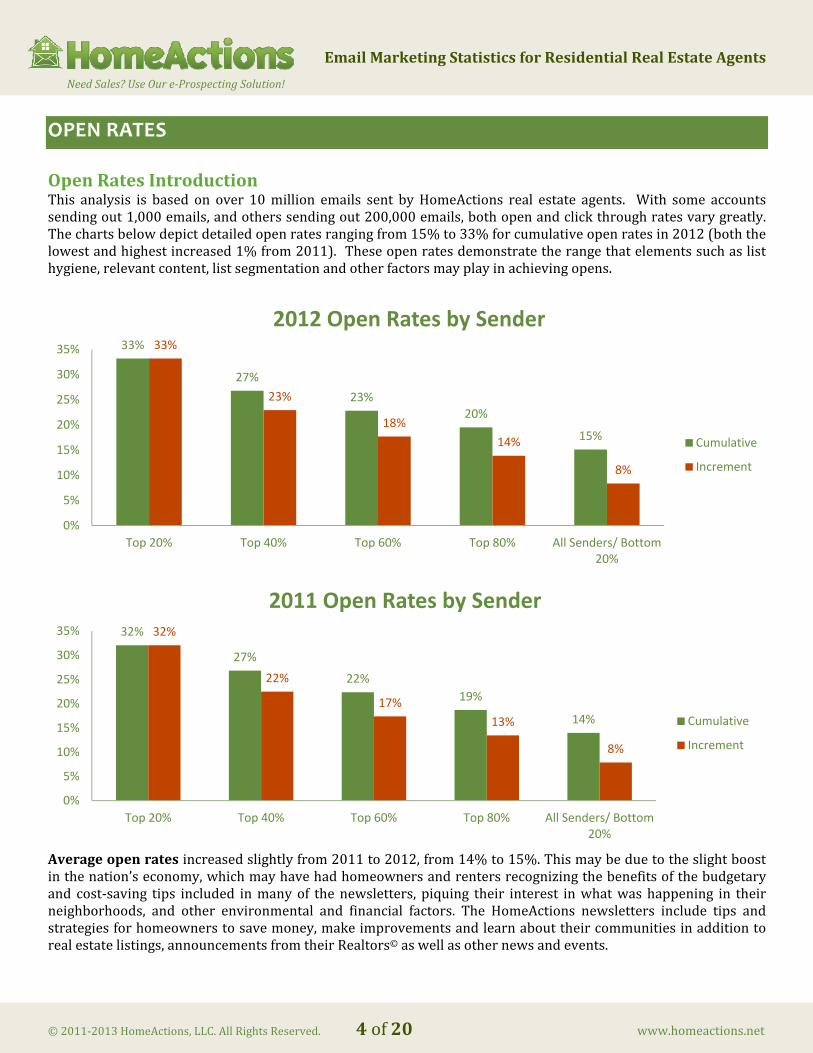
OpenRatesIntroductionThis analysis is based on over 10million emails sent byHomeActions real estate agents. With some accountssendingout1,000emails,andotherssendingout200,000emails,bothopenandclickthroughratesvarygreatly.Thechartsbelowdepictdetailedopenratesrangingfrom15%to33%forcumulativeopenratesin2012(boththelowestandhighestincreased1%from2011).Theseopenratesdemonstratetherangethatelementssuchaslisthygiene,relevantcontent,listsegmentationandotherfactorsmayplayinachievingopens.
Averageopenratesincreasedslightlyfrom2011to2012,from14%to15%.Thismaybeduetotheslightboostinthenation’seconomy,whichmayhavehadhomeownersandrentersrecognizingthebenefitsofthebudgetaryand cost‐saving tips included inmanyof thenewsletters, piquing their interest inwhatwashappening in theirneighborhoods, and other environmental and financial factors. The HomeActions newsletters include tips andstrategiesforhomeownerstosavemoney,makeimprovementsandlearnabouttheircommunitiesinadditiontorealestatelistings,announcementsfromtheirRealtors©aswellasothernewsandevents.
33%
27%
23%20%
15%
33%
23%
18%
14%
8%
0%
5%
10%
15%
20%
25%
30%
35%
Top 20% Top 40% Top 60% Top 80% All Senders/ Bottom 20%
2012 Open Rates by Sender
Cumulative
Increment
32%
27%
22%
19%
14%
32%
22%
17%
13%
8%
0%
5%
10%
15%
20%
25%
30%
35%
Top 20% Top 40% Top 60% Top 80% All Senders/ Bottom 20%
2011 Open Rates by Sender
Cumulative
Increment
EmailMarketingStatisticsforResidentialRealEstateAgents
©2011‐2013HomeActions,LLC.AllRightsReserved. 5of20 www.homeactions.net
NeedSales?UseOure‐ProspectingSolution!
(WhatisanOpenRate?SeeDefinitions&Tips.)
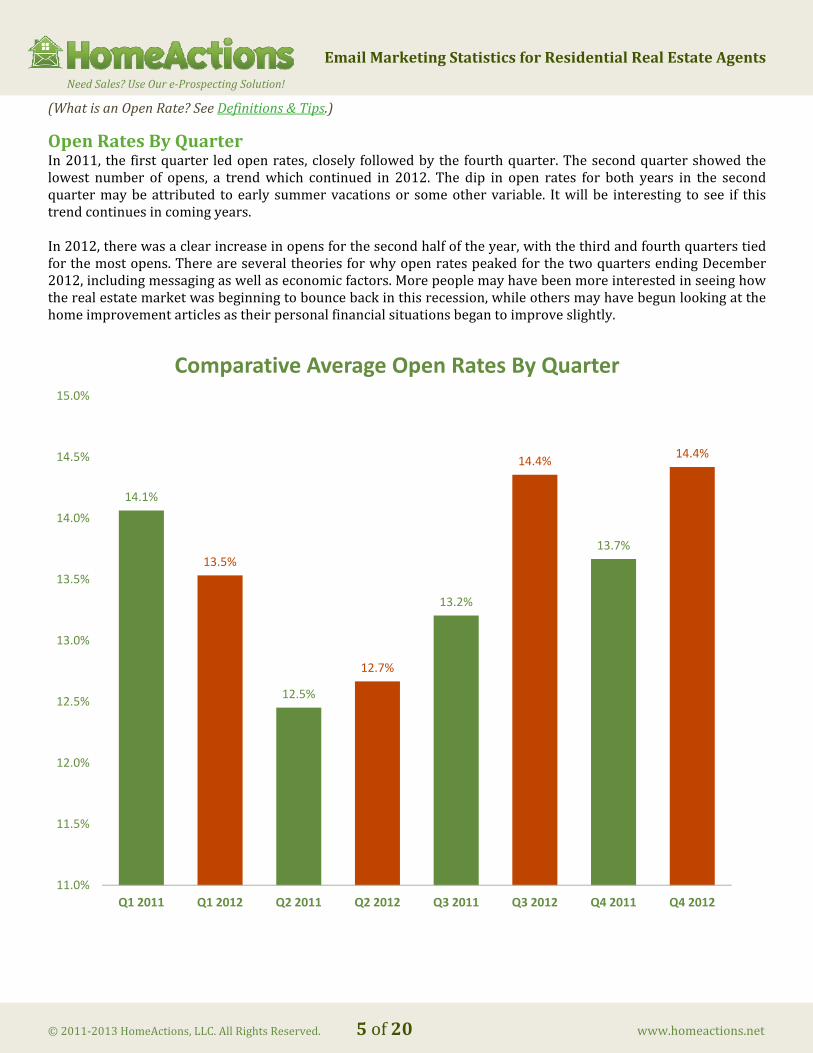
OpenRatesByQuarterIn2011, the firstquarter ledopenrates,closely followedby the fourthquarter.Thesecondquartershowedthelowest number of opens, a trendwhich continued in 2012. The dip in open rates for both years in the secondquartermaybeattributed toearly summervacationsor someothervariable. Itwillbe interesting to see if thistrendcontinuesincomingyears.In2012,therewasaclearincreaseinopensforthesecondhalfoftheyear,withthethirdandfourthquarterstiedforthemostopens.ThereareseveraltheoriesforwhyopenratespeakedforthetwoquartersendingDecember2012,includingmessagingaswellaseconomicfactors.Morepeoplemayhavebeenmoreinterestedinseeinghowtherealestatemarketwasbeginningtobouncebackinthisrecession,whileothersmayhavebegunlookingatthehomeimprovementarticlesastheirpersonalfinancialsituationsbegantoimproveslightly.
14.1%
13.5%
12.5%
12.7%
13.2%
14.4%
13.7%
14.4%
11.0%
11.5%
12.0%
12.5%
13.0%
13.5%
14.0%
14.5%
15.0%
Q1 2011 Q1 2012 Q2 2011 Q2 2012 Q3 2011 Q3 2012 Q4 2011 Q4 2012
Comparative Average Open Rates By Quarter

EmailMarketingStatisticsforResidentialRealEstateAgents
©2011‐2013HomeActions,LLC.AllRightsReserved. 6of20 www.homeactions.net
NeedSales?UseOure‐ProspectingSolution!
OpenRatesByRegionThefollowingchartshowstheaveragepercentageofemailnewslettersopenedfortheyearsendingDecember31,2011andDecember31,2012ineachofthefourregionsidentified.Theredoesnotappeartobeasignificantamountofdifferenceinopenratesthroughoutthecountry.Whileinotherindustries, the region being marketed to might have a more significant impact on open rates, for real estateprofessionalemailmarketing,thetrendsappearfairlyconsistentregardlessofgeographiclocation.The Northeast Region showed the highest percentage of opens overall, with an average of 14.2% in 2011 and15.3%in2012.TheSouthRegionhadthesecondhighestaverages,with13.6%in2011and13.8%in2012.TheMidwestRegionhadthelowestrateofopens,with11.8%and11.4%in2011and2012,respectively.TheMidwestRegionwasalsotheonlygeographicareatargetedthatshowedadecreaseinopenratesfrom2011to2012.ItisunclearastowhytheopenratesarelowestintheMidwestRegionorwhytheopenratesdecreasedoverthepast twoyears(howeverslightly)whenallotherregionsshowedan increase inopenratesduringthesameperiod.
(Howareregionsdefined?SeeDefinitions&Tips.)
14.2%
15.3%
13.6% 13.8%
11.8%11.4%
12.8% 13.1%
0.0%
2.0%
4.0%
6.0%
8.0%
10.0%
12.0%
14.0%
16.0%
18.0%
2011 2012 2011 2012 2011 2012 2011 2012
Northeast South Midwest West
Comparative Average Open Rates By Region

EmailMarketingStatisticsforResidentialRealEstateAgents
©2011‐2013HomeActions,LLC.AllRightsReserved. 7of20 www.homeactions.net
NeedSales?UseOure‐ProspectingSolution!
OpenRatesByListSizeOpenrates,whenanalyzedbylistsize,showasurprisingtrend:openratesappeartobelowerforlargerlists.Thisstatisticisanomalouswithotheremailmarketingtrendsfoundinotherindustries.Thereasonfortheloweropenrates for larger lists isunknown, thoughhypothetically, it couldbedue to a largernumberof recipientshavingtheirimagesturnedoffintheirrespectiveemailprograms,havingbeenonthedistributionlistforalongerperiodoftimeorreviewingthenewslettersontheirmobiledevices.The chart below confirms that open rates ranged between 10.9% and 18.5% in 2011 and between 10.9% and22.9%in2012basedonlistsize.
(HowisListSizedefined?SeeDefinitions&Tips.)
18.5%
22.9%
18.0%
19.3%
10.9% 10.9%
0.0%
5.0%
10.0%
15.0%
20.0%
25.0%
2011 2012 2011 2012 2011 2012
Less than 200 200‐499 499 and Over
Comparative Average Open Rates By List Size

EmailMarketingStatisticsforResidentialRealEstateAgents
©2011‐2013HomeActions,LLC.AllRightsReserved. 8of20 www.homeactions.net
NeedSales?UseOure‐ProspectingSolution!
CLICK THROUGH RATES
ClickThroughRateIntroductionThe purpose of click‐through rates is to capture recipients' interest in content included in an email or emailnewslettercampaign. It isnearly impossibleto fullyquantify theemotionalreactiontoanemailnewsletter.Onepieceofinformationthatiseasytoacquire,however,istheclick‐throughrate.Theclick‐throughratemeasurestheproportion of recipientswho initiated action by clicking on a piece of content to readmore about a particularsubject.Mostemailmarketersusethismetricsalongwithopenratesandothermetricstounderstandtheeffectivenessandsuccessoftheiremailcampaigns.Ingeneral,thereisnoidealclick‐throughrate.Thismetriccanvarybasedonthetypeofemailsent,howfrequentlyemailsaresent,howthelistofrecipientsissegmented,howrelevantthecontentoftheemailistotheaudience,andmanyotherfactors.Email newsletter click activity represents the interest the recipient has in the content or the sender and theperceivedvalueoftheinformationdelivered.Thetotalclickthroughactivityfor2011and2012isshownbelow.Whilethenumberofactualclicksroseoverthetwo‐year period, the percentage of click throughs dropped by 0.2%. This increase in engagement but loss inpercentagemay be attributed to the addition of new subscribers to listswho interactedmorewith newslettercontent than thosewhohavebeenreceivingmessages fora longer lengthof time,economicconditionsorotherexternalfactors,ormaypointtoaneedtoexamineeachcampaign’scontentandmakeadjustmentsbasedonthespecifictypesofcontentthatchangedduringtheperiodsanalyzed,reviewwhathadhigherclickthroughratesin2011thanin2012andwhetheritwascontinuedin2012orreplacedwithotherkindsofcontent,aswellaswhatkindsofcontentgeneratedthehighestclickthroughratesoverallandincorporatemoreofthatkindofcontentinfuturenewsletters.
(HowareClickThroughRatescalculated?SeeDefinitions&Tips.)
60,082
73,291
‐
10,000
20,000
30,000
40,000
50,000
60,000
70,000
80,000
2011 2012
Total Clicks
EmailMarketingStatisticsforResidentialRealEstateAgents
©2011‐2013HomeActions,LLC.AllRightsReserved. 9of20 www.homeactions.net
NeedSales?UseOure‐ProspectingSolution!
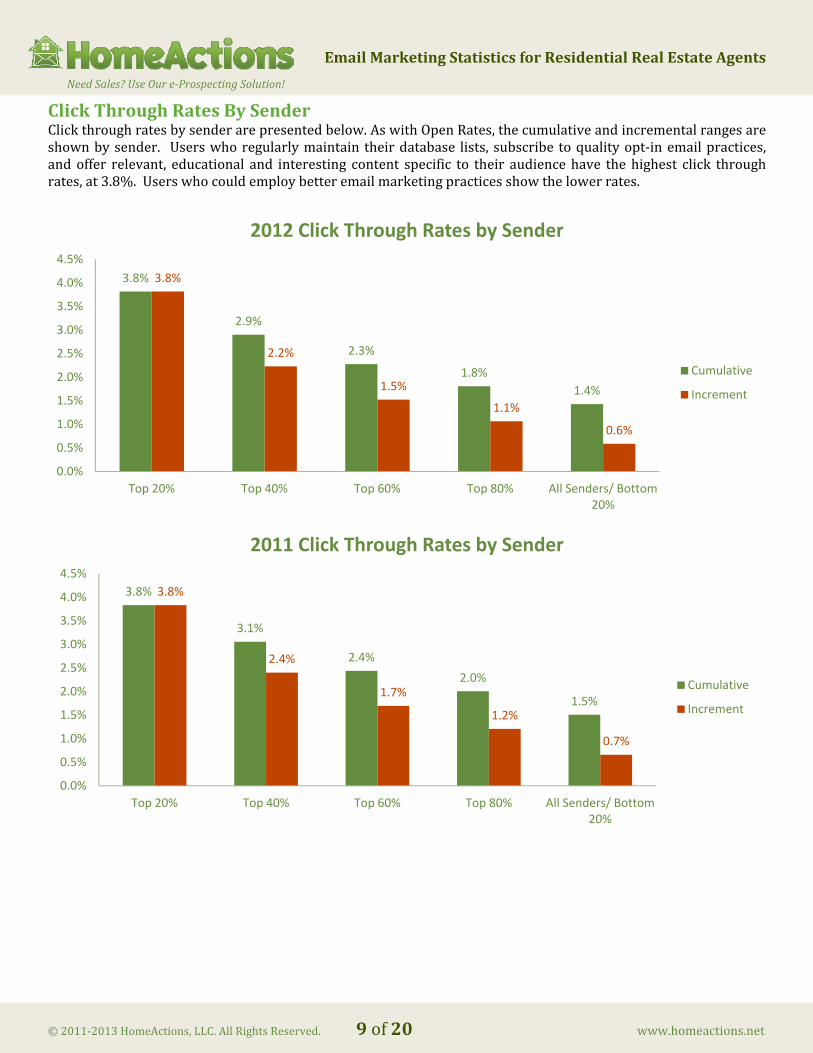
ClickThroughRatesBySenderClickthroughratesbysenderarepresentedbelow.AswithOpenRates,thecumulativeandincrementalrangesareshownbysender. Userswhoregularlymaintain theirdatabase lists, subscribe toqualityopt‐inemailpractices,andoffer relevant, educational and interesting content specific to their audiencehave thehighest click throughrates,at3.8%.Userswhocouldemploybetteremailmarketingpracticesshowthelowerrates.
3.8%
2.9%
2.3%
1.8%
1.4%
3.8%
2.2%
1.5%
1.1%
0.6%
0.0%
0.5%
1.0%
1.5%
2.0%
2.5%
3.0%
3.5%
4.0%
4.5%
Top 20% Top 40% Top 60% Top 80% All Senders/ Bottom 20%
2012 Click Through Rates by Sender
Cumulative
Increment
3.8%
3.1%
2.4%
2.0%
1.5%
3.8%
2.4%
1.7%
1.2%
0.7%
0.0%
0.5%
1.0%
1.5%
2.0%
2.5%
3.0%
3.5%
4.0%
4.5%
Top 20% Top 40% Top 60% Top 80% All Senders/ Bottom 20%
2011 Click Through Rates by Sender
Cumulative
Increment
Opens

EmailMarketingStatisticsforResidentialRealEstateAgents
©2011‐2013HomeActions,LLC.AllRightsReserved. 10of20 www.homeactions.net
NeedSales?UseOure‐ProspectingSolution!
ClickThroughRatesByRegionClick through rates by region are presented below. The regions are based on the location of the real estatebrokerage office that the agent is affiliated with. As with Open Rates, click through rates appear to be fairlyconsistentregardlessofregion,withtheMidwestregiondemonstratingthelowestpercentagesoverall.
Totalclickactivitybyregionisshownbelow.Allregionsdemonstratedanincreaseintotalclickactivityfrom2011to2012,withtheSouthregionshowingthelargestincreaseoverall.
1.5%1.5%
1.7%
1.4%1.5%
1.2% 1.2%1.1%
0.0%
0.2%
0.4%
0.6%
0.8%
1.0%
1.2%
1.4%
1.6%
1.8%
2011 2012 2011 2012 2011 2012 2011 2012
Northeast South Midwest West
Average Click Through Rates By Region
11,472
19,294
29,661
36,533
6,270 5,938
12,655 11,465
‐
5,000
10,000
15,000
20,000
25,000
30,000
35,000
40,000
2011 2012 2011 2012 2011 2012 2011 2012
Northeast South Midwest West
Total Clicks By Region

EmailMarketingStatisticsforResidentialRealEstateAgents
©2011‐2013HomeActions,LLC.AllRightsReserved. 11of20 www.homeactions.net
NeedSales?UseOure‐ProspectingSolution!
ClickThroughRatesByListSizeContinuing the trend shown in the OpenRates, the largest lists showed the lowest percentage of click throughactivity.Thesmallestlistsjumpedup.4%between2011and2012,perhapsduetoalargernumberofsmalllistslaunchingin2012thananyotherlistsize.
Total click through rates by list size are shown below. An overall increase in engagement was demonstratedbetween2011and2012,withthetotalnumberofclicksincreasingforthelargestlists(presumablybecausethereweremorerecipientsintotal).
12,526 14,420 14,324
20,590
33,232
38,281
‐
5,000
10,000
15,000
20,000
25,000
30,000
35,000
40,000
45,000
2011 2012 2011 2012 2011 2012
Less than 200 200‐499 499 and Over
Total Clicks By List Size
2.0%
2.4%
2.0%1.9%
1.2%
1.0%
0.0%
0.5%
1.0%
1.5%
2.0%
2.5%
3.0%
2011 2012 2011 2012 2011 2012
Less than 200 200‐499 499 and Over
Average Click Through Rates By List Size

EmailMarketingStatisticsforResidentialRealEstateAgents
©2011‐2013HomeActions,LLC.AllRightsReserved. 12of20 www.homeactions.net
NeedSales?UseOure‐ProspectingSolution!
DAILY SEND RATES
EmailsSentByDayoftheWeekThetimingofemailmarketinglaunches,includingthedayoftheweekandtimeofday,mayaffectclickactivityandopen rates. Our clients select their launch schedules with input from our Customer Support Representatives.Frequencyoflaunchesaswellascontentrelevancetoeachrecipientmayalsoimpactclickactivityandopenrates.HomeActionstypicallyrecommendssendingemailnewsletterseithermonthlyorbi‐weekly..Weexaminedourrealestateprofessionals’sendinghabitsbythedayoftheweekinthegraphsshowninthissection.In2012,thetrendshiftedfromWednesdaytoThursdayasthepreferredlaunchday,withanoverallincreaseof2%launchingonThursdaysandadropofapproximately4%forthoselaunchingonWednesdaysfrom2011to2012.Fridaysweretheleastcommonlaunchdayforourrealestateprofessionalsinboth2011and2012andshowedanadditionaldecreaseofhalfapercentfrom2011to2012.
17.60%
16.30%
26.00%
24.41%
15.68%
19.27%
17.34%
21.90%
26.42%
15.07%
0.00%
5.00%
10.00%
15.00%
20.00%
25.00%
30.00%
Monday Tuesday Wednesday Thursday Friday
Comparative Total Daily Send Rates
2011 2012

EmailMarketingStatisticsforResidentialRealEstateAgents
©2011‐2013HomeActions,LLC.AllRightsReserved. 13of20 www.homeactions.net
NeedSales?UseOure‐ProspectingSolution!
DailySendRatesByRegionDepending on the marketing campaign and industry, different regions of the country may exhibit differentpreferencesforday‐of‐weekemaildelivery.Forrealestateprofessionals,thetrendsin2012showedslightlymoreconsistentdeliverydaysthroughouttheweek.TheNortheastandMidwestregionsshowednoclearpreferencefora particular day, other than lower send rates on Fridays. The South region demonstrated a preference forWednesdayandThursdaylaunches,withMondaylaunchestheleastcommon.TheWestregionshowedpreferencefor Monday and Thursday launches, with Tuesday being the least common launch day, followed closely byWednesday.
In 2011, the delivery dayswere slightlymore erratic, with theMidwest region showing a clear preference forWednesdaylaunches.TheNortheastregionlaunchedfairlyconsistentlythroughouttheweekin2011,asdidtheSouthregion.TheWestregiondemonstratedapreferenceforMondayandThursdaylaunchesin2011.
22.5% 22.0% 22.4% 23.4%
9.7%11.2%
17.9%
26.1% 26.0%
18.7%
24.2%22.0%
23.4%
18.6%
11.8%
33.2%
8.0%9.8%
34.8%
14.1%
0.0%
5.0%
10.0%
15.0%
20.0%
25.0%
30.0%
35.0%
40.0%
Monday Tuesday Wednesday Thursday Friday
Daily Send Rates By Region12 months ending 12/31/12
Northeast South Midwest West
17.2%
25.1%
16.0%
27.1%
14.6%
9.6%
17.4%
30.2%
20.9% 21.9%
11.1%
21.6%
47.0%
15.4%
4.9%
33.6%
6.2%
19.1%
31.4%
9.6%
0.0%
10.0%
20.0%
30.0%
40.0%
50.0%
Monday Tuesday Wednesday Thursday Friday
Daily Send Rates By Region12 months ending 12/31/11
Northeast South Midwest West
EmailMarketingStatisticsforResidentialRealEstateAgents
©2011‐2013HomeActions,LLC.AllRightsReserved. 14of20 www.homeactions.net
NeedSales?UseOure‐ProspectingSolution!
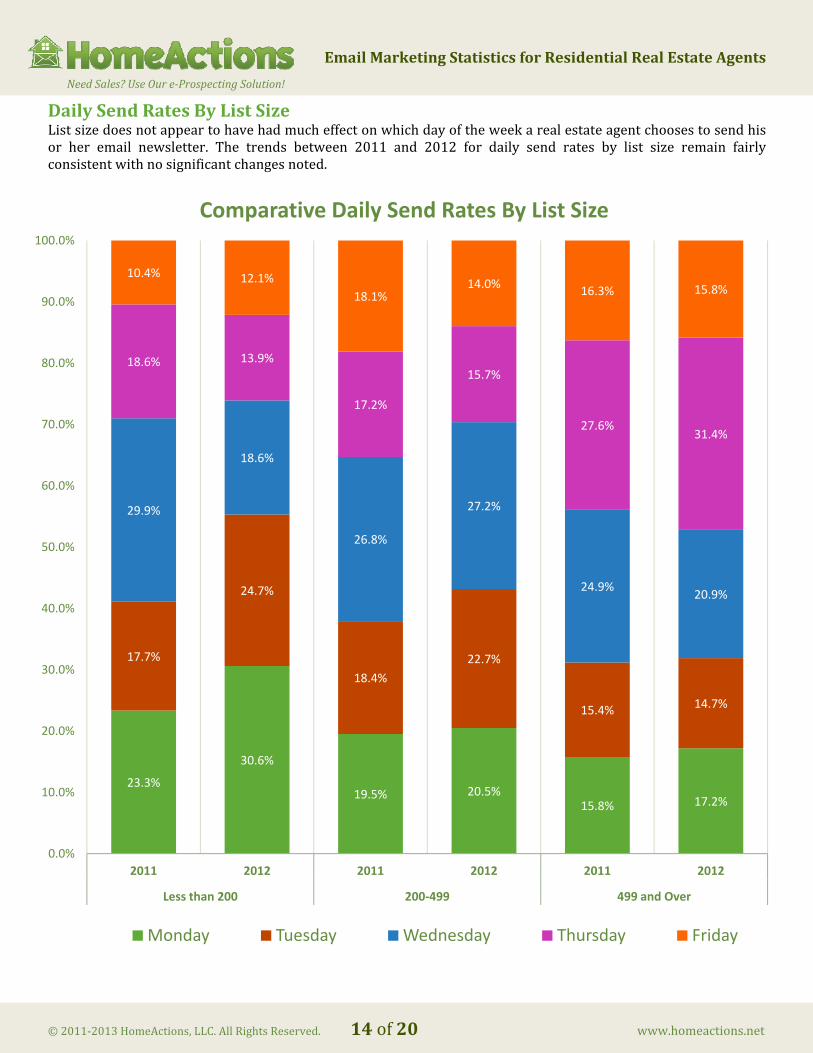
DailySendRatesByListSizeListsizedoesnotappeartohavehadmucheffectonwhichdayoftheweekarealestateagentchoosestosendhisor her email newsletter. The trends between 2011 and 2012 for daily send rates by list size remain fairlyconsistentwithnosignificantchangesnoted.
23.3%
30.6%
19.5% 20.5%15.8% 17.2%
17.7%
24.7%
18.4%
22.7%
15.4% 14.7%
29.9%
18.6%
26.8%
27.2%
24.9%20.9%
18.6% 13.9%
17.2%
15.7%
27.6%31.4%
10.4% 12.1%
18.1%14.0%
16.3% 15.8%
0.0%
10.0%
20.0%
30.0%
40.0%
50.0%
60.0%
70.0%
80.0%
90.0%
100.0%
2011 2012 2011 2012 2011 2012
Less than 200 200‐499 499 and Over
Comparative Daily Send Rates By List Size
Monday Tuesday Wednesday Thursday Friday

EmailMarketingStatisticsforResidentialRealEstateAgents
©2011‐2013HomeActions,LLC.AllRightsReserved. 15of20 www.homeactions.net
NeedSales?UseOure‐ProspectingSolution!
UNSUBSCRIBE RATES
UnsubscribeRatesIntroductionAnemailunsubscriberateisoneofthemetricsusedbyemailmarketerstoidentifytheeffectivenessofacampaign.Thehighertheunsubscriberate,themorelikelythatchangesneedtobemadetothecontent,deliverydayortime,listrelevanceorothercomponentsofacampaign.Theunsubscriberateshowshowmanypeoplerequestedtoberemovedfromanemailcampaign.Theunsubscribe rate varies significantlybyorganization and issue, aswell as over time. For instance, expect atemporary increase in the unsubscribe rate after adding a batch of new email addresses to your campaign’sdistributionlist.Unsubscriberatesmayalsofluctuatedramaticallyovertimeifyourlistissmall.The total unsubscribe rate in 2012 averaged approximately 8% for all HomeActions clients. Note that thisinformationwascollectedfor2012onlyandthereforecannotbeshownincomparativeformat.
(HowistheUnsubscribeRatecalculated?SeeDefinitions&Tips.)
413,233
32,341
‐
50,000
100,000
150,000
200,000
250,000
300,000
350,000
400,000
450,000
total members unsubscribes
Total Members Versus Total Unsubscribes in 2012

EmailMarketingStatisticsforResidentialRealEstateAgents
©2011‐2013HomeActions,LLC.AllRightsReserved. 16of20 www.homeactions.net
NeedSales?UseOure‐ProspectingSolution!
UnsubscribeRatesByRegionThefollowingchartshowsthepercentageofunsubscriberequestsbyregionin2012.TheMidwesthadthelargestpercentageofopt‐outs,whiletheotherthreeregionsweremoderatelysimilar,eachstayingwithinthe5‐8%range.
UnsubscribeRatesByListSizeNot surprisingly, the largest lists also had the largest unsubscribe requests. This is likely due to larger listscontainingfewerpersonally‐knowncontactsandmore“marketing”prospects.
5.7%
7.8%
16.7%
6.9%
0.0%
2.0%
4.0%
6.0%
8.0%
10.0%
12.0%
14.0%
16.0%
18.0%
Northeast South Midwest West
Unsubscribe Rates by Region
6.8%7.2%
8.1%
0.0%
1.0%
2.0%
3.0%
4.0%
5.0%
6.0%
7.0%
8.0%
9.0%
Less than 200 200‐499 499 and Over
Unsubscribe Rates by List Size

EmailMarketingStatisticsforResidentialRealEstateAgents
©2011‐2013HomeActions,LLC.AllRightsReserved. 17of20 www.homeactions.net
NeedSales?UseOure‐ProspectingSolution!
DEFINITIONS & TIPS
ClickThroughRate(CTR)An email click through rate isdefinedas thenumberof recipientswho clickedoneormore links inan emailandlanded on the sender's article, landing page,website, blog, or other desired destination.More simply, email click‐throughratesrepresentthenumberofclicksthatanemailgenerated.Theemailclick‐throughrate is typicallyexpressedasapercentage,andcalculatedbydividing thenumberofclickthroughsbythenumberofmessagesdelivered.Theclicksshowninthisreportareuniqueclicks,meaningthatnoparticularindividual’smultipleclickshaveaffectedthedata.Anindividualisidentifiedbyauniqueemailaddress.Clickactivityrateshavebeencalculatedbydividingthenumberofuniqueclicksinanemailmessagebythetotalnumberofrecipients.Additionally,teammembers(databasemembersthathavebeencategorizedasthesender’semployees)havebeenexcludedfromthestatistics.Inthisreport,clickactivityrateshavebeencalculatedbydividingthenumberofuniqueclicksinanemailmessagebythetotalnumberofrecipients.TipsToImproveYourClickThroughRate:
Makecontentanddescriptionscompelling.Providerecipientssomethingtheyreallywanttoclicktosee,andadescriptionthatmakesitclearwhytheyshould.Ensurethesubjectlinepreparesthereaderforthecontent.Generally,readersaremorelikelytoclickthroughwhentheirexperienceisconsistent.Ifthesubjectlinematchestheemailcontent,they'llseewhattheyexpectwhentheyopentheemail,andbemorelikelytotakeaction.Changeyourformat.Theformatofanemail,particularlyanemailnewsletter,canhaveadramaticeffectonyourCTR.TheAdjustedCTRcanbeparticularlyusefulinaccuratelyhominginonwhat’sworkingandwhat’snot.Highlightwhatyouwantreaderstoclickon.Acalloutbox—generallyanoutlinedorcoloredboxwithalinkand a simple call to action—can increase Click‐Through Rates, as can buttons and relevant images. Alsoconsiderahotspot—ahyperlinkedtext‐basedcalltoactionlocatedattheverytopofyouremail,aboveeventheheaderoranyotherhtml.Thisensuresthatreaderswillseeyourmessageeveniftheyhaveimage‐viewingdisabledintheiremailbrowsers.
ListSizeForthepurposesofthisreport,thelistsizeequalsthetotalnumberofuniqueactiveemailaddressesinanaccount’sdatabase,includingTeamMembers(employees),Clients,ProspectsandReferralSources.Unsubscribedandbademailaddressesarenotincludedinlistsizedata.OpenRatesTheemailopenrateisameasureprimarilyusedbymarketersasanindicationofhowmanypeople"view"or"open"the commercial electronicmail they send out. It ismost commonly expressed as a percentage and calculated bydividing the number of emailmessages opened by the total number of emailmessages sent (excluding bouncedemails).Openratesaretypicallytrackedusingatransparent1x1pixel,orsmalltransparenttrackingimage,thatisembeddedinoutgoingemails.Whentheemailprogramorbrowserusedtodisplaytheemailrequeststhatimage,thenan"open"

EmailMarketingStatisticsforResidentialRealEstateAgents
©2011‐2013HomeActions,LLC.AllRightsReserved. 18of20 www.homeactions.net
NeedSales?UseOure‐ProspectingSolution!
is recorded for that email by the image's host server. The emailwill not be counted as an open until one of thefollowingoccurs:
1)Therecipientenablestheimagesintheemailor2)Therecipientinteractswiththeemailbyclickingonalink
Theopenrateofanygivenemailcanvarybasedonanumberofvariables.Forexample,thetypeofindustrytheemailisbeingsentto.Inaddition,thedayandtimeanemailisscheduledorsenttorecipientscanhaveaneffectonemailopenrate.Thelengthofanemail'ssubjectlinecanalsoaffectwhetherornotitisopened.Good open rates traditionally range between 15 and 25 percent. However, open rates are declining across allorganizations as a result of changes in how email clients are handling images. Because more and more emailprogramsdefaulttoblockingallimages,orshowingonlyplaintext,peoplecanopentheemailwithouttheemailbeingtrackedashavingbeenopened.ThismeansthattheOpenRateisaquestionablemetricatbest.Itcanstillbeausefulwaytocomparethesuccessofonesubjectlinetoanother,butshouldn'tbeconsideredameasureofwho'sactuallyseenyouremail.TipsToImproveYourOpenRate:
CreatemorecompellingFromandSubject lines.This seemscommonsense,but it’snotalwaysclearwhat itactuallymeansinpractice.Thinkaboutwhatsubjectlinesmakeyouopenanemailinyourowninbox—goodrulesofthumbincludeaskingaquestion,keepingsubjectlinesundersixwordsandusinglowercaseinallbutthefirstwordandpropernouns.Testyoursubjectlines.Thereareseveralwaystodothis.Ifyouhavemorethan10,000orsopeopleonyourlist,createtwoseparateemailswiththesamebodyinformationbutdifferentsubject lines,andsendeachtohalfyourlist.MeasuretheOpenRateforbothemails,andseewhichonedidbetter.Asyoudothisanumberoftimes,you’llstarttodevelopabettersenseofwhatworkswellforyourparticularaudience.Or,ifyouhaveavery large list—hundredsofthousandsofpeopleormore—youcaneventesttwosubject linesonasmallerpercentageofyourlist,picktheonewiththehigheropenrateandsendittotheremainderofyourlist.(ThistypeoftestingiscalledA/Btesting,asyou’remeasuringtheperformanceofemailAagainstemailB.)
RegionsForthepurposesofthisreport,regionsarecomprisedofthefollowingstates:
MidwestRegionTheMidwestregionincludesIL,IN,IA,KS,MI,MN,MO,NE,ND,OH,SDandWI.NortheastRegionTheNortheastregionincludesCT,ME,MA,NH,NJ,NY,PA,RIandVT.SouthRegionTheSouthregionincludesAL,AR,DE,DC,FL,GA,KY,LA,MD,MS,NC,SC,TN,VAandWV.WestRegionTheWestregionincludesAK,AZ,CA,CO,HI,ID,MT,NV,NM,OK,OR,TX,UT,WAandWY.

EmailMarketingStatisticsforResidentialRealEstateAgents
©2011‐2013HomeActions,LLC.AllRightsReserved. 19of20 www.homeactions.net
NeedSales?UseOure‐ProspectingSolution!
UnsubscribeRateThisisthenumberofindividualswhounsubscribefromyourlistinresponsetoeachmailingsent.UnsubscribeRate=unsubscribes/# ofmessages delivered.Use theUnsubscribeRate tomeasure howwell you hold your subscribers’interestover the longrun. If subscribersdonot likewhatyou’re saying,don’t find it interestingor feel thatyou'resendingthemtoomanyemails,they’lltellyoubychoosingtoleaveyouremaillist.Ingeneral,yourUnsubscribeRateshouldbelow;certainlylowerthanyourclickthroughrate.TipsToReduceYourUnsubscribeRate:
Providemorevalue.Areyousendingemailsthatareviewedasusefulbythosethatreceivethemratherthanfocusedsolelyonyourownneeds?Reduce your volumeof email. If you're sendingemailsmore than every coupleofweeksand seeingahighUnsubscribeRate,youmightwanttoconsiderdecreasingthevolume.However,weighyourResponseRateaswell—ifyouremailsaregettingagoodresponsefromacommittedbaseofsupporters,maybeit'sjustaswelltoletthosewhoarelessinterestedunsubscribe,ortotrytodecreasethevolumeofemailsonlyforthosewhoaren'tasactive.Allowunsubscribesbytype.Providerecipientswithanopportunitytounsubscribe fromaparticulartypeofemail communication instead of broadly opting out of all email communications. A subscriber mightappreciateyoure‐newsletter,butbeputoffbyfundraisingappeals.

EmailMarketingStatisticsforResidentialRealEstateAgents
©2011‐2013HomeActions,LLC.AllRightsReserved. 20of20 www.homeactions.net
NeedSales?UseOure‐ProspectingSolution!
ABOUT HOMEACTIONS
WhoWeAreHomeActionsisaleadingproviderofrealestateemailnewsletters,deliveringproven solutions needed to build business.With a culmination of years ofexperience, immersionintherealestate industryandenhancedtechnology,HomeActionsdeliversthemosteffectivewayforrealestateprofessionalstofosterrelationships.Didyouknowthatamere6%of realestateprofessionalshaveany typeof"stay in touch" service, andmanyof these are once amonth, cookie‐cutteremail newsletters that focus solely on buying and selling. AtHomeActions,weknowthatthisisnotthekindofcontentthattoday'shomeownersneedorwant.Inresponse,webuiltthefirstemailnewsletterprogramforrealestateprofessionals more than ten years ago. The HomeActions program is theculmination of years of experience, immersion in the real estate industry,enhanced technology and development of the most effective way for realestateprofessionalstocultivaterelationships.OurMissionAtHomeActions, our objective is to help real estate professionals stay connected.We're committed to building,nurturingandretainingrelationshipsthatmatter.Westrivetohelpbuildbusinessbysupplyingsuperiorcustomerserviceanduniquecontent.Weaccomplishthismissionbyprovidinganaccessible,automated,androbuste‐marketingplatformthatincludesonly themostrelevantand informativecontent, isbrandedspecifically to theagent, realtororprofessionalwhosponsorsit,andcomeswithworld‐classtechnologyandclientsupportbuiltin.Providingaservicethatformerclients,friends,familyandprospectscan'tgetanywhereelseaddsrealvaluetoarelationship.TheendresultofparticipationwithHomeActions isgreatertop‐of‐mindawareness.Yourmemberswillthankyouforhelpingthemmanagetheirbiggestsocialandeconomicinvestment,theirhome.LearnmoreaboutHomeActionsbyvisitingusonlineorcall(240)408‐4002.
Top Related