


Languages
Pages
Legal


A C I L A L L E N C O N S U L T I N G
A REPORT TO
THE AUSTRALIAN ENERGY REGULATOR
MARCH 2015
ELECTRICITY BILL BENCHMARKS
FOR RESIDENTIAL CUSTOMERS

For further infromation contact:
Jeremy Tustin
Principal
Ph: (03) 8650 6000
ACIL ALLEN CONSULTING PTY LTD
ABN 68 102 652 148
LEVEL FIFTEEN
127 CREEK STREET
BRISBANE QLD 4000
AUSTRALIA
T+61 7 3009 8700
F+61 7 3009 8799
LEVEL TWO
33 AINSLIE PLACE
CANBERRA ACT 2600
AUSTRALIA
T+61 2 6103 8200
F+61 2 6103 8233
LEVEL NINE
60 COLLINS STREET
MELBOURNE VIC 3000
AUSTRALIA
T+61 3 8650 6000
F+61 3 9654 6363
LEVEL ONE
50 PITT STREET
SYDNEY NSW 2000
AUSTRALIA
T+61 2 8272 5100
F+61 2 9247 2455
SUITE C2 CENTA BUILDING
118 RAILWAY STREET
WEST PERTH WA 6005
AUSTRALIA
T+61 8 9449 9600
F+61 8 9322 3955
ACILALLEN.COM.AU
RELIANCE AND DISCLAIMER
THE PROFESSIONAL ANALYSIS AND ADVICE IN THIS REPORT HAS BEEN PREPARED BY ACIL ALLEN CONSULTING FOR THE EXCLUSIVE USE OF THE PARTY OR PARTIES TO WHOM IT IS ADDRESSED (THE ADDRESSEE) AND FOR THE PURPOSES SPECIFIED IN IT. THIS REPORT IS SUPPLIED IN GOOD FAITH AND REFLECTS THE KNOWLEDGE, EX PERTISE AND EX PERIENCE OF THE CONSULTANTS INVOLVED. THE REPORT MUST NOT BE PUBLISHED, QUOTED OR DISSEMINATED TO ANY OTHER PARTY WITHOUT ACIL ALLEN CONSULTING’S PRIOR WRITTEN CONSENT. ACIL ALLEN CONSULTING ACCEPTS NO RESPONSIBILITY WHATSOEVER FOR ANY LOSS OCCASIONED BY ANY PERSON ACTING OR REFRAINING FROM ACTION AS A RESULT OF RELIANCE ON THE REPORT, OTHER THAN THE ADDRESSEE.
IN CONDUCTING THE ANALYSIS IN THIS REPORT ACIL ALLEN CONSULTING HAS ENDEAVOURED TO USE WHAT IT CONSIDERS IS THE BEST INFORMATION AVAILABLE AT THE DATE OF PUBLICATION, INCLUDING INFORMATION SUPPLIED BY THE ADDRESSEE. UNLESS STATED OTHERWISE, ACIL ALLEN CONSULTING DOES NOT WARRANT THE ACCURACY OF ANY FORECAST OR PROJECTION IN THE REPORT. ALTHOUGH ACIL ALLEN CONSULTING EXERCISES REASONABLE CARE WHEN MAKING FORECASTS OR PROJECTIONS, FACTORS IN THE PROCESS, SUCH AS FUTURE MARKET BEHAVIOUR, ARE INHERENTLY UNCERTAIN AND CANNOT BE FORECAST OR PROJECTED RELIABLY.
ACIL ALLEN CONSULTING SHALL NOT BE LIABLE IN RESPECT OF ANY CLAIM ARISING OUT OF THE FAILURE OF A CLIENT INVESTMENT TO PERFORM TO THE ADVANTAGE OF THE CLIENT OR TO THE ADVANTAGE OF THE CLIENT TO THE DEGREE SUGGESTED OR ASSUMED IN ANY ADVICE OR FORECAST GIVEN BY ACIL ALLEN CONSULTING.
© ACIL ALLEN CONSULTING 2014
A C I L A L L E N C O N S U L T I N G
ELECTRICITY BILL BENCHMARKS FOR RESIDENTIAL CUSTOMERS ii
Version History
Version Date Author Description
1.0 09 October 2014 Jeremy Tustin Initial release
1.1 20 March 2015 Alex Rose Reassignment of Victorian postcodes in Climate Zone 4 owing to insufficient sample size

A C I L A L L E N C O N S U L T I N G
ELECTRICITY BILL BENCHMARKS FOR RESIDENTIAL CUSTOMERS iii
Executive Summary
It is widely accepted that some retail customers often use more electricity than is necessary
to achieve a desired standard of living, and are not as energy efficient as they could be. A
significant amount of attention has been given over the years, to the so called ‘energy
efficiency gap’ or the difference between actual energy efficiency and the level thought to be
achievable and affordable.1 As time passes, the level of energy efficiency that could
technically be achieved increases, but the gap remains.
One possible reason for the gap is that if customers do not know what is possible, they will
find it more difficult to improve their energy efficiency.
Australian Governments have taken various steps to improve energy efficiency in Australia.
One such step was the requirement that electricity bill benchmark information should be
displayed on electricity bills. Under section 169 of the National Energy Retail Rules (NERR),
the benchmarks must be based on:
1. electricity consumption data provided to the Australian Energy Regulator (AER) by
electricity distributors
2. localised zones as determined by Energy Ministers
3. the number of persons living in a dwelling (household size).
The AER is required to make the benchmarks available on a website, and is using the
Energy Made Easy website for this purpose. It is also required to provide them to electricity
retailers, who must publish them on bills.
Under the NERR, the AER must update the electricity benchmarks every three years. ACIL
Allen developed the first set of benchmarks in 2011 and has now been engaged to update
them.2
The bill benchmarks are not tailored to individual householders and the characteristics of
their dwelling. This would be impractical on energy bills. To provide this information, the bill
benchmarks will be accompanied by a web based tool on the AER’s Energy Made Easy
website. The analysis underpinning that tool is presented in this report as well.
ACIL Allen estimated the benchmarks based on a sample of Australian electricity customers
from all jurisdictions. Those customers answered a series of questions about their homes
and the way they use electricity. Those answers were used as explanatory variables in the
benchmark and website models.
The customers sampled also gave consent for their electricity distributor to release their
consumption data for analysis. Those data were used as the dependent (explained) variable
in the models.
More than 4,000 Australian households participated in the benchmarking project as shown
in Table ES1. As the table shows, the vast majority of those customers were matched to
their consumption data.
1 See, for example, Productivity Commission, “Productivity Commission Inquiry Report no 36, The Cost Effectiveness of Improving Energy Efficiency”, 2005, p. XXIV
2 ACIL Allen (then ACIL Tasman), “Electricity bill benchmarks for residential customers”, December 2011, available from http://www.aer.gov.au/node/9751

A C I L A L L E N C O N S U L T I N G
ELECTRICITY BILL BENCHMARKS FOR RESIDENTIAL CUSTOMERS iv
Table ES1 Sample sizes for household survey and consumption data
matching
State Sample target Unmatched
sample
Matched
sample
‘mismatch’ (%)
New South Wales 1,000 1,016 851 16%
Victoria 1,000 1,026 685 33%
Queensland 1,000 1,007 901 11%
South Australia 500 511 463 9%
Tasmania 250 246 218 11%
Australian Capital Territory 250 189 145 23%
Northern Territory 250 47 39 17%
Total 4,250 4,042 3,302 18%
Source: ACIL Allen Consulting
The electricity consumption of the matched sample is shown in Figure ES 1. The seasonal
pattern shown in that figure is consistent with expectations. The data also suggest that
residential consumption has declined in Australia since 2011. The average electricity use of
the households who participated in the project in 2014 was 12.5 per cent less than those
who participated in 2011.
Figure ES 1 Seasonal patterns in consumption
Source: ACIL Allen Consulting
The project has produced two results.
The first result is a set of benchmark models for each state. These are relatively simple
models that are intended to be used to produce the benchmarks that retailers will place on
electricity bills. These are broadly consistent with the benchmark models produced in 2011,
although on this occasion the models control for the presence of a mains gas connection.
Therefore, these models summarise electricity consumption using three household
variables, namely:
1. household size
2. presence of a swimming pool
3. presence of a mains gas connection.
500
1,000
1,500
2,000
2,500
3,000
3,500
Summer Autumn Winter Spring
Ho
useh
old
qu
art
erl
y c
on
su
mp
tio
n (
kW
h)
All - except WA NSW VIC QLDSA TAS NT ACT

A C I L A L L E N C O N S U L T I N G
ELECTRICITY BILL BENCHMARKS FOR RESIDENTIAL CUSTOMERS v
As with the 2011 benchmarks, the models were calibrated separately for each season to
produce seasonal benchmarks. The benchmarks were weighted to the zone level, using
either climate zones or, in Queensland and South Australia, the same localised zones that
were used in 2011.
The benchmarks themselves are numerous so they are not in this executive summary. The
state level benchmarks are shown in the body of the report and the climate zone
benchmarks are in an accompanying spreadsheet.
These models are inherently simple as they must produce benchmarks that can be placed
on a retail bill in a simple graphical or tabular form.
The second result of this project is a more sophisticated set of models that allow the
consumption benchmarks to be better tailored to the circumstances of individual
households. These are referred to in the report as ‘website models’ as they are intended for
use in an online tool such as the AER’s ‘Energy Made Easy’ Website. The website models
would allow consumers to produce more refined estimates of typical consumption by
answering a series of questions about their household and the way they use electricity.
Website models were estimated separately for each state and each season. As with the
benchmark models, the results from the website models are provided in the body of the
report.

A C I L A L L E N C O N S U L T I N G
vi
C o n t e n t s Executive Summary iii
1 Introduction 1
2 Methodology 3
2.1 Data collection 3
2.1.1 Household data 3
2.1.2 Electricity consumption data 5
2.1.3 Sample matching and weighting 6
2.2 Data analysis 7
2.2.1 Website models 7
2.2.2 Benchmark models 9
2.3 Computing the benchmarks 11
3 The sample 12
3.1 Sample size 12
3.2 Weighting the data 13
3.3 Descriptive statistics 15
3.4 Comparison with 2011 20
4 Results 22
4.1 Queensland 24
4.2 New South Wales 27
4.3 Australian Capital Territory 30
4.4 Victoria 33
4.5 Tasmania 36
4.6 South Australia 39
4.7 Northern Territory 42
5 Conclusion 44
Appendix A Household Questionnaire A-1
Appendix B Benchmark zones B-1

A C I L A L L E N C O N S U L T I N G
vii
List of figures
Figure 1 Household size within the raw and weighted sample 14
Figure 2 Household region within the raw and weighted sample 14
Figure 3 PV usage within the raw and weighted sample 15
Figure 4 Average consumption by location – Benchmarks sample (2014), and AER data from electricity distributors (2013) 16
Figure 5 Seasonal patterns in consumption 17
Figure 6 Proportions of households by appliance ownership/household characteristics 18
Figure 7 Pool-related appliance ownership among pool owners 18
Figure 8 Proportions of households with housing efficiency measures 19
Figure 9 Proportion of time air conditioning, electric heating, and gas heating are used, by season 20
Figure 10 Annual electricity consumption original (2011) benchmarks survey and current survey (2014) 21
Figure 11 Household electricity consumption at different household sizes 23
List of tables
Table 1 Sample sizes for household survey and consumption data matching 13
Table 1 Website model - Queensland 24
Table 3 Queensland benchmarks model – controlling for gas 25
Table 4 Queensland benchmarks model – not controlling for gas 25
Table 5 Typical electricity use of Queensland households by size, swimming pool and gas connection – kWh per annum 26
Table 6 Website model - New South Wales 27
Table 7 New South Wales benchmarks model – controlling for gas 28
Table 8 New South Wales benchmarks model – not controlling for gas 28
Table 9 Typical electricity use of New South Wales households by size, swimming pool and gas connection – kWh per annum 29
Table 10 Website model - Australian Capital Territory 30
Table 11 Benchmarks model - Australian Capital Territory 31
Table 12 Benchmarks model - Australian Capital Territory 31
Table 13 Typical electricity use of Australian Capital Territory households by size, swimming pool and gas connection – kWh per annum 32
Table 14 Website model - Victoria 33
Table 15 Victorian benchmarks model – controlling for gas 34
Table 16 Victorian benchmarks model – not controlling for gas 34
Table 17 Typical electricity use of Victoria households by size, swimming pool and gas connection – kWh per annum 35
Table 18 Website model - Tasmania 36
Table 19 Tasmanian benchmarks model – controlling for gas 37
Table 20 Tasmanian benchmarks model – not controlling for gas 37
Table 21 Typical electricity use of Tasmania households by size, swimming pool and gas connection – kWh per annum 38
Table 22 Website model - South Australia 39
Table 23 South Australian benchmarks model – controlling for gas 40
Table 24 South Australian benchmarks model – not controlling for gas 40

A C I L A L L E N C O N S U L T I N G
viii
Table 25 Typical electricity use of South Australia households by size, swimming pool and gas connection – kWh per annum 41
Table 26 Website model - Northern Territory 42
Table 27 Northern Territory (pooled data) benchmarks model – not controlling for gas 43
Table 28 Typical electricity use of Northern Territory households by size, swimming pool and gas connection – kWh per annum 43
Table B1 Queensland localised zones B-1
Table B2 New South Wales climate zones B-6
Table B3 Victoria climate zones B-15
Table B4 South Australia localised zones B-25

A C I L A L L E N C O N S U L T I N G
ELECTRICITY BILL BENCHMARKS FOR RESIDENTIAL CUSTOMERS 1
1 Introduction
It is widely accepted that some retail customers often use more electricity than is necessary
to achieve a desired standard of living, and are not as energy efficient as they could be. A
significant amount of attention has been given over the years, to the so called ‘energy
efficiency gap’ or the difference between actual energy efficiency and the level thought to be
achievable and affordable.3 As time passes, the level of energy efficiency that could
technically be achieved increases, but the gap remains.
A number of reasons have been identified as to why energy efficiency persists below the
level which could be achieved. One is that customers usually have less than perfect
information on what is an efficient level of consumption. If customers do not know what is
possible, they will find it more difficult to improve their energy efficiency.
Energy prices have risen in recent years, and they are expected to keep rising in the near
future. Further, Australia’s greenhouse gas emissions, and therefore its contribution to
climate change, are more closely linked to energy use than most other countries because
the electricity generation sector in Australia is substantially based on coal. For these
reasons it is important for Australian households to improve their energy efficiency. Doing so
will assist them to manage rising energy bills and reduce Australia’s carbon footprint.
Australian Governments have taken various steps to improve energy efficiency in Australia.
One such step was taken in December 2011 when the Australian Energy Regulator (AER)
provided the first electricity bill benchmarks to retailers.
The electricity bill benchmarks are a requirement of part 11 of the National Energy Retail
Rules (NERR). According to section 169 of the NERR, the benchmarks must be based on:
1. electricity consumption data provided to the AER by electricity distributors
2. localised zones as determined by Energy Ministers
3. the number of persons living in a dwelling (household size).
The AER is required to make the benchmarks available on a website, and is using the
Energy Made Easy website for this purpose. It is also required to provide them to electricity
retailers, who must publish them on bills.
To meet their objective, benchmarks must meet two key criteria:
accuracy – meaning that they must provide an accurate representation of the electricity
that real consumers actually use
simplicity – meaning that they must be understandable and consumers must be able to
accept that the variables are relevant.
Under the NERR, the AER must update the electricity benchmarks every three years. ACIL
Allen developed the first set of benchmarks in 2011 and has now been engaged to update
them.
3 See, for example, Productivity Commission, “Productivity Commission Inquiry Report no 36, The Cost Effectiveness of
Improving Energy Efficiency”, 2005, p. XXIV

A C I L A L L E N C O N S U L T I N G
ELECTRICITY BILL BENCHMARKS FOR RESIDENTIAL CUSTOMERS 2
The benchmarks are part of a broader package of measures designed to meet objectives
that include allowing households and businesses to achieve savings on their energy bills
and to deliver significant low cost greenhouse gas abatement.4 The bill benchmarks will not
be tailored to individual householders and the characteristics of their dwelling. For
consumers seeking more detail, the bill benchmarks will be accompanied by a web based
tool on the AER’s Energy Made Easy website. This tool allows consumers to enter data
about their own circumstances and produce more specific benchmark information. The
model, upon which the web based tool will be based, was developed from the same dataset
as the bill benchmarks and is also presented in this report.
This report summarises the process ACIL Allen undertook to produce the updated
benchmarks and presents the benchmarks that were produced. It is structured as follows.
Chapter 2 describes the methodology ACIL Allen used to estimate the benchmarks.
Chapter 3 describes the sample, as well as providing some preliminary descriptive statistics
on key energy efficiency and consumption variables.
Chapter 4 presents results at the national and jurisdictional (state/territory) level.
Benchmarks at the localised/climate zone level are in an accompanying spreadsheet.
Chapter 5 provides a conclusion.
4 See for example the National Partnerships Agreement for Energy Efficiency, signed by the Council of Australian
Governments in December 2009. Also the National Strategy on Energy Efficiency and its predecessor, the National Framework for Energy Efficiency.
A C I L A L L E N C O N S U L T I N G
ELECTRICITY BILL BENCHMARKS FOR RESIDENTIAL CUSTOMERS 3
2 Methodology
This chapter describes the methodology used to develop the benchmarks and the model for
use as the web based tool. The methodology was very similar to that used in developing the
original benchmarks in 2011. However, some modifications were made based on learnings
from that project.
There are two broad stages to the methodology, each discussed in turn below:
1. data collection, consisting of:
a) survey customers to collect information relevant to the way they use electricity as
discussed in section 2.1.1
b) obtain usage (consumption) data from electricity distributors for those customers as
discussed in section 2.1.2
c) ‘matching’ the two datasets and weighting the combined dataset as discussed in
section 2.1.3
2. data analysis, using econometric techniques to estimate the benchmarks based on the
matched dataset (section 2.2).
2.1 Data collection
2.1.1 Household data
The household data underpinning the electricity bill benchmarks were collected using an
online survey of residential electricity customers in each jurisdiction.
The survey was administered online using a panel of people who had previously indicated
their willingness to participate in surveys. Panel members were invited to participate in the
survey by email. If they chose to complete the survey they clicked on a link and were
connected to an online survey instrument. The questionnaire used is reproduced in
Appendix A.
Obtaining consent to collect consumption data
The benchmarks are based on data relating to individual customers’ actual electricity
consumption. As such, it is important to obtain consent from the customer for the release of
their data. Therefore, at the beginning of the survey, panel members were shown a plain
language description of the process stating that:
1. if they answered the questionnaire, data relating to their electricity consumption would
be collected from their electricity distributor and/or retailer
2. the data would be provided to ACIL Allen and the AER
3. ACIL Allen would use the data to develop updated bill benchmarks and the AER would
use it (in de-identified form) to meet its regulatory requirements. It may also be used
more broadly to inform energy policy.
A C I L A L L E N C O N S U L T I N G
ELECTRICITY BILL BENCHMARKS FOR RESIDENTIAL CUSTOMERS 4
Panel members who were willing to consent to the release of their data indicated this by
clicking a ‘yes’ button.5
At this point, the panel members were asked whether they contribute to paying the electricity
bill or to decisions about using electricity in their home. If they do not, they were not able to
proceed with the survey.
Panel members who had consented to the release of their data and had identified
themselves as responsible for paying the electricity bill were then asked to complete the
questionnaire.
In summary, the following data were gathered:
1. household demographics (number of occupants by age, household income, whether
premises rented or owned, composition of household)
2. dwelling size (number of bedrooms, bathrooms, floors; dwelling age; orientation)
3. dwelling construction material and insulation
4. equipment by fuel type (number and type of televisions; fridges; cook tops; ovens; hot
water services; dryers; heating; lighting; air conditioners; pools and pool heaters; other
appliances)
5. appliance usage
6. use of other fuels and alternative generation (solar panels etc)
7. seasonal behaviour
8. reported use behaviours
a) amount of energy conservation effort over the last year
b) do they think they are doing more/ less/ the same energy conservation as last year
c) do they think they use more/ less/ the same amount of electricity than comparable
households
9. postcode (to identify the appropriate localised zone).
Steps were taken as the survey was conducted to ensure that the sample remained
representative of the broader Australian population. In some cases certain questions were
used to ‘screen out’ responses from customers from demographics that were already
sufficiently represented.
For example, this approach was used to ensure that the age distribution of the sample is
similar to the age distribution of the Australian population. The same approach was used to
ensure that customers with solar panels were not over represented in the sample. 6
The following controls were applied during data collection to avoid demographic bias in the
sample:
no more than 30 per cent of respondents to have university qualifications
approximately equal gender split
no more than 5 per cent of respondents to be aged over 65 years
approximately 50 per cent of responses to come from households with at least one child.
Other controls were applied:
5 If a panel member was not prepared to give consent, they clicked ‘no’ and were not shown the remainder of the survey.
6 Descriptive statistics are presented in chapter 3.

A C I L A L L E N C O N S U L T I N G
ELECTRICITY BILL BENCHMARKS FOR RESIDENTIAL CUSTOMERS 5
approximately 50 per cent of the sample was from regional areas to ensure adequate
depth of sample outside capital cities
respondent must have lived at current address for 12 months or more to ensure the
consumption data provided by distributors applied to their behaviours reported in the
survey
respondent must contribute to paying the electricity bill and/or make decisions about how
electricity is used to ensure their knowledge about household use patterns.
Data collection was conducted by I-View, which is a member of the Australian Market and
Social Research Society and, as such, administered the survey in accordance with the
requirements of that organisation. I-View is also accredited to the International Market and
Social Research Standard ISO 20252, which incorporates the principles of the AS4752
standard and International Quality Crown Award.
2.1.2 Electricity consumption data
To construct the benchmarks, electricity consumption datasets were collected from the
survey respondents’ electricity distributor.
The datasets supplied by electricity distributors were from the same source that underpins
customers’ billing so they are based on meter reads (actual and estimated) conducted by
the electricity distributor.7
To obtain these datasets from the electricity distributors, ACIL Allen supplied each of them
with a list of all the National Metering Identifier (NMI)'s provided by customers in their state
or territory. Each electricity distributor then identified those NMI’s which fell within their
service area8 and returned a file(s) containing:
consumption data that could be matched to respondents
identification of the presence of embedded generation and or dedicated circuit
consumption, and separate reporting of each
NMI’s for which no data was available.
The formats of the data supplied by each electricity distributor varied depending on whether
the electricity distributor was in Victoria or elsewhere.
The Victorian electricity distributors provided data collected by ‘smart meters’, which
produce half hourly readings. In other jurisdictions, smart meters are not (widely) used so
the datasets provided by electricity distributors were typically quarterly.
Consumption from each billing period was mapped to seasons, from summer 2011 to
autumn 2014. The eight most recent quarters of data for each customer were requested
from each electricity distributor, although the seasons these data were related to varied by
customer depending on when individual customers’ meters were read.
The fact that meters are not all read at the same time, coupled with the inability to ‘separate’
the quarterly reading data into smaller time periods puts some limits on the extent to which
seasonality can be examined. This is due to a problem referred to as ‘billing lag’.
7 In the Northern Territory, both the retail and distribution functions are performed by the same organisation, Power and
Water Corporation (PWC). As a result, PWC provided billing data for NT customers. This did not change the analytical approach for NT. PWC is referred to as an electricity distributor for simplicity within this report.
8 In South Australia, Tasmania, the Northern Territory and the Australian Capital Territory there is only one electricity distributor so this step was not necessary.

A C I L A L L E N C O N S U L T I N G
ELECTRICITY BILL BENCHMARKS FOR RESIDENTIAL CUSTOMERS 6
Based on ex perience in overcoming billing lag while estimating bill benchmarks in 2011,
meter readings were assigned to seasons based on the middle of the billing period rather
than the start or finish.
There were two exceptions to this. The first exception was when the period was the first
reported period. For this period the season of the billing date was used to allocate
consumption to a season. This was due to there often being insufficient information
available to determine the length of this billing period (although some electricity distributors
did report the number of days in each billing period).
The second exception was interval meter data, for which consumption dates were known
with more precision. In this case no approximation was required. However, the last season
for which interval data were provided (often Autumn, 2014) was not directly comparable with
other seasons, as data corresponded to only one or two months.
To manage this in a way that maintained sample size, two approaches were taken:
for two electricity distributors, the previous Autumn period was taken, as this was
available for nearly all customers
the longitudinal dimension of the data for the remaining three electricity distributors was
much more variable. Hence, to preserve sample size for customers of these electricity
distributors, interval consumption in each season was converted to a daily consumption
figure, and multiplied by 90 days. This was done when:
there were fewer than 85 days of data available for the season
there were more than 21 days of data available for the season
when there were fewer than 21 days of data available within the season, the season’s
data were discarded.
The result was that a consistent set of data was analysed for Victorian customers, though it
was smaller than the sample that was originally targeted. The sample size could have been
increased by having the electricity distributors provide more data in relation to each
customer. However, ACIL Allen’s judgement was that this would not improve the accuracy
or simplicity of the benchmarks sufficiently to offset the additional effort that would be
required of electricity distributors so this was not pursued. Simply put, there are sufficient
observations in the dataset that was obtained to complete the analysis.
Completing this process required significant interaction between ACIL Allen’s project team
and the electricity distributors in some cases. ACIL Allen greatly appreciates the assistance
that the electricity distributors provided with this project.
2.1.3 Sample matching and weighting
The raw sample was weighted so that key statistics reflected the population. Weights were
applied across the following dimensions:
household size
location
the presence (or absence) of solar photovoltaic (PV) systems.

A C I L A L L E N C O N S U L T I N G
ELECTRICITY BILL BENCHMARKS FOR RESIDENTIAL CUSTOMERS 7
The survey responses and consumption data were then matched to one another using the
customer’s NMI.9 NMI’s were then removed from the dataset and replaced with an index
number to ensure that individual customers’ consumption data cannot be identified.
2.2 Data analysis
When the datasets had been collected and matched the next step was data analysis.
Data analysis was in two stages. First, regression models were estimated using a
combination of variables that were strongly correlated with household electricity
consumption. Those models are intended for use on the AER’s Energy Made Easy website
(website models).
Second, a small number of variables were identified as critically important in determining
electricity consumption, namely household size, and the presence of a swimming pool and a
mains gas connection (separately). Regression models were estimated using only those
variables and these were used to produce the bill benchmarks (benchmarks models).
The website and benchmarks models were estimated at the state/ territory level. The results
were then weighted to reflect differences in average consumption in the zones specified by
Energy Ministers. Those zones are summarised in Appendix B. The weights were the ratio
of mean consumption in the zone to mean consumption in the jurisdiction.
2.2.1 Website models
The website models were constructed by calculating the coefficient of correlation between
electricity consumption and all of the survey variables (separately). Variables for which this
was greater than 0.25 were put into a stepwise regression model.
This was done at the national level. The explanatory variables that were ‘identified’ using
this process were used in each of the jurisdictional models.
The exception was that neither the existence of a solar photovoltaic system on the
household nor the capacity of that system was sufficiently correlated with electricity
consumption to cross this threshold for inclusion in the model. Notwithstanding this, the
presence of a solar panel was added to the models, though capacity was not.
The only other exception was that the existence of a gas connection was not included in the
website model even though it is strongly correlated with electricity consumption. The reason
is that gas is used to ‘fuel’ four key appliances, namely cooktops, ovens and space and
water heaters. Since electricity consumption is of interest, the real question is which of these
appliances a respondent has. When these appliances are accounted for in the website
models, the mere existence of a gas connection was redundant and omitted.
The explanatory variables in the website model are (units are described in parentheses and
more detail is shown in the questionnaire, which is at Appendix A):
a constant (α)
household size (H2, H3, H4, H5)10
dichotomous variables (present=1, absent=0)
9 The account number was used in the Northern Territory.
10 These are set to 1 if they correspond with the number of people normally living in the house. For example H2 is 1 if the household in question is a two person household, 0 otherwise. A 1 person household is the omitted category. H5 relates to households of 5 people. Only a very small number of households larger than 5 responded to the survey. These were omitted from the analysis due to the lack of sample.

A C I L A L L E N C O N S U L T I N G
ELECTRICITY BILL BENCHMARKS FOR RESIDENTIAL CUSTOMERS 8
electric hot water (hot)
swimming pool (pool)
Separate house (separate)
Electric oven (oven)
Electric cook top (cook)
Solar powered electricity generation (PV)
number of (count variables):
operating TVs (#TV)
refrigerators (#fridge)
total rooms in house (#rooms)
dishwasher - times used in week (dishtimes)
computers (#PCs)
washing machine - times used in week (washtimes)
clothes dryer - times used in week (dryertimes)
usage variables (measured as percentage of time used):
air conditioning (%AC)
electric heating (%heat)
appliances left on at wall (%wall)
usage variables (measured as hours used per week)
computer use - total time all computers (PChours)
hours TVs on during the week (TVhours).
Therefore, each of the website models is in the form of equation (1) where β1 to β22 were
estimated using ordinary least squares regression and the variables are as described above
(except ε, which is a stochastic error term).
𝑢𝑠𝑎𝑔𝑒 = 𝛼 + 𝛽1𝐻2 + 𝛽2𝐻3 + 𝛽3𝐻4 + 𝛽4𝐻5 + 𝛽5#𝑟𝑜𝑜𝑚𝑠 + 𝛽6ℎ𝑜𝑡+ 𝛽7%𝐴𝐶 + 𝛽8#𝑇𝑉 + 𝛽9𝑝𝑜𝑜𝑙 + 𝛽10%ℎ𝑒𝑎𝑡 + 𝛽11𝑑𝑖𝑠ℎ𝑡𝑖𝑚𝑒𝑠
+ 𝛽12𝑃𝑉 + 𝛽13#𝑓𝑟𝑖𝑑𝑔𝑒 + 𝛽14%𝑤𝑎𝑙𝑙 + 𝛽15𝑐𝑜𝑜𝑘 + 𝛽16#𝑃𝐶𝑠+ 𝛽17𝑤𝑎𝑠ℎ𝑡𝑖𝑚𝑒𝑠 + 𝛽18𝑠𝑒𝑝𝑎𝑟𝑎𝑡𝑒 + 𝛽19𝑃𝐶ℎ𝑜𝑢𝑟𝑠
+ 𝛽20𝑑𝑟𝑦𝑒𝑟𝑡𝑖𝑚𝑒𝑠 + 𝛽21𝑇𝑉ℎ𝑜𝑢𝑟𝑠 + 𝛽22𝑜𝑣𝑒𝑛 + 𝜀
(1)
The coefficients of each of the jurisdictional website models are in chapter 4.
The coefficients in equation (1) can be interpreted as the average difference in the number
of kWh that a household in the jurisdiction in question consumes as the characteristic in
question (explanatory variable) changes.
As per the list above there are three types of explanatory variables in the website models,
dichotomous, count and usage variables. The interpretations of the coefficients vary with the
type of variable.
The coefficients on the dichotomous variables show the amount that typical consumption
increases relative to the category that is withheld. For the household size variable the
withheld category is a one person household, so the coefficients show how much more
electricity a household with the applicable number of people uses than a one person
household. The other dichotomous variables relate to the presence of a particular appliance.
They can be interpreted as the amount of electricity that is added to typical consumption if
that appliance is added.
A C I L A L L E N C O N S U L T I N G
ELECTRICITY BILL BENCHMARKS FOR RESIDENTIAL CUSTOMERS 9
The count variables also relate to appliances, with the exception of ‘number of rooms in the
house.’ The interpretation of these coefficients is the amount of additional electricity used
when the number of appliances (rooms) increases by one or when the number of times the
appliance is used increases by one.
The usage should be interpreted as the increased electricity that occurs when the
percentage of the time that the appliance is used increases by one percentage point (e.g.
from 10 per cent of the time to 11 per cent of the time) or when the appliance is used for one
more hour per week.
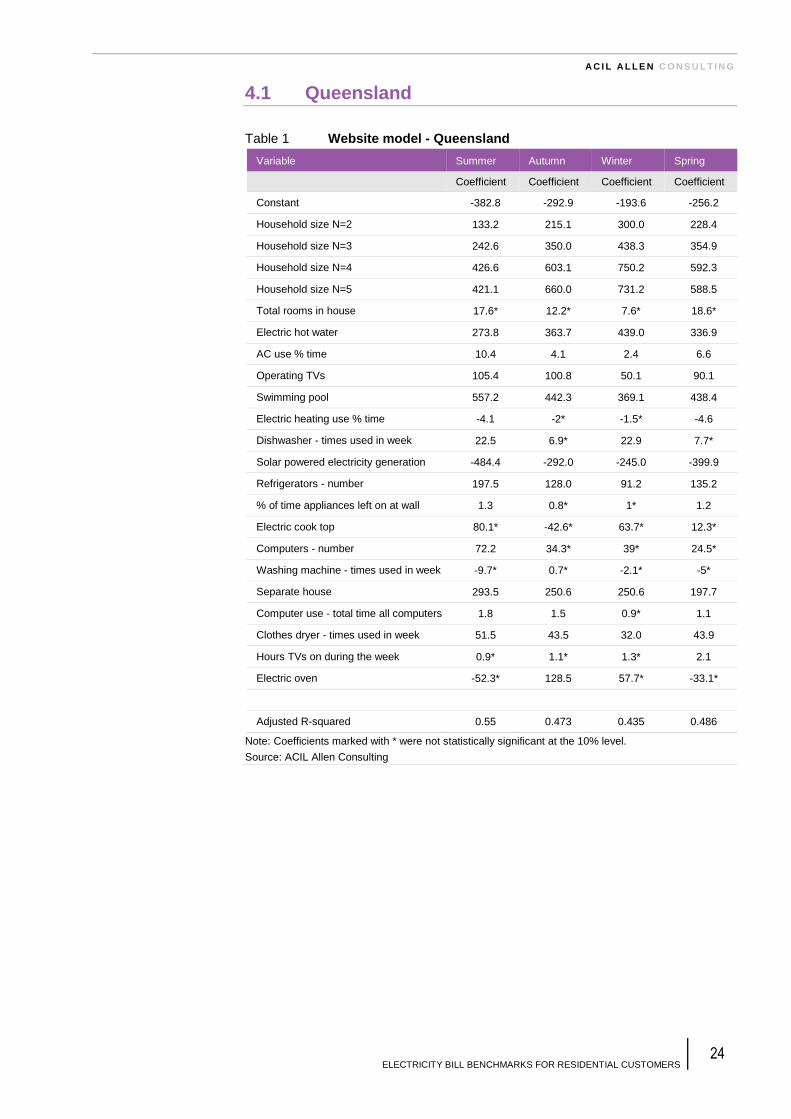
Therefore, using the Queensland website model as an example (see Table 1 in chapter 4
below):
a three person household typically uses 242.6 kWh more electricity in summer than a
one person household
a household with electric water uses 363.7 kWh more electricity in Autumn than a
household without electric hot water
each operating television in a house adds 50.1 kWh to electricity consumption in
winter.11
The tables also indicate the variables that were not found to be statistically significant at the
10 per cent level. This applies to only a few variables in each case and they vary from state
to state and season to season. They are left in for consistency in modelling.
The nature of the model is that the impact of each variable is estimated with all other
influences held constant. Therefore, for example, the quantity of electricity associated with
an additional room does not account for appliances that might be in that room or what else
may be on in the house. Modelling treats the house as a whole physical/behavioural system
and allocates the coefficients accordingly. Therefore, some of the coefficients may seem
counter intuitive if looked at in isolation. For example, the impact of each operating television
in Queensland is lower in winter than summer. It is hard to know if Queenslanders spend
more time inside watching TV in summer than winter or whether this variation relates to the
way the whole house is used. It is most likely the latter as this finding also applies to
Victoria, New South Wales and ACT but not South Australia and Tasmania.
An important technique for evaluating the accuracy of the models and therefore the
benchmarks they produce is to evaluate the size and sign of the coefficients. This is done
on an exceptions basis. That is, coefficients that have an unexpected sign or are
unexpectedly large or small are identified in the sections below.
Another technique for evaluating the models is to consider the ‘goodness of fit’ (adjusted R-
squared) for each model. This varies across the models, but is usually at or around 50 per
cent. That is, most of the models explain about half of the variation in electricity
consumption.
2.2.2 Benchmark models
The benchmark models are simpler than the website models because they are constrained
by the amount of variation that can be included on electricity bills. They are based on the
following three key variables:
household size
11 Note that this does not imply that the television itself uses this electricity. It may also be used to heat the additional room
where the television is watched or in other ways associated with the additional television.

A C I L A L L E N C O N S U L T I N G
ELECTRICITY BILL BENCHMARKS FOR RESIDENTIAL CUSTOMERS 10
presence (absence) of a swimming pool
presence (absence) of a mains gas connection.
The models were estimated using the same methodology as the website models, but using
only these three variables. The models are of the form shown in equation (2):
𝑢𝑠𝑎𝑔𝑒 = 𝛼 + 𝛽1𝐻2 + 𝛽2𝐻3 + 𝛽3𝐻4 + 𝛽4𝐻5 + 𝛽6𝑔𝑎𝑠 ∗ 𝐻1 + 𝛽7𝑔𝑎𝑠 ∗ 𝐻2+ 𝛽8𝑔𝑎𝑠 ∗ 𝐻3 + 𝛽9𝑔𝑎𝑠 ∗ 𝐻4 + 𝛽10𝑔𝑎𝑠 ∗ 𝐻5 + 𝛽11𝑝𝑜𝑜𝑙 + 𝜀
(2)
Where the variables are as described above except H1, which is one for one person
households, 0 otherwise and gas, which is 1 if the household has a mains gas connection, 0
otherwise.
As equation (2) shows, a refinement that has been made to the benchmark models since
the 2011 benchmarks were estimated is that they now ‘control for’ a gas connection. That is,
they allow for differences in the typical electricity consumption of two customers who are the
same in respect of the variables in equation (2) other than that only one has a gas
connection. The analysis of the data shows that this is an important factor in explaining
electricity consumption. The exception to this was where mains gas is not available to retail
customers.12
The models treat gas connection as an interaction term (with household size). This allows
the impact that a gas connection has on electricity consumption to vary with household size.
The inclusion of the variable ‘gas’ in the benchmarks models may seem to be contradictory
with its omission from the website models. However, it is not. As noted above, the website
models account explicitly for the appliances that would typically use gas (water heater,
cooktop, oven, space heater). With these appliances accounted for separately the gas
connection itself does not improve the model’s ability to ‘fit’ the data.13
In effect, the benchmarks models break customers into four groups, namely customers with:
1. neither mains gas nor a pool
2. mains gas, but no pool
3. a pool, but no gas
4. both a pool and gas.
In the results in chapter 4, benchmarks are presented for each of these groups for each
jurisdiction across a range of household sizes.
It is acknowledged that adding the gas variable may make it more difficult to present
benchmarks on customers’ bills. Ideally, the benchmarks that are presented on any given
customer’s bill would reflect that customer’s circumstances. However, this would require
retailers to identify which of four different groups each customer is in. Retailers might be
able to determine whether their customers have gas connections, but they probably have no
way to know whether they have a pool. This is discussed further in chapter 5.
For completeness, a simpler form of the benchmarks models was also estimated as shown
in equation (3) which mirrors those provided in 2011. This model is less accurate than the
models outlined above because it assumes that households have the state average gas
12 Mains gas is not available in the Northern Territory, and various parts of (generally regional) Australia.
13 This is the reverse of the logic as to why the mere presence of a gas connection is not included in the website models.

A C I L A L L E N C O N S U L T I N G
ELECTRICITY BILL BENCHMARKS FOR RESIDENTIAL CUSTOMERS 11
usage whereas the reality is either no gas or some level depending on the appliance
configuration of the household.
𝑢𝑠𝑎𝑔𝑒 = 𝛼 + 𝛽1𝐻2 + 𝛽2𝐻3 + 𝛽3𝐻4 + 𝛽4𝐻5 + 𝛽5𝑝𝑜𝑜𝑙 + 𝜀 (3)
In effect this model treats customers as belonging to one of two groups. They either have a
pool or they do not. The results of this simpler model are also presented in chapter 4.
2.3 Computing the benchmarks
The proposed benchmark consumption levels are presented in this report as ACIL Allen’s
estimates of the typical electricity use of customers in one of the ‘groups’ identified in section
2.2.2 (i.e. neither gas nor pool, gas but no pool, pool but no gas, both gas and pool; OR
pool, no pool).
The typical usage estimates were computed simply by setting the relevant variables to 1 and
0 as appropriate and computing the result of equation (2) (controlling for gas) or equation (3)
(not controlling for gas).
In each case, benchmarks are provided across a range of household sizes and for each of
the four seasons.
Benchmarks were computed in each of a number of zones that were nominated by Energy
Ministers. The zones were either climate zones (New South Wales, Victoria, Australian
Capital Territory, Tasmania and Northern Territory) or the same location based zones used
for the 2011 benchmarks (Queensland and South Australia).14 The zones that were used
are broken down to postcode level in Appendix B.
The typical use benchmarks for each zone were computed by weighting the state or
Territory level. The weights were computed from within the sample data whenever there
were at least 50 responses from within a zone.
In Queensland and South Australia there were a number of zones with too few responses in
the zone to develop a reasonable weight. In these cases the weight was assumed to be the
same as it was in the 2011 project when a data set showing postcode level average
electricity use was available.
In Victoria, there were too few responses from postcodes within climate zone 4 (covering the
northwest of the state) to develop a reasonable weight. In this case, we have applied
weights from elsewhere:
for postcodes in the most north-westerly local government area (Rural City of Mildura),
we have applied weights from the Murraylands and Riverland zone of South Australia (in
climate zone 5), on the basis of their very similar climates
for other postcodes in zone 4, we have applied weights from zone 6 postcodes in
Victoria.
The results provided in chapter 4 are at the state/ territory level. The zone level results are in
an accompanying spreadsheet.
14 Note that NT, ACT and Tasmania each consist of only one zone.

A C I L A L L E N C O N S U L T I N G
ELECTRICITY BILL BENCHMARKS FOR RESIDENTIAL CUSTOMERS 12
3 The sample
This chapter provides a descriptive overview of the matched and weighted sample.
3.1 Sample size
The number of respondents in the surveyed sample is shown in Table 1 along with the
number of responses that were matched to consumption data.
As the table shows, approximately 10 per cent of the sample was lost due to an inability to
match the customer to their data. The reasons for this are not necessarily known but are
likely due to errors in entering the NMI number in the survey.15 The exception is Victoria,
where approximately one third of the responses were lost. This is partly due to ‘mismatch’
but also due to the issue discussed in section 2.1.2 regarding the need to approximate a full
four seasons of data for some customers with interval meters. Notwithstanding that the final
sample is smaller than the target, there is sufficient data for robust analysis as confirmed by
the model results in chapter 4.16
Finally, Table 1 does not include Western Australia, as the consumption dataset from
Western Australia was not available at the time this report was compiled.
Table 1 also shows that, notwithstanding that significant efforts were made to collect survey
responses in the Northern Territory, very few were received. Unfortunately there are
insufficient data to produce benchmarks for the Northern Territory independently. To
overcome this, the Northern Territory responses were pooled with responses from
customers living in (north) Queensland climate zone 1. This is consistent with the view that
climate is likely to have more influence on electricity consumption than a person’s state of
residence.17 If this assumption is valid the benchmarks should be satisfactory. This
increased the sample on which the Northern Territory benchmarks were estimated to 109,
which enabled the models to be estimated.
15 When the original benchmarks were estimated in 2011 a process of ‘pickups’ was implemented where customers who
could not be matched to their data were asked to re-check and confirm their NMI. This reduced the mismatch on that occasion, but was time consuming and costly so the decision was made not to take that step this time.
16 Note in particular that model fit and statistical significance is similar in Victoria to other jurisdictions.
17 The data were pooled across areas without access to mains gas.

A C I L A L L E N C O N S U L T I N G
ELECTRICITY BILL BENCHMARKS FOR RESIDENTIAL CUSTOMERS 13
Table 1 Sample sizes for household survey and consumption data matching
State Sample target Unmatched
sample
Matched
sample
‘Mismatch’ (%)
New South Wales 1,000 1,016 851 16%
Victoria 1,000 1,026 685 33%
Queensland 1,000 1,007 901 11%
South Australia 500 511 463 9%
Tasmania 250 246 218 11%
Australian Capital Territory 250 189 145 23%
Northern Territory 250 47 39 17%
Total 4,250 4,042 3,302 18%
Source: ACIL Allen Consulting
3.2 Weighting the data
As described in section 2.1.3 the sample was weighted to ensure that it was reflective of the
Australian population.
The following figures show the original sample, as well as the general Australian population,
across these dimensions. The raw sample was weighted to ensure that it reflected the
population in certain key demographics.
The weighting process was carried out state by state. Using population data relating to PV
take-up rates and household size and location by state, the weights were calculated for
each individual variable in order. The cycle was repeated until all were at the level of the
population data. Ideally had population data been available that accounted for all four
(including state) variables simultaneously, this would have been used to calculate the
weighting, however no such source exists. In any event, while weighting is good practice,
even large sample variations from the underlying population statistics usually only causes
small percentage variations in the results, so the accuracy gained by having access to more
refined population statistics is unlikely to have made much difference to the outcomes.
Figure 1 shows this for household size. It shows, for example, that single person households
were under represented in the survey whereas households with two people were
overrepresented. Households with more than two people were sampled roughly in
proportion to the general population.

A C I L A L L E N C O N S U L T I N G
ELECTRICITY BILL BENCHMARKS FOR RESIDENTIAL CUSTOMERS 14
Figure 1 Household size within the raw and weighted sample
Source: ACIL Allen Consulting
Figure 2 shows that a substantial part of the sample lives outside a state capital city.
Further, people living outside capital cities were over represented in the sample. This
situation was brought about intentionally to ensure that differences in consumption between
regional and non-regional customers are captured.18
Figure 2 Household region within the raw and weighted sample
Source: ACIL Allen Consulting
All else being equal, adding a solar panel to a household does not change the amount of
electricity that household will use. However, it will typically reduce the amount that the
18 That is, to ensure a statistically significant sample outside the capital cities.
20%
40%
16%
16%
6%
1%
0%
0%
24%
34%
16%
16%
7%
3%
0%
0%
0% 5% 10% 15% 20% 25% 30% 35% 40% 45%
1
2
3
4
5
6
7
8
Proportion of sample
Nu
mb
er
of
pe
rso
ns
in
ho
us
eh
old
Raw Weighted
10%
16%
21%
53%
8%
13%
17%
62%
0% 10% 20% 30% 40% 50% 60% 70%
Rural/not in a town or city
Small regional centre
Major regional centre
State capital city
Proportion of sample
Raw Weighted

A C I L A L L E N C O N S U L T I N G
ELECTRICITY BILL BENCHMARKS FOR RESIDENTIAL CUSTOMERS 15
household purchases from the grid. The analysis in this project is based on data that relate
to the amount of electricity purchased from the grid.19 Therefore, all else being equal, the
presence of a solar panel reduces the amount of electricity that the consumption data
collected from the distributors suggest that a household uses. This makes it important to
identify customers with solar panels in the sample. Figure 3 shows the penetration of solar
panels in the raw sample and in the reweighted sample.
Figure 3 PV usage within the raw and weighted sample
Source: ACIL Allen Consulting
3.3 Descriptive statistics
Descriptive analysis of some of the key consumption and energy efficiency variables is
shown in this section. Reported numbers are based on the weighted matched sample,
unless otherwise indicated. Figure 4 shows average electricity consumption by
state/territory. Victorian households exhibit the lowest consumption on average. This is in
part due to widespread availability of gas for heating. In contrast, Tasmania, where gas is
not as readily available and winters are cold, exhibits the highest level of average
consumption.
The data obtained from the survey process are compared with a set of data provided by the
AER. The second dataset, labelled ‘AER electricity distributor data’ is based on data
collected by the AER using regulatory information notices. In response to those notices,
which were issued in November 2013, each electricity distributor supplied total residential
energy delivery and residential customer numbers. The former was divided by the latter to
produce an average usage per customer plotted below.
There are some residual discrepancies between the two datasets, most notably in
Queensland, Tasmania and the Australian Capital Territory. It is not possible to be entirely
sure of the source of these discrepancies. It may be due to differences in the way data are
collected by distributors. For example, the distributors may consider all customers who are
19 In other words, the benchmarks reflect the net consumption of customers with PV systems (with the portion of PV output
that is consumed on site netted off rom total consumption). This is related to, but not the same as, the concept of net metering for PV systems.
77%
23%
85%
15%
0% 10% 20% 30% 40% 50% 60% 70% 80% 90%
No
Yes
Proportion of sample
Ho
us
eh
old
ha
s P
V s
ys
tem
in
sta
lle
d
Raw Weighted

A C I L A L L E N C O N S U L T I N G
ELECTRICITY BILL BENCHMARKS FOR RESIDENTIAL CUSTOMERS 16
not on a business tariff to be residential. In this study, users were excluded who nominated
that more on premise electricity was used for business than residential.
In addition there may be errors in the averaging (which is based on a single estimate of
customer numbers for the whole period) or due to distortions in the weighted sample.
Figure 4 Average consumption by location – Benchmarks sample (2014),
and AER data from electricity distributors (2013)
Source: ACIL Allen Consulting, AER electricity distributor’s data
Seasonal consumption patterns
There is a strong relationship between weather and electricity use. Particularly in colder
climates, consumption is usually higher in winter than in other seasons, largely due to
electricity used for space heating. This is in contrast to seasonal changes in maximum
demand, which typically peak during summer.
In warmer climates, winters tend not to be as cold, but summers are often more intense.
Hence electricity consumption is more influenced by cooling load in summer in these
regions, rather than by heating load in winter. However, the amount of electricity used for
cooling is usually less than the amount used for heating.
Figure 5 shows the average consumption of survey respondents by season and by state. It
shows the expected pattern in seasonal energy use. That is, energy use is higher in winter
than in summer, consistent with the increased heating load. The difference is greatest in
states where winters are coldest and gas availability is lowest.
6,817
8,045
5,289
6,615
4,923
6,220
5,915
8,264
7,470
8,813
5,145
5,793
4,905
5,920
5,817
0 1,000 2,000 3,000 4,000 5,000 6,000 7,000 8,000 9,000 10,000
NT
ACT
TAS
SA
QLD
VIC
NSW
National -excl. WA, NT
Average electricity consumption (KWh)
Benchmarks (2014 data) AER electricity distributor's data (2013)

A C I L A L L E N C O N S U L T I N G
ELECTRICITY BILL BENCHMARKS FOR RESIDENTIAL CUSTOMERS 17
Figure 5 Seasonal patterns in consumption
Source: ACIL Allen Consulting
Appliance ownership and household characteristics
Ownership of particular appliances is likely to impact on household electricity consumption.
As the number of different appliances owned by households increases, this will tend to
increase consumption of electricity. However, substitution between some types of
appliances (for example, electric to gas space or water heating) can reduce consumption. In
addition, appliance energy efficiency tends to increase over time, thus reducing
consumption. Figure 6 shows the proportion of households with selected appliances.
500
1,000
1,500
2,000
2,500
3,000
3,500
Summer Autumn Winter Spring
Ho
useh
old
qu
art
erl
y c
on
su
mp
tio
n (
kW
h)
All - except WA NSW VIC QLDSA TAS NT ACT
A C I L A L L E N C O N S U L T I N G
ELECTRICITY BILL BENCHMARKS FOR RESIDENTIAL CUSTOMERS 18
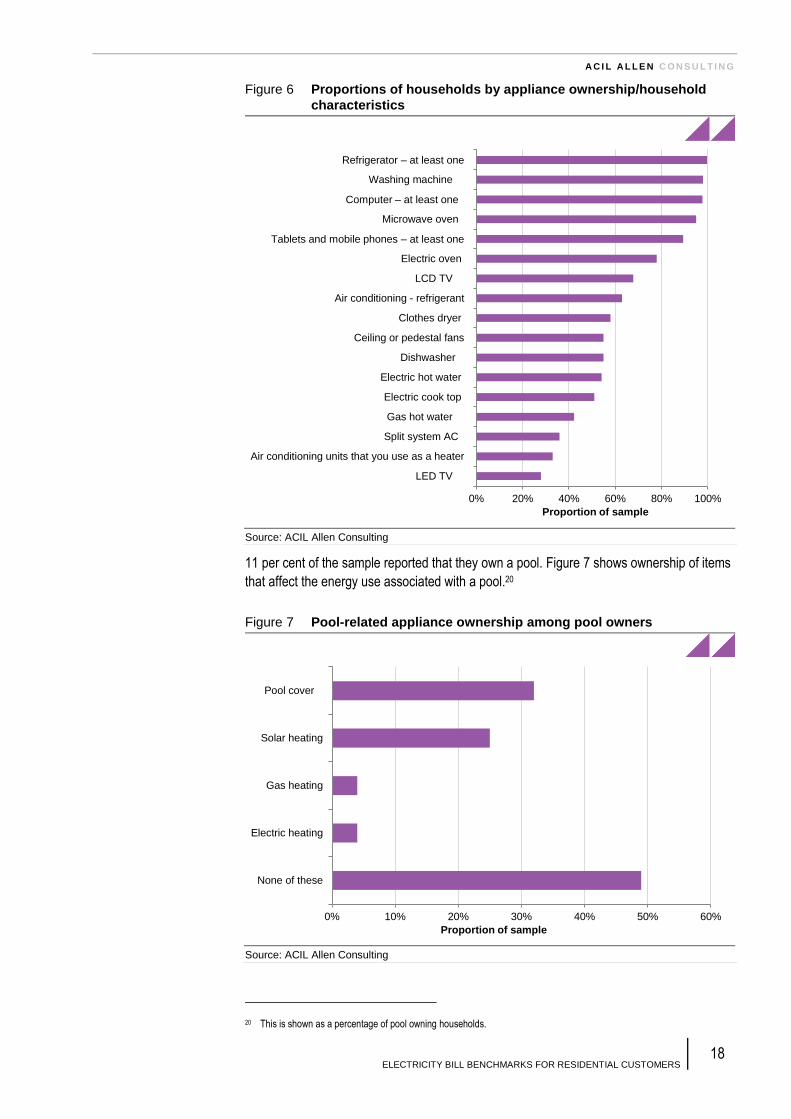
Figure 6 Proportions of households by appliance ownership/household
characteristics
Source: ACIL Allen Consulting
11 per cent of the sample reported that they own a pool. Figure 7 shows ownership of items
that affect the energy use associated with a pool.20
Figure 7 Pool-related appliance ownership among pool owners
Source: ACIL Allen Consulting
20 This is shown as a percentage of pool owning households.
0% 20% 40% 60% 80% 100%
LED TV
Air conditioning units that you use as a heater
Split system AC
Gas hot water
Electric cook top
Electric hot water
Dishwasher
Ceiling or pedestal fans
Clothes dryer
Air conditioning - refrigerant
LCD TV
Electric oven
Tablets and mobile phones – at least one
Microwave oven
Computer – at least one
Washing machine
Refrigerator – at least one
Proportion of sample
0% 10% 20% 30% 40% 50% 60%
None of these
Electric heating
Gas heating
Solar heating
Pool cover
Proportion of sample

A C I L A L L E N C O N S U L T I N G
ELECTRICITY BILL BENCHMARKS FOR RESIDENTIAL CUSTOMERS 19
Figure 8 shows the uptake of housing efficiency measures reported by survey respondents.
Roof insulation exhibited the highest penetration rates. Just over a quarter of households
reported having wall insulation, while only four per cent reported under-floor insulation.
Thirteen per cent of households said that their home is uninsulated.
Figure 8 Proportions of households with housing efficiency measures
Source: ACIL Allen Consulting
Appliance use
In addition to information on appliance ownership, data on the use of particular appliances
and housing features was collected. Figure 9 shows the proportion of time air conditioning
was used in addition to the proportion of time that gas or electric heating was used (for
customers with the relevant equipment). Figure 9 indicates on average customers with air
conditioners use them for approximately 10 per cent of the time in the cooler seasons. This
is likely to include the use of reverse cycle units as heaters.21
21 Customers without air conditioners are coded as using it zero times because not having one is equivalent in use terms to
having one and not using it, thus the average of those customers with air conditioners is higher. A similar coding was used for use estimates other equipment such as dishwashers, clothes dryers and so on.
0% 10% 20% 30% 40% 50% 60% 70% 80%
None
Don't know
Under-floor insulation
Wall insulation
Roof insulation
Proportion of sample

A C I L A L L E N C O N S U L T I N G
ELECTRICITY BILL BENCHMARKS FOR RESIDENTIAL CUSTOMERS 20
Figure 9 Proportion of time air conditioning, electric heating, and gas
heating are used, by season
Cooling Heating
Source: ACIL Allen Consulting
3.4 Comparison with 2011
Reported annual consumption has fallen 12.3 per cent on average between the 2011 survey
and the current project as shown in Figure 10. It fell most in Queensland and South
Australia where the penetration of PV systems is highest. The penetration of PV panels has
increased three fold nationally since the first set of benchmarks was estimated.
As noted earlier, the presence of PVs is ambiguous for while it is associated with decreased
electricity consumption and is used in the models, paradoxically it is not directly correlated to
metered electricity consumption.
0%
10%
20%
30%
40%
Summer Autumn Winter Spring
Pro
po
rtio
n o
f ti
me u
sed
Air conditioner
0%
10%
20%
30%
40%
Summer Autumn Winter Spring
Pro
po
rtio
n o
f ti
me u
sed
Electric heating Gas heating

A C I L A L L E N C O N S U L T I N G
ELECTRICITY BILL BENCHMARKS FOR RESIDENTIAL CUSTOMERS 21
Figure 10 Annual electricity consumption original (2011) benchmarks survey
and current survey (2014)
Source: ACIL Allen Consulting
Additional analysis of the configuration of houses between surveys showed a range of small
but persistent changes. These include increases in the penetration of gas hot water and
solar hot water. Customers in the survey turn appliances off at the wall more than they did in
2011 and use electrical heating less. They have more energy saving lights (15 per cent) and
more conventional halogen lights (8 per cent).
Dishwasher ownership increased by 4 per cent. There was also a small increase in air
conditioner use.
The qualitative factors that correlate most strongly with lower electricity consumption and
whose importance increased between surveys are the following:
1. I am concerned about the cost of electricity (87 per cent compared to 73 per cent)
2. I closely monitor and manage my electricity use (69 per cent compared to 66 per cent)
3. I know how much electricity our household uses compared to similar households (55
per cent compared to 44 per cent).
8,264
8,813
5,145
5,793
4,905
7,470
5,920
5,817
9,381
9,404
5,967
6,791
5,432
8,026
6,730
6,635
0 2,000 4,000 6,000 8,000 10,000
NT
TAS
SA
QLD
VIC
ACT
NSW
National
Annual electricty consumption (kWh)
2011 Annual 2014 Annual

A C I L A L L E N C O N S U L T I N G
ELECTRICITY BILL BENCHMARKS FOR RESIDENTIAL CUSTOMERS 22
4 Results
This chapter provides an overview of the results. It is presented on a jurisdiction by
jurisdiction basis. Therefore:
section 4.1 provides results for Queensland
section 4.2 provides results for New South Wales
section 4.3 provides results for the Australian Capital Territory
section 4.4 provides results for Victoria
section 4.5 provides results for Tasmania
section 4.6 provides results for South Australia
section 4.7 provides results for the Northern Territory.
Each section provides a summary of both the ‘website’ and ‘benchmarks’ models described
in section 2.1.3 above. The benchmarks provided in this chapter are applicable at the state/
territory level. Zone level benchmarks were supplied to the AER in a spreadsheet
accompanying this report.
Each of the following sections contains three tables, providing:
the website model
the benchmarks models, controlling for gas and then without controlling for gas
typical electricity use for customers with and without gas connections and swimming
pools.
Generally, the website and benchmark models are as expected. In particular:
1. The variables are specified so that positive coefficients would be expected for all
variables except the presence of a solar panel. In most cases the coefficients have the
expected sign, though there are some exceptions
2. Most coefficients are statistically significant. Coefficients that are not significant at the
ten per cent level are marked in the tables below, though they are kept in the model for
consistency
3. The explanatory power of the models is broadly as expected. The details vary between
models, but generally:
a) The benchmark models account for approximately one third of the variation in
household electricity consumption when household size, the presence of gas and
the presence of a swimming pool is taken into account
b) The website models account for around half of the variation in electricity use.
The presentation of the models in each section has the same structure with only the actual
results changing. The methodology and interpretation of each model is summarised in
section 2.2.
The coefficients on the household size variables are not linear in either the website or
benchmark models.
In general, we would expect electricity consumption to rise with the number of people in a
household, though not necessarily in a linear fashion.
The most obvious non-linearity occurs between single person households and others. Single
person households differ from multi- person households in a number of ways but in

A C I L A L L E N C O N S U L T I N G
ELECTRICITY BILL BENCHMARKS FOR RESIDENTIAL CUSTOMERS 23
particular, they are less likely to have swimming pools and equipment such as dishwashers
and tablets.
Beyond that, at the national level average consumption is more or less linear from two to
five person households.
However, the pattern is more complex at the state level, where sample sizes are smaller
and there are some non-linearities in consumption as household size changes.
This can be seen in the low rise of consumption in Queensland between two and three
person households and a jump to four. Similarly, average consumption in the New South
Wales and Victorian samples show a small increase between three and four person
households and a jump to five person households. In Tasmania’s case, there is a very big
jump to four person households and then a fall to five person households. To some extent
these will be due to sampling issues as while the total sample is large, the number of
households of a particular size, in particular the larger sizes, in the smaller jurisdictions is
limited.
Figure 11 Household electricity consumption at different household sizes
Source: ACIL Allen Consulting
0
2000
4000
6000
8000
10000
12000
One Two Three Four Five
An
nu
al h
ou
se
ho
ld c
onsu
mp
tio
n (
kW
h)
Household size (persons)
All except WA NSW VIC QLD SA TAS ACT
A C I L A L L E N C O N S U L T I N G
ELECTRICITY BILL BENCHMARKS FOR RESIDENTIAL CUSTOMERS 24
4.1 Queensland
Table 1 Website model - Queensland
Variable Summer Autumn Winter Spring
Coefficient Coefficient Coefficient Coefficient
Constant -382.8 -292.9 -193.6 -256.2
Household size N=2 133.2 215.1 300.0 228.4
Household size N=3 242.6 350.0 438.3 354.9
Household size N=4 426.6 603.1 750.2 592.3
Household size N=5 421.1 660.0 731.2 588.5
Total rooms in house 17.6* 12.2* 7.6* 18.6*
Electric hot water 273.8 363.7 439.0 336.9
AC use % time 10.4 4.1 2.4 6.6
Operating TVs 105.4 100.8 50.1 90.1
Swimming pool 557.2 442.3 369.1 438.4
Electric heating use % time -4.1 -2* -1.5* -4.6
Dishwasher - times used in week 22.5 6.9* 22.9 7.7*
Solar powered electricity generation -484.4 -292.0 -245.0 -399.9
Refrigerators - number 197.5 128.0 91.2 135.2
% of time appliances left on at wall 1.3 0.8* 1* 1.2
Electric cook top 80.1* -42.6* 63.7* 12.3*
Computers - number 72.2 34.3* 39* 24.5*
Washing machine - times used in week -9.7* 0.7* -2.1* -5*
Separate house 293.5 250.6 250.6 197.7
Computer use - total time all computers 1.8 1.5 0.9* 1.1
Clothes dryer - times used in week 51.5 43.5 32.0 43.9
Hours TVs on during the week 0.9* 1.1* 1.3* 2.1
Electric oven -52.3* 128.5 57.7* -33.1*
Adjusted R-squared 0.55 0.473 0.435 0.486
Note: Coefficients marked with * were not statistically significant at the 10% level.
Source: ACIL Allen Consulting

A C I L A L L E N C O N S U L T I N G
ELECTRICITY BILL BENCHMARKS FOR RESIDENTIAL CUSTOMERS 25
Table 3 Queensland benchmarks model – controlling for gas
Variable Summer Autumn Winter Spring
Coefficient Coefficient Coefficient Coefficient
Constant 884.1 825.7 855.0 783.9
2 person household 447.6 436.6 480.5 459.5
3 person household 590.5 619.4 637.2 600.5
4 person household 963.2 995.9 1076.4 961.1
5 person household 1101.1 1168.3 1153.8 1084.0
Mains gas connected & 1 person -279.2* -348.8 -361.5 -264.7*
Mains gas connected & 2 person -201.3* -253.4 -398.8 -334.5
Mains gas connected & 3 person 36.5* -217.6* -235.8* 17.3*
Mains gas connected & 4 person 323.8* -21.8* -214.5* 186.7*
Mains gas connected & 5 person -600.8 -852.9 -884.3 -668.8
Swimming pool 727.5 557.4 454.6 535.6
Adjusted R-squared 0.271 0.32 0.317 0.287
Note: Coefficients marked with * were not statistically significant at the 10% level.
Source: ACIL Allen Consulting
Table 4 Queensland benchmarks model – not controlling for gas
Variable Summer Autumn Winter Spring
Coefficient Coefficient Coefficient Coefficient
Constant 858.1 793.1 820.8 758.8
2 person household 447.9 436.5 464.0 442.4
3 person household 619.4 620.1 636.0 625.0
4 person household 1030.6 1021.6 1076.0 1007.6
5 person household 1046.0 1085.9 1067.4 1017.9
Swimming pool 739.6 574.3 478.1 553.5
Adjusted R-squared 0.267 0.307 0.295 0.277
Note: Coefficients marked with * were not statistically significant at the 10% level.
Source: ACIL Allen Consulting

A C I L A L L E N C O N S U L T I N G
ELECTRICITY BILL BENCHMARKS FOR RESIDENTIAL CUSTOMERS 26
Table 5 Typical electricity use of Queensland households by size,
swimming pool and gas connection – kWh per annum
Season Household size ( persons)
1 2 3 4 5
kWh kWh kWh kWh kWh
Neither gas nor pool
Summer 884 1332 1475 1847 1985
Autumn 826 1262 1445 1822 1994
Winter 855 1336 1492 1931 2009
Spring 784 1243 1384 1745 1868
Gas but no pool
Summer 605 1130 1511 2171 1384
Autumn 477 1009 1227 1800 1141
Winter 494 937 1256 1717 1125
Spring 519 909 1402 1932 1199
Pool but no gas
Summer 1612 2059 2202 2575 2713
Autumn 1383 1820 2002 2379 2551
Winter 1310 1790 1947 2386 2463
Spring 1319 1779 1920 2281 2403
Both pool and gas
Summer 1332 1858 2239 2899 2112
Autumn 1034 1566 1785 2357 1698
Winter 948 1391 1711 2172 1579
Spring 1055 1444 1937 2467 1735
No pool and no control for gas
Summer 858 1306 1477 1889 1904
Autumn 793 1230 1413 1815 1879
Winter 821 1285 1457 1897 1888
Spring 759 1201 1384 1766 1777
Pool and no control for gas
Summer 1598 2046 2217 2628 2644
Autumn 1367 1804 1988 2389 2453
Winter 1299 1763 1935 2375 2366
Spring 1312 1755 1937 2320 2330
Source: ACIL Allen Consulting

A C I L A L L E N C O N S U L T I N G
ELECTRICITY BILL BENCHMARKS FOR RESIDENTIAL CUSTOMERS 27
4.2 New South Wales
Table 6 Website model - New South Wales
Variable Summer Autumn Winter Spring
Coefficient Coefficient Coefficient Coefficient
Constant -573.4 -493.8 -648.1 -486.8
Household size N=2 152.7 243.1 320.3 208.0
Household size N=3 294.2 443.9 566.6 418.0
Household size N=4 319.7 472.5 717.4 503.4
Household size N=5 607.1 773.2 1108.5 864.8
Total rooms in house 50.3 47.2 62.0 37.8
Electric hot water 353.6 405.1 459.7 399.3
AC use % time 6.9 2.3 3.4 2.5
Operating TVs 115.1 65.0 51.8* 107.5
Swimming pool 572.0 398.2 440.3 475.1
Electric heating use % time -0.8* -1.7* 0.9* -0.2*
Dishwasher - times used in week 10.5* 22.7 42.1 16.6*
Solar powered electricity generation -253.0 -250.5 -229.9 -298.4
Refrigerators - number 152.2 158.0 96.5* 144.3
% of time appliances left on at wall 2.2 2.7 2.7 2.1
Electric cook top 33.2* 153.9 185.6 107.6
Computers - number 7.3* -27.7* 40.7* 15.2*
Washing machine - times used in week 30.4 5.3* -7.5* 5.9*
Separate house 156.5 223.3 180.0 197.4
Computer use - total time all computers 0.8* 1.6 0.8* 1.9
Clothes dryer - times used in week -21.5 4.5* 26.3* 6*
Hours TVs on during the week 0.3* -0.2* 1.3* -0.2*
Electric oven 136.6 99.5* 230.5 90.4*
Adjusted R-squared 0.546 0.464 0.42 0.475
Note: Coefficients marked with * were not statistically significant at the 10% level.
Source: ACIL Allen Consulting

A C I L A L L E N C O N S U L T I N G
ELECTRICITY BILL BENCHMARKS FOR RESIDENTIAL CUSTOMERS 28
Table 7 New South Wales benchmarks model – controlling for gas
Variable Summer Autumn Winter Spring
Coefficient Coefficient Coefficient Coefficient
Constant 806.2 883.3 955.9 817.0
2 person household 570.0 604.9 736.6 562.8
3 person household 890.0 894.3 1179.1 893.6
4 person household 977.0 925.4 1366.3 1005.6
5 person household 1515.5 1426.0 1925.3 1575.3
Mains gas connected & 1 person 5* -138.5* -76.6* -76.7*
Mains gas connected & 2 person -281.9 -471.2 -424.5 -356.8
Mains gas connected & 3 person -360.5 -516.1 -719.3 -412.2
Mains gas connected & 4 person -481.4 -489.6 -699.3 -437.9
Mains gas connected & 5 person -522.6 -560.9 -665.5 -492.1
Swimming pool 801.8 621.7 721.8 683.8
Adjusted R-squared 0.331 0.306 0.298 0.322
Note: Coefficients marked with * were not statistically significant at the 10% level.
Source: ACIL Allen Consulting
Table 8 New South Wales benchmarks model – not controlling for gas
Variable Summer Autumn Winter Spring
Coefficient Coefficient Coefficient Coefficient
Constant 808.8 827.0 925.2 786.0
2 person household 461.8 483.2 608.0 459.3
3 person household 746.2 747.6 926.9 762.6
4 person household 727.6 730.6 1038.4 812.1
5 person household 1275.6 1227.4 1654.1 1382.8
Swimming pool 788.2 607.6 702.1 671.3
Adjusted R-squared 0.299 0.247 0.249 0.286
Note: Coefficients marked with * were not statistically significant at the 10% level.
Source: ACIL Allen Consulting

A C I L A L L E N C O N S U L T I N G
ELECTRICITY BILL BENCHMARKS FOR RESIDENTIAL CUSTOMERS 29
Table 9 Typical electricity use of New South Wales households by size,
swimming pool and gas connection – kWh per annum
Season Household size ( persons)
1 2 3 4 5
kWh kWh kWh kWh kWh
Neither gas nor pool
Summer 806 1376 1696 1783 2322
Autumn 883 1488 1778 1809 2309
Winter 956 1692 2135 2322 2881
Spring 817 1380 1711 1823 2392
Gas but no pool
Summer 811 1094 1336 1302 1799
Autumn 745 1017 1261 1319 1748
Winter 879 1268 1416 1623 2216
Spring 740 1023 1298 1385 1900
Pool but no gas
Summer 1608 2178 2498 2585 3124
Autumn 1505 2110 2399 2430 2931
Winter 1678 2414 2857 3044 3603
Spring 1501 2064 2394 2506 3076
Both pool and gas
Summer 1613 1896 2138 2104 2601
Autumn 1366 1639 1883 1941 2370
Winter 1601 1990 2137 2345 2937
Spring 1424 1707 1982 2068 2584
No pool and no control for gas
Summer 809 1271 1555 1536 2084
Autumn 827 1310 1575 1558 2054
Winter 925 1533 1852 1964 2579
Spring 786 1245 1549 1598 2169
Pool and no control for gas
Summer 1597 2059 2343 2325 2873
Autumn 1435 1918 2182 2165 2662
Winter 1627 2235 2554 2666 3281
Spring 1457 1917 2220 2269 2840
Source: ACIL Allen Consulting

A C I L A L L E N C O N S U L T I N G
ELECTRICITY BILL BENCHMARKS FOR RESIDENTIAL CUSTOMERS 30
4.3 Australian Capital Territory
Table 10 Website model - Australian Capital Territory
Variable Summer Autumn Winter Spring
Coefficient Coefficient Coefficient Coefficient
Constant -1410.8 -1434.9 -928.3* -1582.8
Household size N=2 156.4* 632.5* 252.5* 97.7*
Household size N=3 226.1* 524.9* 400.1* 211.3*
Household size N=4 477.5 1043.3 438.3* 415.9*
Household size N=5 342.8* 1001.9* 940.3* 79.1*
Total rooms in house 25.3* 167.4 134.6 65.9*
Electric hot water 409.9 882.5 1070.3 690.2
AC use % time 5.8 -1.3* -3.3* 4.3*
Operating TVs 125.5* 39.9* 52.5* 108.1*
Swimming pool 410.8* 139.9* -39.2* 68.2*
Electric heating use % time 1* 7.5* 9.5* 0.9*
Dishwasher - times used in week 34.5* -13.6* -18.7* 16*
Solar powered electricity generation -2.9* -26.5* 703.1 279.6*
Refrigerators - number 371.4 383.1* 360.6* 307.8
% of time appliances left on at wall 5.0 2.5* 3.1* 5.6
Electric cook top -93.1* 264.3* -201.7* -127.9*
Computers - number 169.5 65.8* 215.9* 192.9
Washing machine - times used in week 58.5 77.1* 55.6* 95.8
Separate house 26.1* -149* 11.7* -78.8*
Computer use - total time all computers 0.7* -3.1* -2.4* 2*
Clothes dryer - times used in week -12.7* 6.6* 71.8* 6.3*
Hours TVs on during the week 2* 5.6* 3.8* -0.5*
Electric oven 355.6 -306.4* -128.9* 310*
Adjusted R-squared 0.431 0.201 0.269 0.350
Note: Coefficients marked with * were not statistically significant at the 10% level.
Source: ACIL Allen Consulting

A C I L A L L E N C O N S U L T I N G
ELECTRICITY BILL BENCHMARKS FOR RESIDENTIAL CUSTOMERS 31
Table 11 Benchmarks model - Australian Capital Territory
Variable Summer Autumn Winter Spring
Constant 890.7 1078.3 1757.3 1111.3
2 person household 470.4* 588.7* 301.1* 185.7*
3 person household 840.3 1435.4 1146.6 1055.8
4 person household 1208.8 3425.7 2167.7 1503.5
5 person household 1568.3 2671.7 2256.0 1912.7
Mains gas connected & 1 person -91.5* -125.6* -621.9* -311.7*
Mains gas connected & 2 person 101.1* 256.5* 252.8* 317.6*
Mains gas connected & 3 person -180.4* -995.3 -774.4* -632.6*
Mains gas connected & 4 person -310.6* -2690.0 -1915.1 -786.8*
Mains gas connected & 5 person -440.5* -1562.3* -981.6* -1123.6*
Swimming pool 646.0 826.4 601.3* 489.7*
Adjusted R-squared 0.133 0.186 0.131 0.114
Note: Coefficients marked with * were not statistically significant at the 10% level.
Source: ACIL Allen Consulting
Table 12 Benchmarks model - Australian Capital Territory
Variable Summer Autumn Winter Spring
Constant 848.9 1029.6 1468.6 967.6
2 person household 600.1 873.3 810.0 603.8
3 person household 780.0 922.0 996.7 841.2
4 person household 1018.2 1461.5 1019.6 1058.0
5 person household 1267.6 1514.1 1782.2 1182.3
Swimming pool 630.3 684.5* 558.8* 453.7*
Adjusted R-squared 0.157 0.09 0.08 0.098
Note: Coefficients marked with * were not statistically significant at the 10% level.
Source: ACIL Allen Consulting

A C I L A L L E N C O N S U L T I N G
ELECTRICITY BILL BENCHMARKS FOR RESIDENTIAL CUSTOMERS 32
Table 13 Typical electricity use of Australian Capital Territory households
by size, swimming pool and gas connection – kWh per annum
Season Household size ( persons)
1 2 3 4 5
kWh kWh kWh kWh kWh
Neither gas nor pool
Summer 891 1361 1731 2100 2459
Autumn 1078 1667 2514 4504 3750
Winter 1757 2058 2904 3925 4013
Spring 1111 1297 2167 2615 3024
Gas but no pool
Summer 799 1462 1551 1789 2019
Autumn 953 1924 1518 1814 2188
Winter 1135 2311 2130 2010 3032
Spring 800 1615 1535 1828 1900
Pool but no gas
Summer 1537 2007 2377 2745 3105
Autumn 1905 2493 3340 5330 4576
Winter 2359 2660 3505 4526 4615
Spring 1601 1787 2657 3104 3514
Both pool and gas
Summer 1445 2108 2197 2435 2665
Autumn 1779 2750 2345 2640 3014
Winter 1737 2912 2731 2611 3633
Spring 1289 2104 2024 2318 2390
No pool and no control for gas
Summer 849 1449 1629 1867 2117
Autumn 1030 1903 1952 2491 2544
Winter 1469 2279 2465 2488 3251
Spring 968 1571 1809 2026 2150
Pool and no control for gas
Summer 1479 2079 2259 2497 2747
Autumn 1714 2587 2636 3176 3228
Winter 2027 2837 3024 3047 3810
Spring 1421 2025 2263 2479 2604
Source: ACIL Allen Consulting

A C I L A L L E N C O N S U L T I N G
ELECTRICITY BILL BENCHMARKS FOR RESIDENTIAL CUSTOMERS 33
4.4 Victoria
Table 14 Website model - Victoria
Variable Summer Autumn Winter Spring
Coefficient Coefficient Coefficient Coefficient
Constant -404.3 -311.0 -324.6 -205.3
Household size N=2 73.2* 84* 8.6* 21.1*
Household size N=3 -8.8* 84.5* 126.8* 29.7*
Household size N=4 38.8* 201.4 71.2* 53.8*
Household size N=5 126.7* 346.9 215.7* 220.4
Total rooms in house 56.0 47.3 73.9 43.5
Electric hot water 222.8 309.3 554.9 347.0
AC use % time 3.9 2.0 1.7* 1.4
Operating TVs 57.0 85.2 17.9* 37.9
Swimming pool 531.5 394.0 172.7* 403.5
Electric heating use % time 0.2* 2.6* 5.1* 2.8*
Dishwasher - times used in week 48.5 48.9 55.4 47.8
Solar powered electricity generation -256.7 -123.7 -94.8* -160.0
Refrigerators - number 182.9 186.2 162.0 124.5
% of time appliances left on at wall 0.9 0.6* 0.8* 0.7*
Electric cook top 298.3 357.9 462.2 309.6
Computers - number 89.8 65.2 110.5 72.3
Washing machine - times used in week -0.6* 9.5* 10.4* 5.5*
Separate house 103.3 31.1* 72.9* 93.1
Computer use - total time all computers 1.5 1.5 2.3 1.4
Clothes dryer - times used in week 34.4 29.3 28.2* 35.0
Hours TVs on during the week -0.8* -0.8* -1.1* -0.2*
Electric oven -18* 44.1* 33* 0.3*
Adjusted R-squared 0.554 0.433 0.292 0.454
Note: Coefficients marked with * were not statistically significant at the 10% level.
Source: ACIL Allen Consulting

A C I L A L L E N C O N S U L T I N G
ELECTRICITY BILL BENCHMARKS FOR RESIDENTIAL CUSTOMERS 34
Table 15 Victorian benchmarks model – controlling for gas
Variable Summer Autumn Winter Spring
Constant 841.4 1065.8 1493.9 1053.9
2 person household 522.4 350.2 334.3* 227.1
3 person household 668.1 686.8 1014.2 555.6
4 person household 244* 535.9 166.7* 224.2*
5 person household 1055.1 1419.4 907.6* 1923.2
Mains gas connected & 1 person -170.3* -364.2 -636.0 -419.1
Mains gas connected & 2 person -376.5 -375.0 -670.2 -388.4
Mains gas connected & 3 person -532.9 -669.3 -1215.3 -668.5
Mains gas connected & 4 person 145.3* -219.2* -152.4* -138.4*
Mains gas connected & 5 person -448* -793.7 -625.1* -1599.5
Swimming pool 950.8 812.4 641.5 764.9
Adjusted R-squared 0.249 0.226 0.15 0.249
Note: Coefficients marked with * were not statistically significant at the 10% level.
Source: ACIL Allen Consulting
Table 16 Victorian benchmarks model – not controlling for gas
Variable Summer Autumn Winter Spring
Constant 702.2 767.2 972.5 710.5
2 person household 342.3 330.7 287.1 241.3
3 person household 395.4 467.6 595.1 382.6
4 person household 520.0 633.5 550.5 442.4
5 person household 769.5 962.6 837.5 742.2
Swimming pool 927.5 788.5 601.2 731.6
Adjusted R-squared 0.22 0.189 0.083 0.177
Note: Coefficients marked with * were not statistically significant at the 10% level.
Source: ACIL Allen Consulting

A C I L A L L E N C O N S U L T I N G
ELECTRICITY BILL BENCHMARKS FOR RESIDENTIAL CUSTOMERS 35
Table 17 Typical electricity use of Victoria households by size, swimming
pool and gas connection – kWh per annum
Season Household size ( persons)
1 2 3 4 5
kWh kWh kWh kWh kWh
Neither gas nor pool
Summer 841 1364 1509 1085 1897
Autumn 1066 1416 1753 1602 2485
Winter 1494 1828 2508 1661 2402
Spring 1054 1281 1609 1278 2977
Gas but no pool
Summer 671 987 977 1231 1449
Autumn 477 989 840 866 1103
Winter 858 1158 1293 1508 1776
Spring 635 892 941 1140 1378
Pool but no gas
Summer 1792 2315 2460 2036 2847
Autumn 1878 2228 2565 2414 3298
Winter 2135 2470 3150 2302 3043
Spring 1819 2046 2374 2043 3742
Both pool and gas
Summer 1622 1938 1927 2182 2399
Autumn 1290 1801 1653 1679 1915
Winter 1499 1799 1934 2150 2418
Spring 1400 1657 1706 1905 2143
No pool and no control for gas
Summer 702 1045 1098 1222 1472
Autumn 767 1098 1235 1401 1730
Winter 973 1260 1568 1523 1810
Spring 710 952 1093 1153 1453
Pool and no control for gas
Summer 1630 1972 2025 2150 2399
Autumn 1556 1886 2023 2189 2518
Winter 1574 1861 2169 2124 2411
Spring 1442 1683 1825 1884 2184
Source: ACIL Allen Consulting

A C I L A L L E N C O N S U L T I N G
ELECTRICITY BILL BENCHMARKS FOR RESIDENTIAL CUSTOMERS 36
4.5 Tasmania
Table 18 Website model - Tasmania
Variable Summer Autumn Winter Spring
Coefficient Coefficient Coefficient Coefficient
Constant -716.4* -1607.7 -776.5* -886.5*
Household size N=2 208.9* 307.7* 143.1* 94.5*
Household size N=3 173.6* 612.6 470* 304.9*
Household size N=4 673.6 713.6 841.2 964.7
Household size N=5 399.5 656.8 583.2* 429.2*
Total rooms in house 25.6* 12.1* -1.5* 15.3*
Electric hot water 393.5 454.9 937.4 636.7
AC use % time 7.8 10.4 10.4* 12.5
Operating TVs 55.7* 133.2* 180.1 65.8*
Swimming pool 858.6 2497.6 1512.4 643.2*
Electric heating use % time 0.3* 17.4 13.3* 4*
Dishwasher - times used in week 2.8* 75.3 68.7 30.8*
Solar powered electricity generation -357.0 -136.4* -120.9* -497.1
Refrigerators - number 266.1 150.4* 213.6* 255.3
% of time appliances left on at wall 3.5 4.2* 6.5 6.1
Electric cook top 43.8* -193* -333.3* 58.7*
Computers - number 145.9 274.7 127.5* 80.5*
Washing machine - times used in week 13.2* -41.3* 26.6* 28.1*
Separate house 316.0 -39.3* 315.2* 398*
Computer use - total time all computers -0.5* 1* -2.1* -1.1*
Clothes dryer - times used in week 70.9 137.5 56.6* 68.9*
Hours TVs on during the week -0.1* -1.4* 4* 4.1*
Electric oven 59* 1563.9 735.2* 245.1*
Adjusted R-squared 0.405 0.447 0.273 0.261
Note: Coefficients marked with * were not statistically significant at the 10% level.
Source: ACIL Allen Consulting

A C I L A L L E N C O N S U L T I N G
ELECTRICITY BILL BENCHMARKS FOR RESIDENTIAL CUSTOMERS 37
Table 19 Tasmanian benchmarks model – controlling for gas
Variable Summer Autumn Winter Spring
Constant 1045.5 1374.9 2175.1 1586.8
2 person household 494.7 807.2 624.6 440.8
3 person household 616.6 1130.8 1152.0 858.5
4 person household 1128.8 1307.6 1667.2 1487.6
5 person household 888.6 1350.4 1347.9 1065.7
Mains gas connected & 1 person -629.5* -917.9* -1683.1* -1097.8*
Mains gas connected & 2 person -675* -1835.7 -1344.0 -843.1*
Mains gas connected & 3 person -280.8* -747.3* -718.5* -112.8*
Mains gas connected & 4 person -996.0 -1446.6 -2072.5 -1497.7
Mains gas connected & 5 person -1218.1 -1609.3 -1752* -1562.5
Swimming pool 1532.4 3835.2 2499.0 1462.0
Adjusted R-squared 0.244 0.311 0.188 0.153
Note: Coefficients marked with * were not statistically significant at the 10% level.
Source: ACIL Allen Consulting
Table 20 Tasmanian benchmarks model – not controlling for gas
Variable Summer Autumn Winter Spring
Constant 1031.4 1354.4 2137.5 1562.2
2 person household 479.3 748.3 603.4 428.8
3 person household 612.9 1105.8 1139.9 881.5
4 person household 1013.8 1142.9 1435.9 1317.8
5 person household 725.5 1136.9 1130.7 863.0
Swimming pool 1451.5 3593.5 2346.3 1354.8
Adjusted R-squared 0.207 0.263 0.145 0.126
Note: Coefficients marked with * were not statistically significant at the 10% level.
Source: ACIL Allen Consulting

A C I L A L L E N C O N S U L T I N G
ELECTRICITY BILL BENCHMARKS FOR RESIDENTIAL CUSTOMERS 38
Table 21 Typical electricity use of Tasmania households by size, swimming
pool and gas connection – kWh per annum
Season Household size ( persons)
1 2 3 4 5
kWh kWh kWh kWh kWh
Neither gas nor pool
Summer 1046 1540 1662 2174 1934
Autumn 1375 2182 2506 2682 2725
Winter 2175 2800 3327 3842 3523
Spring 1587 2028 2445 3074 2653
Gas but no pool
Summer 416 865 1381 1178 716
Autumn 457 346 1758 1236 1116
Winter 492 1456 2609 1770 1771
Spring 489 1184 2333 1577 1090
Pool but no gas
Summer 2578 3073 3195 3707 3467
Autumn 5210 6017 6341 6518 6561
Winter 4674 5299 5826 6341 6022
Spring 3049 3490 3907 4536 4115
Both pool and gas
Summer 1948 2398 2914 2711 2248
Autumn 4292 4182 5594 5071 4951
Winter 2991 3955 5108 4269 4270
Spring 1951 2646 3795 3039 2552
No pool and no control for gas
Summer 1031 1511 1644 2045 1757
Autumn 1354 2103 2460 2497 2491
Winter 2137 2741 3277 3573 3268
Spring 1562 1991 2444 2880 2425
Pool and no control for gas
Summer 2483 2962 3096 3497 3208
Autumn 4948 5696 6054 6091 6085
Winter 4484 5087 5624 5920 5614
Spring 2917 3346 3799 4235 3780
Source: ACIL Allen Consulting

A C I L A L L E N C O N S U L T I N G
ELECTRICITY BILL BENCHMARKS FOR RESIDENTIAL CUSTOMERS 39
4.6 South Australia
Table 22 Website model - South Australia
Variable Summer Autumn Winter Spring
Coefficient Coefficient Coefficient Coefficient
Constant -409.0 -199.3* -441.1 -333.4
Household size N=2 173.3 116* 129.4* 88.2*
Household size N=3 241.0 184.3* 311.8 246.0
Household size N=4 163.5* 163.3* 175.7* 273.8
Household size N=5 -104.8* -549.0 121.1* 177.3*
Total rooms in house 78.8 59.3 75.9 53.4
Electric hot water 189.0 53.5* 322.7 283.3
AC use % time 4.5 1.4* 0.9* 0.6*
Operating TVs 46.8* 20.6* 41.9* 33.1*
Swimming pool 747.2 682.1 633.0 534.1
Electric heating use % time 3.2* 6.2 5.9 2.7*
Dishwasher - times used in week 29.6 35.2 45.1 32.9
Solar powered electricity generation -464.2 -270.4 -219.2 -338.7
Refrigerators - number 109.8 92.5 139.2 166.3
% of time appliances left on at wall 1.1* 0.5* 1.1* 0.8*
Electric cook top 54.6* 113.3* 146.7* 117.4*
Computers - number 142.0 84.4 135.0 75.5
Washing machine - times used in week -3* -7.7* 14.1* -3.4*
Separate house 104* 143.8 101* 123*
Computer use - total time all computers 0.4* 2.0 1.5* 0.9*
Clothes dryer - times used in week 57.0 54.4 78.2 62.0
Hours TVs on during the week 1.1* 1* 0* 1.2*
Electric oven 93.8* 38* 143.8* 131.3
Adjusted R-squared 0.442 0.327 0.387 0.439
Note: Coefficients marked with * were not statistically significant at the 10% level.
Source: ACIL Allen Consulting

A C I L A L L E N C O N S U L T I N G
ELECTRICITY BILL BENCHMARKS FOR RESIDENTIAL CUSTOMERS 40
Table 23 South Australian benchmarks model – controlling for gas
Variable Summer Autumn Winter Spring
Constant 1000.0 874.0 1246.7 1016.1
2 person household 582.0 423.0 664.5 432.3
3 person household 597.2 410.6 727.4 454.0
4 person household 667.3 496.9 678.7 744.7
5 person household 2076.7 23.8* 1366.6 1274.1
Mains gas connected & 1 person -227.8 -221.6 -530.4 -477.8
Mains gas connected & 2 person -420.6 -331.0 -794.3 -602.9
Mains gas connected & 3 person 56* 23.4* -281.8* -142*
Mains gas connected & 4 person -109.9* -87.5* -356.9 -543.4
Mains gas connected & 5 person -1761.2 -175.6* -873.7* -961.4
Swimming pool 890.7 778.3 775.7 640.7
Adjusted R-squared 0.266 0.188 0.265 0.309
Note: Coefficients marked with * were not statistically significant at the 10% level.
Source: ACIL Allen Consulting
Table 24 South Australian benchmarks model – not controlling for gas
Variable Summer Autumn Winter Spring
Constant 873.9 750.5 951.4 750.1
2 person household 449.9 340.0 465.5 323.4
3 person household 761.7 549.6 841.1 629.0
4 person household 735.6 567.9 760.8 682.8
5 person household 627.7 -9.4* 881.3 678.3
Swimming pool 835.4 771.8 746.2 615.2
Adjusted R-squared 0.227 0.173 0.182 0.204
Note: Coefficients marked with * were not statistically significant at the 10% level.
Source: ACIL Allen Consulting

A C I L A L L E N C O N S U L T I N G
ELECTRICITY BILL BENCHMARKS FOR RESIDENTIAL CUSTOMERS 41
Table 25 Typical electricity use of South Australia households by size,
swimming pool and gas connection – kWh per annum
Season Household size ( persons)
1 2 3 4 5
kWh kWh kWh kWh kWh
Neither gas nor pool
Summer 1000 1582 1597 1667 3077
Autumn 874 1297 1285 1371 898
Winter 1247 1911 1974 1925 2613
Spring 1016 1448 1470 1761 2290
Gas but no pool
Summer 772 1161 1653 1558 1315
Autumn 652 966 1308 1283 722
Winter 716 1117 1692 1569 1740
Spring 538 845 1328 1217 1329
Pool but no gas
Summer 1891 2473 2488 2558 3967
Autumn 1652 2075 2063 2149 1676
Winter 2022 2687 2750 2701 3389
Spring 1657 2089 2111 2402 2931
Both pool and gas
Summer 1663 2052 2544 2448 2206
Autumn 1431 1744 2086 2062 1501
Winter 1492 1893 2468 2344 2515
Spring 1179 1486 1969 1858 1969
No pool and no control for gas
Summer 874 1324 1636 1609 1502
Autumn 751 1090 1300 1318 741
Winter 951 1417 1793 1712 1833
Spring 750 1073 1379 1433 1428
Pool and no control for gas
Summer 1709 2159 2471 2445 2337
Autumn 1522 1862 2072 2090 1513
Winter 1698 2163 2539 2458 2579
Spring 1365 1689 1994 2048 2044
Source: ACIL Allen Consulting

A C I L A L L E N C O N S U L T I N G
ELECTRICITY BILL BENCHMARKS FOR RESIDENTIAL CUSTOMERS 42
4.7 Northern Territory
Table 26 Website model - Northern Territory
Variable Summer Autumn Winter Spring
Coefficient Coefficient Coefficient Coefficient
Constant -351.3* -411.9* -63.2* -354.9*
Household size N=2 61* 722.4 471.2 285.8*
Household size N=3 44.8* 615.9* 196* 179.4*
Household size N=4 -172* 106.3* 311.7* 67.7*
Household size N=5 230.9* 1616.8 608.8* 644.1*
Total rooms in house 11.1* 11* -10.5* 8.5*
Electric hot water 254.1* 449.4 419.9 364.2
AC use % time 12.4 11.2 6.8 10.8
Operating TVs -19.2* 41.9* 59.9* -43.6*
Swimming pool 433.7 906.7 628.2 685.0
Electric heating use % time -6.5* 21.2* 0.6* 8.4*
Dishwasher - times used in week 47.7* -52.4* 7* -5.7*
Solar powered electricity generation -522.5 -434.3* -496.8 -535.0
Refrigerators - number 294.1 392.5 199.0 361.9
% of time appliances left on at wall 4.6 2.5* -0.1* 3.1*
Electric cook top 107.2* -105.8* -121.8* -25.1*
Computers - number 72.2* -78.1* 86.6* -13.6*
Washing machine - times used in week 43.3* 30.8* 20.3* 29.1*
Separate house 438.3 -116.1* 197.4* 277.5*
Computer use - total time all computers -1.7* -0.6* -0.4* -0.1*
Clothes dryer - times used in week 134.9 48.9* 43.7* 44.6*
Hours TVs on during the week 9.1 2.9* 1.4* 10.6
Electric oven -461.0 -124.1* -42.5* -309.3*
Adjusted R-squared 0.533 0.437 0.443 0.491
Note: Coefficients marked with * were not statistically significant at the 10% level.
Source: ACIL Allen Consulting

A C I L A L L E N C O N S U L T I N G
ELECTRICITY BILL BENCHMARKS FOR RESIDENTIAL CUSTOMERS 43
Table 27 Northern Territory (pooled data) benchmarks model – not
controlling for gas
Variable Summer Autumn Winter Spring
Constant 949.8 793.1 800.0 969.4
2 person household 812.8 960.2 724.4 781.0
3 person household 1106.5 813.3 565.4 756.0
4 person household 1265.5 824.7 887.9 981.1
5 person household 2207.4 2350.0 1517.5 1833.2
Swimming pool 427.9 710.7 591.7 507.5
Adjusted R-squared 0.533 0.437 0.443 0.491
Note: Coefficients marked with * were not statistically significant at the 10% level.
Source: ACIL Allen Consulting
Table 28 Typical electricity use of Northern Territory households by size,
swimming pool and gas connection – kWh per annum
Season Household size ( persons)
1 2 3 4 5
kWh kWh kWh kWh kWh
No pool
Summer 950 1763 2056 2215 3157
Autumn 793 1753 1606 1618 3143
Winter 800 1524 1365 1688 2318
Spring 969 1750 1725 1951 2803
Pool
Summer 1378 2191 2484 2643 3585
Autumn 1504 2464 2317 2328 3854
Winter 1392 2116 1957 2280 2909
Spring 1477 2258 2233 2458 3310
Source: ACIL Allen Consulting

A C I L A L L E N C O N S U L T I N G
ELECTRICITY BILL BENCHMARKS FOR RESIDENTIAL CUSTOMERS 44
5 Conclusion
For benchmarks to be effective in reducing customers’ electricity use they must be accurate
and simple.
The explanatory power of the benchmarks is improved by adopting different benchmarks
each season. This introduces the problem of ‘billing lag’ because electricity meters are read
progressively and thus do not align to seasons neatly.
Further, as more factors are added to a benchmark, or as a customer’s ‘group’ is defined
more precisely, the benchmark becomes more accurate but less simple. Choosing the
appropriate number of factors is a trade-off between these two competing objectives.
The benchmarks we have estimated are the average consumption for households in
‘groups’ where the groups are defined by reference to:
household size
connection to mains gas
presence of a swimming pool.
In all cases we recommend that benchmarks be calculated, and presented on bills, based
on the assumption that the householder does not have a swimming pool. Swimming pools
are associated with substantially increased electricity use, but only a small proportion of
households have them. If the benchmarks were calculated without controlling for swimming
pools, householders with swimming pools would be set benchmarks that are well below
what they use on average. On the other hand, the benchmarks would give households
without swimming pools unnecessary ‘head room’ in the benchmarks.
The ideal approach in relation to a gas connection is less clear as more people have gas
connected than have swimming pools. Ideally customers would have access to a
benchmark that corresponds with whether or not they have gas connected. This could be
achieved by printing both the ‘gas’ and ‘no gas’ benchmarks on the bills. It could also be
achieved by ensuring that bills sent to individual customers with gas show the ‘gas’
benchmarks and bills sent to customers without gas show the ‘no gas’ benchmark.
Both approaches have drawbacks. The first approach would double the space required to
print benchmarks on the retail bills and the second would add complexity for the retailers,
who must already choose the correct benchmark for the customer’s localised zone
(postcode) and would then also need to determine whether each customer has a gas
connection. This would be especially problematic for customers who have different retailers
for electricity and gas.

A C I L A L L E N C O N S U L T I N G
ELECTRICITY BILL BENCHMARKS FOR RESIDENTIAL CUSTOMERS A-1
Appendix A Household Questionnaire
S1
How long have you lived at your current address?
Less than a year (1) – screen out
1 year but less than 2 years (2)
2 to 5 years (3)
More than 5 years (4)
S1b
Has this house been occupied by you for most of the year – normal vacations etc excepted?
No – screen out
Yes
S2
Do you contribute to paying the electricity bill and/or decisions about using electricity?
Yes (1)
No (2) – screen out
S3
Do you have your last electricity bill in front of you? We need to ask you a couple of questions about your bill. This
should be the bill for the place you live. Please answer all questions about the place you live.
If you do not have your bill handy, please close your browser. Once you have your bill you will be able to click on the
survey link and return to the survey.
Selecting “No” below will terminate the survey.
Yes (1)
No (2) – screen out
S3b
To make sure we survey a good cross-section of Australian households, we need to ask a few questions about you. In
which state do you live?
NSW (1)
VIC (2)
QLD (3)
SA (4)
WA (5)
TAS (6)
ACT (7)
NT (8)

A C I L A L L E N C O N S U L T I N G
ELECTRICITY BILL BENCHMARKS FOR RESIDENTIAL CUSTOMERS A-2
D1
What best describes where you live?
Rural/not in a town or city (1)
Small regional centre (2)
Major regional centre (3)
State capital city (4)
D2
What is your gender?
Male (1)
Female (2)
D3
Into which of these age groups do you fall?
18-19 years (1)
20-29 years (2)
30-39 years (3)
40-44 years (4)
45-54 years (5)
55-64 years (6)
65-79 years (7)
80+ years (8)
B38
How many people live in the house (Total number including you. Include all adults, children, infants irrespective of
relationships) (1)
D4
What is the highest level of education that you have completed?
Did not attend highest level of secondary school available (1)
Attended highest level of secondary school available (2)
Trade certificate or apprenticeship (3)
Other certificate or diploma (4)
Other post school qualification (5)
Bachelor’s degree (6)
Post graduate degree (7)
Other (specify) (8)____________
S4 - S4
Do you have solar panels that generate electricity that you use in your house?
Yes
No
S5 – S5
Do you get a rebate or discount on your electricity bill?

A C I L A L L E N C O N S U L T I N G
ELECTRICITY BILL BENCHMARKS FOR RESIDENTIAL CUSTOMERS A-3
Yes
No
If yes, what is it?
This survey will be used to better understand household energy use and to develop electricity use benchmarks to be
used by Australian Governments in their efforts to help Australian electricity customers become more energy efficient.
The benchmarks are being prepared by consultants ACIL Allen Consulting.
[NT intro] In order to do this, your consent is required to get your energy consumption data for 12 to 36 months from
Power and Water Corporation by matching to your meter number.
[NSW, VIC, ACT, SA, QLD, TAS, WA intro] In order to do this, your consent is required to get your energy consumption
data for 12 to 36 months from your distributor and/or retailer by matching to your meter.
[ALL] Your energy consumption data will then be matched to your responses by the research team to analyse energy use by
households and develop National Energy Use Benchmarks.
[ALL] The information will be de-identified to protect your privacy, and used by the Australian Energy Regulator to finalise
the benchmarks as well as inform energy policy.
Do you give your consent for your electricity consumption data to be provided by energy distributor and/or retailer to
ACIL Allen and the Australian Energy Regulator understanding that you will not be identifiable?
Yes (1)
No (2) – screen out if No
S6 - S6
[For Northern Territory] Please enter the Customer ID from your electricity bill. The Customer ID is a 9-digit number with
a dash on your bill (may include some zeros at the start).
[Tasmania] Please enter your NMI number from your electricity bill (this is not your account number). The NMI number is a 10-digit
number on your bill (some may include letters). This number is also referred to as a National Meter Identifier or Meter Number.
[NSW, ACT, VIC, QLD, SA] Please enter your NMI number from your electricity bill l (this is not your account number). The NMI
number is an 11-digit number on your bill (some may include letters). This number is also referred to as a National Meter Identifier or
Meter Number."
[WA] Please enter your account number from your electricity bill. Your number is a 9-digit number on your bill (some may
include letters).
Please take care entering the "Customer ID":"NMI". It is very important for the study that this is accurate.
S8 - S8
Do you have mains gas connected to your house?
Yes (1)
No (2)
Don’t Know (9)
A10 - A10
How much of the power you currently BUY is GreenPower?

A C I L A L L E N C O N S U L T I N G
ELECTRICITY BILL BENCHMARKS FOR RESIDENTIAL CUSTOMERS A-4
None (1)
Some but less than a quarter (2)
About a quarter (3)
About half (4)
About three quarters (5)
Almost all (6)
All (7)
Don’t Know (9)
A11
Please rate your agreement to the following statement:
“I know how much electricity our household uses compared to similar households”.
Strongly disagree (1)
Disagree (2)
Neutral (3)
Agree (4)
Strongly agree (5)
A12
Please rate your agreement to the following statement:
“Compared to households like ours, the amount of electricity we use is ...”
Much more (1)
A bit more (2)
About the same (3)
A bit less (4)
A lot less (5)
A13
Is there someone in your house that actively monitors electricity use through such means as telephone apps, computer programs,
remote access or frequent readings?
Yes (1)
No (2)
B1 - B1
Which of the following do you have in your home?
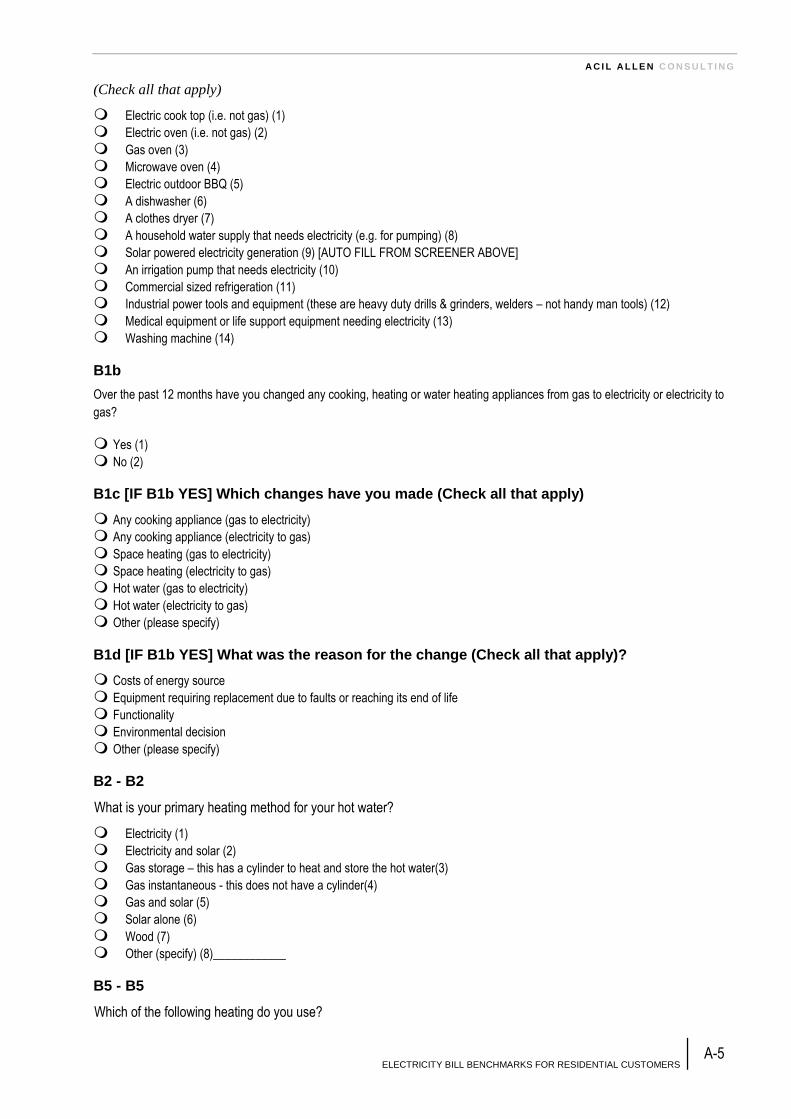
A C I L A L L E N C O N S U L T I N G
ELECTRICITY BILL BENCHMARKS FOR RESIDENTIAL CUSTOMERS A-5
(Check all that apply)
Electric cook top (i.e. not gas) (1)
Electric oven (i.e. not gas) (2)
Gas oven (3)
Microwave oven (4)
Electric outdoor BBQ (5)
A dishwasher (6)
A clothes dryer (7)
A household water supply that needs electricity (e.g. for pumping) (8)
Solar powered electricity generation (9) [AUTO FILL FROM SCREENER ABOVE]
An irrigation pump that needs electricity (10)
Commercial sized refrigeration (11)
Industrial power tools and equipment (these are heavy duty drills & grinders, welders – not handy man tools) (12)
Medical equipment or life support equipment needing electricity (13)
Washing machine (14)
B1b
Over the past 12 months have you changed any cooking, heating or water heating appliances from gas to electricity or electricity to
gas?
Yes (1)
No (2)
B1c [IF B1b YES] Which changes have you made (Check all that apply)
Any cooking appliance (gas to electricity)
Any cooking appliance (electricity to gas)
Space heating (gas to electricity)
Space heating (electricity to gas)
Hot water (gas to electricity)
Hot water (electricity to gas)
Other (please specify)
B1d [IF B1b YES] What was the reason for the change (Check all that apply)?
Costs of energy source
Equipment requiring replacement due to faults or reaching its end of life
Functionality
Environmental decision
Other (please specify)
B2 - B2
What is your primary heating method for your hot water?
Electricity (1)
Electricity and solar (2)
Gas storage – this has a cylinder to heat and store the hot water(3)
Gas instantaneous - this does not have a cylinder(4)
Gas and solar (5)
Solar alone (6)
Wood (7)
Other (specify) (8)____________
B5 - B5
Which of the following heating do you use?
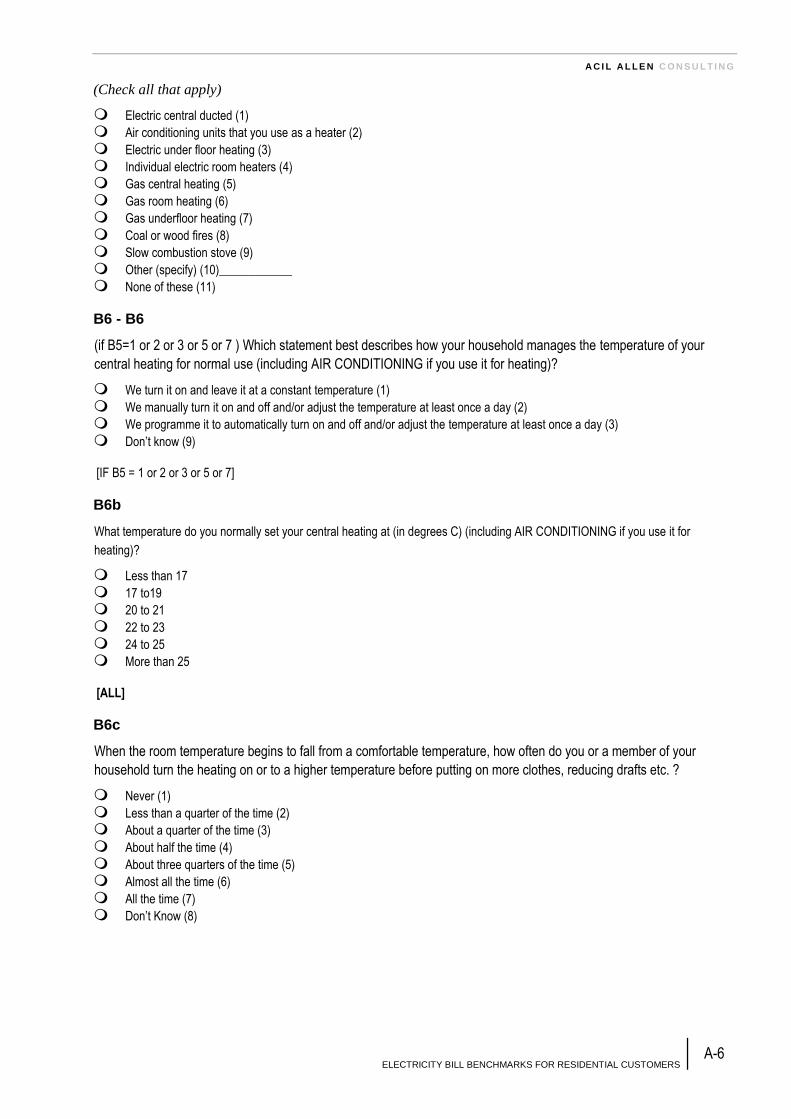
A C I L A L L E N C O N S U L T I N G
ELECTRICITY BILL BENCHMARKS FOR RESIDENTIAL CUSTOMERS A-6
(Check all that apply)
Electric central ducted (1)
Air conditioning units that you use as a heater (2)
Electric under floor heating (3)
Individual electric room heaters (4)
Gas central heating (5)
Gas room heating (6)
Gas underfloor heating (7)
Coal or wood fires (8)
Slow combustion stove (9)
Other (specify) (10)____________
None of these (11)
B6 - B6
(if B5=1 or 2 or 3 or 5 or 7 ) Which statement best describes how your household manages the temperature of your
central heating for normal use (including AIR CONDITIONING if you use it for heating)?
We turn it on and leave it at a constant temperature (1)
We manually turn it on and off and/or adjust the temperature at least once a day (2)
We programme it to automatically turn on and off and/or adjust the temperature at least once a day (3)
Don’t know (9)
[IF B5 = 1 or 2 or 3 or 5 or 7]
B6b
What temperature do you normally set your central heating at (in degrees C) (including AIR CONDITIONING if you use it for
heating)?
Less than 17
17 to19
20 to 21
22 to 23
24 to 25
More than 25
[ALL]
B6c
When the room temperature begins to fall from a comfortable temperature, how often do you or a member of your
household turn the heating on or to a higher temperature before putting on more clothes, reducing drafts etc. ?
Never (1)
Less than a quarter of the time (2)
About a quarter of the time (3)
About half the time (4)
About three quarters of the time (5)
Almost all the time (6)
All the time (7)
Don’t Know (8)

A C I L A L L E N C O N S U L T I N G
ELECTRICITY BILL BENCHMARKS FOR RESIDENTIAL CUSTOMERS A-7
B7 - B7
Are you connected to an off-peak tariff? (see on the bill)
Yes (1)
No (2)
Don’t know (9)
B8 - B8
What type of cooling do you have?
(Check all that apply)
Air conditioning (refrigerant, you don’t need to add water to it) (1)
Evaporative cooling – you need to keep adding water (2)
Ceiling or pedestal fans (3)
None (4)
B12 - B12
(if B8 = 1 or 2) Which statement best describes how your household manages the temperature of your air conditioning
for normal use?
We turn it on and leave it at a constant temperature (1)
We manually turn it on and off and/or adjust the temperature at least once a day (2)
We programme it to automatically turn on and off and/or adjust the temperature at least once a day (3)
Don’t know (9)
B13 - B13
[if B8 = 1 or 2] Is your air conditioner:
Gas (1)
Electric (2)
Don’t Know (9)
B14 - B14
[if B8 = 1 or 2] What sort of air conditioner do you have (you may have more than one)?
(Check all that apply)
Room air conditioner - (Cooling unit is mounted on the wall or in a window) (1)
Split system - (Cooling unit is mounted outside and outlet(s) is/are mounted in the wall) (2)
Ducted - (Multiple rooms are cooled by air blown through ducts) (3)
Portable (4)
Other (5) Please specify
Don’t know (9)
B15 - B15
if B8 = 1
Is your air conditioning reverse cycle? (the system can be used to heat or cool)
Yes (1)
Partially (2)
No (3)
Don’t know (9)
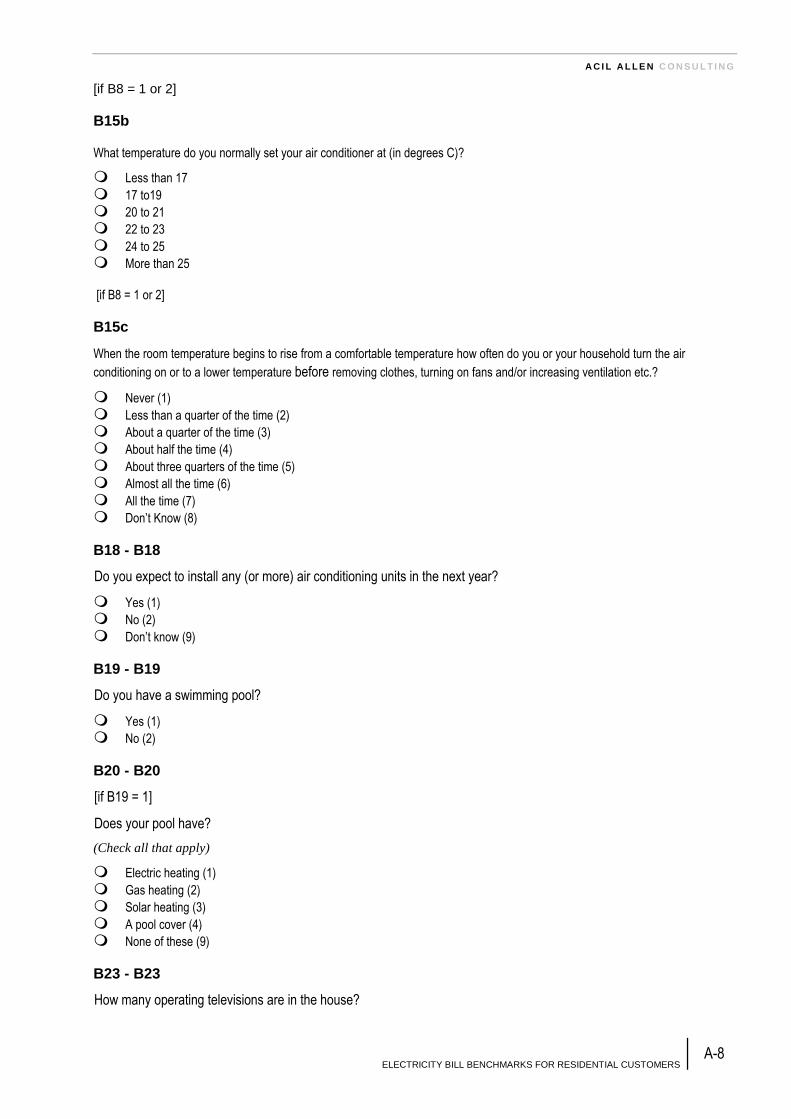
A C I L A L L E N C O N S U L T I N G
ELECTRICITY BILL BENCHMARKS FOR RESIDENTIAL CUSTOMERS A-8
[if B8 = 1 or 2]
B15b
What temperature do you normally set your air conditioner at (in degrees C)?
Less than 17
17 to19
20 to 21
22 to 23
24 to 25
More than 25
[if B8 = 1 or 2]
B15c
When the room temperature begins to rise from a comfortable temperature how often do you or your household turn the air
conditioning on or to a lower temperature before removing clothes, turning on fans and/or increasing ventilation etc.?
Never (1)
Less than a quarter of the time (2)
About a quarter of the time (3)
About half the time (4)
About three quarters of the time (5)
Almost all the time (6)
All the time (7)
Don’t Know (8)
B18 - B18
Do you expect to install any (or more) air conditioning units in the next year?
Yes (1)
No (2)
Don’t know (9)
B19 - B19
Do you have a swimming pool?
Yes (1) No (2)
B20 - B20
[if B19 = 1]
Does your pool have?
(Check all that apply)
Electric heating (1)
Gas heating (2)
Solar heating (3)
A pool cover (4)
None of these (9)
B23 - B23
How many operating televisions are in the house?

A C I L A L L E N C O N S U L T I N G
ELECTRICITY BILL BENCHMARKS FOR RESIDENTIAL CUSTOMERS A-9
(1) ______________________________
[if B23 >0]
B24a - B24a
How many of those televisions are flat screen LCD or Plasma
(You must enter a number or zero in each box)
Plasma (1) ______________________________
LCD (2) ______________________________
LED (latest technology) (3) ______________________________
B24c - B24c
[if B23 >0]
Please estimate how many hours in total your household TVs were turned on last week whether the TVs were being
watched or not? Make an estimate of the time an average TV was in use and multiply by the number of TVs.
None (0)
One (1)
2 to 3 (2)
4 to 5 (3)
6 to 7 (4)
8 to 10 (5)
11 to 15 (6)
16 to 30 (7)
31 to 60 (8)
61 to 120 (9)
More than 120 (10)
B25 - B25
How many of the following do you have in the household?
(You must enter a number or zero in each box)
Refrigerators in constant operation (1) ______________________________
Computers including laptops in regular use (2) ______________________________
Tablets and mobile phones in regular use (3) ______________________________
B26 - B26 [if B25(2) >0]
Please estimate how many hours in total your household computers were on last week whether they were being used or
not? – make an estimate of the time an average computer was in use and multiply by the number of computers

A C I L A L L E N C O N S U L T I N G
ELECTRICITY BILL BENCHMARKS FOR RESIDENTIAL CUSTOMERS A-10
None (0)
One (1)
2 to 3 (2)
4 to 5 (3)
6 to 7 (4)
8 to 10 (5)
11 to 15 (6)
16 to 30 (7)
31 to 60 (8)
61 to 120 (9)
More than 120 (10)
B26b - B26b
Some equipment, particularly computers, TVs and anything with a remote control or external transformer (phone, iPod,
iPad and other chargers, portable telephones) will use power unless turned off at the wall. Thinking of all this type of
equipment in your house on average how much of the time are they turned off at or disconnected from the wall?
None (1)
Some but less than a quarter (2)
About a quarter (3)
About half (4)
About three quarters (5)
All (6)
Don’t know (9)
B26c
Please select the number of energy saving devices such as energy monitors, standby energy saving power boards,
small solar powered battery and device chargers, dryer balls etc. in regular use in your household?
None (0)
1 (1)
2-3 (2)
4-5 (3)
6-7 (4)
8 or more (5)

A C I L A L L E N C O N S U L T I N G
ELECTRICITY BILL BENCHMARKS FOR RESIDENTIAL CUSTOMERS A-11
B27 - B27
[ASK ONLY THOSE THAT APPLY]
In the last week, how many times did you use…?
None (0) One (1) 2 - 3 (2) 4 - 5 (3) 6 - 7 (4)
8 - 10 (5)
11 - 15 (6)
16 -30 (7)
More than 30 (8)
B1=6 Dishwasher (1)
B1=14 Washing machine (2)
B1=7 Clothes dryer (3)
B28 - B28
What proportion of the lights in your house are the following:
None (1)
Some but less than a quarter (2)
About a quarter (3)
About half (4)
About three quarters (5)
Almost all (6)
All (7) Don’t know
(9)
Conventional halogen down
lights (flush with ceiling) (1)
Compact (energy saving)
LED fluorescent lights
(globes and down lights) (2)
B29 - B29
Which of the following do you have?
(Check all that apply)
Roof insulation (1)
Under-floor insulation (2)
Wall insulation (3)
None (8)
Don’t know (9)
B32 - B32
What proportions of the external walls are…?
(Note: Indications of proportions is all that is required and need not sum to exactly 100%)
None (1)
Some but less than a quarter (2)
About a quarter (3)
About half (4)
About three quarters (5)
All (6) Don’t know
(9)
Glass (1)
Double brick (2)
Brick veneer (3)
Weather board (4)
Fibro cement (5)
Other (6)

A C I L A L L E N C O N S U L T I N G
ELECTRICITY BILL BENCHMARKS FOR RESIDENTIAL CUSTOMERS A-12
B33 - B33
What proportions of the following are protected by...?
None (1)
Some but less than a quarter (2)
About a quarter (3)
About half (4)
About three quarters (5)
All (6) Don’t know
(9)
Windows - double glazed, thermally insulated, tinted and/or solar guarded
Windows - shaded with awnings or shutter, have curtains and/or blinds
External doors - with draft protectors
B35 - B35
What proportion of the time is anyone at home?
None (1)
Some but less than a quarter (2)
About a quarter (3)
About half (4)
About three quarters (5)
Almost all (6)
All (7) Don’t know
(9)
During a typical working day (1)
During week nights (2)
During the weekend (3)
B36 - B36
What type of dwelling do you live in?
Separate house (1) Semi-detached townhouse, row, terrace house, townhouse, villa etc (2) Flat, apartment, unit (3) Other (specify) (4)____________
B37 - B37
How many of the following are in the house?
Bed rooms (1) ______________________________
Bath rooms (2) ______________________________
Other rooms (living rooms, dining rooms, kitchens but exclude separate
toilets etc) (3) ______________________________
Floors (that you occupy – exclude basements and rooftop terraces) (4) ______________________________
B40 - B40
How would you describe your household?
Family members only (1) Family and others who are not family (2) Shared household (not related to each other) (3) Other (specify) (4)____________

A C I L A L L E N C O N S U L T I N G
ELECTRICITY BILL BENCHMARKS FOR RESIDENTIAL CUSTOMERS A-13
B42
[if B8 = 1 or 2]
What proportion of the time did you use AIR CONDITIONING during the following months of last year? Please take into
account seasonal variations and the length of time it is off because you are away and the extent that you switch it on or
off during the day. (Note, your best estimate will be sufficient)
None (1)
Some but less than a quarter (2)
About a quarter (3)
About half (4)
About three quarters (5)
Almost all (6)
All (7) Don’t know
(9)
1 December to 28
February (1)
1 March to 31 May (2)
1 June to 31 August (3)
1 September to 30
November (4)
B42b - B42b
[IF B5 = 1 or 2 or 3 or 4] What proportion of the time did you use ELECTRIC HEATING during the following months of
last year? INCLUDE THE TIME AIR CONDITIONERS WERE USED FOR HEATING. Please take into account seasonal
variations and the length of time it is off because you are away and the extent that you switch it on or off during the day.
None (1)
Some but less than a quarter (2)
About a quarter (3)
About half (4)
About three quarters (5)
Almost all (6)
All (7) Don’t know
(9)
1 December to 28
February (1)
1 March to 31 May (2)
1 June to 31 August (3)
1 September to 30
November (4)
B42C - B42C
[IF B5 = 5 or 6 or 7] What proportion of the time did you use GAS HEATING during the following months of last year?
INCLUDE THE TIME GAS AIR CONDITIONERS WERE USED FOR HEATING. Please take into account seasonal
variations and the length of time it is off because you are away and the extent that you switch it on or off during the day.
None (1)
Some but less than a quarter (2)
About a quarter (3)
About half (4)
About three quarters (5)
Almost all (6)
All (7) Don’t know
(9)
1 December to 28
February (1)
1 March to 31 May (2)
1 June to 31 August (3)
1 September to 30
November (4)

A C I L A L L E N C O N S U L T I N G
ELECTRICITY BILL BENCHMARKS FOR RESIDENTIAL CUSTOMERS A-14
TIME OF USE QUESTIONS
B42cc
On a typical summer week day (non-holiday), how many people are at home during the nominated times. Count people
who arrive or leave during that time as being there the whole time. Include all family members (children, friends and any
others).
None (1) 1 (2) 2 (3) 3-4(4) 5-6(5) 7-9(6) 10 or more
(7) Don’t know
(9)
7 am to 9 am
9 am to 12 pm
12 pm to 3 pm
3 pm to 6 pm
6 pm to 9 pm
9 pm to 11 pm
11 pm to 7 am
B43a
On a typical summer weekend (non-holiday), how many people are at home during the nominated times. Count people
who arrive or leave during that time as being there the whole time. Include all family members (children, friends and any
others).
None (1) 1 (2) 2 (3) 3-4 (4) 5-6 (5) 7-9 (6) 10 or more
(7) Don’t know
(9)
7 am to 9 am
9 am to 12 pm
12 pm to 3 pm
3 pm to 6 pm
6 pm to 9 pm
9 pm to 11 pm
11pm to 7am
B43c
Are times and numbers of people home DIFFERENT for a typical winter’s week day than a typical summer week day?
1 Yes 2 No
9 Don’t know
[If YES OR DON’T KNOW]
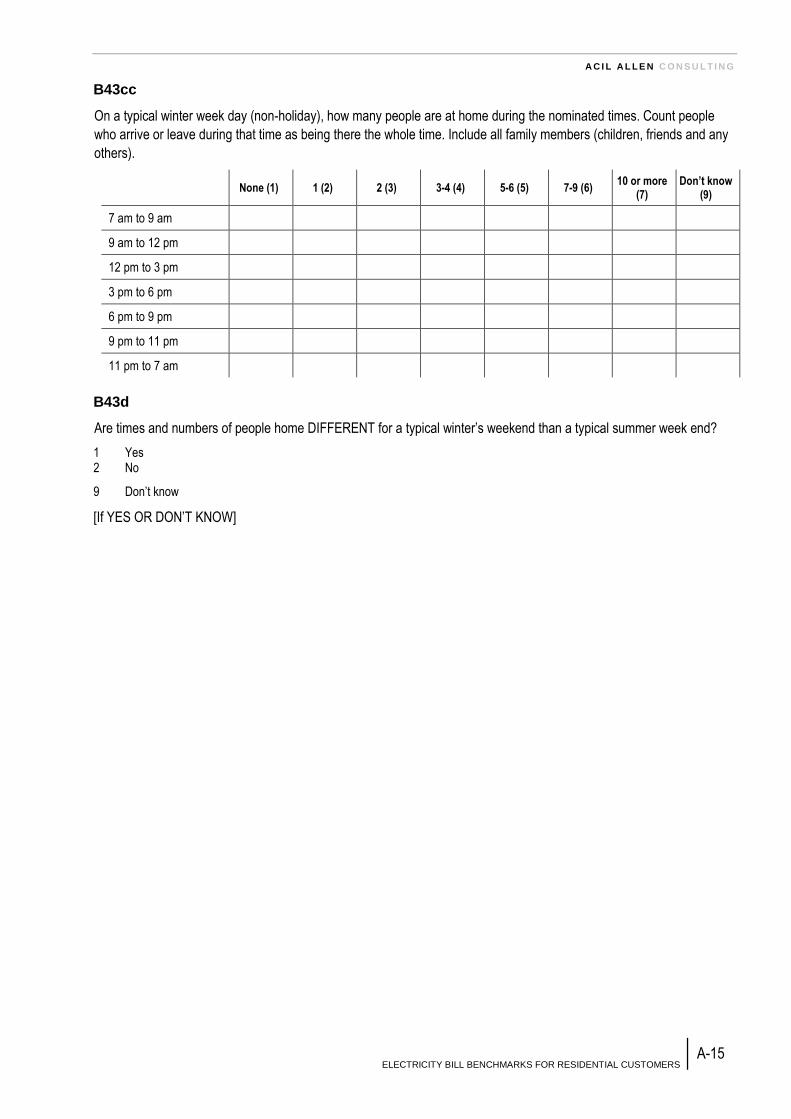
A C I L A L L E N C O N S U L T I N G
ELECTRICITY BILL BENCHMARKS FOR RESIDENTIAL CUSTOMERS A-15
B43cc
On a typical winter week day (non-holiday), how many people are at home during the nominated times. Count people
who arrive or leave during that time as being there the whole time. Include all family members (children, friends and any
others).
None (1) 1 (2) 2 (3) 3-4 (4) 5-6 (5) 7-9 (6) 10 or more
(7) Don’t know
(9)
7 am to 9 am
9 am to 12 pm
12 pm to 3 pm
3 pm to 6 pm
6 pm to 9 pm
9 pm to 11 pm
11 pm to 7 am
B43d
Are times and numbers of people home DIFFERENT for a typical winter’s weekend than a typical summer week end?
1 Yes 2 No
9 Don’t know
[If YES OR DON’T KNOW]
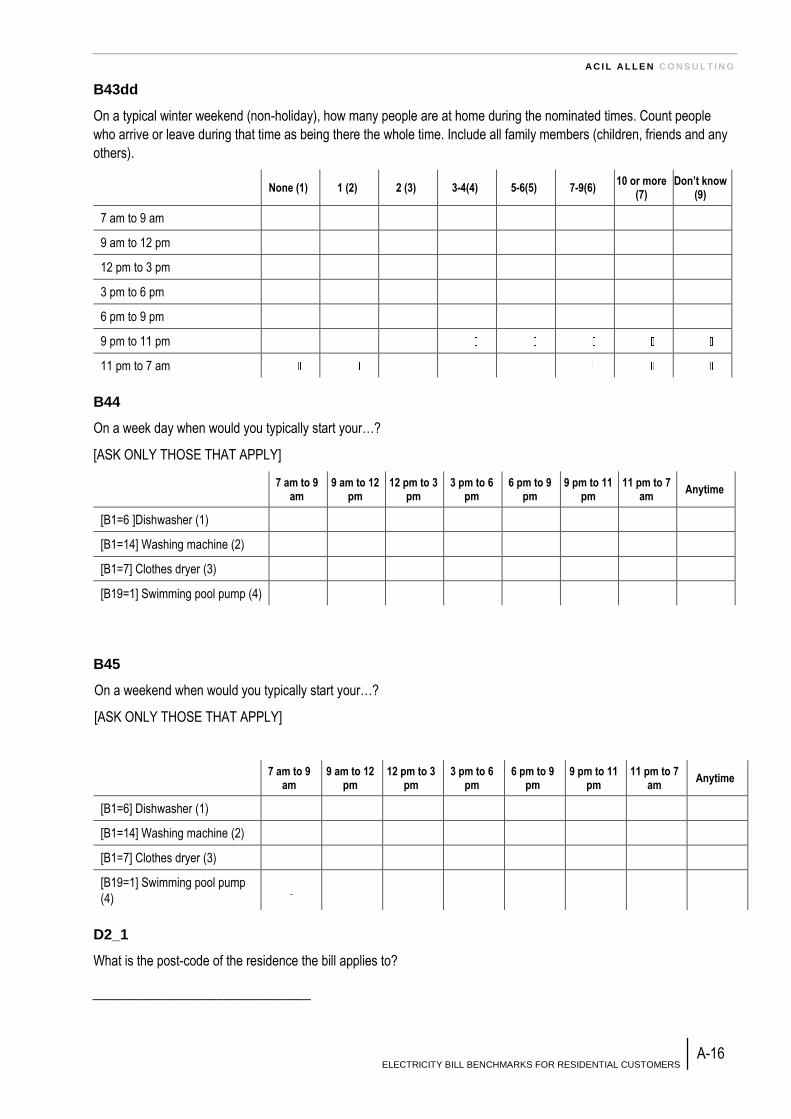
A C I L A L L E N C O N S U L T I N G
ELECTRICITY BILL BENCHMARKS FOR RESIDENTIAL CUSTOMERS A-16
B43dd
On a typical winter weekend (non-holiday), how many people are at home during the nominated times. Count people
who arrive or leave during that time as being there the whole time. Include all family members (children, friends and any
others).
None (1) 1 (2) 2 (3) 3-4(4) 5-6(5) 7-9(6) 10 or more
(7) Don’t know
(9)
7 am to 9 am
9 am to 12 pm
12 pm to 3 pm
3 pm to 6 pm
6 pm to 9 pm
9 pm to 11 pm
11 pm to 7 am
B44
On a week day when would you typically start your…?
[ASK ONLY THOSE THAT APPLY]
7 am to 9 am
9 am to 12 pm
12 pm to 3 pm
3 pm to 6 pm
6 pm to 9 pm
9 pm to 11 pm
11 pm to 7 am
Anytime
[B1=6 ]Dishwasher (1)
[B1=14] Washing machine (2)
[B1=7] Clothes dryer (3)
[B19=1] Swimming pool pump (4)
B45
On a weekend when would you typically start your…?
[ASK ONLY THOSE THAT APPLY]
7 am to 9 am
9 am to 12 pm
12 pm to 3 pm
3 pm to 6 pm
6 pm to 9 pm
9 pm to 11 pm
11 pm to 7 am
Anytime
[B1=6] Dishwasher (1)
[B1=14] Washing machine (2)
[B1=7] Clothes dryer (3)
[B19=1] Swimming pool pump
(4)
D2_1
What is the post-code of the residence the bill applies to?
______________________________

A C I L A L L E N C O N S U L T I N G
ELECTRICITY BILL BENCHMARKS FOR RESIDENTIAL CUSTOMERS A-17
B39 - B39
(if B38 >1) How many, including you, are
(Note: leave no blank fields - enter 0 if none)
(if B38=1 Auto fill the fields with Adult=1 else= 0)
Adults (1) ______________________________
Adult offspring (2) ______________________________
Children 13 to 17 years (3) ______________________________
Children 5 to 12 years (4) ______________________________
Children 0 to 4 years (5) ______________________________
D6 - D6
Do you receive a government pension or benefit (other than family benefit)?
Yes (1) No (2)
D8 - D8
What is your current work status?
Work full time (for money) (1) Work part time (for money) (2) Unemployed (3) Household duties only (4) Retired (self-supporting) (5) Full time student (6) Other pensioner (7) Other (specify) (8)____________
D10 - D10
What is the gross (before tax) annual family income? If you live with a partner, it will be the joint income, otherwise your
income alone
Negative/nil income (1) $1 to $10,499 (2) $10,500 to $15,499 (3) $15,500 to $20,499 (4) $20,500 to $25,999 (5) $26,000 to $30,999 (6) $31,000 to $36,499 (7) $36,500 to $41,499 (8) $41,500 to $51,999 (9) $52,000 to $62,499 (10) $62,500 to $77,999 (11) $78,000 to $103,999 (12) $104,000 to $129,999 (13) $130,000 to $155,999 (14) $156,000 or more (15) Don’t know / Prefer not to say (98)

A C I L A L L E N C O N S U L T I N G
ELECTRICITY BILL BENCHMARKS FOR RESIDENTIAL CUSTOMERS A-18
D11 - D11
How far do you live from a harbour or the sea?
Less than 5km (1) 5km to 20 km (2) 20km to 50 km (3) 50km to 100 km (4) Greater than 100 km (5)
THANK YOU FOR ANSWERING THESE QUESTIONS. PLEASE CLICK THE ‘NEXT’
BUTTON BELOW TO FINISH THE SURVEY.

A C I L A L L E N C O N S U L T I N G
ELECTRICITY BILL BENCHMARKS FOR RESIDENTIAL CUSTOMERS B-1
Appendix B Benchmark zones
The following sections summarise the zones in which benchmarks were calculated. The
zones were determined by jurisdictional Energy Ministers. The lists are at the postcode
level, which reflects the way data were collected. However, in some cases postcodes
overlap zones (i.e. one postcode can be in more than on zone). In this respondents from
affected postcodes were assigned to climate zones randomly.
B.1 Queensland
Queensland chose to continue with the localised zones used in the first benchmarking
exercise.
Table B1 Queensland localised zones
Postcode Localised Zone Name
4000 Brisbane
4005 Brisbane
4006 Brisbane
4007 Brisbane
4008 Brisbane
4009 Brisbane
4010 Brisbane
4011 Brisbane
4012 Brisbane
4013 Brisbane
4014 Brisbane
4017 Brisbane
4018 Brisbane
4019 Brisbane
4020 Brisbane
4021 Brisbane
4022 Brisbane
4030 Brisbane
4031 Brisbane
4032 Brisbane
4034 Brisbane
4035 Brisbane
4036 Brisbane
4037 Brisbane
4051 Brisbane
4053 Brisbane
4054 Brisbane
4055 Brisbane
4059 Brisbane
4060 Brisbane
4061 Brisbane
Postcode Localised Zone Name
4064 Brisbane
4065 Brisbane
4066 Brisbane
4067 Brisbane
4068 Brisbane
4069 Brisbane
4070 Brisbane
4073 Brisbane
4074 Brisbane
4075 Brisbane
4076 Brisbane
4077 Brisbane
4078 Brisbane
4101 Brisbane
4102 Brisbane
4103 Brisbane
4104 Brisbane
4105 Brisbane
4106 Brisbane
4107 Brisbane
4108 Brisbane
4109 Brisbane
4110 Brisbane
4111 Brisbane
4112 Brisbane
4113 Brisbane
4114 Brisbane
4115 Brisbane
4116 Brisbane
4117 Brisbane
4118 Brisbane

A C I L A L L E N C O N S U L T I N G
ELECTRICITY BILL BENCHMARKS FOR RESIDENTIAL CUSTOMERS B-2
Postcode Localised Zone Name
4119 Brisbane
4120 Brisbane
4121 Brisbane
4122 Brisbane
4123 Brisbane
4124 Brisbane
4125 Brisbane
4127 Brisbane
4128 Brisbane
4129 Brisbane
4130 Brisbane
4131 Brisbane
4132 Brisbane
4133 Brisbane
4151 Brisbane
4152 Brisbane
4153 Brisbane
4154 Brisbane
4155 Brisbane
4156 Brisbane
4157 Brisbane
4158 Brisbane
4159 Brisbane
4160 Brisbane
4161 Brisbane
4163 Brisbane
4164 Brisbane
4165 Brisbane
4169 Brisbane
4170 Brisbane
4171 Brisbane
4172 Brisbane
4173 Brisbane
4174 Brisbane
4178 Brisbane
4179 Brisbane
4183 Brisbane
4184 Brisbane
4205 Gold Coast
4207 Gold Coast
4208 Gold Coast
4209 Gold Coast
4210 Gold Coast
Postcode Localised Zone Name
4211 Gold Coast
4212 Gold Coast
4213 Gold Coast
4214 Gold Coast
4215 Gold Coast
4216 Gold Coast
4217 Gold Coast
4218 Gold Coast
4220 Gold Coast
4221 Gold Coast
4223 Gold Coast
4224 Gold Coast
4225 Gold Coast
4226 Gold Coast
4227 Gold Coast
4228 Gold Coast
4270 Gold Coast
4271 Gold Coast
4272 Gold Coast
4275 Gold Coast
4280 Brisbane
4285 Western (SE QLD)
4287 Western (SE QLD)
4300 Brisbane
4301 Brisbane
4303 Brisbane
4304 Brisbane
4305 Western (SE QLD)
4306 Western (SE QLD)
4306 Wide Bay Burnett
4307 Western (SE QLD)
4309 Western (SE QLD)
4310 Darling Downs
4310 Western (SE QLD)
4311 Western (SE QLD)
4312 Western (SE QLD)
4312 Wide Bay Burnett
4313 Western (SE QLD)
4340 Western (SE QLD)
4341 Western (SE QLD)
4342 Western (SE QLD)
4343 Western (SE QLD)
4344 Western (SE QLD)

A C I L A L L E N C O N S U L T I N G
ELECTRICITY BILL BENCHMARKS FOR RESIDENTIAL CUSTOMERS B-3
Postcode Localised Zone Name
4346 Western (SE QLD)
4347 Western (SE QLD)
4350 Darling Downs
4350 Western (SE QLD)
4352 Darling Downs
4352 Darling Downs
4352 Western (SE QLD)
4353 Darling Downs
4354 Darling Downs
4355 Darling Downs
4356 Darling Downs
4357 Darling Downs
4358 Darling Downs
4359 Darling Downs
4359 Western (SE QLD)
4360 Darling Downs
4361 Darling Downs
4362 Darling Downs
4363 Darling Downs
4364 Darling Downs
4365 Darling Downs
4370 Darling Downs
4371 Darling Downs
4372 Darling Downs
4373 Darling Downs
4374 Darling Downs
4375 Darling Downs
4376 Darling Downs
4377 Darling Downs
4378 Darling Downs
4380 Darling Downs
4381 Darling Downs
4382 Darling Downs
4385 Darling Downs
4387 Darling Downs
4388 Darling Downs
4390 Darling Downs
4400 Darling Downs
4401 Darling Downs
4402 Darling Downs
4403 Darling Downs
4404 Darling Downs
4405 Darling Downs
Postcode Localised Zone Name
4406 Darling Downs
4407 Darling Downs
4408 Darling Downs
4410 Darling Downs
4411 Darling Downs
4412 Darling Downs
4413 Darling Downs
4415 Darling Downs
4416 Darling Downs
4417 Central West
4418 Central West
4419 Central West
4420 Central West
4421 Darling Downs
4422 Darling Downs
4423 Darling Downs
4424 Darling Downs
4425 Darling Downs
4426 Central West
4427 Central West
4428 Central West
4454 Central West
4455 Central West
4461 Central West
4462 Central West
4465 Central West
4467 Central West
4468 Central West
4470 Central West
4472 Central West
4474 Central West
4475 Central West
4477 Central West
4478 Central West
4479 Central West
4480 Central West
4481 Central West
4482 Central West
4486 Central West
4487 Central West
4488 Central West
4489 Central West
4490 Central West

A C I L A L L E N C O N S U L T I N G
ELECTRICITY BILL BENCHMARKS FOR RESIDENTIAL CUSTOMERS B-4
Postcode Localised Zone Name
4491 Central West
4492 Central West
4493 Central West
4494 Darling Downs
4496 Darling Downs
4497 Darling Downs
4498 Darling Downs
4500 Brisbane
4501 Brisbane
4502 Brisbane
4503 Brisbane
4504 Brisbane
4505 Brisbane
4506 Brisbane
4507 Brisbane
4508 Brisbane
4509 Brisbane
4510 Brisbane
4511 Brisbane
4512 Brisbane
4514 Western (SE QLD)
4515 Western (SE QLD)
4516 Brisbane
4517 Sunshine Coast
4518 Sunshine Coast
4519 Sunshine Coast
4520 Brisbane
4521 Western (SE QLD)
4550 Sunshine Coast
4551 Sunshine Coast
4552 Sunshine Coast
4553 Sunshine Coast
4554 Sunshine Coast
4555 Sunshine Coast
4556 Sunshine Coast
4557 Sunshine Coast
4558 Sunshine Coast
4559 Sunshine Coast
4560 Sunshine Coast
4561 Sunshine Coast
4562 Sunshine Coast
4563 Sunshine Coast
4564 Sunshine Coast
Postcode Localised Zone Name
4565 Sunshine Coast
4566 Sunshine Coast
4567 Sunshine Coast
4568 Sunshine Coast
4569 Sunshine Coast
4570 Sunshine Coast
4570 Wide Bay Burnett
4571 Sunshine Coast
4572 Sunshine Coast
4573 Sunshine Coast
4574 Sunshine Coast
4575 Sunshine Coast
4580 Sunshine Coast
4581 Sunshine Coast
4600 Wide Bay Burnett
4601 Wide Bay Burnett
4605 Wide Bay Burnett
4606 Wide Bay Burnett
4608 Wide Bay Burnett
4610 Wide Bay Burnett
4611 Wide Bay Burnett
4612 Wide Bay Burnett
4613 Wide Bay Burnett
4614 Wide Bay Burnett
4615 Wide Bay Burnett
4620 Wide Bay Burnett
4621 Wide Bay Burnett
4625 Wide Bay Burnett
4626 Wide Bay Burnett
4627 Wide Bay Burnett
4630 Wide Bay Burnett
4650 Wide Bay Burnett
4655 Wide Bay Burnett
4659 Wide Bay Burnett
4660 Wide Bay Burnett
4662 Wide Bay Burnett
4670 Wide Bay Burnett
4671 Wide Bay Burnett
4673 Wide Bay Burnett
4674 Wide Bay Burnett
4676 Wide Bay Burnett
4677 Wide Bay Burnett
4678 Wide Bay Burnett
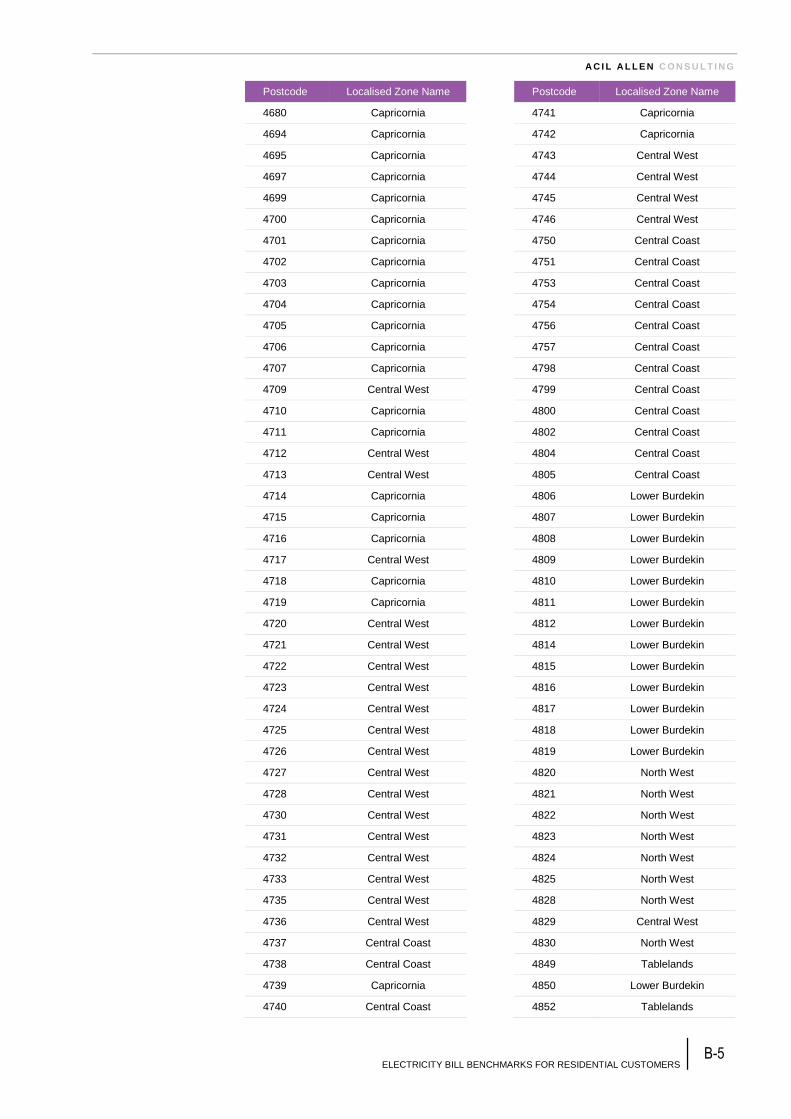
A C I L A L L E N C O N S U L T I N G
ELECTRICITY BILL BENCHMARKS FOR RESIDENTIAL CUSTOMERS B-5
Postcode Localised Zone Name
4680 Capricornia
4694 Capricornia
4695 Capricornia
4697 Capricornia
4699 Capricornia
4700 Capricornia
4701 Capricornia
4702 Capricornia
4703 Capricornia
4704 Capricornia
4705 Capricornia
4706 Capricornia
4707 Capricornia
4709 Central West
4710 Capricornia
4711 Capricornia
4712 Central West
4713 Central West
4714 Capricornia
4715 Capricornia
4716 Capricornia
4717 Central West
4718 Capricornia
4719 Capricornia
4720 Central West
4721 Central West
4722 Central West
4723 Central West
4724 Central West
4725 Central West
4726 Central West
4727 Central West
4728 Central West
4730 Central West
4731 Central West
4732 Central West
4733 Central West
4735 Central West
4736 Central West
4737 Central Coast
4738 Central Coast
4739 Capricornia
4740 Central Coast
Postcode Localised Zone Name
4741 Capricornia
4742 Capricornia
4743 Central West
4744 Central West
4745 Central West
4746 Central West
4750 Central Coast
4751 Central Coast
4753 Central Coast
4754 Central Coast
4756 Central Coast
4757 Central Coast
4798 Central Coast
4799 Central Coast
4800 Central Coast
4802 Central Coast
4804 Central Coast
4805 Central Coast
4806 Lower Burdekin
4807 Lower Burdekin
4808 Lower Burdekin
4809 Lower Burdekin
4810 Lower Burdekin
4811 Lower Burdekin
4812 Lower Burdekin
4814 Lower Burdekin
4815 Lower Burdekin
4816 Lower Burdekin
4817 Lower Burdekin
4818 Lower Burdekin
4819 Lower Burdekin
4820 North West
4821 North West
4822 North West
4823 North West
4824 North West
4825 North West
4828 North West
4829 Central West
4830 North West
4849 Tablelands
4850 Lower Burdekin
4852 Tablelands

A C I L A L L E N C O N S U L T I N G
ELECTRICITY BILL BENCHMARKS FOR RESIDENTIAL CUSTOMERS B-6
Postcode Localised Zone Name
4854 Tablelands
4855 Tablelands
4856 Tablelands
4857 Tablelands
4858 Tablelands
4859 Tablelands
4860 Tablelands
4861 Tablelands
4865 Tablelands
4868 Tablelands
4869 Tablelands
4870 Tablelands
4871 North West
4872 Tablelands
4873 Tablelands
4874 North West
4875 North West
Postcode Localised Zone Name
4876 North West
4877 Tablelands
4878 Tablelands
4879 Tablelands
4880 Tablelands
4881 Tablelands
4882 Tablelands
4883 Tablelands
4884 Tablelands
4885 Tablelands
4886 Tablelands
4887 Tablelands
4888 Tablelands
4890 North West
4891 North West
4895 Tablelands
B.2 New South Wales
New South Wales chose to adopt the climate zones.
Table B2 New South Wales climate zones
Postcode Climate zone
2000 5
2006 5
2007 5
2008 5
2009 5
2010 5
2011 5
2015 5
2016 5
2017 5
2018 5
2019 5
2020 4
2020 5
2021 5
2022 5
2023 5
2024 5
2025 5
2026 5
Postcode Climate zone
2027 5
2028 5
2029 5
2030 5
2031 5
2032 5
2033 5
2034 5
2035 5
2036 5
2037 5
2038 5
2039 5
2040 5
2041 5
2042 5
2043 5
2044 5
2045 5
2046 5

A C I L A L L E N C O N S U L T I N G
ELECTRICITY BILL BENCHMARKS FOR RESIDENTIAL CUSTOMERS B-7
Postcode Climate zone
2047 5
2048 5
2049 5
2050 5
2052 5
2060 5
2061 5
2062 5
2063 5
2064 5
2065 5
2066 5
2067 5
2068 5
2069 5
2070 5
2071 5
2072 5
2073 5
2074 5
2075 5
2076 5
2077 5
2079 5
2080 5
2081 5
2082 5
2083 5
2084 5
2085 5
2086 5
2087 5
2088 5
2089 5
2090 5
2092 5
2093 5
2094 5
2095 5
2096 5
2097 5
2099 5
2100 5
Postcode Climate zone
2101 5
2102 5
2103 5
2104 5
2105 5
2106 5
2107 5
2108 5
2109 5
2110 5
2111 5
2112 5
2113 5
2114 5
2114 6
2115 6
2116 6
2117 6
2118 6
2119 5
2119 6
2120 5
2121 5
2121 6
2122 5
2122 6
2123 6
2125 5
2125 6
2126 5
2127 6
2128 6
2129 5
2130 5
2131 5
2132 5
2133 5
2134 5
2135 5
2136 5
2137 5
2138 5
2139 5

A C I L A L L E N C O N S U L T I N G
ELECTRICITY BILL BENCHMARKS FOR RESIDENTIAL CUSTOMERS B-8
Postcode Climate zone
2140 5
2141 6
2142 6
2143 6
2144 6
2145 6
2146 6
2147 6
2148 6
2150 6
2151 6
2152 6
2153 6
2154 5
2154 6
2155 6
2156 6
2157 5
2157 6
2158 6
2159 5
2159 6
2160 6
2161 6
2162 6
2163 6
2164 6
2165 6
2166 6
2167 6
2168 6
2170 6
2171 6
2172 6
2173 6
2174 6
2175 6
2176 6
2177 6
2178 6
2179 6
2190 6
2191 5
Postcode Climate zone
2192 5
2193 5
2194 5
2195 5
2196 5
2196 6
2197 6
2198 6
2199 6
2200 5
2200 6
2203 5
2204 5
2205 5
2206 5
2207 5
2208 5
2209 5
2210 5
2211 6
2212 6
2213 6
2214 6
2216 5
2217 5
2218 5
2219 5
2220 5
2221 5
2222 5
2223 5
2224 5
2225 5
2226 5
2227 5
2228 5
2229 5
2230 5
2231 5
2232 5
2233 5
2234 5
2250 5

A C I L A L L E N C O N S U L T I N G
ELECTRICITY BILL BENCHMARKS FOR RESIDENTIAL CUSTOMERS B-9
Postcode Climate zone
2251 5
2256 5
2257 5
2258 5
2259 5
2260 5
2261 5
2262 5
2263 5
2264 5
2265 5
2267 5
2278 5
2280 5
2281 5
2282 5
2283 5
2284 5
2285 5
2286 5
2287 5
2289 5
2290 5
2291 5
2292 5
2293 5
2294 5
2295 5
2296 5
2297 5
2298 5
2299 5
2300 5
2302 5
2303 5
2304 5
2305 5
2306 5
2307 5
2308 5
2311 5
2311 6
2312 5
Postcode Climate zone
2314 5
2315 5
2316 5
2317 5
2318 5
2319 5
2320 5
2321 5
2322 5
2323 5
2324 5
2325 5
2325 6
2326 5
2327 5
2328 6
2329 6
2330 6
2331 6
2333 6
2334 5
2335 5
2335 6
2336 6
2337 6
2338 4
2338 6
2339 4
2340 4
2341 4
2342 4
2343 4
2344 4
2345 4
2346 4
2347 4
2350 6
2350 7
2351 7
2352 4
2353 4
2354 6
2355 4

A C I L A L L E N C O N S U L T I N G
ELECTRICITY BILL BENCHMARKS FOR RESIDENTIAL CUSTOMERS B-10
Postcode Climate zone
2355 6
2356 4
2357 4
2358 6
2359 4
2359 6
2360 4
2361 4
2365 4
2365 6
2365 7
2369 4
2370 2
2370 4
2370 6
2371 4
2371 6
2372 6
2379 4
2380 4
2381 4
2382 4
2386 4
2387 4
2388 4
2390 4
2395 4
2396 4
2397 4
2398 4
2399 4
2400 4
2401 4
2402 4
2403 4
2404 4
2405 4
2406 4
2408 4
2409 4
2410 4
2411 4
2415 5
Postcode Climate zone
2420 5
2421 5
2422 5
2422 6
2423 5
2424 5
2424 6
2425 5
2426 5
2427 5
2428 5
2429 5
2430 5
2431 2
2439 5
2440 2
2441 2
2441 5
2443 5
2444 5
2445 5
2446 5
2447 2
2448 2
2449 2
2450 2
2452 2
2453 2
2453 7
2454 2
2455 2
2456 2
2460 2
2462 2
2463 2
2464 2
2465 2
2466 2
2469 2
2469 6
2470 2
2471 2
2472 2

A C I L A L L E N C O N S U L T I N G
ELECTRICITY BILL BENCHMARKS FOR RESIDENTIAL CUSTOMERS B-11
Postcode Climate zone
2473 2
2474 2
2475 2
2475 6
2476 2
2476 6
2477 2
2478 2
2479 2
2480 2
2481 2
2482 2
2483 2
2484 2
2485 2
2486 2
2487 2
2488 2
2489 2
2490 2
2500 5
2502 5
2505 5
2506 5
2508 5
2515 5
2516 5
2517 5
2518 5
2519 5
2522 5
2525 5
2526 5
2527 5
2528 5
2529 5
2530 5
2533 5
2533 6
2534 5
2535 5
2535 6
2536 6
Postcode Climate zone
2537 6
2538 6
2539 6
2540 6
2541 6
2545 6
2546 6
2548 6
2549 6
2550 6
2551 6
2555 6
2556 6
2557 6
2558 6
2559 6
2560 6
2563 6
2564 6
2565 6
2566 6
2567 6
2568 6
2569 6
2570 6
2571 6
2572 6
2573 6
2574 6
2575 6
2576 6
2577 5
2577 6
2578 6
2579 6
2579 7
2580 7
2581 6
2581 7
2582 6
2583 4
2583 7
2584 6

A C I L A L L E N C O N S U L T I N G
ELECTRICITY BILL BENCHMARKS FOR RESIDENTIAL CUSTOMERS B-12
Postcode Climate zone
2585 4
2586 4
2586 6
2587 4
2588 4
2590 4
2594 4
2611 6
2611 7
2618 6
2619 7
2620 6
2620 7
2621 6
2621 7
2622 6
2622 7
2623 7
2624 7
2625 7
2626 7
2627 7
2628 7
2629 7
2630 7
2631 7
2632 6
2632 7
2633 7
2640 4
2640 7
2641 4
2642 4
2642 7
2643 4
2644 4
2644 7
2645 4
2646 4
2647 4
2648 4
2649 7
2650 4
Postcode Climate zone
2651 4
2652 4
2652 7
2653 7
2655 4
2656 4
2658 4
2659 4
2660 4
2661 4
2663 4
2665 4
2666 4
2668 4
2669 4
2671 4
2672 4
2675 4
2678 4
2680 4
2681 4
2700 4
2701 4
2702 4
2703 4
2705 4
2706 4
2707 4
2710 4
2711 4
2712 4
2713 4
2714 4
2715 4
2716 4
2717 4
2720 7
2721 4
2722 4
2722 7
2725 4
2726 6
2727 4
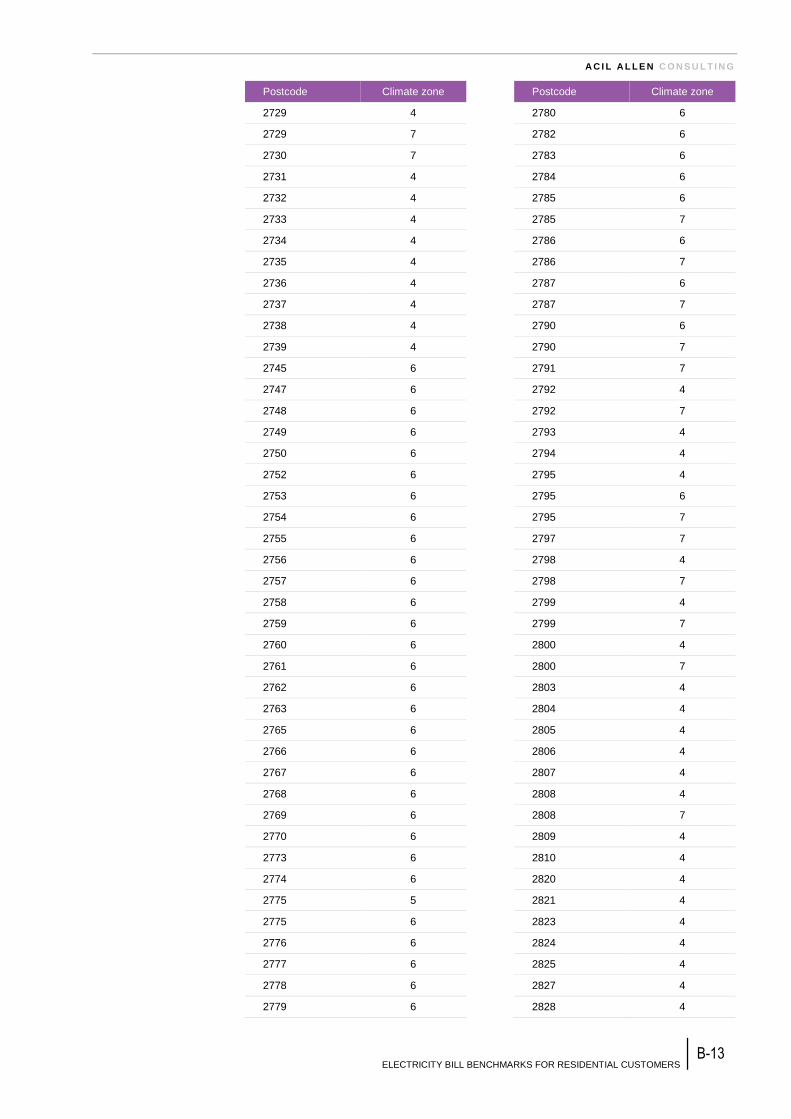
A C I L A L L E N C O N S U L T I N G
ELECTRICITY BILL BENCHMARKS FOR RESIDENTIAL CUSTOMERS B-13
Postcode Climate zone
2729 4
2729 7
2730 7
2731 4
2732 4
2733 4
2734 4
2735 4
2736 4
2737 4
2738 4
2739 4
2745 6
2747 6
2748 6
2749 6
2750 6
2752 6
2753 6
2754 6
2755 6
2756 6
2757 6
2758 6
2759 6
2760 6
2761 6
2762 6
2763 6
2765 6
2766 6
2767 6
2768 6
2769 6
2770 6
2773 6
2774 6
2775 5
2775 6
2776 6
2777 6
2778 6
2779 6
Postcode Climate zone
2780 6
2782 6
2783 6
2784 6
2785 6
2785 7
2786 6
2786 7
2787 6
2787 7
2790 6
2790 7
2791 7
2792 4
2792 7
2793 4
2794 4
2795 4
2795 6
2795 7
2797 7
2798 4
2798 7
2799 4
2799 7
2800 4
2800 7
2803 4
2804 4
2805 4
2806 4
2807 4
2808 4
2808 7
2809 4
2810 4
2820 4
2821 4
2823 4
2824 4
2825 4
2827 4
2828 4

A C I L A L L E N C O N S U L T I N G
ELECTRICITY BILL BENCHMARKS FOR RESIDENTIAL CUSTOMERS B-14
Postcode Climate zone
2829 4
2830 4
2831 4
2832 4
2833 4
2834 4
2835 4
2836 4
2839 4
2840 4
2842 4
2843 4
2844 6
2845 7
2846 6
2846 7
2847 7
2848 6
2849 6
2849 7
2850 4
2850 6
2850 7
2852 4
2852 6
2864 4
2865 4
2866 4
2867 4
2868 4
2869 4
Postcode Climate zone
2870 4
2871 4
2873 4
2874 4
2875 4
2876 4
2877 4
2878 4
2879 4
2880 4
2898 5
2900 7
3490 4
3494 4
3498 4
3501 4
3505 4
3549 4
3564 4
3579 4
3585 4
3586 4
3639 4
3644 4
3691 4
3694 4
3709 4
4383 6
4385 4
4493 4
B.3 Australian Capital Territory
The Australian Capital Territory is entirely in climate zone 7.

A C I L A L L E N C O N S U L T I N G
ELECTRICITY BILL BENCHMARKS FOR RESIDENTIAL CUSTOMERS B-15
B.4 Victoria
Victoria chose to adopt the climate zones.
Note: as discussed in section 2.3, we have reassigned Victorian postcodes from climate
zone 4 to zones 5 and 6, owing to insufficient sample size from these postcodes.
Table B3 Victoria climate zones
Postcode Climate zone
3000 6
3002 6
3003 6
3004 6
3005 6
3006 6
3008 6
3010 6
3011 6
3012 6
3013 6
3015 6
3016 6
3018 6
3019 6
3020 6
3021 6
3022 6
3023 6
3024 6
3025 6
3026 6
3027 6
3028 6
3029 6
3030 6
3031 6
3032 6
3033 6
3034 6
3036 6
3037 6
3038 6
3039 6
3040 6
3041 6
3042 6
Postcode Climate zone
3043 6
3044 6
3045 6
3046 6
3047 6
3048 6
3049 6
3050 6
3051 6
3052 6
3053 6
3054 6
3055 6
3056 6
3057 6
3058 6
3059 6
3060 6
3061 6
3062 6
3063 6
3064 6
3065 6
3066 6
3067 6
3068 6
3070 6
3071 6
3072 6
3073 6
3074 6
3075 6
3076 6
3078 6
3079 6
3081 6
3082 6

A C I L A L L E N C O N S U L T I N G
ELECTRICITY BILL BENCHMARKS FOR RESIDENTIAL CUSTOMERS B-16
Postcode Climate zone
3083 6
3084 6
3085 6
3086 6
3087 6
3088 6
3089 6
3090 6
3091 6
3093 6
3094 6
3095 6
3096 6
3097 6
3099 6
3101 6
3102 6
3103 6
3103 6
3104 6
3105 6
3106 6
3107 6
3108 6
3109 6
3111 6
3113 6
3114 6
3115 6
3116 6
3116 7
3121 6
3122 6
3123 6
3124 6
3125 6
3126 6
3127 6
3128 6
3129 6
3130 6
3131 6
3132 6
Postcode Climate zone
3133 6
3134 6
3135 6
3136 6
3137 6
3137 7
3138 7
3139 6
3139 7
3140 7
3141 6
3142 6
3143 6
3144 6
3145 6
3146 6
3147 6
3148 6
3149 6
3150 6
3151 6
3152 6
3153 6
3154 6
3155 6
3155 6
3156 6
3156 7
3158 7
3159 7
3160 7
3161 6
3162 6
3163 6
3165 6
3166 6
3167 6
3168 6
3169 6
3170 6
3171 6
3172 6
3173 6

A C I L A L L E N C O N S U L T I N G
ELECTRICITY BILL BENCHMARKS FOR RESIDENTIAL CUSTOMERS B-17
Postcode Climate zone
3174 6
3175 6
3177 6
3178 6
3179 6
3180 6
3181 6
3182 6
3183 6
3184 6
3185 6
3186 6
3187 6
3188 6
3189 6
3190 6
3191 6
3192 6
3193 6
3194 6
3195 6
3196 6
3197 6
3198 6
3199 6
3200 6
3201 6
3202 6
3204 6
3205 6
3206 6
3207 6
3211 6
3212 6
3214 6
3215 6
3216 6
3217 6
3218 6
3219 6
3220 6
3221 6
3222 6
Postcode Climate zone
3223 6
3224 6
3225 6
3226 6
3227 6
3228 6
3230 6
3231 6
3232 6
3233 6
3235 6
3236 6
3237 6
3238 6
3239 6
3240 6
3241 6
3242 6
3243 6
3249 6
3250 6
3251 6
3254 6
3260 6
3264 6
3265 6
3266 6
3267 6
3268 6
3269 6
3270 6
3271 6
3271 7
3272 6
3272 7
3273 6
3274 6
3275 6
3276 6
3277 6
3278 6
3279 6
3280 6

A C I L A L L E N C O N S U L T I N G
ELECTRICITY BILL BENCHMARKS FOR RESIDENTIAL CUSTOMERS B-18
Postcode Climate zone
3281 6
3282 6
3283 6
3284 6
3285 6
3286 6
3287 6
3289 6
3289 7
3292 6
3293 6
3293 7
3294 7
3300 7
3301 6
3301 7
3302 6
3302 7
3303 6
3304 6
3305 6
3309 6
3310 6
3311 6
3312 6
3312 7
3314 7
3315 6
3315 7
3317 6
3317 7
3318 6
3319 6
3321 6
3322 6
3323 6
3324 6
3325 6
3325 7
3328 6
3329 6
3330 6
3331 6
Postcode Climate zone
3332 6
3333 6
3334 6
3335 6
3337 6
3337 7
3338 6
3340 6
3341 6
3342 6
3345 6
3350 7
3351 6
3351 7
3352 6
3352 7
3355 7
3356 7
3357 7
3360 6
3360 7
3361 6
3361 7
3363 7
3364 6
3364 7
3370 6
3370 7
3371 6
3371 7
3373 7
3374 6
3374 7
3375 7
3377 6
3377 7
3378 7
3379 6
3379 7
3380 6
3381 6
3381 7
3384 6

A C I L A L L E N C O N S U L T I N G
ELECTRICITY BILL BENCHMARKS FOR RESIDENTIAL CUSTOMERS B-19
Postcode Climate zone
3384 7
3385 6
3385 6
3387 6
3388 6
3388 6
3390 6
3390 6
3391 6
3392 6
3393 6
3395 6
3396 6
3400 6
3401 6
3401 6
3401 7
3407 7
3409 6
3412 6
3413 6
3414 6
3415 6
3418 6
3419 6
3420 6
3423 6
3424 6
3427 6
3428 6
3429 6
3429 7
3430 6
3430 7
3431 6
3431 7
3432 7
3433 7
3434 7
3435 6
3435 7
3437 7
3438 7
Postcode Climate zone
3440 7
3441 7
3442 7
3444 6
3444 7
3446 7
3447 7
3448 7
3450 7
3451 7
3453 6
3453 7
3458 6
3458 7
3460 7
3461 6
3461 7
3462 7
3463 6
3463 7
3464 6
3465 6
3465 7
3467 7
3468 7
3469 7
3472 6
3472 7
3475 6
3477 6
3477 6
3477 7
3478 6
3478 6
3478 7
3480 6
3480 6
3482 6
3483 6
3485 6
3487 6
3488 6
3489 6

A C I L A L L E N C O N S U L T I N G
ELECTRICITY BILL BENCHMARKS FOR RESIDENTIAL CUSTOMERS B-20
Postcode Climate zone
3490 6
3491 6
3494 5
3496 5
3498 5
3500 5
3501 5
3505 5
3506 6
3507 5
3509 6
3512 5
3515 6
3516 6
3517 6
3518 6
3518 6
3520 6
3521 6
3522 6
3523 6
3523 6
3525 6
3525 6
3527 6
3527 6
3529 6
3530 6
3531 6
3533 6
3537 6
3540 6
3542 6
3544 6
3546 6
3549 6
3550 6
3551 6
3551 6
3555 6
3556 6
3557 6
3557 6
Postcode Climate zone
3558 6
3558 6
3559 6
3559 6
3561 6
3562 6
3563 6
3564 6
3565 6
3566 6
3567 6
3567 6
3568 6
3570 6
3571 6
3572 6
3572 6
3573 6
3573 6
3575 6
3576 6
3579 6
3579 6
3580 6
3581 6
3583 6
3584 6
3585 6
3586 6
3588 6
3589 6
3590 6
3591 6
3594 6
3595 6
3596 6
3597 6
3599 6
3607 6
3608 6
3608 6
3610 6
3610 6

A C I L A L L E N C O N S U L T I N G
ELECTRICITY BILL BENCHMARKS FOR RESIDENTIAL CUSTOMERS B-21
Postcode Climate zone
3612 6
3612 6
3614 6
3616 6
3617 6
3618 6
3620 6
3621 6
3622 6
3623 6
3624 6
3629 6
3630 6
3631 6
3631 6
3633 6
3634 6
3635 6
3636 6
3637 6
3638 6
3639 6
3640 6
3641 6
3644 6
3646 6
3646 6
3647 6
3649 6
3658 6
3658 7
3659 6
3660 6
3660 7
3662 6
3663 6
3664 6
3665 6
3666 6
3669 6
3669 6
3669 7
3670 6
Postcode Climate zone
3672 6
3673 6
3673 7
3675 6
3675 6
3675 7
3677 7
3678 6
3678 7
3682 6
3682 7
3683 6
3685 6
3685 6
3685 7
3687 6
3688 6
3690 6
3691 6
3691 7
3694 6
3695 6
3697 7
3698 7
3699 7
3700 6
3700 7
3701 6
3701 7
3704 7
3705 7
3707 7
3708 7
3709 7
3711 7
3712 7
3713 7
3714 7
3715 7
3717 7
3718 7
3719 7
3720 7

A C I L A L L E N C O N S U L T I N G
ELECTRICITY BILL BENCHMARKS FOR RESIDENTIAL CUSTOMERS B-22
Postcode Climate zone
3722 7
3723 6
3723 7
3725 6
3726 6
3727 6
3728 6
3730 6
3732 7
3733 7
3735 7
3737 6
3737 7
3738 7
3739 7
3740 7
3741 7
3744 7
3746 7
3747 6
3747 7
3749 6
3750 6
3751 6
3752 6
3753 6
3754 6
3755 6
3756 6
3756 7
3757 6
3757 7
3758 6
3759 6
3760 6
3761 6
3762 6
3762 7
3763 6
3763 7
3764 6
3764 7
3765 7
Postcode Climate zone
3766 7
3767 7
3770 7
3775 6
3775 7
3777 7
3778 7
3779 7
3781 6
3782 6
3782 7
3783 6
3785 7
3786 7
3787 6
3787 7
3788 7
3789 7
3791 7
3792 7
3793 7
3795 7
3796 7
3797 7
3799 7
3800 6
3802 6
3803 6
3804 6
3804 7
3805 6
3806 6
3807 6
3807 6
3808 6
3809 6
3810 6
3812 6
3813 6
3814 6
3815 6
3816 6
3816 7

A C I L A L L E N C O N S U L T I N G
ELECTRICITY BILL BENCHMARKS FOR RESIDENTIAL CUSTOMERS B-23
Postcode Climate zone
3818 7
3820 7
3821 7
3822 7
3823 7
3824 7
3825 6
3825 7
3831 7
3832 7
3833 7
3835 6
3835 7
3840 6
3842 6
3844 6
3847 6
3850 6
3851 6
3852 6
3854 6
3856 6
3857 6
3858 6
3858 7
3859 6
3860 6
3862 6
3862 7
3864 6
3865 6
3869 6
3870 6
3871 6
3871 7
3873 6
3874 6
3875 6
3878 6
3880 6
3882 6
3885 6
3886 6
Postcode Climate zone
3887 6
3888 6
3889 6
3890 6
3891 6
3892 6
3893 6
3895 6
3896 6
3898 6
3898 7
3900 6
3902 6
3903 6
3904 6
3909 6
3910 6
3911 6
3912 6
3913 6
3915 6
3916 6
3918 6
3919 6
3920 6
3921 6
3922 6
3923 6
3925 6
3926 6
3927 6
3928 6
3929 6
3930 6
3931 6
3933 6
3934 6
3936 6
3937 6
3938 6
3939 6
3940 6
3941 6

A C I L A L L E N C O N S U L T I N G
ELECTRICITY BILL BENCHMARKS FOR RESIDENTIAL CUSTOMERS B-24
Postcode Climate zone
3942 6
3943 6
3944 6
3945 6
3946 6
3950 6
3951 6
3953 6
3953 7
3954 6
3956 6
3960 6
3962 6
3966 6
3967 6
3971 6
3975 6
3976 6
3977 6
3978 6
3979 6
3980 6
3981 6
3981 7
3984 6
3987 6
3988 6
3988 7
3990 6
3991 6
3992 6
3995 6
3996 6

A C I L A L L E N C O N S U L T I N G
ELECTRICITY BILL BENCHMARKS FOR RESIDENTIAL CUSTOMERS B-25
B.5 Tasmania
Tasmania is located entirely within climate zone 7.
B.6 South Australia
South Australia chose to continue with the localised zones for which benchmarks were
estimated in 2011.
Table B4 South Australia localised zones
Postcod
e Localised Zone Name
5000 Adelaide & Environs
5005 Adelaide & Environs
5006 Adelaide & Environs
5007 Adelaide & Environs
5008 Adelaide & Environs
5009 Adelaide & Environs
5010 Adelaide & Environs
5011 Adelaide & Environs
5012 Adelaide & Environs
5013 Adelaide & Environs
5014 Adelaide & Environs
5015 Adelaide & Environs
5016 Adelaide & Environs
5017 Adelaide & Environs
5018 Adelaide & Environs
5019 Adelaide & Environs
5020 Adelaide & Environs
5021 Adelaide & Environs
5022 Adelaide & Environs
5023 Adelaide & Environs
5024 Adelaide & Environs
5025 Adelaide & Environs
5031 Adelaide & Environs
5032 Adelaide & Environs
5033 Adelaide & Environs
5034 Adelaide & Environs
5035 Adelaide & Environs
5037 Adelaide & Environs
5038 Adelaide & Environs
5039 Adelaide & Environs
5040 Adelaide & Environs
5041 Adelaide & Environs
5042 Adelaide & Environs
5043 Adelaide & Environs
Postcod
e Localised Zone Name
5044 Adelaide & Environs
5045 Adelaide & Environs
5046 Adelaide & Environs
5047 Adelaide & Environs
5048 Adelaide & Environs
5049 Adelaide & Environs
5050 Adelaide & Environs
5051 Adelaide & Environs
5052 Adelaide & Environs
5061 Adelaide & Environs
5062 Adelaide & Environs
5063 Adelaide & Environs
5064 Adelaide & Environs
5065 Adelaide & Environs
5066 Adelaide & Environs
5067 Adelaide & Environs
5068 Adelaide & Environs
5069 Adelaide & Environs
5070 Adelaide & Environs
5072 Adelaide & Environs
5073 Adelaide & Environs
5074 Adelaide & Environs
5075 Adelaide & Environs
5076 Adelaide & Environs
5081 Adelaide & Environs
5082 Adelaide & Environs
5083 Adelaide & Environs
5084 Adelaide & Environs
5085 Adelaide & Environs
5086 Adelaide & Environs
5087 Adelaide & Environs
5088 Adelaide & Environs
5089 Adelaide & Environs
5090 Adelaide & Environs

A C I L A L L E N C O N S U L T I N G
ELECTRICITY BILL BENCHMARKS FOR RESIDENTIAL CUSTOMERS B-26
Postcod
e Localised Zone Name
5091 Adelaide & Environs
5092 Adelaide & Environs
5093 Adelaide & Environs
5094 Adelaide & Environs
5095 Adelaide & Environs
5096 Adelaide & Environs
5097 Adelaide & Environs
5098 Adelaide & Environs
5106 Adelaide & Environs
5107 Adelaide & Environs
5108 Adelaide & Environs
5109 Adelaide & Environs
5110 Adelaide & Environs
5111 Adelaide & Environs
5112 Adelaide & Environs
5113 Adelaide & Environs
5114 Adelaide & Environs
5115 Adelaide & Environs
5116 Adelaide & Environs
5117 Adelaide & Environs
5118 Adelaide & Environs
5120 Adelaide & Environs
5121 Adelaide & Environs
5125 Adelaide & Environs
5126 Adelaide & Environs
5127 Adelaide & Environs
5131 Adelaide & Environs
5132 Adelaide & Environs
5133 Adelaide & Environs
5134 Adelaide & Environs
5136 Adelaide & Environs
5137 Mt Lofty Ranges
5138 Mt Lofty Ranges
5139 Mt Lofty Ranges
5140 Mt Lofty Ranges
5141 Mt Lofty Ranges
5142 Mt Lofty Ranges
5144 Mt Lofty Ranges
5150 Mt Lofty Ranges
5151 Mt Lofty Ranges
5152 Mt Lofty Ranges
5153 Mt Lofty Ranges
5154 Mt Lofty Ranges
5155 Mt Lofty Ranges
5156 Mt Lofty Ranges
5157 Adelaide & Environs
Postcod
e Localised Zone Name
5158 Adelaide & Environs
5159 Adelaide & Environs
5160 Adelaide & Environs
5161 Adelaide & Environs
5162 Adelaide & Environs
5163 Adelaide & Environs
5164 Adelaide & Environs
5165 Adelaide & Environs
5166 Adelaide & Environs
5167 Adelaide & Environs
5168 Adelaide & Environs
5169 Adelaide & Environs
5170 Adelaide & Environs
5171 Adelaide & Environs
5172 Adelaide & Environs
5173 Adelaide & Environs
5174 Adelaide & Environs
5201 Adelaide & Environs
5202 Adelaide & Environs
5203 Adelaide & Environs
5204 Adelaide & Environs
5210 Adelaide & Environs
5211 Adelaide & Environs
5212 Adelaide & Environs
5213 Adelaide & Environs
5214 Adelaide & Environs
5220 Yorke Peninsula & Kangaroo
Island
5221 Yorke Peninsula & Kangaroo
Island
5222 Yorke Peninsula & Kangaroo
Island
5223 Yorke Peninsula & Kangaroo
Island
5231 Adelaide & Environs
5232 Adelaide & Environs
5233 Mt Lofty Ranges
5234 Mt Lofty Ranges
5235 Mt Lofty Ranges
5236 Mt Lofty Ranges
5237 Mt Lofty Ranges
5238 Murraylands & Riverland
5240 Mt Lofty Ranges
5241 Mt Lofty Ranges
5242 Mt Lofty Ranges
5243 Mt Lofty Ranges
5244 Mt Lofty Ranges
5245 Mt Lofty Ranges

A C I L A L L E N C O N S U L T I N G
ELECTRICITY BILL BENCHMARKS FOR RESIDENTIAL CUSTOMERS B-27
Postcod
e Localised Zone Name
5250 Mt Lofty Ranges
5251 Mt Lofty Ranges
5252 Mt Lofty Ranges
5253 Adelaide & Environs
5254 Adelaide & Environs
5255 Mt Lofty Ranges
5256 Mt Lofty Ranges
5259 Murraylands & Riverland
5260 Murraylands & Riverland
5261 South East
5262 South East
5263 South East
5264 South East
5265 South East
5266 South East
5267 South East
5268 South East
5269 South East
5270 South East
5271 South East
5272 South East
5273 South East
5275 South East
5276 South East
5277 South East
5278 South East
5279 South East
5280 South East
5290 South East
5291 South East
5301 Murraylands & Riverland
5302 Murraylands & Riverland
5303 Murraylands & Riverland
5304 Murraylands & Riverland
5306 Murraylands & Riverland
5307 Murraylands & Riverland
5308 Murraylands & Riverland
5309 Murraylands & Riverland
5310 Murraylands & Riverland
5311 Murraylands & Riverland
5312 Murraylands & Riverland
5320 Murraylands & Riverland
5321 Murraylands & Riverland
5322 Murraylands & Riverland
5330 Murraylands & Riverland
5331 Murraylands & Riverland
Postcod
e Localised Zone Name
5332 Murraylands & Riverland
5333 Murraylands & Riverland
5340 Murraylands & Riverland
5341 Murraylands & Riverland
5342 Murraylands & Riverland
5343 Murraylands & Riverland
5344 Murraylands & Riverland
5345 Murraylands & Riverland
5346 Murraylands & Riverland
5350 Adelaide & Environs
5351 Adelaide & Environs
5352 Adelaide & Environs
5353 Mt Lofty Ranges
5354 Murraylands & Riverland
5355 Mt Lofty Ranges
5356 Mt Lofty Ranges
5357 Murraylands & Riverland
5360 Adelaide & Environs
5371 Adelaide & Environs
5372 Adelaide & Environs
5373 Mid North
5374 Mid North
5381 Central North
5400 Adelaide & Environs
5401 Mid North
5410 Mid North
5411 Mid North
5412 Mid North
5413 Mid North
5414 Mid North
5415 Mid North
5416 Mid North
5417 Mid North
5418 Central North
5419 Central North
5420 Central North
5421 Central North
5422 Port Augusta & Pastoral
5431 Mid North
5432 Mid North
5433 Port Augusta & Pastoral
5434 Port Augusta & Pastoral
5440 Port Augusta & Pastoral
5451 Mid North
5452 Mid North
5453 Mid North

A C I L A L L E N C O N S U L T I N G
ELECTRICITY BILL BENCHMARKS FOR RESIDENTIAL CUSTOMERS B-28
Postcod
e Localised Zone Name
5454 Mid North
5455 Mid North
5460 Mid North
5461 Mid North
5462 Mid North
5464 Mid North
5470 Mid North
5471 Mid North
5472 Mid North
5473 Mid North
5480 Central North
5481 Central North
5482 Central North
5483 Central North
5485 Central North
5490 Central North
5491 Central North
5493 Central North
5495 Central North
5501 Central North
5502 Central North
5510 Central North
5520 Central North
5521 Central North
5522 Central North
5523 Central North
5540 Central North
5550 Central North
5552 Central North
5554 Yorke Peninsula & Kangaroo
Island
5555 Central North
5556 Yorke Peninsula & Kangaroo
Island
5558 Yorke Peninsula & Kangaroo
Island
5560 Central North
5570 Yorke Peninsula & Kangaroo
Island
5571 Yorke Peninsula & Kangaroo
Island
5572 Yorke Peninsula & Kangaroo
Island
5573 Yorke Peninsula & Kangaroo
Island
5575 Yorke Peninsula & Kangaroo
Island
5576 Yorke Peninsula & Kangaroo
Island
Postcod
e Localised Zone Name
5577 Yorke Peninsula & Kangaroo
Island
5580 Yorke Peninsula & Kangaroo
Island
5581 Yorke Peninsula & Kangaroo
Island
5582 Yorke Peninsula & Kangaroo
Island
5583 Yorke Peninsula & Kangaroo
Island
5600 Eastern Eyre
5601 Eastern Eyre
5602 Eastern Eyre
5603 Eastern Eyre
5604 Eastern Eyre
5605 Eastern Eyre
5606 Eastern Eyre
5607 Eastern Eyre
5608 Eastern Eyre
5609 Eastern Eyre
5630 West Coast
5631 West Coast
5632 West Coast
5633 West Coast
5640 West Coast
5641 West Coast
5642 West Coast
5650 Port Augusta & Pastoral
5651 Port Augusta & Pastoral
5652 Port Augusta & Pastoral
5653 Port Augusta & Pastoral
5654 Port Augusta & Pastoral
5655 Port Augusta & Pastoral
5660 Port Augusta & Pastoral
5661 West Coast
5670 West Coast
5671 West Coast
5680 West Coast
5690 West Coast
5700 Port Augusta & Pastoral
5710 Port Augusta & Pastoral
5720 Port Augusta & Pastoral
5722 Port Augusta & Pastoral
5725 Port Augusta & Pastoral
5950 Adelaide & Environs

A C I L A L L E N C O N S U L T I N G
ELECTRICITY BILL BENCHMARKS FOR RESIDENTIAL CUSTOMERS B-29
B.7 Northern Territory
The number of responses received from Northern Territory customers was insufficient to
estimate benchmarks for different zones.

ACIL ALLEN CONSULTING PTY LTD
ABN 68 102 652 148
LEVEL FIFTEEN
127 CREEK STREET
BRISBANE QLD 4000
AUSTRALIA
T+61 7 3009 8700
F+61 7 3009 8799
LEVEL TWO
33 AINSLIE PLACE
CANBERRA ACT 2600
AUSTRALIA
T+61 2 6103 8200
F+61 2 6103 8233
LEVEL NINE
60 COLLINS STREET
MELBOURNE VIC 3000
AUSTRALIA
T+61 3 8650 6000
F+61 3 9654 6363
LEVEL ONE
50 PITT STREET
SYDNEY NSW 2000
AUSTRALIA
T+61 2 8272 5100
F+61 2 9247 2455
SUITE C2 CENTA BUILDING
118 RAILWAY STREET
WEST PERTH WA 6005
AUSTRALIA
T+61 8 9449 9600
F+61 8 9322 3955
ACILALLEN.COM.AU
Top Related