


Languages
Pages
Legal


EJISU-JUABEN MUNICIPAL

ii
Copyright © 2014 Ghana Statistical Service
iii
PREFACE AND ACKNOWLEDGEMENT
No meaningful developmental activity can be undertaken without taking into account the
characteristics of the population for whom the activity is targeted. The size of the population
and its spatial distribution, growth and change over time, in addition to its socio-economic
characteristics are all important in development planning.
A population census is the most important source of data on the size, composition, growth
and distribution of a country’s population at the national and sub-national levels. Data from
the 2010 Population and Housing Census (PHC) will serve as reference for equitable
distribution of national resources and government services, including the allocation of
government funds among various regions, districts and other sub-national populations to
education, health and other social services.
The Ghana Statistical Service (GSS) is delighted to provide data users, especially the
Metropolitan, Municipal and District Assemblies, with district-level analytical reports based
on the 2010 PHC data to facilitate their planning and decision-making.
The District Analytical Report for the Ejisu-Juaben Municipal is one of the 216 district
census reports aimed at making data available to planners and decision makers at the district
level. In addition to presenting the profile of the metropolis, the report discusses the social
and economic dimensions of demographic variables and their implications for policy
formulation, planning and interventions. The conclusions and recommendations drawn from
the report are expected to serve as a basis for improving the quality of life of Ghanaians
through evidence-based decision-making, monitoring and evaluation of developmental goals
and intervention programmes.
For ease of accessibility to the census data, the report for Tamale Metropolis and other census
reports produced by the GSS will be disseminated widely in both print and electronic
formats. The report will also be posted on the GSS website: www.statsghana.gov.gh.
The GSS wishes to express its profound gratitude to the Government of Ghana for providing
the required resources for the conduct of the 2010 PHC. While appreciating the contribution
of our Development Partners (DPs) towards the successful implementation of the Census, we
wish to specifically acknowledge the Department for Foreign Affairs, Trade and
Development (DFATD) formerly the Canadian International Development Agency (CIDA)
and the Danish International Development Agency (DANIDA) for providing resources for
the preparation of all the 216 district reports. Our gratitude also goes to the Metropolitan,
Municipal and District Assemblies, the Ministry of Local Government, Consultant Guides,
Consultant Editors, Project Steering Committee members and their respective institutions for
their invaluable support during the report writing exercise. Finally, we wish to thank all the
report writers, including the GSS staff who contributed to the preparation of the reports, for
their dedication and diligence in ensuring the timely and successful completion of the district
census reports.
Dr. Philomena Nyarko
Government Statistician

iv
TABLE OF CONTENTS
PREFACE AND ACKNOWLEDGEMENT ....................................................................... iii
LIST OF TABLES ................................................................................................................. vi
LIST OF FIGURES .............................................................................................................. vii
ACRONYMS AND ABBREVIATIONS ............................................................................ viii
EXECUTIVE SUMMARY .................................................................................................. iix
CHAPTER ONE: INTRODUCTION ...................................................................................1 1.1 Background .................................................................................................................... 1
1.2 Physical Features ........................................................................................................... 1 1.3 Political Administration ................................................................................................. 2
1.4 Social and Cultural Structure ......................................................................................... 2 1.5 Economy ........................................................................................................................ 2 1.6 Census methodology, Concepts and Definitions ........................................................... 4 1.7 Organization of the Report........................................................................................... 13
CHAPTER TWO: DEMOGRAPHIC CHARACTERISTICS .........................................15 2.1 Introduction .................................................................................................................. 15 2.2 Population Size and Distribution ................................................................................. 15
2.3 Age-Sex Structure ........................................................................................................ 16 2.4 Fertility Mortality and Migration ................................................................................. 17
CHAPTER THREE: SOCIAL CHARACTERISTICS ....................................................23 3.1 Introduction .................................................................................................................. 23 3.2 Household Size, Composition and Structure ............................................................... 23
3.3 Marital Status ............................................................................................................... 24
3.4 Nationality.................................................................................................................... 27 3.5 Religious Affiliation .................................................................................................... 28 3.6 Literacy and Education ............................................................................................... 28
CHAPTER FOUR: ECONOMIC CHARACTERISTICS ...............................................32 4.1 Introduction .................................................................................................................. 32
4.2 Economic Activity Status ............................................................................................ 32 4.3 Occupation ................................................................................................................... 34 4.4 Industry ........................................................................................................................ 34
4.5 Employment Status ...................................................................................................... 35 4.6 Employment Sector ...................................................................................................... 36
CHAPTER FIVE: INFORMATION COMMUNICATION TECHNOLOGY ..............37 5.1 Introduction .................................................................................................................. 37
5.2 Ownership of Mobile Phones....................................................................................... 37 5.3 Household ownership of fixed telephone lines and computers ................................... 37
CHAPTER SIX: DISABILITY ...........................................................................................39 6.1 Introduction .................................................................................................................. 39 6.2 Population with Disability ........................................................................................... 39
6.3 Type of Disability ........................................................................................................ 39 6.4 Disability and Economic Activity ................................................................................ 40 6.5 Disability and Level of Education ............................................................................... 41

v
CHAPTER SEVEN: AGRICULTURAL ACTIVITIES ...................................................43 7.1 Introduction .................................................................................................................. 43 7.2 Households in Agriculture ........................................................................................... 43 7.3 Type of Livestock and Other Animals reared .............................................................. 43
CHAPTER EIGHT: HOUSING CONDITIONS ...............................................................45 8.1 Introduction .................................................................................................................. 45 8.2 Housing Stock .............................................................................................................. 45 8.3 Type of Dwelling, Holding and Tenancy Arrangements ............................................. 45 8.4 Construction Materials ................................................................................................. 47
8.5 Room Occupancy ......................................................................................................... 48 8.6 Access to Utilities and Household Facilities ............................................................... 49 8.7 Main Source of Water for Drinking and for other Domestic Use................................ 50 8.8 Toilet and Bathing Facilities used by Households ....................................................... 51 8.9 Method of Waste Disposal ........................................................................................... 52
CHAPTER NINE: SUMMARY OF FINDINGS, CONCLUSIONS AND POLICY
IMPLICATIONS .................................................................................54 9.1 Introduction .................................................................................................................. 54
9.2 Summary of Findings and Conclusion ......................................................................... 54
9.3 Policy Implications and Recommendations ................................................................. 57
REFERENCES .......................................................................................................................62
APPENDICES ........................................................................................................................63
LIST OF CONTRIBUTORS ................................................................................................70

vi
LIST OF TABLES
Table 2.1: Population by age, sex and type of locality ........................................................... 15
Table 2.2: Reported total fertility rate, general fertility rate and crude birth rate ................... 18
Table 2.3: Mortality rate in the Municipality.......................................................................... 19
Table 2.4: Female population 12 years and older by age, children ever born, children
surviving and sex of child ...................................................................................... 21
Table 2.5: Birthplace by duration of residence of migrants .................................................... 22
Table 3.1: Households by type of locality .............................................................................. 23
Table 3.2: Household population by composition and sex ..................................................... 23
Table 3.3: Household population by structure and sex ........................................................... 24
Table 3.4: Persons 12 years and older by sex, age-group and marital status .......................... 25
Table 3.5: Persons 12 years and older by sex, marital status and level of education ............. 26
Table 3.6: Persons 12 years and older by sex, marital status and economic activity ............. 27
Table 3.7: Population by nationality and sex .......................................................................... 28
Table 3.8: Population by religion and sex .............................................................................. 28
Table 3.9: Population 3 years and older by school attendance and sex .................................. 30
Table 4.1: Activity status of population 15 years and older by sex ........................................ 32
Table 4.2: Activity status of population 15 years and older by sex and age ........................... 33
Table 4.3: Employed population 15 years and older by occupation and sex .......................... 34
Table 4.4: Employed population 15 years and older by industry and sex .............................. 35
Table 4.5: Employed population 15 years and older by employment status and sex ............. 36
Table 4.6: Employed population 15 years and older by employment sector and sex ............. 36
Table 5.1: Population 12 years and older by internet facility usage and sex .......................... 37
Table 5.2: Households having desktop/laptop computers, and sex of head ........................... 38
Table 6.1a:Population by type of disability and sex ................................................................ 39
Table 6.1b:Population by type of locality, disability type and sex .......................................... 40
Table 6.2: Persons 15 years and older with disability by economic activity status
and sex ................................................................................................................... 41
Table 6.3: Population 3 years and older by sex, disability type and level
of education ............................................................................................................ 42
Table 7.1: Households by agricultural activities and locality ................................................. 43
Table 7.2: Distribution of livestock, other animals and keepers............................................. 44
Table 8.1: Stock of houses and households by type of locality .............................................. 45
Table 8.2: Type of occupied dwelling unit by sex of household head and type of locality ... 46
Table 8.3: Ownership status of dwelling by sex of household head and type of locality ....... 46
Table 8.4: Main construction material for outer wall of dwelling unit by type of locality .... 47
Table 8.5: Main construction material for the floor of dwelling unit by locality ................... 47
Table 8.6: Main construction material for the roofing of dwelling unit by
type of locality ....................................................................................................... 48
Table 8.7: Household size and number of sleeping rooms occupied in dwelling unit ........... 48
Table 8.8: Main source of lighting of dwelling unit by type of locality ................................. 49
Table 8.9: Main source of cooking fuel and cooking space used by households ................... 50
Table 8.10:Main source of water of dwelling unit for drinking and other domestic

vii
purposes ................................................................................................................. 51
Table 8.11:Type of toilet and bathing facilities used by households by type of locality ........ 52
Table 8.12: Method of solid and liquid waste disposal by type of locality ............................. 53
Table A1: Household composition by type of locality .......................................................... 63
Table A2: Distribution of households engaged in tree growing or crop farming
by type of crop and population engaged ................................................................ 64
Table A3: Population 11 years and older by sex, age and literacy status ............................... 66
Table A4: Population by sex, number of households and houses in the
20 largest communities .......................................................................................... 67
Table A5: Population by age group in the 20 largest communities ........................................ 69
LIST OF FIGURES
Figure 1.1: Map of Ejisu-Juaben Municipality ......................................................................... 3
Figure 2.1: Population pyramid .............................................................................................. 17
Figure 2.2: Cause of deaths in the Municipality ..................................................................... 20
Figure 2.3: Age at death of deceased person in the Municipality ........................................... 20
Figure 3.1: Literacy status of population 11 years and older .................................................. 29
Figure 3.2: School attendance of population 3 years and older .............................................. 29
Figure 3.3: School attendance (current and past) of population 3 years and older ................. 31
viii
ACRONYMS AND ABBREVIATIONS
LI Legislative Instrument
PNDC Provisional National Defense Council
PHC Population and Housing Census
GSS Ghana Statistical Service
EJMA Ejisu-Juaben Municipality Assembly
MTD Medium Term Development Plan
ICT Information Communication Technology
UN United Nations
ECOWAS Economic Community of West African States
NGOs Non-Governmental Organisations
TFR Total Fertility Rate
KMA Kumasi Metropolitan Assembly
KVIP Kumasi Ventilated Improved Pit
VIP Ventilated Improved Pit
GFR General Fertility Rate
CBR Crude Birth Rate
PHC Population and Housing Census
PWDs Persons with Disability
SSS Senior Secondary School
JSS Junior Secondary School
JHS Junior High School
SHS Senior High School
WC Water Closet
UDG Urban Development Grant
DDF District Development Facility
DACF District Assembly Common Fund
CBD Central Business District
MDGs Millennium Development Goals
UNFPA United Nation Population Fund
GHS Ghana Health Service
NBSSI National Board for Small Scale Business
MoFA Ministry of Food and Agriculture
ix
EXECUTIVE SUMMARY
Introduction
The Municipality census report is the first of its kind since the first post-independence census
was conducted in 1960. The report provides basic information about the Municipality. It gives a
brief background of the Municipality, describing its physical features, political and
administrative structure, socio-cultural structure and economy. Using data from the 2010
Population and Housing Census (2010 PHC), the report discusses the population characteristics
of the Municipality, fertility, mortality, migration, marital status, literacy and education,
economic activity status, occupation, employment; Information Communication Technology
(ICT), disability, agricultural activities and housing conditions of the Municipality. The key
findings of the analysis are as follows (references are to the relevant sections of the report).
Population size, structure and composition
The population of Municipality, according to the 2010 Population and Housing Census, is
143,762 representing 3.0 percent of the region’s total population. Males constitute 68,648
(47.8%) male and females represent 75,114 (52.2%). The majority 72.5 percent of the
population is rural. The Municipality has a sex ratio of 91.4. The sex ratio of the Municipality
is lower than the regional average of 94. The population of the Municipality is youthful
(50.7%) depicting a broad base population pyramid which tapers off with a small number of
elderly persons (5.1%). The total age dependency ratio for the Municipality is 81.4, the age
dependency ratio for males is higher (86.2) than that of females (77.2).
Fertility, mortality and migration
The Total Fertility Rate for the Municipality is 3.4. The General Fertility Rate is 103.4 births
per 1000 women aged 15-49 years. The Crude Birth Rate (CBR) is 26.2 per 1000 population.
The crude death rate for the Municipality is 6.2 per 1000. There is a slight difference in
mortality between males and females, with males recording relatively higher deaths than
females from birth to about age 44 years. Accident/violence/homicide/suicide accounted for
13.5 percent of all deaths while other causes constitute 86.5 percent of deaths in the
Municipality. Majority of migrants (53.4 percent) living in the Municipality were born in
another region while 58.4 percent were born elsewhere in the Ashanti Region. For migrants
born in another region, those born in Eastern Region constitute 6.0 percent followed by
Brong Ahafo with 5.9 percent and Central regions 5.6 percent.
Household Size, composition and structure
The Municipality has a household population of 141,177 with a total number of 33,078
households. The average household size in the Municipality is 4.1 persons per household.
Children constitute the largest proportion of the household members accounting for (44.6%
males and 41.0% females). Spouses form about 9.8 percent. Nuclear households (head,
spouse(s) and children) constitute 28.6 percent of the total number of households in the
Municipality.
Marital status
About four in ten (38.2%) of the population aged 12 years and older are married, 41.1 percent
have never married, 8.7 percent are in consensual unions, 5.2 percent are widowed, 4.6
percent are divorced and 2.2 percent are separated. By age 25-29 years, less than two- fifth of
females (39.8%) are married compared to 27.4 percent of males. At age 65 and older,

x
widowed females account for as high as 57.8 percent while widowed males account for only
11.3 percent. Among the married, 19.2 percent have no education while about 4.7 percent of
the unmarried have never been to school. More than eight in ten of the married population
(83.5%) is employed, 3.1 percent are unemployed and 13.4 percent are economically not
active. A greater proportion of those who have never married (64.8%) are economically not
active with 5.2 percent unemployed.
Nationality
The proportion of Ghanaians by birth in the Municipality is 96.3 percent. Those who have
naturalised constitute 0.5 percent and the non-Ghanaian population in the Municipality is 1.6
percent.
Literacy and education
Of the population 11 years and above, 87.7 percent are literate and 15.3 percent are non-
literate. The proportion of literate males is higher than that of females. Seven out of ten
people (73.1%) indicated they could read and write both English and Ghanaian languages.
Of the population aged 3 years and above in the Municipality, 12.9 percent has never
attended school, 42.9 percent are currently attending and 44.2 percent have attended in the
past.
Economic Activity Status
About 70.3 percent of the population aged 15 years and older are economically active while
29.7 per cent are economically not active. Of the economically active population, 93.4
percent are employed while 6.6 percent are unemployed. For those who are economically not
active, a larger percentage of them are students (52.8%), 20.0% perform household duties and
5.0 percent are disabled or too sick to work. A little below seven out of ten (66.0%)
unemployed are seeking work for the first time.
Occupation
Of the employed population, about 36.1 percent are engaged as skilled agricultural, forestry
and fishery workers, 24.3 percent in service and sales, 17.1 percent in craft and related trade,
and 10.6 percent are engaged as managers, professionals, and technicians.
Employment status and sector
Of the population 15 years and older 64.3 percent are self-employed without employees, 5.9
percent are contributing family workers, 2.4 percent are casual workers and 0.6 percent are
domestic employees (house helps). Overall, men constitute the highest proportion in each
employment category except the contributing family workers and apprentices. The private
informal sector is the largest employer in the Municipality, employing 86.9 percent of the
population followed by the public sector with 6.6 percent.
Information Communication Technology
Of the population 12 years and above, 52.2 percent have mobile phones. Men who own
mobile phones constitute 58.3 percent as compared to 47 percent of females. A little over five
(5.5%) of the population 12 years and older use internet facilities in the Municipality. Only
2,149 households representing 6.5 percent of the total households in the Municipality have
desktop/laptop computers.
xi
Disability
About 2.7 percent of the Municipality’s total population has one form of disability or the
other. The proportion of the male population with disability is slightly higher (2.9%) than
females (2.5%). The types of disability in the Municipality include sight, hearing, speech,
physical, intellect, and emotion. Persons with sight disability recorded the highest of 36.4
percent followed by physical disability (40.5%). About 2.0 percent of the population with
disability are in the urban localities. There are more females with sight, Hearing and other
disabilities than males in both the urban and rural localities. Of the population disabled, 37.0
percent have never been to school.
Agriculture
As high as 47.0 percent of households in the Municipality are engage in agriculture. In the
rural localities, a little more than five out of ten households (56.5%) are agricultural
households while in the urban localities, 23.9 percent of households are into agriculture. Most
households in the Municipality (96.2%) are involved in crop farming. Poultry (chicken) is
the dominant animal reared in the Municipality
Housing
The housing stock of Ejisu-Juaben Municipality is 17,994 representing 3.1 percent of the
total number of houses in the Ashanti Region. The average number of households per house
is 1.8.
Type, tenancy arrangement and ownership of dwelling units
Over half (56.9%) of all dwelling units in the Municipality are compound houses; 25.9
percent are separate houses and 6.7 percent are semi-detached houses. Below half (44.8%) of
the dwelling units in the Municipality are owned by members of the household; 25.6 percent
are owned by private individuals; 25.8 percent are owned by a relative who is not a member
of the household and only 1.3 percent are owned by public or government. Less than one
percent (0.7%) of the dwelling units is owned through mortgage schemes.
Material for construction of outer wall, floor and roof
The main construction material for outer walls of dwelling units in the Municipality is cement
and concrete accounting for 77.1 percent with mud/mud bricks or earth constituting 17.8
percent of outer walls of dwelling units in the Municipality. Cement (81.5%) and mud/earth
(12.9%) are the two main materials used in the construction of floors of dwelling units in the
Municipality. Metal sheets are the main roofing material (94.6 %) for dwelling units in the
Municipality.
Room occupancy
One room constitutes the highest percentage (63.1%) of sleeping rooms occupied by
households in housing units in the Municipality. About 13.3 percent of households with 10 or
more members occupy single rooms.
Utilities and household facilities
The three main sources of lighting in dwelling units in the Municipality are Electricity 69.4
percent, followed by flash light/touch (16.5%) and kerosene lamp (11.5%). The main source
of fuel for cooking for most households in the Municipality is Wood (44.5%). The proportion
for rural (19.1%) is lower than that of urban (55.0%). The four main sources of water in the

xii
Municipality are borehole, river stream, public tap and pipe borne water. About half of
households (60.9%) drink water from boreholes.
The most common toilet facility used in the Municipality is public toilet (WC, KVIP, Pit,
Pan) representing 48.8 percent followed by pit latrine (21.5%). About 6.4 percent of the
population in the Municipality has no toilet facility. Less than half of households (43.2%) in
the Municipality share separate bathrooms in the same house while 21.2 percent own
bathrooms for their exclusive use.
Waste disposal
The most widely method of solid waste disposal is by public dump in the open space
accounting for 65.0 percent. About one in ten households (4.4%) dump their solid waste
indiscriminately. House to house waste collection accounts for 1.3 percent. For liquid waste
disposal, throwing waste onto the compound (34.9%) and onto the street (43.4%) are the two
most common methods used by households in the Municipality.
1
CHAPTER ONE
INTRODUCTION
1.1 Background
The Ejisu-Juaben Municipality was established by the Local Government Legislative
Instrument 2007 (LI 1890) through the Local Government Law (PNDC Law, 2007). The
Ejisu-Juaben Municipality exists to ensure improvement in the quality of life of the people in
the Municipality through the formulation and implementation of policies to step-up human
development, job creation activities and poverty reduction strategies. This decentralized
District-level Analytical Report of Ejisu-Juaben Municipality presents and analyses data from
the 2010 Population and Housing Census (PHC) conducted by the Ghana Statistical Service
(GSS). The major issues analyzed in this report include the demographic, social and
economic characteristics; Information and Communication Technology; disability;
agricultural activities and housing conditions. This exercise aims at providing relevant data
for policy formulation and planning for development.
1.2 Physical Features
The Ejisu-Juaben Municipality lies within Latitudes 1o 15′ N and 1
o 45′ N and Longitude 6
o
15′ W and 7o 00′ W, occupying a land area of 582.5 km
2. The Municipality lies in central part
of the Ashanti Region, sharing boundaries with six Districts in the Region. The Districts are
Sekyere East and Afigya Kwabre to the Northeast and North-West respectively; the
Bosomtwi and Asante Akim South Districts to the South; the Asante Akim North to the East
and the Kumasi Metropolis to the West. The district capital is sited at Ejisu.
The Municipality has bi-modal rainfall pattern. The major rainfall period begins from March
to July with average annual rainfall of 1,200 mm–1,500 mm per year. The minor rainfall
period also begins in September and tapers off in November with an average minor annual
rainfall of 900 mm-1,120 mm per year. December to February is usually dry, hot and dusty.
Mean annual temperatures in the Municipality are lowest around 25o
C in August and highest
around 32o C in March. Relative humidity is moderate but quite high during the rainy season.
The Municipality lies in the semi-deciduous forest zone of Ghana. The flora and fauna is
diverse and composed of different species of both economic and ornamental tree species with
varying heights and game and wildlife. The Bobiri Forest Reserve for example is renowned
for its butterfly species, greenery and varied flora and fauna.
The topography of the Municipality area is generally undulating, dissected by plains and
slopes with heights ranging between 240 metres and 300 metres above sea level. The geology
of the Municipality is precambrian rocks of the Birimian and Tarkwaian formations that is
generally suitable for agriculture. The soils include the associations of the Kumasi-Offin,
Bomso-Offin, Kobeda-Esshiem-Oda, Bekwai-Oda Compound, and Juaso-Mawso
Compounds.
The Oda, Anum, Bankro, Hwere and Baffoe Rivers are the major rivers in the area. These
rivers flow continually throughout the year and it is used for both domestic and agricultural
purposes. An example is the Anum River Valley used for irrigation rice production at
Nobewam.
2
The natural environment of the Municipality abounds in tourism potentials. The potentials
include the beautiful Bobiri Forest Reserve now famous for its butterfly sanctuary. Others are
the Ejisu-Besease Shrine, the Yaa Asantewaa Museum and festival, Kente weaving at
Bonwire, the Bafoso River sacred fishes among others. Other notable public places in the
Municipality area includes the Anyano sacred tree at the frontage of the Palace in
Akyawkrom, the Tano Shrine (declared a national monument) in Asawasi and the Ntonti
Rocks in Okyerekrom. There are three (3) hotels, eighteen (18) Guest Houses, and Nine (9)
Restaurants within the Municipality area.
1.3 Political Administration
The Municipality has a sub-structure made-up of nine (9) zonal Councils with one-hundred
and thirty-five (135) memberships. It is further subdivided into 47 electoral areas. The
Assembly has 68 Assembly members made up of 47 elected and 21 appointed members. The
Municipality has two constituencies and two Members of Parliament, who are members of
the Assembly without the right to vote. The Municipal Chief Executive is the Political Head
and works directly under the political and administrative jurisdiction of the Regional
Minister. The Municipal Coordinating Director is the administrative head of the district and is
responsible for the day to day management of the district.
1.4 Social and Cultural Structure
The Municipality is ethnically homogenous with Akans as the overwhelming majority (82%).
Tribes of northern extraction account for about nine percent while Ewes (5.4%) and Gas (1%)
make up the remaining 6.4 percent (2010 Population and Housing Census). The Municipality
has two paramount areas namely, the Juaben Traditional Areal and the Ejisu Traditional
Area. All the people in the Municipality area owe allegiance to the golden stool of the Asante
kingdom, of which the Asantehene is the ‘overlord’.
The people observe the Akwasidae, Awukudae and Fofie as sacred days. Yaa Asantewaa
Festival marks the heroic deeds of the Warrior Queen of Ejisu during the Asante-British War
of 1900. It was first marked in August, 2006 and is marked every two years. There is also the
Kente Festival to reminiscence the popular traditional cloth. Bonwire, located in the
Municipality area has globally become synonymous with the Kente cloth and Kente Festival.
1.5 Economy
Most people in the Municipality engage in agriculture, commerce, services, and industry.
Analysis of the 2010 Population and Housing Census show that while agriculture employs
about 62.5 percent of the working population, commerce and services employs about 31.7
percent. The remaining 6.8 percent of the populace are engaged in industry. The structure
confirms results obtained from a survey carried out on 400 people sampled in four (4)
selected Area Councils (Ejisu, Juaben, Bomfa-Adumasa and Onwe) to determine the
occupational distribution of the population.
There are two main types of agricultural practice namely; crop farming (food and cash crops
farming) and animal husbandry. Most households practice a mixture of the two. Majority of
farmers (more than 90%) are food crop farmers (2010 Population and Housing Census). The
service sector includes banking, hospitality, tourism, car repairs and washing,
communication, ICT, etc.

3
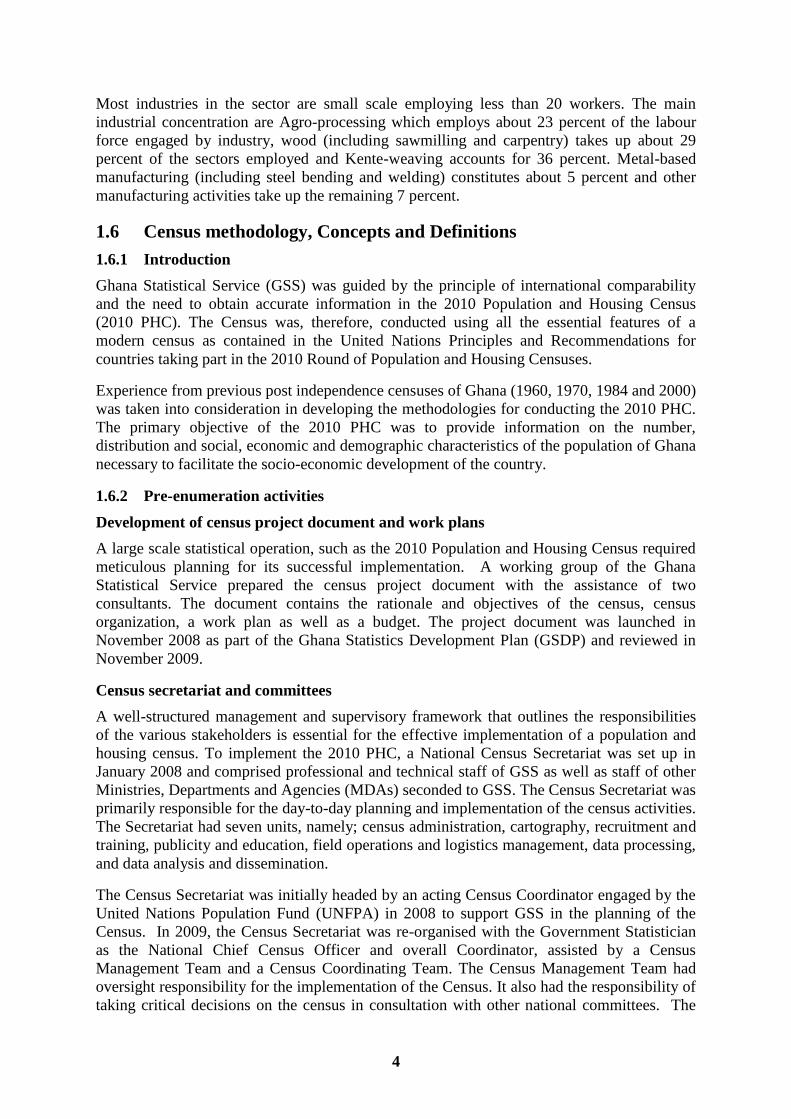
Figure 1.1: Map of Ejisu-Juaben Municipality
Source: Ghana Statistical Service, GIS
4
Most industries in the sector are small scale employing less than 20 workers. The main
industrial concentration are Agro-processing which employs about 23 percent of the labour
force engaged by industry, wood (including sawmilling and carpentry) takes up about 29
percent of the sectors employed and Kente-weaving accounts for 36 percent. Metal-based
manufacturing (including steel bending and welding) constitutes about 5 percent and other
manufacturing activities take up the remaining 7 percent.
1.6 Census methodology, Concepts and Definitions
1.6.1 Introduction
Ghana Statistical Service (GSS) was guided by the principle of international comparability
and the need to obtain accurate information in the 2010 Population and Housing Census
(2010 PHC). The Census was, therefore, conducted using all the essential features of a
modern census as contained in the United Nations Principles and Recommendations for
countries taking part in the 2010 Round of Population and Housing Censuses.
Experience from previous post independence censuses of Ghana (1960, 1970, 1984 and 2000)
was taken into consideration in developing the methodologies for conducting the 2010 PHC.
The primary objective of the 2010 PHC was to provide information on the number,
distribution and social, economic and demographic characteristics of the population of Ghana
necessary to facilitate the socio-economic development of the country.
1.6.2 Pre-enumeration activities
Development of census project document and work plans
A large scale statistical operation, such as the 2010 Population and Housing Census required
meticulous planning for its successful implementation. A working group of the Ghana
Statistical Service prepared the census project document with the assistance of two
consultants. The document contains the rationale and objectives of the census, census
organization, a work plan as well as a budget. The project document was launched in
November 2008 as part of the Ghana Statistics Development Plan (GSDP) and reviewed in
November 2009.
Census secretariat and committees
A well-structured management and supervisory framework that outlines the responsibilities
of the various stakeholders is essential for the effective implementation of a population and
housing census. To implement the 2010 PHC, a National Census Secretariat was set up in
January 2008 and comprised professional and technical staff of GSS as well as staff of other
Ministries, Departments and Agencies (MDAs) seconded to GSS. The Census Secretariat was
primarily responsible for the day-to-day planning and implementation of the census activities.
The Secretariat had seven units, namely; census administration, cartography, recruitment and
training, publicity and education, field operations and logistics management, data processing,
and data analysis and dissemination.
The Census Secretariat was initially headed by an acting Census Coordinator engaged by the
United Nations Population Fund (UNFPA) in 2008 to support GSS in the planning of the
Census. In 2009, the Census Secretariat was re-organised with the Government Statistician
as the National Chief Census Officer and overall Coordinator, assisted by a Census
Management Team and a Census Coordinating Team. The Census Management Team had
oversight responsibility for the implementation of the Census. It also had the responsibility of
taking critical decisions on the census in consultation with other national committees. The
5
Census Coordinating Team, on the other hand, was responsible for the day-to-day
implementation of the Census programme.
A number of census committees were also set up at both national and sub-national levels to
provide guidance and assistance with respect to resource mobilization and technical advice.
At the national level, the committees were the National Census Steering Committee (NCSC),
the National Census Technical Advisory Committee (NCTAC) and the National Census
Publicity and Education Committee (NCPEC). At the regional and district levels, the
committees were the Regional Census Implementation Committee and the District Census
Implementation Committee, respectively.
The Regional and District Census Implementation Committees were inter-sectorial in their
composition. Members of the Committees were mainly from decentralized departments with
the Regional and District Coordinating Directors chairing the Regional Census
Implementation Committee and District Census Implementation Committee, respectively.
The Committees contributed to the planning of district, community and locality level
activities in areas of publicity and field operations. They supported the Regional and District
Census Officers in the recruitment and training of field personnel (enumerators and
supervisors), as well as mobilizing logistical support for the census.
Selection of census topics
The topics selected for the 2010 Population and Housing Census were based on
recommendations contained in the UN Principles and Recommendations for 2010 Round of
Population and Housing Censuses and the African Addendum to that document as well as the
needs of data users. All the core topics recommended at the global level, i.e., geographical
and internal migration characteristics, international migration, household characteristics,
demographic and social characteristics such as age, date of birth, sex, and marital status,
fertility and mortality, educational and economic characteristics, issues relating to disability
and housing conditions and amenities were included in the census.
Some topics that were not considered core by the UN recommendations but which were
found to be of great interest and importance to Ghana and were, therefore, included in the
2010 PHC are religion, ethnicity, employment sector and place of work, agricultural activity,
as well as housing topics, such as, type of dwelling, materials for outer wall, floor and roof,
tenure/holding arrangement, number of sleeping rooms, cooking fuel, cooking space and
Information Communication Technology (ICT).
Census mapping
A timely and well implemented census mapping is pivotal to the success of any population
and housing census. Mapping delineates the country into enumeration areas to facilitate
smooth enumeration of the population. The updating of the 2000 Census Enumeration Area
(EA) maps started in the last quarter of 2007 with the acquisition of topographic sheets of all
indices from the Survey and Mapping Division of the Lands Commission. In addition, digital
sheets were also procured for the Geographical Information System Unit.
The Cartography Unit of the Census Secretariat collaborated with the Survey and Mapping
Division of the Lands Commission and the Centre for Remote Sensing and Geographic
Information Services (CERSGIS) of the Department of Geography and Resource
Development, University of Ghana, to determine the viability of migrating from analog to
digital mapping for the 2010 PHC, as recommended in the 2000 PHC Administrative Report.
Field cartographic work started in March 2008 and was completed in February 2010.

6
Development of questionnaire and manuals
For effective data collection, there is the need to design appropriate documents to solicit the
required information from respondents. GSS consulted widely with main data users in the
process of the questionnaire development. Data users including MDAs, research institutions,
civil society organizations and development partners were given the opportunity to indicate
the type of questions they wanted to be included in the census questionnaire.
Documents developed for the census included the questionnaire and manuals, and field
operation documents. The field operation documents included Enumerator’s Visitation
Record Book, Supervisor’s Record Book, and other operational control forms. These record
books served as operational and quality control tools to assist enumerators and supervisors to
control and monitor their field duties respectively.
Pre-tests and trial census
It is internationally recognized that an essential element in census planning is the pre-testing
of the questionnaire and related instructions. The objective of the pre-test is to test the
questionnaire, the definition of its concepts and the instructions for filling out the
questionnaire.
The census questionnaire was pre-tested twice in the course of its development. The first pre-
test was carried out in March 2009 to find out the suitability of the questions and the
instructions provided. It also tested the adequacy and completeness of the responses and how
respondents understood the questions. The second pre-test was done in 10 selected
enumeration areas in August, 2009. The objective of the second pre-test was to examine the
sequence of the questions, test the new questions, such as, date of birth and migration, and
assess how the introduction of ‘date of birth’ could help to reduce ‘age heaping’. With regard
to questions on fertility, the pre-tests sought to find out the difference, if any, between proxy
responses and responses by the respondents themselves. Both pre-tests were carried in the
Greater Accra Region. Experience from the pre-tests was used to improve the final census
questionnaire.
A trial census which is a dress rehearsal of all the activities and procedures that are planned
for the main census was carried out in October/November 2009. These included recruitment
and training, distribution of census materials, administration of the questionnaire and other
census forms, enumeration of the various categories of the population (household,
institutional and floating population), and data processing. The trial census was held in six
selected districts across the country namely; Saboba (Northern Region), Chereponi (Northern
Region), Sene (Brong Ahafo Region), Bia (Western Region), Awutu Senya (Central
Region), and Osu Klottey Sub-Metro (Greater Accra Region). A number of factors were
considered in selecting the trial census districts. These included: administrative boundary
issues, ecological zone, and accessibility, enumeration of floating population/outdoor-
sleepers, fast growing areas, institutional population, and enumeration areas with scattered
settlements.
The trial census provided GSS with an opportunity to assess its plans and procedures as well
as the state of preparedness for the conduct of the 2010 PHC. The common errors found
during editing of the completed questionnaires resulted in modifications to the census
questionnaire, enumerator manuals and other documents. The results of the trial census
assisted GSS to arrive at technically sound decisions on the ideal number of persons per
questionnaire, number of persons in the household roster, migration questions, placement of
the mortality question, serial numbering of houses/housing structures and method of

7
collection of information on community facilities. Lessons learnt from the trial census also
guided the planning of the recruitment process, the procedures for training of census field
staff and the publicity and education interventions.
1.6.3 Census enumeration
Method of enumeration and field work
All post- independence censuses (1960, 1970, 1984, and 2000) conducted in Ghana used the
de facto method of enumeration where people are enumerated at where they were on census
night and not where they usually reside. The same method was adopted for the 2010 PHC.
The de facto count is preferred because it provides a simple and straight forward way of
counting the population since it is based on a physical fact of presence and can hardly be
misinterpreted. It is thought that the method also minimizes the risks of under-enumeration
and over enumeration. The canvasser method, which involves trained field personnel visiting
houses and households identified in their respective enumeration areas, was adopted for the
2010 PHC.
The main census enumeration involved the canvassing of all categories of the population by
trained enumerators, using questionnaires prepared and tested during the pre-enumeration
phase. Specific arrangements were made for the coverage of special population groups, such
as the homeless and the floating population. The fieldwork began on 21st September 2010
with the identification of EA boundaries, listing of structures, enumeration of institutional
population and floating population.
The week preceding the Census Night was used by field personnel to list houses and other
structures in their enumeration areas. Enumerators were also mobilized to enumerate
residents/inmates of institutions, such as, schools and prisons. They returned to the
institutions during the enumeration period to reconcile the information they obtained from
individuals and also to cross out names of those who were absent from the institutions on
Census Night.
Out-door sleepers (floating population) were also enumerated on the Census Night.
Enumeration of the household population started on Monday, 27th
September, 2010.
Enumerators visited houses, compounds and structures in their enumeration areas and started
enumerating all households including visitors who spent the Census Night in the households.
Enumeration was carried out in the order in which houses/structures were listed and where
the members of the household were absent, the enumerator left a call-back-card indicating
when he/she would come back to enumerate the household. The enumeration process took off
smoothly with enumerators poised on completing their assignments on schedule since many
of them were teachers and had to return to school. However, many enumerators ran short of
questionnaires after a few days’ work.
Enumeration resumed in all districts when the questionnaire shortage was resolved and by
17th
October, 2010, enumeration was completed in most districts. Enumerators who had
finished their work were mobilized to assist in the enumeration of localities that were yet to
be enumerated in some regional capitals and other fast growing areas. Flooded areas and
other inaccessible localities were also enumerated after the end of the official enumeration
period. Because some enumeration areas in fast growing cities and towns, such as, Accra
Metropolitan Area, Kumasi, Kasoa and Techiman were not properly demarcated and some
were characterized by large EAs, some enumerators were unable to complete their assigned
tasks within the stipulated time.
8
1.6.4 Post enumeration survey
In line with United Nations recommendations, GSS conducted a Post Enumeration Survey
(PES) in April, 2011 to check content and coverage error. The PES was also to serve as an
important tool in providing feedback regarding operational matters such as concepts and
procedures in order to help improve future census operations. The PES fieldwork was carried
out for 21 days in April 2011 and was closely monitored and supervised to ensure quality
output. The main findings of the PES were that:
97.0 percent of all household residents who were in the country on Census Night (26th
September, 2010) were enumerated.
1.3 percent of the population was erroneously included in the census.
Regional differentials are observed. Upper East region recorded the highest coverage
rate of 98.2 percent while the Volta region had the lowest coverage rate of 95.7
percent.
Males (3.3%) were more likely than females (2.8%) to be omitted in the census. The
coverage rate for males was 96.7 percent and the coverage rate for females was 97.2
percent. Also, the coverage rates (94.1%) for those within the 20-29 and 30-39 age
groups are relatively lower compared to the coverage rates of the other age groups.
There was a high rate of agreement between the 2010 PHC data and the PES data for
sex (98.8%), marital status (94.6%), relationship to head of household (90.5%) and
age (83.0%).
1.6.5 Release and dissemination of results
The provisional results of the census were released in February 2011 and the final results in
May 2012. A National Analytical report, six thematic reports, a Census Atlas, 10 Regional
Reports and a report on Demographic, Social, Economic and Housing were prepared and
disseminated in 2013.
1.6.6 Concepts and definitions
Introduction
The 2010 Population and Housing Census of Ghana followed the essential concepts and
definitions of a modern Population and Housing Census as recommended by the United
Nations (UN). It is important that the concepts, definitions and recommendations are adhered
to since they form the basis upon which Ghana could compare her data with that of other
countries.
The concepts and definitions in this report cover all sections of the 2010 Population and
Housing Census questionnaires (PHC1A and PHC1B). The sections were: geographical
location of the population, Household and Non-household population, Literacy and
Education, Emigration, Demographic and Economic Characteristics, Disability, Information
Communication Technology (ICT), Fertility, Mortality, Agricultural Activity and Housing
Conditions.
The concepts and definitions are provided to facilitate understanding and use of the data
presented in this report. Users are therefore advised to use the results of the census within the
context of these concepts and definitions.
9
Region
There were ten (10) administrative regions in Ghana during the 2010 Population and Housing
Census as they were in 1984 and 2000.
District
In 1988, Ghana changed from the local authority system of administration to the district
assembly system. In that year, the then existing 140 local authorities were demarcated into
110 districts. In 2004, 28 new districts were created; this increased the number of districts in
the country to 138. In 2008, 32 additional districts were created bringing the total number of
districts to 170. The 2010 Population and Housing Census was conducted in these 170
administrative districts (these are made-up of 164 districts/municipals and 6 metropolitan
areas). In 2012, 46 new districts were created to bring the total number of districts to 216.
There was urgent need for data for the 46 newly created districts for planning and decision-
making. To meet this demand, the 2010 Census data was re-programmed into 216 districts
after carrying out additional fieldwork and consultations with stakeholders in the districts
affected by the creation of the new districts.
Locality
A locality was defined as a distinct population cluster (also designated as inhabited place,
populated Centre, settlement) which has a NAME or LOCALLY RECOGNISED STATUS.
It included fishing hamlets, mining camps, ranches, farms, market towns, villages, towns,
cities and many other types of population clusters, which meet the above criteria. There
were two main types of localities, rural and urban. As in previous censuses, the classification
of localities into ‘urban’ and ‘rural’ was based on population size. Localities with 5,000 or
more persons were classified as urban while localities with less than 5,000 persons were
classified as rural.
Population
The 2010 Census was a “de facto” count and each person present in Ghana, irrespective of
nationality, was enumerated at the place where he/she spent the midnight of 26th September
2010.
Household
A household was defined as a person or a group of persons, who lived together in the same
house or compound and shared the same house-keeping arrangements. In general, a
household consisted of a man, his wife, children and some other relatives or a house help who
may be living with them. However, it is important to remember that members of a household
are not necessarily related (by blood or marriage) because non-relatives (e.g. house helps)
may form part of a household.
Head of household
The household head was defined as a male or female member of the household recognized as
such by the other household members. The head of household is generally the person who has
economic and social responsibility for the household. All relationships are defined with
reference to the head.
Household and non-household population
Household population comprised of all persons who spent the census night in a household
setting. All persons who did not spend the census night in a household setting (except
10
otherwise stated) were classified as non-household population. Persons who spent census
night in any of the under listed institutions and locations were classified as non-household
population:
(a) Educational Institutions
(b) Children's and old people’s homes
(c) Hospitals and healing centers
(d) Hotels
(e) Prisons
(f) Service barracks
(g) Soldiers on field exercise
(h) Floating population: The following are examples of persons in this category:
i. All persons who slept in lorry parks, markets, in front of stores and offices, public
bathrooms, petrol filling stations, railway stations, verandas, pavements, and all
such places which are not houses or compounds.
ii. Hunting and fishing camps.
iii. Beggars and vagrants (mentally sick or otherwise).
Age
The age of every person was recorded in completed years disregarding fractions of days and
months. For those persons who did not know their birthdays, the enumerator estimated their
ages using a list of district, regional and national historical events.
Nationality
Nationality is defined as the country to which a person belongs. A distinction is made
between Ghanaians and other nationals. Ghanaian nationals are grouped into Ghanaian by
birth, Ghanaian with dual nationality and Ghanaian by naturalization. Other nationals are
grouped into ECOWAS nationals, Africans other than ECOWAS nationals, and non-
Africans.
Ethnicity
Ethnicity refers to the ethnic group that a person belonged to. This information is collected
only from Ghanaians by birth and Ghanaians with dual nationality. The classification of
ethnic groups in Ghana is that officially provided by the Bureau of Ghana Languages and
which has been in use since the 1960 census.
Birthplace
The birthplace of a person refers to the locality of usual residence of the mother at the time of
birth. If after delivery a mother stayed outside her locality of usual residence for six months
or more or had the intention of staying in the new place for six or more months, then the
actual town/village of physical birth becomes the birthplace of the child.

11
Duration of residence
Duration of residence refers to the number of years a person has lived in a particular place.
This question is only asked of persons not born in the place where enumeration took place.
Breaks in duration of residence lasting less than 12 months are disregarded. The duration of
residence of persons who made multiple movements of one (1) year or more is assumed to be
the number of years lived in the locality (town or village) since the last movement.
Religion
Religion refers to the individual’s religious affiliation as reported by the respondent,
irrespective of the religion of the household head or the head’s spouse or the name of the
person. No attempt was made to find out if respondents actually practiced the faith they
professed.
Marital status
Marital status refers to the respondent’s marital status as at Census Night. The question on
marital status was asked only of persons 12 years and older. The selection of the age limit of
12 years was based on the average age at menarche and also on the practice in some parts of
the country where girls as young as 12 years old could be given in marriage.
Literacy
The question on literacy referred to the respondent's ability to read and write in any language.
A person was considered literate if he/she could read and write a simple statement with
understanding. The question on literacy was asked only of persons 11 years and older.
Education
School attendance
Data was collected on school attendance for all persons three (3) years and older. School
attendance refers to whether a person has ever attended, was currently attending or has never
attended school. In the census, school meant an educational institution where a person
received at least four hours of formal education.
Although the lower age limit of formal education is six years for primary one, eligibility for
the school attendance question was lowered to three years because pre-school education has
become an important phenomenon in the country.
Level of education
Level of education refers to the highest level of formal school that a person ever attended or
was attending. This information was obtained for persons 3 years and older.
Activity status
Activity status refers to economic or non-economic activity of respondents during the 7 days
preceding census night. Information on type of activity was collected on persons 5 years and
older. A person was regarded as economically active if he/she:
a. Worked for pay or profit or family gain for at least 1 hour within the 7 days preceding
Census Night. This included persons who were in paid employment or self-
employment or contributing family workers.
b. Did not work, but had jobs to return to.

12
c. Were unemployed.
The economically not active were persons who did not work and were not seeking for work.
They were classified by reasons for not being economically active. Economically not active
persons included homemakers, students, retired persons, the disabled and persons who were
unable to work due to their age or ill-health.
Occupation
This referred to the type of work the person was engaged in at the establishment where he/she
worked. This was asked only of persons 5 years and older who worked 7 days before the
census night, and those who did not work but had a job to return to as well as those
unemployed who had worked before. All persons who worked during the 7 days before the
census night were classified by the kind of work they were engaged in. The emphasis was on
the work the person did during the reference period and not what he/she was trained to do.
For those who did not work but had a job to return to, their occupation was the job they
would go back to after the period of absence. Also, for persons who had worked before and
were seeking for work and available for work, their occupation was on the last work they did
before becoming unemployed. If a person was engaged in more than one occupation, only the
main one was considered.
Industry
Industry referred to the type of product produced or service rendered at the respondent’s work
place. Information was collected only on the main product produced or service rendered in
the establishment during the reference period.
Employment status
Employment status refers to the status of a person in the establishment where he/she currently
works or previously worked. Eight employment status categories were provided: employee,
self-employed without employees, self-employed with employees, casual worker,
contributing family worker, apprentice, domestic employee (house help). Persons who could
not be classified under any of the above categories were classified as “other”.
Employment sector
This refers to the sector in which a person worked. The employment sectors covered in the
census were public, private formal, private informal, semi-public/parastatal, NGOs and
international organizations.
Disability
Persons with disability were defined as those who were unable to or were restricted in the
performance of specific tasks/activities due to loss of function of some part of the body as a
result of impairment or malformation. Information was collected on persons with visual/sight
impairment, hearing impairment, mental retardation, emotional or behavioural disorders and
other physical challenges.
Information communication technology (ICT)
ICT questions were asked for both individuals and households. Persons having mobile
phones refer to respondents 12 years and older who owned mobile phones (irrespective of the
number of mobile phones owned by each person). Persons using internet facility refers to
those who had access to internet facility at home, internet cafe, on mobile phone or other

13
mobile device. Internet access is assumed to be not only via computer, but also by mobile
phones, PDA, game machine and digital television.
Households having Personal Computers/Laptops refer to households who own
desktops/laptop computers. The fixed telephone line refers to a telephone line connecting a
customer’s terminal equipment (e.g. telephone set, facsimile machine) to the public switch
telephone network.
Fertility
Two types of fertility data were collected: lifetime fertility and current fertility. Lifetime
fertility refers to the total number of live births that females 12 years and older had ever had
during their life time. Current fertility refers to the number of live births that females 12-54
years old had in the 12 months preceding the Census Night.
Mortality
Mortality refers to all deaths that occurred in the household during the 12 months preceding
the Census Night. The report presents information on deaths due to accidents, violence,
homicide and suicide. In addition, data were collected on pregnancy-related deaths of
females 12-54 years.
Agriculture
The census sought information on household members who are engaged in agricultural
activities, including the cultivation of crops or tree planting, rearing of livestock or breeding
of fish for sale or family consumption. Information was also collected on their farms, types of
crops and number and type of livestock.
Housing conditions and facilities
The UN recommended definition of a house as “a structurally separate and independent place
of abode such that a person or group of persons can isolate themselves from the hazards of
climate such as storms and the sun’’ was adopted. The definition, therefore, covered any
type of shelter used as living quarters, such as separate houses, semi-detached houses,
flats/apartments, compound houses, huts, tents, kiosks and containers.
Living quarters or dwelling units refer to a specific area or space occupied by a particular
household and therefore need not necessarily be the same as the house of which the dwelling
unit may be a part.
Information collected on housing conditions included the type of dwelling unit, main
construction materials for walls, floor and roof, holding/tenure arrangement, ownership type,
type of lighting, source of water supply and toilet facilities. Data was also collected on
method of disposal of solid and liquid waste.
1.7 Organization of the Report
This report contains nine (9) chapters and provides information on the nature and
characteristics of the population of the Municipality. Chapter One gives a brief profile of the
Municipality. Chapter Two deals with the demographic characteristics of the population,
including data on the size and distribution, age-sex structure, as well as fertility and
migration. Chapter Three analyses data on social characteristics. Economic characteristics are
examined in Chapter Four. Chapter Five is devoted to information communication
technology. Ownership of mobile phones, use of internet and household ownership of fixed

14
telephone lines and desktop or laptop computers are topics treated in Chapter Five. Data on
disability took the center stage of discussion in Chapter Six. Insight into agriculture which is
one of the issues covered for the first time in a national census in Ghana can be found in
Chapter Seven. Chapter Eight addresses relevant issues relating to agricultural activities of
households and types of farming activities. Chapter Nine is the concluding chapter and it is
devoted the summary, recommendations and policy implications.

15
CHAPTER TWO
DEMOGRAPHIC CHARACTERISTICS
2.1 Introduction
Population size and age-sex composition have broad ranging consequences for a number of
socio-economic indicators such as the welfare of the people. The changes in population are
mainly through fertility, mortality and migration levels, which to a large extent, are
influenced by age-sex composition. The objective of this chapter is to analyse the size,
composition, age and sex structure, as well as the fertility, mortality and migration of the
Ejisu-Juaben Municipality with reference to the 2010 Population and Housing Census.
2.2 Population Size and Distribution
Table 2.1 shows that the population of the Municipality is 143,762 comprising 68,648
(47.8%) males and 75,114 (52.2%) females. The data reveals that majority 104,197 (72.5%)
of the population are in the rural areas while 39,565 (27.5%) of the population are in urban
areas.
Table 2.1: Population by age, sex and type of locality
Age Group
Sex Type of locality
Both Sexes Male Female Sex ratio Urban Rural
All Ages 143,762 68,648 75,114
91.4 39,565 104,197
0 - 4 20,126 10,171 9,955
102.2 5,253 14,873
5-9 18,957 9,697 9,260
104.7 4,762 14,195
10-14 18,158 9,194 8,964
102.6 4,687 13,471
15 - 19 15,071 7,465 7,606
98.1 4,284 10,787
20 - 24 12,657 5,835 6,822
85.5 3,814 8,843
25 - 29 10,935 4,732 6,203
76.3 3,416 7,519
30 - 34 9,531 4,371 5,160
84.7 3,021 6,510
35 - 39 8,262 3,806 4,456
85.4 2,447 5,815
40 - 44 6,598 3,177 3,421
92.9 1,985 4,613
45 - 49 5,394 2,507 2,887
86.8 1,474 3,920
50 - 54 4,902 2,220 2,682
82.8 1,272 3,630
55 - 59 3,162 1,459 1,703
85.7 857 2,305
60 - 64 2,738 1,293 1,445
89.5 673 2,065
65 - 69 1,875 813 1,062
76.6 439 1,436
70 - 74 2,140 791 1,349
58.6 446 1,694
75 - 79 1,223 499 724
68.9 266 957
80 - 84 983 316 667
47.4 226 757
85 - 89 522 176 346
50.9 121 401
90 - 94 374 76 298
25.5 88 286
95 - 99 154 50 104
48.1 34 120
0-14 57,241 29,062 28,179
103.1 14,702 42,539
15-64 79,250 36,865 42,385
87 23,243 56,007
65+ 7,271 2,721 4,550
59.8 1,620 5,651
Age-dependency ratio 81.4 86.2 77.2 70.2 86
Source: Ghana Statistical Service, 2010 Population and Housing Census
16
The sex ratio (males to females) of the Municipality is 91.4. This means that for every 100
females, there are about 91 males. The sex ratio of the Municipality is lower than the regional
average of 94.
The total population has been grouped into different age groups from 0-14 (children
population), then 15-64 (population in the working age group) and 65+ (the aged population).
More than half (55.1%) of the total population falls within the working population, about
two-fourth (39.8%) falls within the children’s population and 5.1 percent fall within the aged
population. The sex structure shows that females (56.4%) form a slightly higher percentage
of the working population than females (53.7%). The aged female population, (6.1%) are also
in higher proportion compared with the aged male population (4.0%). However, the
proportion of male children (42.3%) is higher than the proportion of female children (37.5%)
in the Municipality (Table 2.1).
Dependency ratio
The age dependency ratio is the ratio of the dependent population (those under age 15 and 65
years and older) to the population in the working age group (15 to 64 years). The age
dependency ratio is often used as an indicator of the economic burden the productive
population must carry. The higher the ratio is, the more a potential worker is assumed to be
supporting and vice-versa. From Table 2.1, the age dependency ratio for the Municipality is
81.4 percent. This means that 100 persons in the working group look after approximately 81
persons in the dependent population. The age dependency ratio for males (86.2%) is higher
than for females (77.2%). The age dependency ratio for rural areas (86.0%) is slightly higher
than that of urban areas (70.2%).
2.3 Age-Sex Structure
Figure 2.1 shows a population pyramid of Age-Sex Structure of the Municipality. The
pyramid shows a decrease in population with advancing age. The wider the bar, the more
people are there in that age group. Thus, the age-sex structure is broad based, with
concentration of the population in younger ages, comprising the age group of 0-19 (50.3%);
for both males (53.2%) and females (47.6%). This shows that the Municipality has more
youthful population. The pyramid exemplifies the national and the regional age structure with
the greater number of the population falling within the age group 0-19 (See the 2010 PHC,
National Analytical Report page 56).

17
Figure 2.1: Population pyramid
15,000 10,000 5,000 0 5,000 10,000 15,000
0-4
5-9
10-14
15-19
20-24
25-29
30-34
35-39
40-44
45-49
50-54
55-59
60-64
65-69
70-74
75-79
80-84
85+
Population
Age
FemaleMale
Source: Ghana Statistical Service, 2010 Population and Housing Census
2.4 Fertility Mortality and Migration
2.4.1 Fertility
The General Fertility rate refers to the number of live births per 1,000 women aged 15 to 49
years in a given year. The total fertility rate (TFR) on the other hand refers to the average
number of children that would be born to a woman by the time she ended childbearing if she
were to pass through all her childbearing years conforming to the age-specific fertility rates
of a given year (Arthur H, A., Thomas T. K, and Carl, H. (2011): Population Hand Book).
This section analyses the total fertility rate, general fertility rate and crude birth rate.
Table 2.2 indicates the Total Fertility Rate (TFR), General Fertility Rate (GFR) and Crude
Birth Rate (CBR) of Ejisu-Juaben Municipality. According to the 2010 Population and
Housing Census, the total number of women in the child-bearing age (15-49) years stood at
36,555 which represents 2.9 percent of women in the child-bearing age in the Region. The
number of birth given in the last 12 months is 3,768 in the Municipality. This translates to a
TFR of 3.4, GFR of 103.1, and CBR of 26.2 per 1,000 live births. These rates are relatively
higher than the corresponding regional rates.

18
Table 2.2: Reported total fertility rate, general fertility rate and crude birth rate
District Population
Number of
women 15-
49 years
Number
of births
in last 12
months
Total
Fertilit
y Rate
*General
Fertility
Rate
**Crude
Birth
Rate
All Districts 4,780,380 1,274,380 122,878 3.3 96.4 25.7
Atwima Mponua 119,180 26,558 3,758 4.6 141.5 31.5
Amansie West 134,331 31,578 4,095 4.2 129.7 30.5
Amansie Central 90,741 19,924 2,763 4.7 138.7 30.4
Adansi South 115,378 26,243 3,421 4.4 130.4 29.7
Obuasi Municipal 168,641 48,834 3,745 2.7 76.7 22.2
Adansi North 107,091 25,080 2,866 3.9 114.3 26.8
Bekwai Municipal 118,024 28,480 2,897 3.5 101.7 24.5
Bosome Freho 60,397 13,882 1,657 4.0 119.4 27.4
Asante Akim South 117,245 26,249 3,374 4.4 128.5 28.8
Asante Akim Central Municipal 71,508 18,316 1,775 3.2 96.9 24.8
Ejisu Juaben Municipal 143,762 36,555 3,768 3.4 103.1 26.2 Bosumtwi 93,910 23,731 2,595 3.5 109.4 27.6
Atwima Kwanwoma 90,634 23,148 2,411 3.4 104.2 26.6
Kumasi Metropolis 1,730,249 514,640 39,366 2.6 76.5 22.8
Atwima Nwabiagya 149,025 40,087 4,006 3.4 99.9 26.9
Ahafo Ano South 121,659 27,141 4,055 5.0 149.4 33.3
Ahafo Ano North 94,285 22,221 2,636 3.9 118.6 28.0
Offinso Municipal 76,895 19,060 2,225 4.0 116.7 28.9
Afigya Kwabre 136,140 34,683 3,757 3.7 108.3 27.6
Kwabre East 115,556 31,777 3,261 3.4 102.6 28.2
Sekyere South 94,009 23,200 2,541 3.9 109.5 27.0
Mampong Municipal 88,051 21,517 2,213 3.5 102.8 25.1
Sekyere East 62,172 15,308 1,751 3.8 114.4 28.2
Sekyere Kumawu 65,402 15,021 1,913 4.4 127.4 29.2
Sekyere Central 71,232 15,961 1,884 4.0 118.0 26.4
Ejura Sekye Dumasi 85,446 20,985 2,339 3.8 111.5 27.4
Offinso North 56,881 13,416 1,891 4.7 141.0 33.2
Asokore Mampong Municipal 304,815 88,026 7,097 2.8 80.6 23.3
Asante Akim North 69,186 16,707 1,892 3.8 113.2 27.3
Sekyere Afram Plains North 28,535 6,052 926 5.0 153.0 32.5 Source: Ghana Statistical Service, 2010 Population and Housing Census
Note: * Number of live births per 1,000 women aged 15-49 years
** Number of live births per 1,000 population
2.4.2 Mortality
Of the total population (143,762) in the Municipality, the total deaths in households that were
reported stood at 891 in the 12 months preceding the census. This translates to a crude death
rate of 6.2 deaths per 1,000 which was slightly higher than the regional crude death rate of
5.8 per 1,000 population (Table 2.3).
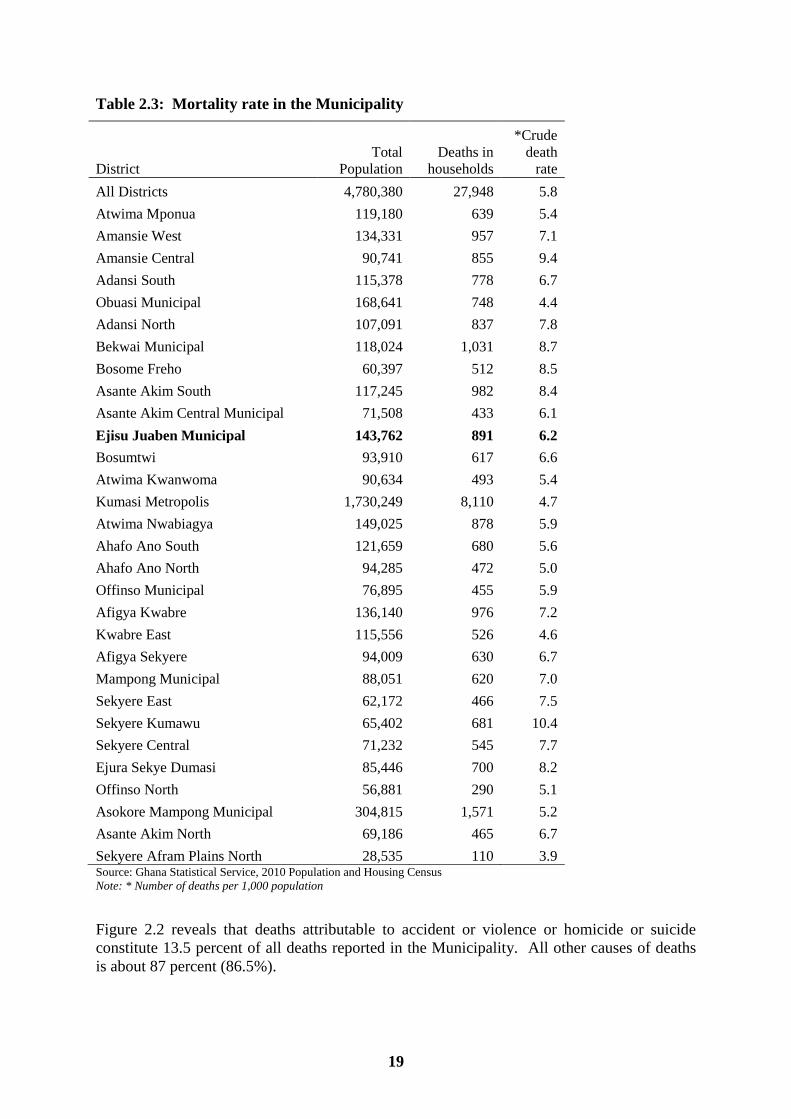
19
Table 2.3: Mortality rate in the Municipality
District
Total
Population
Deaths in
households
*Crude
death
rate
All Districts 4,780,380 27,948 5.8
Atwima Mponua 119,180 639 5.4
Amansie West 134,331 957 7.1
Amansie Central 90,741 855 9.4
Adansi South 115,378 778 6.7
Obuasi Municipal 168,641 748 4.4
Adansi North 107,091 837 7.8
Bekwai Municipal 118,024 1,031 8.7
Bosome Freho 60,397 512 8.5
Asante Akim South 117,245 982 8.4
Asante Akim Central Municipal 71,508 433 6.1
Ejisu Juaben Municipal 143,762 891 6.2
Bosumtwi 93,910 617 6.6
Atwima Kwanwoma 90,634 493 5.4
Kumasi Metropolis 1,730,249 8,110 4.7
Atwima Nwabiagya 149,025 878 5.9
Ahafo Ano South 121,659 680 5.6
Ahafo Ano North 94,285 472 5.0
Offinso Municipal 76,895 455 5.9
Afigya Kwabre 136,140 976 7.2
Kwabre East 115,556 526 4.6
Afigya Sekyere 94,009 630 6.7
Mampong Municipal 88,051 620 7.0
Sekyere East 62,172 466 7.5
Sekyere Kumawu 65,402 681 10.4
Sekyere Central 71,232 545 7.7
Ejura Sekye Dumasi 85,446 700 8.2
Offinso North 56,881 290 5.1
Asokore Mampong Municipal 304,815 1,571 5.2
Asante Akim North 69,186 465 6.7
Sekyere Afram Plains North 28,535 110 3.9 Source: Ghana Statistical Service, 2010 Population and Housing Census
Note: * Number of deaths per 1,000 population
Figure 2.2 reveals that deaths attributable to accident or violence or homicide or suicide
constitute 13.5 percent of all deaths reported in the Municipality. All other causes of deaths
is about 87 percent (86.5%).
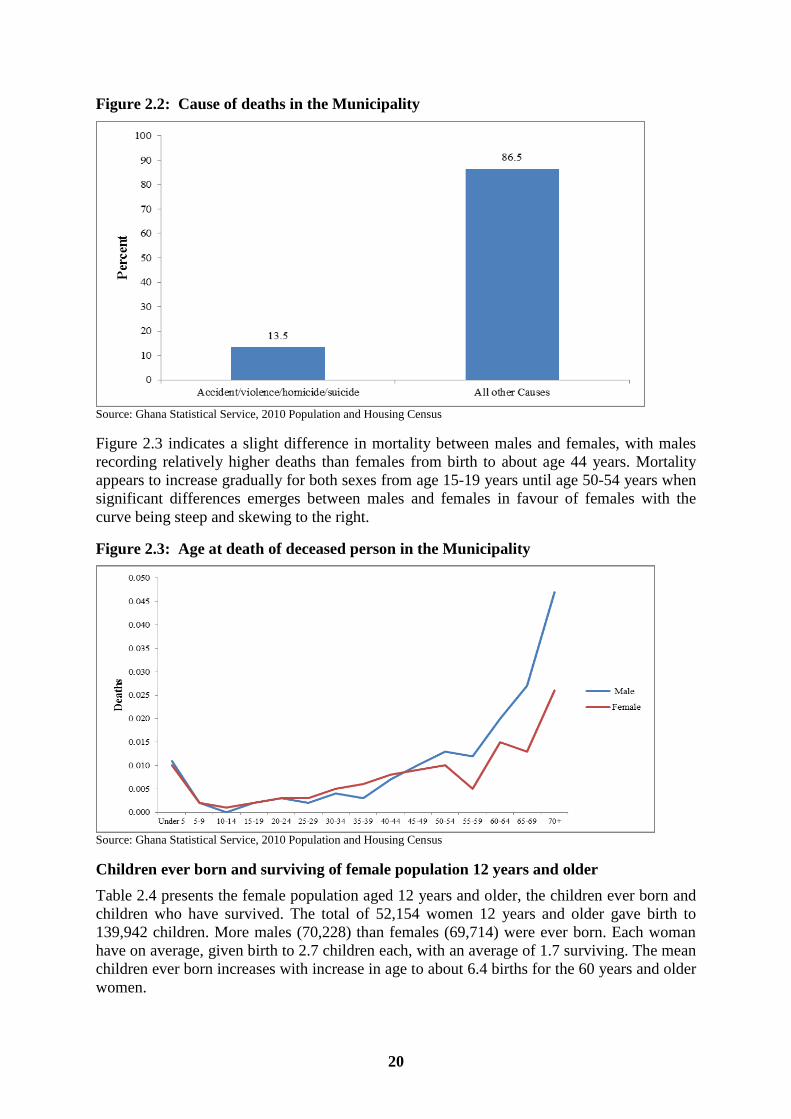
20
Figure 2.2: Cause of deaths in the Municipality
Source: Ghana Statistical Service, 2010 Population and Housing Census
Figure 2.3 indicates a slight difference in mortality between males and females, with males
recording relatively higher deaths than females from birth to about age 44 years. Mortality
appears to increase gradually for both sexes from age 15-19 years until age 50-54 years when
significant differences emerges between males and females in favour of females with the
curve being steep and skewing to the right.
Figure 2.3: Age at death of deceased person in the Municipality
Source: Ghana Statistical Service, 2010 Population and Housing Census
Children ever born and surviving of female population 12 years and older
Table 2.4 presents the female population aged 12 years and older, the children ever born and
children who have survived. The total of 52,154 women 12 years and older gave birth to
139,942 children. More males (70,228) than females (69,714) were ever born. Each woman
have on average, given birth to 2.7 children each, with an average of 1.7 surviving. The mean
children ever born increases with increase in age to about 6.4 births for the 60 years and older
women.

21
Table 2.4: Female population 12 years and older by age, children ever born, children
surviving and sex of child
Age
Number of
Females
Children Ever Born Children Surviving
Both
Sexes Percent Male Female
Both
Sexes Percent Male Female
All Ages 52,154 139,942 2.7 70,228 69,714
121,585 1.7 60,462 61,123
12-14 5,219 33 0.0 13 20
27 1.4 9 18
15-19 7,606 791 0.1 380 411
721 1.8 331 390
20-24 6,822 4,828 0.7 2,465 2,363
4,397 1.9 2,177 2,220
25-29 6,203 10,711 1.7 5,313 5,398
9,874 1.8 4,832 5,042
30-34 5,160 14,776 2.9 7,473 7,303
13,755 1.9 6,917 6,838
35-39 4,456 16,835 3.8 8,549 8,286
15,489 1.9 7,803 7,686
40-44 3,421 15,249 4.5 7,772 7,477
13,915 1.9 7,059 6,856
45-49 2,887 14,519 5.0 7,223 7,296
12,858 1.8 6,354 6,504
50-54 2,682 14,154 5.3 7,151 7,003
12,476 1.8 6,293 6,183
55-59 1,703 9,566 5.6 4,762 4,804
8,179 1.7 4,073 4,106
60+ 5,995 38,480 6.4 19,127 19,353 29,894 1.5 14,614 15,280
Source: Ghana Statistical Service, 2010 Population and Housing Census
2.4.3 Migration
A migrant has been defined as a person whose current place of residence is different from
his/her place of birth or previous place of residence. Migrants tend to contribute directly to
population decrease in the source area and increase in the destination areas. People migrate
either within or from one region to another for a variety of reasons such as economic, family
reunification, educational opportunities or conflicts. The census information regarding birth
place and current residence are used to discuss inter- and intra- regional migrations.
Table 2.5 presents data on migrant population by place of birth and duration of residence in
the Ejisu-Juaben Municipality. It shows that there are 53,361 persons who were enumerated
in their localities of residence but born elsewhere (migrants). Of this number, nearly 60
percent (58.4%) were born in other localities in the Ashanti Region, 6.0 percent were born in
the Eastern Region. About 6 percent (5.9%) and 5.6 percent of the migrants were attracted
from the Brong Ahafo and Central regions respectively.
As shown in Table 2.5, less than two-fifth (38.1%) of the migrants have lived in the
Municipality for between one and four years while 46.4 percent of them have lived in the
Municipality for at least five years. There are variations in the length of stay of migrants from
the various regions in the Municipality. Relatively high proportions (about 40 percent) of
migrants from the Western, Central and Greater Accra regions have lived in the Municipality
for between 1 and 4 years. About 15 percent of migrants from the Eastern Region have been
long-term residents (20 years or more).
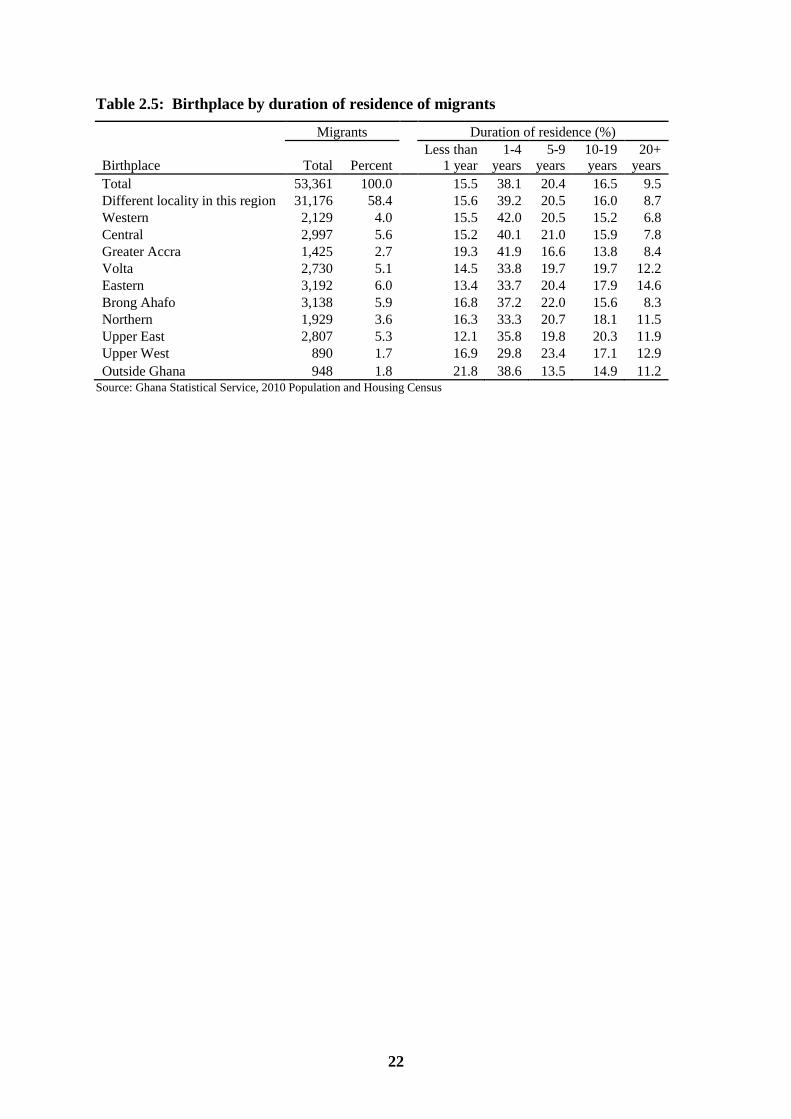
22
Table 2.5: Birthplace by duration of residence of migrants
Birthplace
Migrants Duration of residence (%)
Total Percent
Less than
1 year
1-4
years
5-9
years
10-19
years
20+
years
Total 53,361 100.0
15.5 38.1 20.4 16.5 9.5
Different locality in this region 31,176 58.4
15.6 39.2 20.5 16.0 8.7
Western 2,129 4.0
15.5 42.0 20.5 15.2 6.8
Central 2,997 5.6
15.2 40.1 21.0 15.9 7.8
Greater Accra 1,425 2.7
19.3 41.9 16.6 13.8 8.4
Volta 2,730 5.1
14.5 33.8 19.7 19.7 12.2
Eastern 3,192 6.0
13.4 33.7 20.4 17.9 14.6
Brong Ahafo 3,138 5.9
16.8 37.2 22.0 15.6 8.3
Northern 1,929 3.6
16.3 33.3 20.7 18.1 11.5
Upper East 2,807 5.3
12.1 35.8 19.8 20.3 11.9
Upper West 890 1.7
16.9 29.8 23.4 17.1 12.9
Outside Ghana 948 1.8 21.8 38.6 13.5 14.9 11.2 Source: Ghana Statistical Service, 2010 Population and Housing Census

23
CHAPTER THREE
SOCIAL CHARACTERISTICS
3.1 Introduction
The welfare of a geographical scope and its inhabitants can be better understood in terms of
its social characteristics. This chapter analyses the household size, household composition
and structure, marital status, nationality, religious affiliation, literacy and educational status
of the population of the Ejisu-Juaben Municipality.
3.2 Household Size, Composition and Structure
The Ejisu-Juaben Municipality has a total population of 143,762 out of which 141,177
persons were enumerated in households (household population). Table 3.1 presents
households by type of locality. It shows that 141,177 people were enumerated in a total of
33,078 households with an average size of 4.1 persons which is slightly lower than the
regional average of 4.4. The average household size in rural areas (4.4) is slightly higher than
that of the urban areas (4.0).
Table 3.1: Households by type of locality
Categories Total country Region District Urban Rural
Total household population 24,076,327 4,671,982 141,177 38,785 102,392
Number of households 5,467,054 1,126,205 33,078 9,662 23,416
Average household size 4.4 4.1 4.3 4.0 4.4 Source: Ghana Statistical Service, 2010 Population and Housing Census
The nature of the composition differs markedly between the males and females in the
Municipality as presented in Table 3.2. The total number of households’ population in the
Municipality is 141,177 consisting 67,336 (47.7%) males and 73,811 (52.3%) females. In
both male-headed and female-headed households, children constitute the highest proportions
of the population (44.6% males and 41.0% females). This is followed by heads of households
(23.4%) and grandchild (11.3%). As expected, biological children constitute the largest
proportions of the household (42.7%).
Table 3.2: Household population by composition and sex
Household composition
Total
Male
Female
Number Percent Number Percent Number Percent
Total 141,177 100.0
67,366 100.0
73,811 100.0
Head 33,078 23.4
20,153 29.9
12,925 17.5
Spouse (wife/husband) 13,855 9.8
775 1.2
13,080 17.7
Child (son/daughter) 60,328 42.7
30,038 44.6
30,290 41.0
Parent/parent in-law 1,231 0.9
113 0.2
1,118 1.5
Son/daughter in-law 611 0.4
225 0.3
386 0.5
Grandchild 15,880 11.3
7,832 11.6
8,048 10.9
Brother/Sister 4,791 3.4
2,573 3.8
2,218 3.0
Step child 908 0.6
483 0.7
425 0.6
Adopted/foster child 524 0.4
226 0.3
298 0.4
Other relative 7,774 5.5
3,718 5.5
4,056 5.5
Non-relative 2,197 1.6 1,230 1.8 967 1.3 Source: Ghana Statistical Service, 2010 Population and Housing Census

24
3.2.1 Household population by structure and sex
Data on household composition by sex is presented in Table 3.3 which indicates that nuclear
family constitutes 34.5 percent and extended family type forms 65.5 percent of all households
in the Municipality. Nuclear households made up of the head, spouse and children constitute
the highest percentage of 28.6 percent. The extended households made up of the head,
spouses, children and head’s relatives constitute 17.8 percent of all households.
Table 3.3: Household population by structure and sex
Household structure
Total
Male
Female
Number Percent Number Percent Number Percent
Total 141,177 100.0
67,366 100.0
73,811 100.0
Head only 5,953 4.2
4,038 6.0
1,915 2.6
Head and a spouse only 2,362 1.7
1,180 1.8
1,182 1.6
Nuclear (Head, spouse and children) 40,300 28.6
20,701 30.7
19,599 26.6
Extended (Head, spouse, children and
Head's relatives) 25,099 17.8
12,297 18.3
12,802 17.3
Extended and non-relatives 2,023 1.4
1,009 1.5
1,014 1.4
Head, spouse and other composition 4,617 3.3
2,360 3.5
2,257 3.1
Single parent nuclear 17,773 12.6
7,339 10.9
10,434 14.1
Single parent Extended 28,246 20.0
11,193 16.6
17,053 23.1
Single parent Extended and non-
relative 2,540 1.8
1,105 1.6
1,435 1.9
Head and other composition but no
spouse 12,264 8.7 6,144 9.1 6,120 8.3 Source: Ghana Statistical Service, 2010 Population and Housing Census
3.3 Marital Status
This section of the chapter discusses the marital status of persons aged 12 years and older by
age groups in the Municipality. Marital status varies greatly in the Municipality as shown in
Table 3.4. Those who have never married (41.1%) dominate persons aged 12 years and older
while the proportion of the married population constitute 38.2 percent. The population living
together constitute 8.7 percent, while those who were formerly in a marital union constitute
12 percent of the marriageable age group.
A high proportion of the population in the age groups 12-14 years (94.8%), 15-19 years
(94.1%), and 20-24 (78.6.8%) have never married as shown in Table 3.4. This is because of
schooling, especially in the case of the younger cohorts aged below 20 years. These children
are supposed to be in school. As expected, the proportion of the population who have never
been married, declines with increase in age.
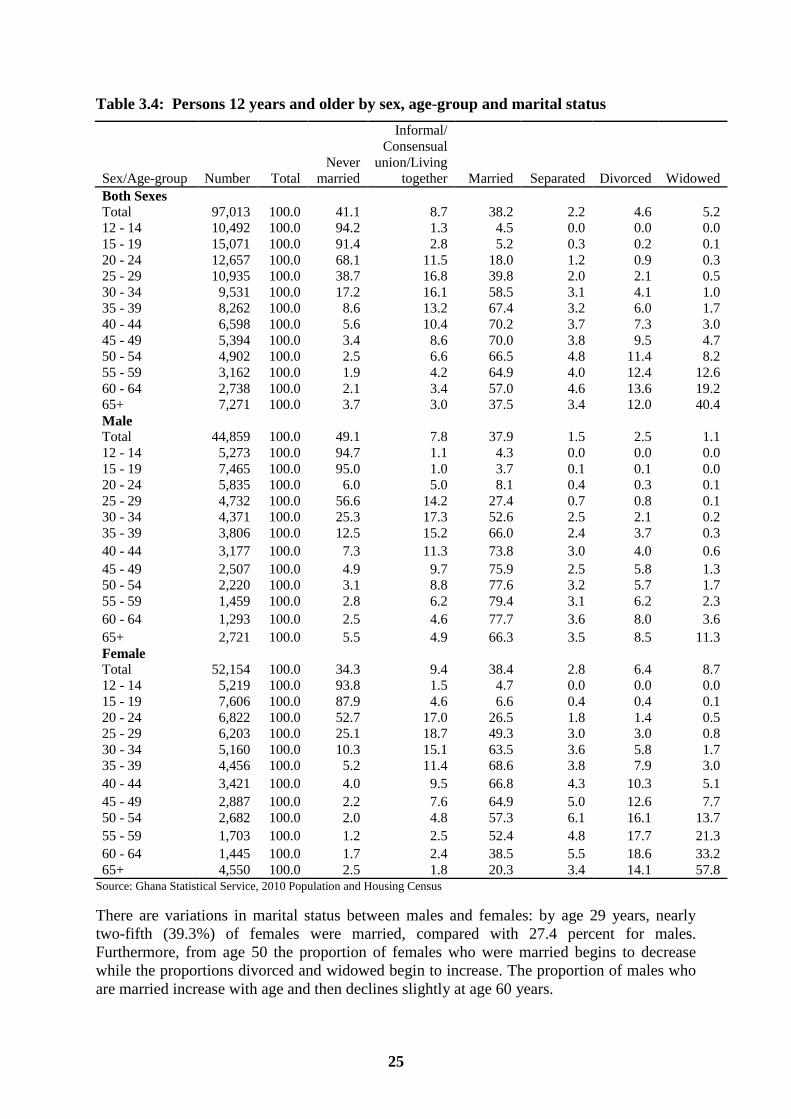
25
Table 3.4: Persons 12 years and older by sex, age-group and marital status
Sex/Age-group Number Total
Never
married
Informal/
Consensual
union/Living
together Married Separated Divorced Widowed
Both Sexes
Total 97,013 100.0 41.1 8.7 38.2 2.2 4.6 5.2
12 - 14 10,492 100.0 94.2 1.3 4.5 0.0 0.0 0.0
15 - 19 15,071 100.0 91.4 2.8 5.2 0.3 0.2 0.1
20 - 24 12,657 100.0 68.1 11.5 18.0 1.2 0.9 0.3
25 - 29 10,935 100.0 38.7 16.8 39.8 2.0 2.1 0.5
30 - 34 9,531 100.0 17.2 16.1 58.5 3.1 4.1 1.0
35 - 39 8,262 100.0 8.6 13.2 67.4 3.2 6.0 1.7
40 - 44 6,598 100.0 5.6 10.4 70.2 3.7 7.3 3.0
45 - 49 5,394 100.0 3.4 8.6 70.0 3.8 9.5 4.7
50 - 54 4,902 100.0 2.5 6.6 66.5 4.8 11.4 8.2
55 - 59 3,162 100.0 1.9 4.2 64.9 4.0 12.4 12.6
60 - 64 2,738 100.0 2.1 3.4 57.0 4.6 13.6 19.2
65+ 7,271 100.0 3.7 3.0 37.5 3.4 12.0 40.4
Male
Total 44,859 100.0 49.1 7.8 37.9 1.5 2.5 1.1
12 - 14 5,273 100.0 94.7 1.1 4.3 0.0 0.0 0.0
15 - 19 7,465 100.0 95.0 1.0 3.7 0.1 0.1 0.0
20 - 24 5,835 100.0 6.0 5.0 8.1 0.4 0.3 0.1
25 - 29 4,732 100.0 56.6 14.2 27.4 0.7 0.8 0.1
30 - 34 4,371 100.0 25.3 17.3 52.6 2.5 2.1 0.2
35 - 39 3,806 100.0 12.5 15.2 66.0 2.4 3.7 0.3
40 - 44 3,177 100.0 7.3 11.3 73.8 3.0 4.0 0.6
45 - 49 2,507 100.0 4.9 9.7 75.9 2.5 5.8 1.3
50 - 54 2,220 100.0 3.1 8.8 77.6 3.2 5.7 1.7
55 - 59 1,459 100.0 2.8 6.2 79.4 3.1 6.2 2.3
60 - 64 1,293 100.0 2.5 4.6 77.7 3.6 8.0 3.6
65+ 2,721 100.0 5.5 4.9 66.3 3.5 8.5 11.3
Female
Total 52,154 100.0 34.3 9.4 38.4 2.8 6.4 8.7
12 - 14 5,219 100.0 93.8 1.5 4.7 0.0 0.0 0.0
15 - 19 7,606 100.0 87.9 4.6 6.6 0.4 0.4 0.1
20 - 24 6,822 100.0 52.7 17.0 26.5 1.8 1.4 0.5
25 - 29 6,203 100.0 25.1 18.7 49.3 3.0 3.0 0.8
30 - 34 5,160 100.0 10.3 15.1 63.5 3.6 5.8 1.7
35 - 39 4,456 100.0 5.2 11.4 68.6 3.8 7.9 3.0
40 - 44 3,421 100.0 4.0 9.5 66.8 4.3 10.3 5.1
45 - 49 2,887 100.0 2.2 7.6 64.9 5.0 12.6 7.7
50 - 54 2,682 100.0 2.0 4.8 57.3 6.1 16.1 13.7
55 - 59 1,703 100.0 1.2 2.5 52.4 4.8 17.7 21.3
60 - 64 1,445 100.0 1.7 2.4 38.5 5.5 18.6 33.2
65+ 4,550 100.0 2.5 1.8 20.3 3.4 14.1 57.8 Source: Ghana Statistical Service, 2010 Population and Housing Census
There are variations in marital status between males and females: by age 29 years, nearly
two-fifth (39.3%) of females were married, compared with 27.4 percent for males.
Furthermore, from age 50 the proportion of females who were married begins to decrease
while the proportions divorced and widowed begin to increase. The proportion of males who
are married increase with age and then declines slightly at age 60 years.

26
Although in Ghana, the legal age at marriage is 16 years, among those aged 12-14 years, 4.3
percent of males and 4.7 percent of females said they are married and further 1.1 percent
males and 1.5 percent females are in consensual union (Table 3.4).
3.3.2 Marital status and level of education of person 12 years and older
Table 3.5 shows the distribution of the population 12 years and older by sex, marital status
and level of education in the Ejisu-Juaben Municipality. The data shows that majority
(63.9%) of the population 12 years and older has obtained the basic level of education, 12.3
percent has obtained secondary level of education and 15.8 percent has no education. Higher
proportions of those in the informal union (73.2%) and those never married (67.4%) have
obtained the basic level of education. Compared with the other statuses, the widowed
population (63.0%) has very high proportion of those with no education.
Irrespective of the status, the proportions of females with no education are higher than their
male counterparts. On the other hand, the proportions of males with secondary and higher
levels of education are higher than their female counterparts for all statuses (Table 3.5).
Table 3.5: Persons 12 years and older by sex, marital status and level of education
Sex/Marital status Number
All
levels
No
Education Basic1
Secon-
dary2
Voc/
Tech/
Comm
Post
middle/
secondary
certificate/
diploma3 Tertiary
4
Both Sexes
Total 97,013 100.0 15.8 63.9 12.3 1.6 4.4 2
Never married 39,913 100.0 4.7 67.4 19.9 1.1 5 1.8
Informal/Consensual
union 8,393 100.0 13.2 73.2 8.8 1.8 2.3 0.7
Married 37,046 100.0 19.2 62.7 7.9 2.3 5 2.9
Separated 2,150 100.0 25.7 63.9 5.2 1.3 3.3 0.7
Divorced 4,444 100.0 32.9 59.6 3.5 1.3 2.1 0.6
Widowed 5,067 100.0 63.0 32.9 1.6 0.7 1.6 0.3
Male
Total 44,859 100.0 9.2 65.3 15 1.9 5.6 3.1
Never married 22,006 100.0 4.4 66.8 20.2 1.2 5.2 2.3
Informal/Consensual
union 3,515 100.0 9.2 72.6 11.5 2.1 3.4 1.3
Married 17,023 100.0 13.3 62.3 10.2 2.8 6.9 4.6
Separated 681 100.0 17.6 67.8 7.3 1.8 4.1 1.3
Divorced 1,121 100.0 19.4 67.7 6.2 1.6 3.5 1.5
Widowed 513 100.0 41.1 48.9 4.3 1.4 2.7 1.6
Female
Total 52,154 100.0 21.4 62.6 10.1 1.4 3.4 1.1
Never married 17,907 100.0 5.1 68.3 19.6 1.1 4.7 1.3
Informal/Consensual
union 4,878 100.0 16.1 73.7 6.8 1.5 1.6 0.2
Married 20,023 100.0 24.1 63.0 6.0 1.9 3.5 1.5
Separated 1,469 100.0 29.5 62.0 4.2 1.0 2.9 0.3
Divorced 3,323 100.0 37.4 56.9 2.5 1.2 1.7 0.3
Widowed 4,554 100.0 65.4 31.0 1.3 0.6 1.5 0.2 Source: Ghana Statistical Service, 2010 Population and Housing Census
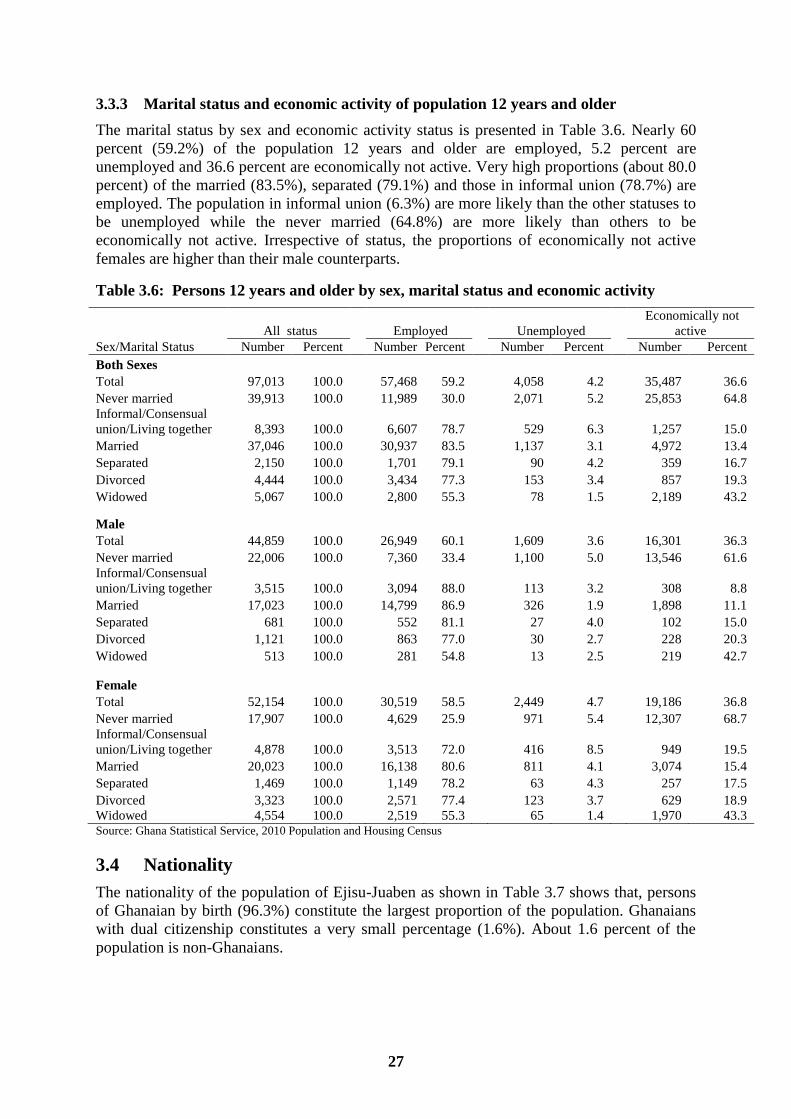
27
3.3.3 Marital status and economic activity of population 12 years and older
The marital status by sex and economic activity status is presented in Table 3.6. Nearly 60
percent (59.2%) of the population 12 years and older are employed, 5.2 percent are
unemployed and 36.6 percent are economically not active. Very high proportions (about 80.0
percent) of the married (83.5%), separated (79.1%) and those in informal union (78.7%) are
employed. The population in informal union (6.3%) are more likely than the other statuses to
be unemployed while the never married (64.8%) are more likely than others to be
economically not active. Irrespective of status, the proportions of economically not active
females are higher than their male counterparts.
Table 3.6: Persons 12 years and older by sex, marital status and economic activity
Sex/Marital Status
All status
Employed Unemployed
Economically not
active
Number Percent Number Percent Number Percent Number Percent
Both Sexes
Total 97,013 100.0
57,468 59.2
4,058 4.2
35,487 36.6
Never married 39,913 100.0
11,989 30.0
2,071 5.2
25,853 64.8
Informal/Consensual
union/Living together 8,393 100.0
6,607 78.7
529 6.3
1,257 15.0
Married 37,046 100.0
30,937 83.5
1,137 3.1
4,972 13.4
Separated 2,150 100.0
1,701 79.1
90 4.2
359 16.7
Divorced 4,444 100.0
3,434 77.3
153 3.4
857 19.3
Widowed 5,067 100.0
2,800 55.3
78 1.5
2,189 43.2
Male
Total 44,859 100.0
26,949 60.1
1,609 3.6
16,301 36.3
Never married 22,006 100.0
7,360 33.4
1,100 5.0
13,546 61.6
Informal/Consensual
union/Living together 3,515 100.0
3,094 88.0
113 3.2
308 8.8
Married 17,023 100.0
14,799 86.9
326 1.9
1,898 11.1
Separated 681 100.0
552 81.1
27 4.0
102 15.0
Divorced 1,121 100.0
863 77.0
30 2.7
228 20.3
Widowed 513 100.0
281 54.8
13 2.5
219 42.7
Female
Total 52,154 100.0
30,519 58.5
2,449 4.7
19,186 36.8
Never married 17,907 100.0
4,629 25.9
971 5.4
12,307 68.7
Informal/Consensual
union/Living together 4,878 100.0
3,513 72.0
416 8.5
949 19.5
Married 20,023 100.0
16,138 80.6
811 4.1
3,074 15.4
Separated 1,469 100.0
1,149 78.2
63 4.3
257 17.5
Divorced 3,323 100.0
2,571 77.4
123 3.7
629 18.9
Widowed 4,554 100.0
2,519 55.3
65 1.4
1,970 43.3 Source: Ghana Statistical Service, 2010 Population and Housing Census
3.4 Nationality
The nationality of the population of Ejisu-Juaben as shown in Table 3.7 shows that, persons
of Ghanaian by birth (96.3%) constitute the largest proportion of the population. Ghanaians
with dual citizenship constitutes a very small percentage (1.6%). About 1.6 percent of the
population is non-Ghanaians.

28
Table 3.7: Population by nationality and sex
Nationality
Both sexes
Male
Female
Number Percent Number Percent Number Percent
Total 143,762 100.0
68,648 100.0
75,114 100.0
Ghanaian by birth 138,402 96.3
65,991 96.1
72,411 96.4
Dual Nationality 2,256 1.6
1,052 1.5
1,204 1.6
Ghanaian by naturalization 755 0.5
369 0.5
386 0.5
ECOWAS 1,266 0.9
705 1.0
561 0.7
Africa other than ECOWAS 602 0.4
307 0.4
295 0.4
Other 481 0.3 224 0.3 257 0.3
Source: Ghana Statistical Service, 2010 Population and Housing Census
3.5 Religious Affiliation
Table 3.8 shows the population by religion and sex in the Municipality. Christianity is the
dominant religion in the Municipality, with 84.1 percent of the population indicating
affiliation to it. About one-third (32.5%) of the population belongs to the
Pentecostal/charismatic faith. Adherents to Islamic religion constitute 8.1 percent and 6.1
percent of the population has no religion. Again, 86.8 percent of the total female population
and 81.0 percent of males are adherents to Christianity. Males (8.2%) are more likely than
females (4.2%) to have no religion in the Municipality.
Table 3.8: Population by religion and sex
Religion Both sexes Male Female
Number Percent
Number Percent
Number Percent
Total 143,762 100.0
68,648 100.0
75,114 100.0
No Religion 8,774 6.1
5,624 8.2
3,150 4.2
Catholic 18,948 13.2
8,941 13.0
10,007 13.3
Protestant (Anglican Lutheran
etc.) 33,099 23.0
14,986 21.8
18,113 24.1
Pentecostal/Charismatic 46,665 32.5
21,196 30.9
25,469 33.9
Other Christians 22,181 15.4
10,522 15.3
11,659 15.5
Islam 11,686 8.1
6,151 9.0
5,535 7.4
Traditionalist 1,243 0.9
653 1.0
590 0.8
Other 1,166 0.8 575 0.8 591 0.8
Source: Ghana Statistical Service, 2010 Population and Housing Census
3.6 Literacy and Education
Education serves as the backbone of development in every geographical area. Any nation that
has illiterate human resource suffers greatly in the attempt to develop. This section of the
chapter gives the analysis of data on the literacy status of population aged 11 years and older.
It also presents data on the level of education and school attendance of the population three
years and Older in the Ejisu-Juaben Municipality.

29
3.6.1 Literacy status of population 11 years and older
The literacy rate of the Municipality is presented in Figure 3.1. It is observed that an
overwhelming proportion (84.7%) of the population 11 years and older are literate in one
language or another. Of the literate population, 73.1 percent are literate in English and a
Ghanaian language. The percentage of those who are literate in Ghanaian language only
(14.7%) is higher than that for English only (11.1%). Only 1.1 percent of the population is
literate in French in the Municipality.
Figure 3.1: Literacy status of population 11 years and older
Source: Ghana Statistical Service, 2010 Population and Housing Census
3.6.2 School attendance and level of education of population 3 years and older
Figure 3.2 shows that more than 10 percent (12.9%) of the population in the Municipality
have never attended school. About 44 percent of the population have attended school in the
past, while 42.9 percent are attending school now. More females (17.4%) than males (7.9%)
have never attended school. On the other hand, higher proportions of males (92.1%) than
females (82.6%) have ever attended school.
Figure 3.2: School attendance of population 3 years and older
Source: Ghana Statistical Service, 2010 Population and Housing Census

30
Table 3.9 indicates that 56,495 of population 3 years and older comprising 29,336 (51.9%)
males and 27,159 females (48.1%) are currently attending school in the Municipality.
On the other hand, 58,136 representing a little more than half (50.7%) have attended school
in the past. It consists of 48.4 percent males and 51.6 percent females. A greater proportion
(46.9%) of those currently attending is in Primary level of education, 18.2 percent are at
Junior High School and 16.5 percent are in Kindergarten. Thus, 81.6 percent of the
populations currently attending school are at Basic level of education. Only 2.7 percent of the
school-going age population are at the tertiary level of schooling.
Of those who had attended in the past, 78.2 percent had had basic school education and 21.8
percent had had secondary school or higher education.
Table 3.9: Population 3 years and older by school attendance and sex
Both sexes Male Female
Level of education Number Percent Number Percent Number Percent
Currently attending
Total 56,495 100.0
29,336 100.0
27,159 100.0
Nursery 3,299 5.8
1,678 5.7
1,621 6.0
Kindergarten 9,308 16.5
4,754 16.2
4,554 16.8
Primary 26,504 46.9
13,595 46.3
12,909 47.5
JSS/JHS 10,310 18.2
5,388 18.4
4,922 18.1
SSS/SHS - 0.0
2,742 9.3
2,346 8.6
Vocational/technical/commercial 160 0.3
83 0.3
77 0.3
Post middle/secondary certificate 305 0.5
129 0.4
176 0.6
Tertiary 1,521 2.7
967 3.3
554 2.0
Attended in the past
Total 58,136 100.0
28,156 100.0
29,980 100.0
Primary 8,259 14.2
2,793 9.9
5,466 18.2
JSS/JHS 19,625 33.8
8,584 30.5
11,041 36.8
Middle* 17,571 30.2
9,262 32.9
8,309 27.7
SSS/SHS 5,269 9.1
2,869 10.2
2,400 8.0
Secondary** 1,604 2.8
1,107 3.9
497 1.7
Vocational/Technical/Commercial 1,414 2.4
755 2.7
659 2.2
Post middle/secondary certificate 1,279 2.2
692 2.5
587 2.0
Tertiary 3,115 5.4 2,094 7.4 1,021 3.4 Source: Ghana Statistical Service, 2010 Population and Housing Census
*Middle schooling is abolished **Secondary system of education is abolished
In terms of sex, slightly more males (82.4%) than females (80.9%) are currently attending
basic school at the basic level. On the other hand, more females (13.3%) than males (12.5%)
of the population is attending secondary school or higher education level. Also, higher
proportion of females (82.8%) than males (73.3%) of the population had had basic school
education. On the contrary, a higher proportion of males (26.7%) than females (17.2%) had
had secondary school or higher education. It is observed that 5.4 percent (7.4% males and
3.4% females) had attained a tertiary level education (Figure 3.3).
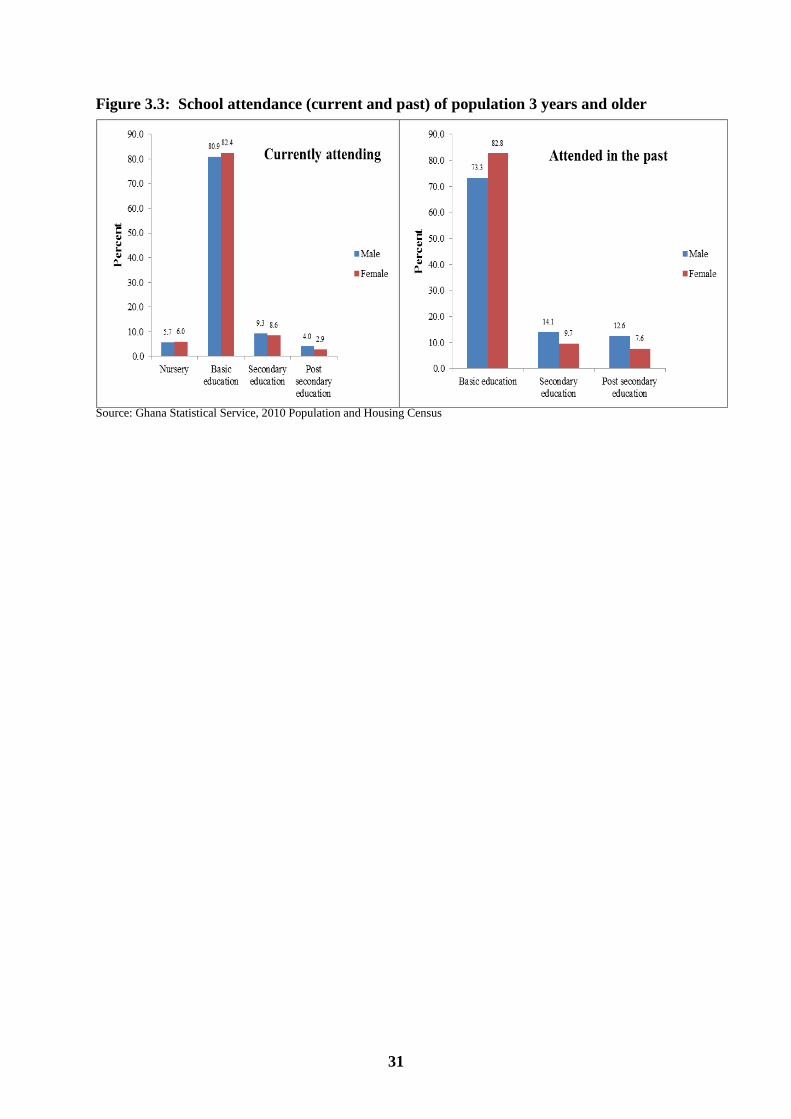
31
Figure 3.3: School attendance (current and past) of population 3 years and older
Source: Ghana Statistical Service, 2010 Population and Housing Census
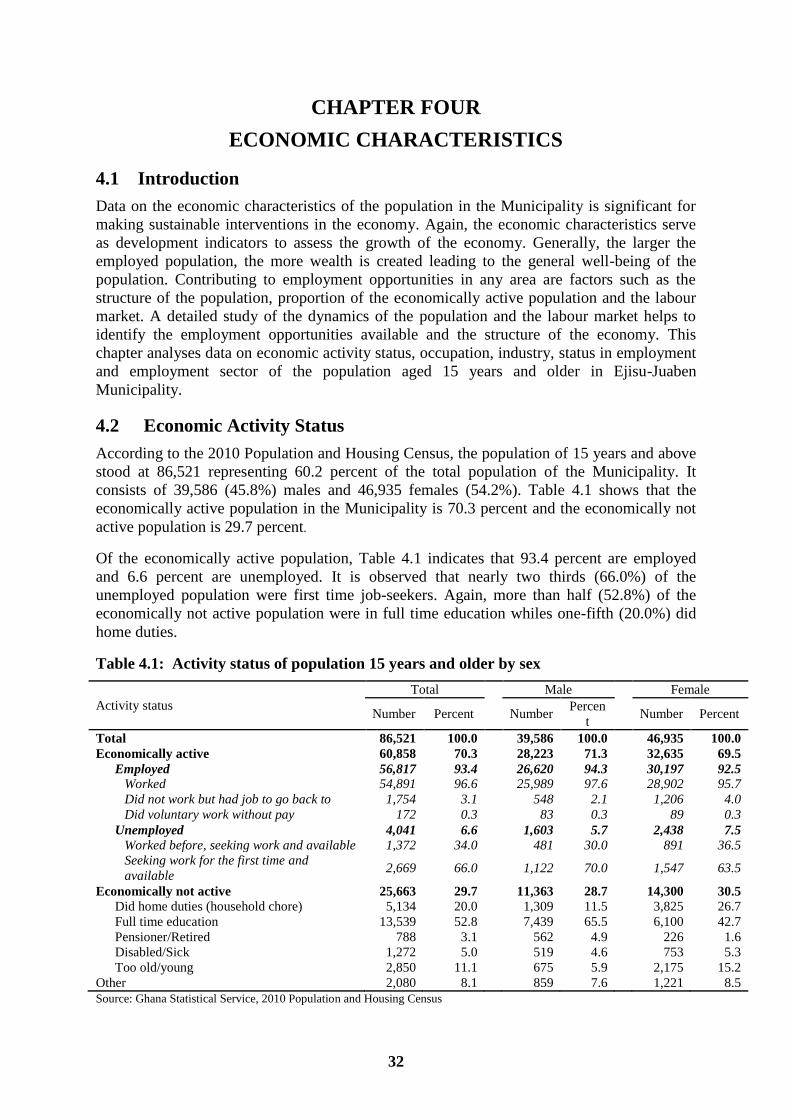
32
CHAPTER FOUR
ECONOMIC CHARACTERISTICS
4.1 Introduction
Data on the economic characteristics of the population in the Municipality is significant for
making sustainable interventions in the economy. Again, the economic characteristics serve
as development indicators to assess the growth of the economy. Generally, the larger the
employed population, the more wealth is created leading to the general well-being of the
population. Contributing to employment opportunities in any area are factors such as the
structure of the population, proportion of the economically active population and the labour
market. A detailed study of the dynamics of the population and the labour market helps to
identify the employment opportunities available and the structure of the economy. This
chapter analyses data on economic activity status, occupation, industry, status in employment
and employment sector of the population aged 15 years and older in Ejisu-Juaben
Municipality.
4.2 Economic Activity Status
According to the 2010 Population and Housing Census, the population of 15 years and above
stood at 86,521 representing 60.2 percent of the total population of the Municipality. It
consists of 39,586 (45.8%) males and 46,935 females (54.2%). Table 4.1 shows that the
economically active population in the Municipality is 70.3 percent and the economically not
active population is 29.7 percent.
Of the economically active population, Table 4.1 indicates that 93.4 percent are employed
and 6.6 percent are unemployed. It is observed that nearly two thirds (66.0%) of the
unemployed population were first time job-seekers. Again, more than half (52.8%) of the
economically not active population were in full time education whiles one-fifth (20.0%) did
home duties.
Table 4.1: Activity status of population 15 years and older by sex
Activity status
Total Male Female
Number Percent Number Percen
t Number Percent
Total 86,521 100.0
39,586 100.0
46,935 100.0
Economically active 60,858 70.3
28,223 71.3
32,635 69.5
Employed 56,817 93.4
26,620 94.3
30,197 92.5
Worked 54,891 96.6
25,989 97.6
28,902 95.7
Did not work but had job to go back to 1,754 3.1
548 2.1
1,206 4.0
Did voluntary work without pay 172 0.3
83 0.3
89 0.3
Unemployed 4,041 6.6
1,603 5.7
2,438 7.5
Worked before, seeking work and available 1,372 34.0
481 30.0
891 36.5
Seeking work for the first time and
available 2,669 66.0
1,122 70.0
1,547 63.5
Economically not active 25,663 29.7
11,363 28.7
14,300 30.5
Did home duties (household chore) 5,134 20.0
1,309 11.5
3,825 26.7
Full time education 13,539 52.8
7,439 65.5
6,100 42.7
Pensioner/Retired 788 3.1
562 4.9
226 1.6
Disabled/Sick 1,272 5.0
519 4.6
753 5.3
Too old/young 2,850 11.1
675 5.9
2,175 15.2
Other 2,080 8.1 859 7.6 1,221 8.5
Source: Ghana Statistical Service, 2010 Population and Housing Census

33
Differences exist between the sexes regarding their economic activity status. The proportion
of employed males (94.3%) is higher than that of the females (92.5%). On the contrary, the
proportions of the economically not active and unemployed females are higher than their
male counterparts.
In terms of age, Table 4.2 indicates that the proportions of the employed population increase
with increase in age from 16.5 percent for the 15-19 year age group to 91.3 percent for the
45-49 year age group. The proportions then decline gradually to 51.2 percent for the 65 years
and older age group. The proportion of the unemployed population for the 20-24 years age
group is the highest (10.3%). It is also observed that the younger age groups and the aged
have relatively high proportions of the economically not active population. The pattern of the
activity status for males and females are similar.
Table 4.2: Activity status of population 15 years and older by sex and age
Sex/Age group
All status
Employed
Unemployed
Economically not
active
Number Percent Number Percent Number Percent Number Percent
Total 86,521 100.0
56,817 65.7
4,041 4.7
25,663 29.7
15-19 15,071 100.0
2,462 16.3
711 4.7
11,898 78.9
20-24 12,657 100.0
6,689 52.8
1,309 10.3
4,659 36.8
25-29 10,935 100.0
8,311 76.0
869 7.9
1,755 16.0
30-34 9,531 100.0
8,086 84.8
429 4.5
1,016 10.7
35-39 8,262 100.0
7,377 89.3
258 3.1
627 7.6
40-44 6,598 100.0
6,004 91.0
152 2.3
442 6.7
45-49 5,394 100.0
4,924 91.3
97 1.8
373 6.9
50-54 4,902 100.0
4,398 89.7
72 1.5
432 8.8
55-59 3,162 100.0
2,779 87.9
45 1.4
338 10.7
60-64 2,738 100.0
2,065 75.4
58 2.1
615 22.5
65+ 7,271 100.0
3,722 51.2
41 0.6
3,508 48.2
Male
Total 39,586 100.0
26,620 67.2
1,603 4.0
11,363 28.7
15-19 7,465 100.0
1,203 16.1
288 3.9
5,974 80.0
20-24 5,835 100.0
2,984 51.1
534 9.2
2,317 39.7
25-29 4,732 100.0
3,722 78.7
299 6.3
711 15.0
30-34 4,371 100.0
3,892 89.0
165 3.8
314 7.2
35-39 3,806 100.0
3,535 92.9
97 2.5
174 4.6
40-44 3,177 100.0
2,964 93.3
74 2.3
139 4.4
45-49 2,507 100.0
2,338 93.3
41 1.6
128 5.1
50-54 2,220 100.0
2,057 92.7
29 1.3
134 6.0
55-59 1,459 100.0
1,341 91.9
23 1.6
95 6.5
60-64 1,293 100.0
1,012 78.3
27 2.1
254 19.6
65+ 2,721 100.0
1,572 57.8
26 1.0
1,123 41.3
Female
Total 46,935 100.0
30,197 64.3
2,438 5.2
14,300 30.5
15-19 7,606 100.0
1,259 16.6
423 5.6
5,924 77.9
20-24 6,822 100.0
3,705 54.3
775 11.4
2,342 34.3
25-29 6,203 100.0
4,589 74.0
570 9.2
1,044 16.8
30-34 5,160 100.0
4,194 81.3
264 5.1
702 13.6
35-39 4,456 100.0
3,842 86.2
161 3.6
453 10.2
40-44 3,421 100.0
3,040 88.9
78 2.3
303 8.9
45-49 2,887 100.0
2,586 89.6
56 1.9
245 8.5
50-54 2,682 100.0
2,341 87.3
43 1.6
298 11.1
55-59 1,703 100.0
1,438 84.4
22 1.3
243 14.3
60-64 1,445 100.0
1,053 72.9
31 2.1
361 25.0 65+ 4,550 100.0
2,150 47.3
15 0.3
2,385 52.4 Source: Ghana Statistical Service, 2010 Population and Housing Census
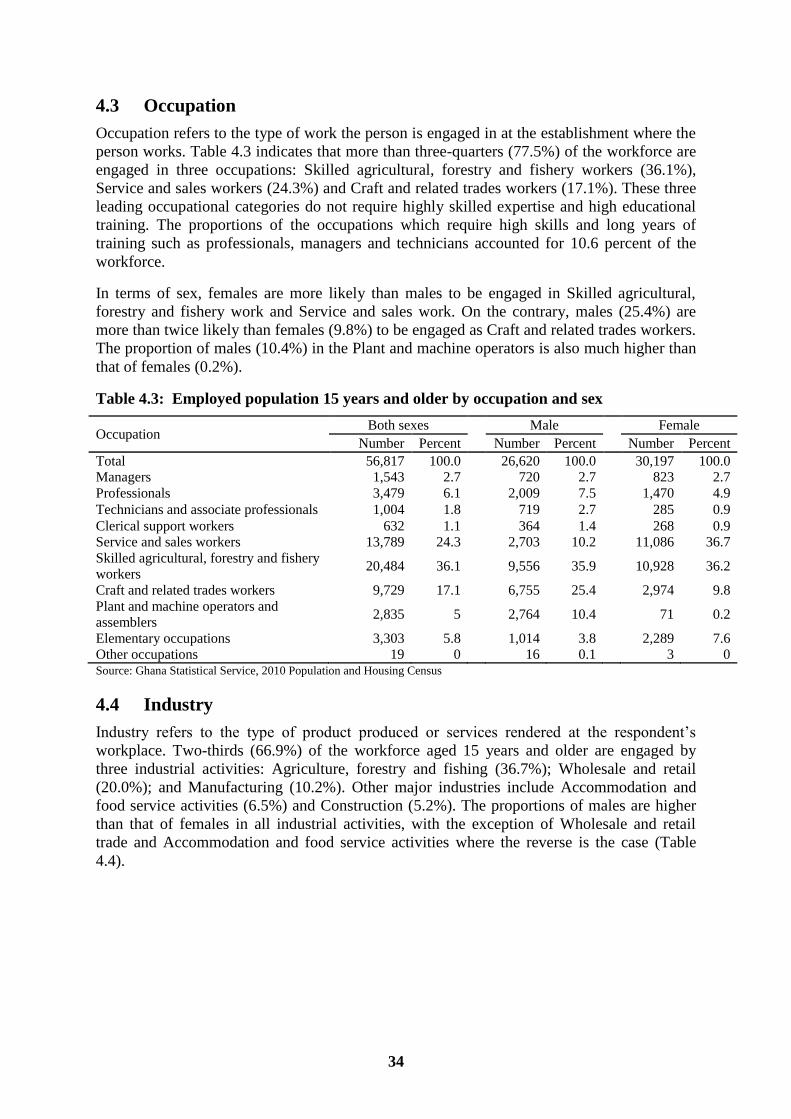
34
4.3 Occupation
Occupation refers to the type of work the person is engaged in at the establishment where the
person works. Table 4.3 indicates that more than three-quarters (77.5%) of the workforce are
engaged in three occupations: Skilled agricultural, forestry and fishery workers (36.1%),
Service and sales workers (24.3%) and Craft and related trades workers (17.1%). These three
leading occupational categories do not require highly skilled expertise and high educational
training. The proportions of the occupations which require high skills and long years of
training such as professionals, managers and technicians accounted for 10.6 percent of the
workforce.
In terms of sex, females are more likely than males to be engaged in Skilled agricultural,
forestry and fishery work and Service and sales work. On the contrary, males (25.4%) are
more than twice likely than females (9.8%) to be engaged as Craft and related trades workers.
The proportion of males (10.4%) in the Plant and machine operators is also much higher than
that of females (0.2%).
Table 4.3: Employed population 15 years and older by occupation and sex
Occupation Both sexes Male Female
Number Percent Number Percent Number Percent
Total 56,817 100.0
26,620 100.0
30,197 100.0
Managers 1,543 2.7
720 2.7
823 2.7
Professionals 3,479 6.1
2,009 7.5
1,470 4.9
Technicians and associate professionals 1,004 1.8
719 2.7
285 0.9
Clerical support workers 632 1.1
364 1.4
268 0.9
Service and sales workers 13,789 24.3
2,703 10.2
11,086 36.7
Skilled agricultural, forestry and fishery
workers 20,484 36.1
9,556 35.9
10,928 36.2
Craft and related trades workers 9,729 17.1
6,755 25.4
2,974 9.8
Plant and machine operators and
assemblers 2,835 5
2,764 10.4
71 0.2
Elementary occupations 3,303 5.8
1,014 3.8
2,289 7.6
Other occupations 19 0 16 0.1 3 0 Source: Ghana Statistical Service, 2010 Population and Housing Census
4.4 Industry
Industry refers to the type of product produced or services rendered at the respondent’s
workplace. Two-thirds (66.9%) of the workforce aged 15 years and older are engaged by
three industrial activities: Agriculture, forestry and fishing (36.7%); Wholesale and retail
(20.0%); and Manufacturing (10.2%). Other major industries include Accommodation and
food service activities (6.5%) and Construction (5.2%). The proportions of males are higher
than that of females in all industrial activities, with the exception of Wholesale and retail
trade and Accommodation and food service activities where the reverse is the case (Table
4.4).
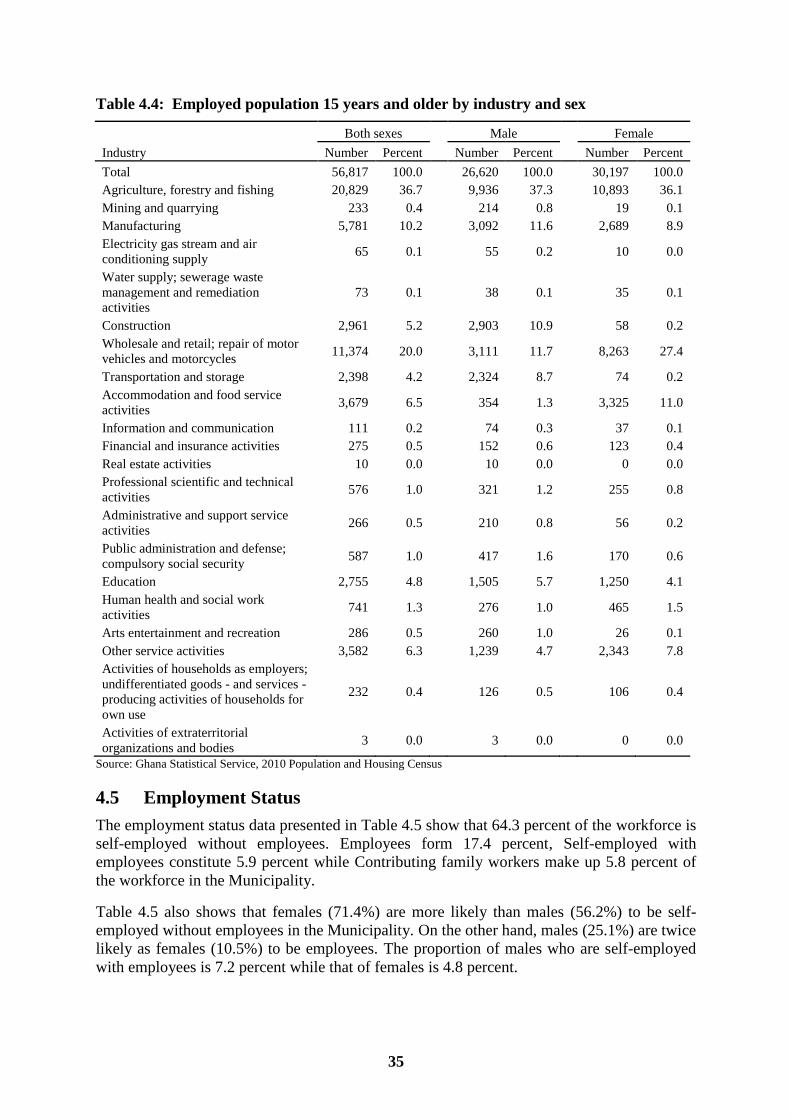
35
Table 4.4: Employed population 15 years and older by industry and sex
Industry
Both sexes Male Female
Number Percent Number Percent Number Percent
Total 56,817 100.0
26,620 100.0
30,197 100.0
Agriculture, forestry and fishing 20,829 36.7
9,936 37.3
10,893 36.1
Mining and quarrying 233 0.4
214 0.8
19 0.1
Manufacturing 5,781 10.2
3,092 11.6
2,689 8.9
Electricity gas stream and air
conditioning supply 65 0.1
55 0.2
10 0.0
Water supply; sewerage waste
management and remediation
activities
73 0.1
38 0.1
35 0.1
Construction 2,961 5.2
2,903 10.9
58 0.2
Wholesale and retail; repair of motor
vehicles and motorcycles 11,374 20.0
3,111 11.7
8,263 27.4
Transportation and storage 2,398 4.2
2,324 8.7
74 0.2
Accommodation and food service
activities 3,679 6.5
354 1.3
3,325 11.0
Information and communication 111 0.2
74 0.3
37 0.1
Financial and insurance activities 275 0.5
152 0.6
123 0.4
Real estate activities 10 0.0
10 0.0
0 0.0
Professional scientific and technical
activities 576 1.0
321 1.2
255 0.8
Administrative and support service
activities 266 0.5
210 0.8
56 0.2
Public administration and defense;
compulsory social security 587 1.0
417 1.6
170 0.6
Education 2,755 4.8
1,505 5.7
1,250 4.1
Human health and social work
activities 741 1.3
276 1.0
465 1.5
Arts entertainment and recreation 286 0.5
260 1.0
26 0.1
Other service activities 3,582 6.3
1,239 4.7
2,343 7.8
Activities of households as employers;
undifferentiated goods - and services -
producing activities of households for
own use
232 0.4
126 0.5
106 0.4
Activities of extraterritorial
organizations and bodies 3 0.0 3 0.0 0 0.0
Source: Ghana Statistical Service, 2010 Population and Housing Census
4.5 Employment Status
The employment status data presented in Table 4.5 show that 64.3 percent of the workforce is
self-employed without employees. Employees form 17.4 percent, Self-employed with
employees constitute 5.9 percent while Contributing family workers make up 5.8 percent of
the workforce in the Municipality.
Table 4.5 also shows that females (71.4%) are more likely than males (56.2%) to be self-
employed without employees in the Municipality. On the other hand, males (25.1%) are twice
likely as females (10.5%) to be employees. The proportion of males who are self-employed
with employees is 7.2 percent while that of females is 4.8 percent.

36
Table 4.5: Employed population 15 years and older by employment status and sex
Employment Status
Both sexes Male Female
Number Percent Number Percent Number Percent
Total 56,817 100.0
26,620 100.0
30,197 100.0
Employee 9,861 17.4
6,676 25.1
3,185 10.5
Self-employed without
employee(s) 36,528 64.3
14,971 56.2
21,557 71.4
Self-employed with employee(s) 3,365 5.9
1,907 7.2
1,458 4.8
Casual worker 1,363 2.4
953 3.6
410 1.4
Contributing family worker 3,314 5.8
1,080 4.1
2,234 7.4
Apprentice 1,986 3.5
853 3.2
1,133 3.8
Domestic employee (House help) 345 0.6
152 0.6
193 0.6
Other 55 0.1 28 0.1 27 0.1 Source: Ghana Statistical Service, 2010 Population and Housing Census
4.6 Employment Sector
Table 4.6 shows that the private informal sector (86.9%) was the largest employer in the
Municipality. This could be due to low levels of educational and professional training of the
employed population. The private informal sector does not require high levels of formal
education. Among the workforce, 6.6 percent is employed in the Public sector while 5.9
percent is employed by the Private formal sector.
The proportion of employed females working in the private informal sector is 91.3 percent
while that of males is 82.0 percent. Also, the proportion of males and females employed in
the public sector were 8.2 percent and 5.2 percent respectively (Table 4.6).
Table 4.6: Employed population 15 years and older by employment sector and sex
Employment Sector
Both sexes Male Female
Number Percent Number Percent Number Percent
Total 56,817 100.0
26,620 100.0
30,197 100.0
Public (Government) 3,760 6.6
2,195 8.2
1,565 5.2
Private Formal 3,347 5.9
2,384 9.0
963 3.2
Private Informal 49,400 86.9
21,830 82.0
27,570 91.3
Semi-Public/Parastatal 53 0.1
27 0.1
26 0.1
NGOs (Local and International) 255 0.4
182 0.7
73 0.2
Other International Organisations 2 0.0 2 0.0 0 0.0 Source: Ghana Statistical Service, 2010 Population and Housing Census

37
CHAPTER FIVE
INFORMATION COMMUNICATION TECHNOLOGY
5.1 Introduction
Access to information and communication technology is essential in increasing people’s
knowledge and awareness of what is taking place around them. The world is now linked
together with advanced communication technology and access to information is through the
computer, mobile phone and internet facilities which are fast becoming essential for living a
meaningful life. Globally, education or various systems of learning are now based on
information and technology. Information and Communication Technologies (ICT) have
become important tools in today’s knowledge-based information society and economy. The
2010 Population and Housing Census therefore collected information on various aspects of
ICT facility, access, ownership and use in Ghana. This chapter is on these ICT areas in the
Ejisu-Juaben Municipality.
5.2 Ownership of Mobile Phones
Cellular phone is the most widely used telecommunication tool in the Municipality. Table 5.1
shows that More than half (52.2%) of the population aged 12 years and older own mobile
phones in the Municipality. It is observed that more males (58.3%) than females (47.0%) 12
years and older owned mobile phones.
Table 5.1 further shows that only 5.5 percent of population 12 years and older used internet.
Generally, the proportion of the population using internet facility is quite low. It is observed
that higher proportion of males (7.9%) than females (3.5%) used the internet. The relatively
low levels of education in the Municipality may explain the low usage of internet in the
Municipality.
Table 5.1: Population 12 years and older by internet facility usage,
and sex
Sex
Population 12
years and older
Population having
mobile phone
Population using
internet facility
Number Percent Number Percent Number Percent
Total 97,013 100.0
50,629 52.2
5,375 5.5
Male 44,859 100.0
26,137 58.3
3,538 7.9
Female 52,154 100.0 24,492 47.0 1,837 3.5
Source: Ghana Statistical Service, 2010 Population and Housing Census
5.3 Household ownership of fixed telephone lines and computers
Despite the relatively widespread of mobile phones and internet, fixed telephone lines still
remain important. Table 5.2 shows that only 1.6 percent of all households in the Municipality
have fixed telephone lines. A relatively higher proportion of male-headed households (1.8%)
than the female-headed households (1.3%) have fixed telephone lines.
Desktop and laptop computers are useful for accessing and processing information, including
the use of the internet, electronic mail and other services. For the Municipality as a whole,
only 6.5 percent of households owned a desktop/laptop computer as depicted in Table 5.2.

38
Male-headed households (7.9%) are more likely than female-headed households (4.4%) to
own computers.
Table 5.2: Households having desktop/laptop computers, and sex of head
Sex
Number of
households
Population
owning fixed
telephone lines
Households owning
desktop/laptop
computers
Number Percent Number Percent Number Percent
Total 33,078 100.0
519 1.6
2,149 6.5
Male-headed 20,153 100.0
354 1.8
1,585 7.9
Female -headed 12,925 100.0 165 1.3 564 4.4
Source: Ghana Statistical Service, 2010 Population and Housing Census
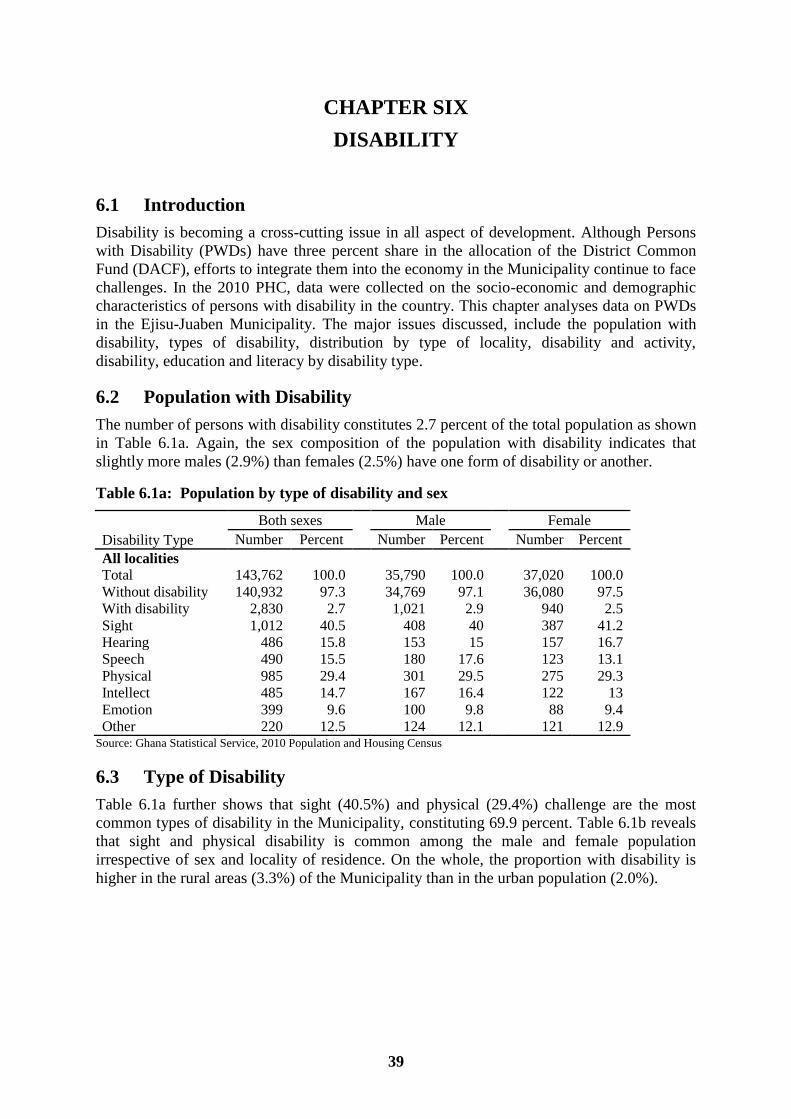
39
CHAPTER SIX
DISABILITY
6.1 Introduction
Disability is becoming a cross-cutting issue in all aspect of development. Although Persons
with Disability (PWDs) have three percent share in the allocation of the District Common
Fund (DACF), efforts to integrate them into the economy in the Municipality continue to face
challenges. In the 2010 PHC, data were collected on the socio-economic and demographic
characteristics of persons with disability in the country. This chapter analyses data on PWDs
in the Ejisu-Juaben Municipality. The major issues discussed, include the population with
disability, types of disability, distribution by type of locality, disability and activity,
disability, education and literacy by disability type.
6.2 Population with Disability
The number of persons with disability constitutes 2.7 percent of the total population as shown
in Table 6.1a. Again, the sex composition of the population with disability indicates that
slightly more males (2.9%) than females (2.5%) have one form of disability or another.
Table 6.1a: Population by type of disability and sex
Disability Type
Both sexes Male Female
Number Percent Number Percent Number Percent
All localities Total 143,762 100.0
35,790 100.0
37,020 100.0
Without disability 140,932 97.3
34,769 97.1
36,080 97.5
With disability 2,830 2.7
1,021 2.9
940 2.5
Sight 1,012 40.5
408 40
387 41.2
Hearing 486 15.8
153 15
157 16.7
Speech 490 15.5
180 17.6
123 13.1
Physical 985 29.4
301 29.5
275 29.3
Intellect 485 14.7
167 16.4
122 13
Emotion 399 9.6
100 9.8
88 9.4
Other 220 12.5 124 12.1 121 12.9 Source: Ghana Statistical Service, 2010 Population and Housing Census
6.3 Type of Disability
Table 6.1a further shows that sight (40.5%) and physical (29.4%) challenge are the most
common types of disability in the Municipality, constituting 69.9 percent. Table 6.1b reveals
that sight and physical disability is common among the male and female population
irrespective of sex and locality of residence. On the whole, the proportion with disability is
higher in the rural areas (3.3%) of the Municipality than in the urban population (2.0%).
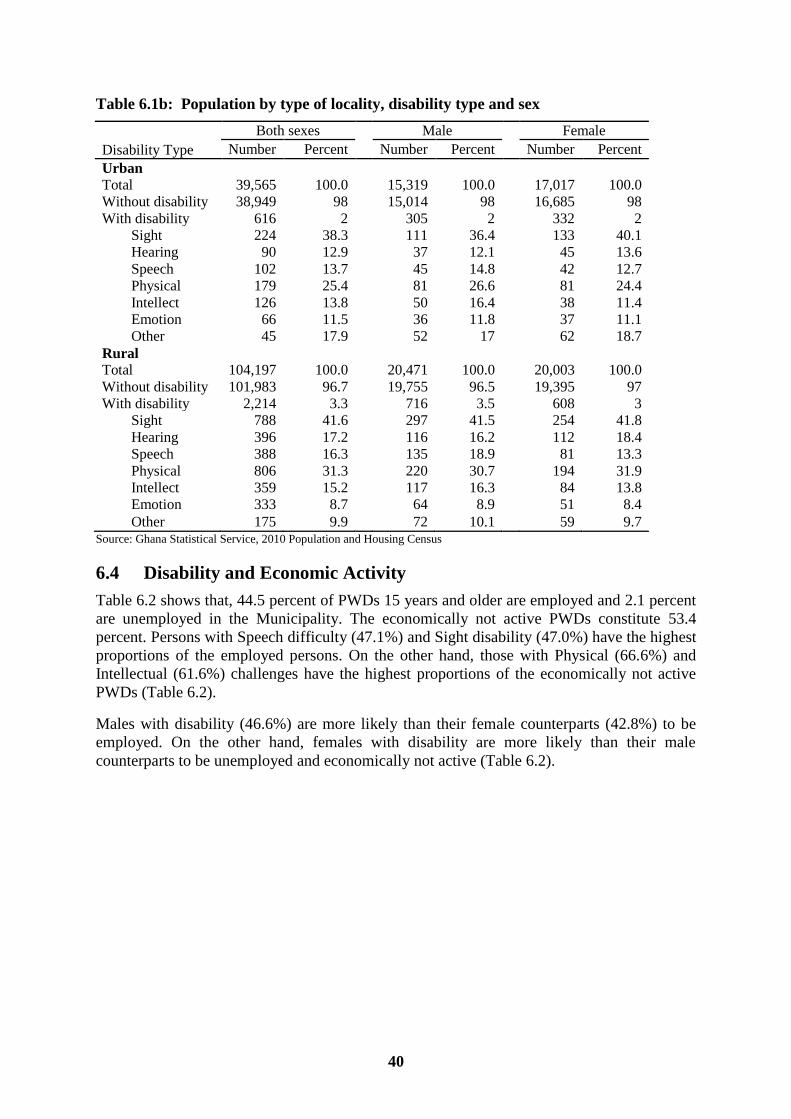
40
Table 6.1b: Population by type of locality, disability type and sex
Disability Type
Both sexes Male Female
Number Percent Number Percent Number Percent
Urban Total 39,565 100.0
15,319 100.0
17,017 100.0
Without disability 38,949 98
15,014 98
16,685 98
With disability 616 2
305 2
332 2
Sight 224 38.3
111 36.4
133 40.1
Hearing 90 12.9
37 12.1
45 13.6
Speech 102 13.7
45 14.8
42 12.7
Physical 179 25.4
81 26.6
81 24.4
Intellect 126 13.8
50 16.4
38 11.4
Emotion 66 11.5
36 11.8
37 11.1
Other 45 17.9
52 17
62 18.7
Rural Total 104,197 100.0
20,471 100.0
20,003 100.0
Without disability 101,983 96.7
19,755 96.5
19,395 97
With disability 2,214 3.3
716 3.5
608 3
Sight 788 41.6
297 41.5
254 41.8
Hearing 396 17.2
116 16.2
112 18.4
Speech 388 16.3
135 18.9
81 13.3
Physical 806 31.3
220 30.7
194 31.9
Intellect 359 15.2
117 16.3
84 13.8
Emotion 333 8.7
64 8.9
51 8.4
Other 175 9.9 72 10.1 59 9.7 Source: Ghana Statistical Service, 2010 Population and Housing Census
6.4 Disability and Economic Activity
Table 6.2 shows that, 44.5 percent of PWDs 15 years and older are employed and 2.1 percent
are unemployed in the Municipality. The economically not active PWDs constitute 53.4
percent. Persons with Speech difficulty (47.1%) and Sight disability (47.0%) have the highest
proportions of the employed persons. On the other hand, those with Physical (66.6%) and
Intellectual (61.6%) challenges have the highest proportions of the economically not active
PWDs (Table 6.2).
Males with disability (46.6%) are more likely than their female counterparts (42.8%) to be
employed. On the other hand, females with disability are more likely than their male
counterparts to be unemployed and economically not active (Table 6.2).
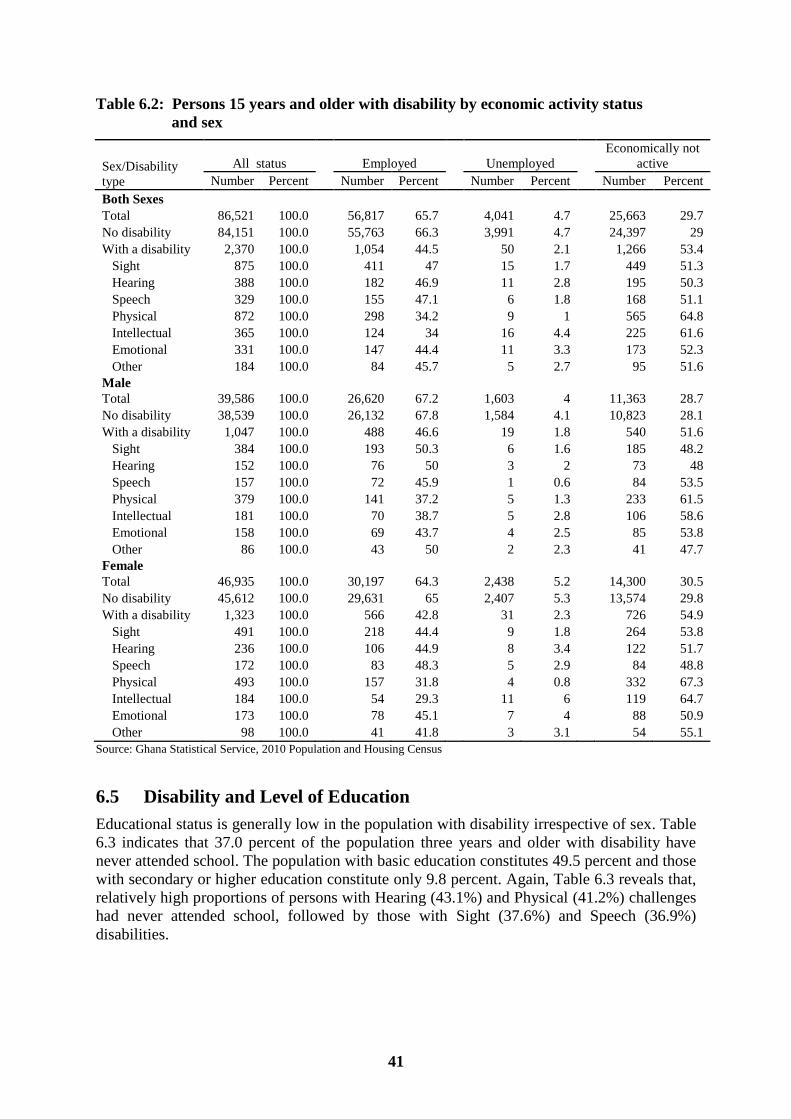
41
Table 6.2: Persons 15 years and older with disability by economic activity status
and sex
Sex/Disability
type
All status
Employed
Unemployed
Economically not
active
Number Percent Number Percent Number Percent Number Percent
Both Sexes
Total 86,521 100.0
56,817 65.7
4,041 4.7
25,663 29.7
No disability 84,151 100.0
55,763 66.3
3,991 4.7
24,397 29
With a disability 2,370 100.0
1,054 44.5
50 2.1
1,266 53.4
Sight 875 100.0
411 47
15 1.7
449 51.3
Hearing 388 100.0
182 46.9
11 2.8
195 50.3
Speech 329 100.0
155 47.1
6 1.8
168 51.1
Physical 872 100.0
298 34.2
9 1
565 64.8
Intellectual 365 100.0
124 34
16 4.4
225 61.6
Emotional 331 100.0
147 44.4
11 3.3
173 52.3
Other 184 100.0
84 45.7
5 2.7
95 51.6
Male
Total 39,586 100.0
26,620 67.2
1,603 4
11,363 28.7
No disability 38,539 100.0
26,132 67.8
1,584 4.1
10,823 28.1
With a disability 1,047 100.0
488 46.6
19 1.8
540 51.6
Sight 384 100.0
193 50.3
6 1.6
185 48.2
Hearing 152 100.0
76 50
3 2
73 48
Speech 157 100.0
72 45.9
1 0.6
84 53.5
Physical 379 100.0
141 37.2
5 1.3
233 61.5
Intellectual 181 100.0
70 38.7
5 2.8
106 58.6
Emotional 158 100.0
69 43.7
4 2.5
85 53.8
Other 86 100.0
43 50
2 2.3
41 47.7
Female
Total 46,935 100.0
30,197 64.3
2,438 5.2
14,300 30.5
No disability 45,612 100.0
29,631 65
2,407 5.3
13,574 29.8
With a disability 1,323 100.0
566 42.8
31 2.3
726 54.9
Sight 491 100.0
218 44.4
9 1.8
264 53.8
Hearing 236 100.0
106 44.9
8 3.4
122 51.7
Speech 172 100.0
83 48.3
5 2.9
84 48.8
Physical 493 100.0
157 31.8
4 0.8
332 67.3
Intellectual 184 100.0
54 29.3
11 6
119 64.7
Emotional 173 100.0
78 45.1
7 4
88 50.9
Other 98 100.0 41 41.8 3 3.1 54 55.1
Source: Ghana Statistical Service, 2010 Population and Housing Census
6.5 Disability and Level of Education
Educational status is generally low in the population with disability irrespective of sex. Table
6.3 indicates that 37.0 percent of the population three years and older with disability have
never attended school. The population with basic education constitutes 49.5 percent and those
with secondary or higher education constitute only 9.8 percent. Again, Table 6.3 reveals that,
relatively high proportions of persons with Hearing (43.1%) and Physical (41.2%) challenges
had never attended school, followed by those with Sight (37.6%) and Speech (36.9%)
disabilities.

42
Table 6.3: Population 3 years and older by sex, disability type and level
of education
Sex/Disability type Total
Percent
Total Never Pre-Prim Basic
Sec/SHS
and higher
Both Sexes
Total 131,624 100.0 12.9 9.6 62.5 15.0
No disability 128,891 100.0 12.4 9.7 62.8 15.1
With a disability 2,733 100.0 37.0 3.7 49.5 9.8
Sight 989 100.0 37.6 3.0 48.2 11.1
Hearing 464 100.0 43.1 4.3 43.3 9.3
Speech 447 100.0 36.9 7.2 47.2 8.7
Physical 972 100.0 41.2 3.2 46.9 8.7
Intellectual 448 100.0 36.2 6.0 50.2 7.6
Emotional 387 100.0 30.5 3.1 56.1 10.3
Other 213 100.0 28.6 4.7 54.0 12.7
Male
Total 62,457 100.0 7.9 10.3 63.4 18.3
No disability 61,211 100.0 7.6 10.4 63.6 18.4
With a disability 1,246 100.0 25.5 3.8 56.3 14.4
Sight 453 100.0 22.7 3.1 57.6 16.6
Hearing 203 100.0 33.5 3.4 51.7 11.3
Speech 224 100.0 32.1 5.4 52.2 10.3
Physical 438 100.0 26.9 4.3 55.3 13.5
Intellectual 221 100.0 31.7 4.5 52.0 11.8
Emotional 188 100.0 24.5 3.2 55.9 16.5
Other 101 100.0 23.8 3.0 57.4 15.8
Female
Total 69,167 100.0 17.4 8.9 61.7 12.0
No disability 67,680 100.0 16.7 9.0 62.0 12.2
With a disability 1,487 100.0 46.6 3.6 43.8 5.9
Sight 536 100.0 50.2 3.0 40.3 6.5
Hearing 261 100.0 50.6 5.0 36.8 7.7
Speech 223 100.0 41.7 9.0 42.2 7.2
Physical 534 100.0 52.8 2.2 40.1 4.9
Intellectual 227 100.0 40.5 7.5 48.5 3.5
Emotional 199 100.0 36.2 3.0 56.3 4.5
Other 112 100.0 33.0 6.3 50.9 9.8
Source: Ghana Statistical Service, 2010 Population and Housing Census
Table 6.3 further shows that there are more males than females with disability who had had
higher levels of education. It is observed that more than half (56.3%) of males and about two-
fifth (43.8%) of females with disability had attained basic school level of education. Again,
more than twice as many females (5.9%) as males (14.4) with disability had had secondary or
higher education.
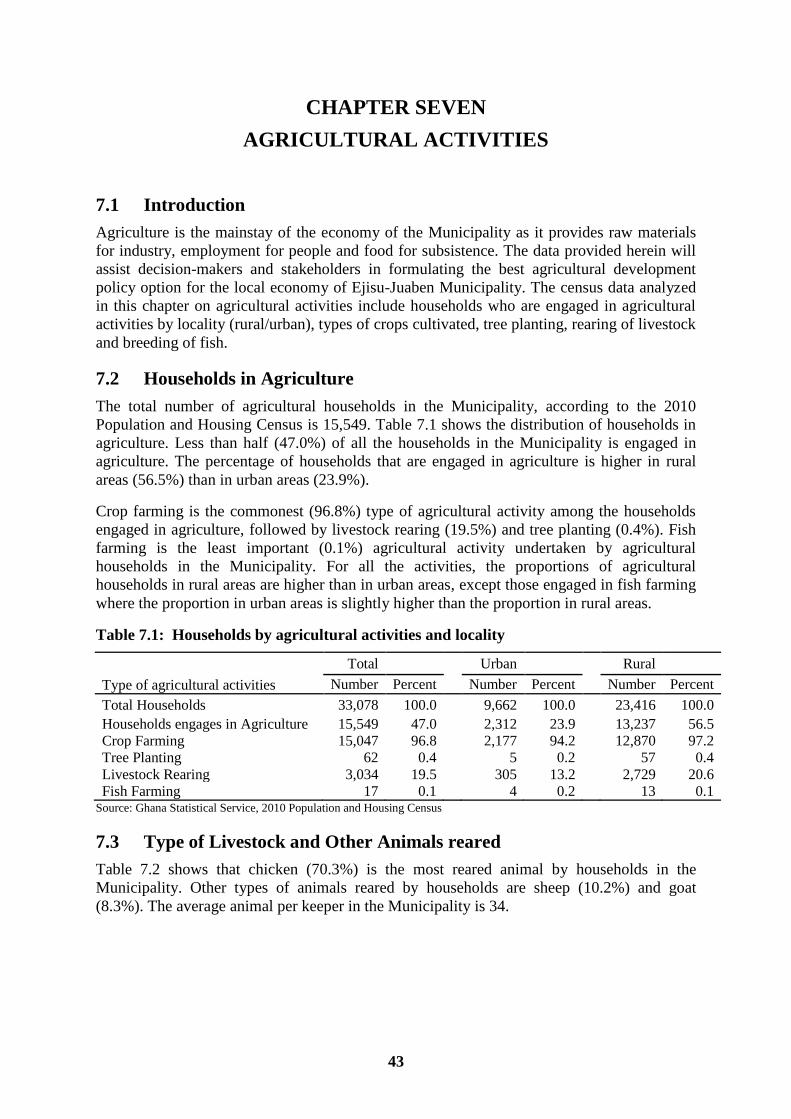
43
CHAPTER SEVEN
AGRICULTURAL ACTIVITIES
7.1 Introduction
Agriculture is the mainstay of the economy of the Municipality as it provides raw materials
for industry, employment for people and food for subsistence. The data provided herein will
assist decision-makers and stakeholders in formulating the best agricultural development
policy option for the local economy of Ejisu-Juaben Municipality. The census data analyzed
in this chapter on agricultural activities include households who are engaged in agricultural
activities by locality (rural/urban), types of crops cultivated, tree planting, rearing of livestock
and breeding of fish.
7.2 Households in Agriculture
The total number of agricultural households in the Municipality, according to the 2010
Population and Housing Census is 15,549. Table 7.1 shows the distribution of households in
agriculture. Less than half (47.0%) of all the households in the Municipality is engaged in
agriculture. The percentage of households that are engaged in agriculture is higher in rural
areas (56.5%) than in urban areas (23.9%).
Crop farming is the commonest (96.8%) type of agricultural activity among the households
engaged in agriculture, followed by livestock rearing (19.5%) and tree planting (0.4%). Fish
farming is the least important (0.1%) agricultural activity undertaken by agricultural
households in the Municipality. For all the activities, the proportions of agricultural
households in rural areas are higher than in urban areas, except those engaged in fish farming
where the proportion in urban areas is slightly higher than the proportion in rural areas.
Table 7.1: Households by agricultural activities and locality
Type of agricultural activities
Total Urban Rural
Number Percent Number Percent Number Percent
Total Households 33,078 100.0
9,662 100.0
23,416 100.0
Households engages in Agriculture 15,549 47.0
2,312 23.9
13,237 56.5
Crop Farming 15,047 96.8
2,177 94.2
12,870 97.2
Tree Planting 62 0.4
5 0.2
57 0.4
Livestock Rearing 3,034 19.5
305 13.2
2,729 20.6
Fish Farming 17 0.1 4 0.2 13 0.1 Source: Ghana Statistical Service, 2010 Population and Housing Census
7.3 Type of Livestock and Other Animals reared
Table 7.2 shows that chicken (70.3%) is the most reared animal by households in the
Municipality. Other types of animals reared by households are sheep (10.2%) and goat
(8.3%). The average animal per keeper in the Municipality is 34.

44
Table 7.2: Distribution of livestock, other animals and keepers
Livestock/Other Animals
Animals Keepers Average
Animal
per Keeper Number Percent Number Percent
All livestock 149,521 100.0
4,348 100.0 34
Beehives 90 0.1
7 0.2 13
Cattle 1,647 1.1
70 1.6 24
Chicken 105,075 70.3
2,034 46.8 52
Dove 277 0.2
5 0.1 55
Duck 901 0.6
79 1.8 11
Goat 12,370 8.3
1,118 25.7 11
Grass-cutter 197 0.1
20 0.5 10
Guinea fowl 404 0.3
36 0.8 11
Ostrich 156 0.1
6 0.1 26
Pig 3,746 2.5
104 2.4 36
Rabbit 440 0.3
39 0.9 11
Sheep 15,291 10.2
750 17.2 20
Silk worm 158 0.1
17 0.4 9
Snail 1,784 1.2
5 0.1 357
Turkey 1,299 0.9
32 0.7 41
Other 160 0.1
18 0.4 9
Fish farming 5,526 3.7 8 0.2 691 Source: Ghana Statistical Service, 2010 Population and Housing Census

45
CHAPTER EIGHT
HOUSING CONDITIONS
8.1 Introduction
Concerns for human wellbeing conditions associated with housing led to the introduction of
questions on housing into the 2000 round of Population and Housing Census. The 2010
Population and Housing Census is thus the second time questions on housing were asked. A
number of housing characteristics and associated conditions such as overcrowding, supply of
basic services such as drinking water and sanitation facilities (toilet and bathroom) are
important areas that are required for monitoring progress in human development.
The major issues analyzed in this chapter include the housing stock, type of dwelling, holding
and tenancy arrangement, room occupancy, access to utilities and housing facilities, main
source of water for drinking and for other use, bathing and toilet facilities and methods of
waste disposal.
8.2 Housing Stock
The total stock of houses in the Ejisu-Juaben Municipality recorded in the 2010 Population
and Housing Census is 17,994 (Table 8.1.). The rural areas have a higher proportion of the
houses 13,767 (76.5%) than the urban areas 4,227 (23.5%). Again, the rural areas recorded a
higher proportion of households 23,416 (70.8%) than the urban areas 9,662 (29.2%).The
average number of households per house is 1.8 for the Municipality, with the urban areas
having a slightly higher value of 2.3 than the rural areas (1.7). Also the average household
size is 4.3 for the Municipality, with an urban average of 4.0 and a slightly higher rural
average of 4.4. Population per house recorded for the Municipality is 7.8, with a higher urban
rate of 9.2 and a lower rural proportion of 7.4.
Table 8.1: Stock of houses and households by type of locality
Categories
Total
country Region District Urban Rural
Total population 24,658,823 4,780,380 143,762 39,565 104,197
Total household population 24,076,327 4,671,982 141,177 38,785 102,392
Number of houses 3,392,745 574,066 17,994 4,227 13,767
Number of households 5,467,054 1,126,205 33,078 9,662 23,416
Average households per house 1.6 2.0 1.8 2.3 1.7
Population per house 7.1 8.1 7.8 9.2 7.4
Average household size 4.4 4.1 4.3 4.0 4.4 Source: Ghana Statistical Service, 2010 Population and Housing Census
8.3 Type of Dwelling, Holding and Tenancy Arrangements
Table 8.2 indicates that majority (56.7%) of households in the Municipality occupy
Compound houses and about one-quarter (25.9%) of households occupy Separate houses.
Semi-detached houses (6.7%) and Flats/apartment (6.1%) provide dwellings for more than a
tenth of households in the Municipality.
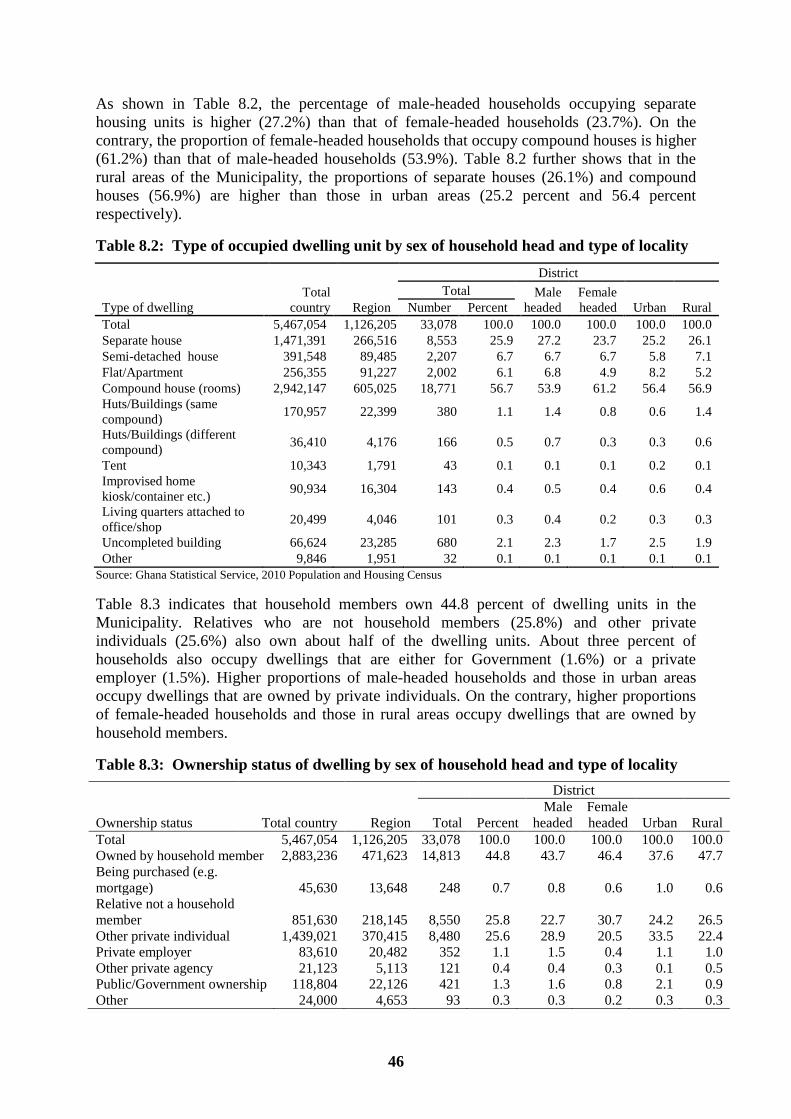
46
As shown in Table 8.2, the percentage of male-headed households occupying separate
housing units is higher (27.2%) than that of female-headed households (23.7%). On the
contrary, the proportion of female-headed households that occupy compound houses is higher
(61.2%) than that of male-headed households (53.9%). Table 8.2 further shows that in the
rural areas of the Municipality, the proportions of separate houses (26.1%) and compound
houses (56.9%) are higher than those in urban areas (25.2 percent and 56.4 percent
respectively).
Table 8.2: Type of occupied dwelling unit by sex of household head and type of locality
Type of dwelling
Total
country Region
District
Total Male
headed
Female
headed Urban Rural Number Percent
Total 5,467,054 1,126,205 33,078 100.0 100.0 100.0 100.0 100.0
Separate house 1,471,391 266,516 8,553 25.9 27.2 23.7 25.2 26.1
Semi-detached house 391,548 89,485 2,207 6.7 6.7 6.7 5.8 7.1
Flat/Apartment 256,355 91,227 2,002 6.1 6.8 4.9 8.2 5.2
Compound house (rooms) 2,942,147 605,025 18,771 56.7 53.9 61.2 56.4 56.9
Huts/Buildings (same
compound) 170,957 22,399 380 1.1 1.4 0.8 0.6 1.4
Huts/Buildings (different
compound) 36,410 4,176 166 0.5 0.7 0.3 0.3 0.6
Tent 10,343 1,791 43 0.1 0.1 0.1 0.2 0.1
Improvised home
kiosk/container etc.) 90,934 16,304 143 0.4 0.5 0.4 0.6 0.4
Living quarters attached to
office/shop 20,499 4,046 101 0.3 0.4 0.2 0.3 0.3
Uncompleted building 66,624 23,285 680 2.1 2.3 1.7 2.5 1.9
Other 9,846 1,951 32 0.1 0.1 0.1 0.1 0.1
Source: Ghana Statistical Service, 2010 Population and Housing Census
Table 8.3 indicates that household members own 44.8 percent of dwelling units in the
Municipality. Relatives who are not household members (25.8%) and other private
individuals (25.6%) also own about half of the dwelling units. About three percent of
households also occupy dwellings that are either for Government (1.6%) or a private
employer (1.5%). Higher proportions of male-headed households and those in urban areas
occupy dwellings that are owned by private individuals. On the contrary, higher proportions
of female-headed households and those in rural areas occupy dwellings that are owned by
household members.
Table 8.3: Ownership status of dwelling by sex of household head and type of locality
Ownership status Total country Region
District
Total Percent
Male
headed
Female
headed Urban Rural
Total 5,467,054 1,126,205 33,078 100.0 100.0 100.0 100.0 100.0
Owned by household member 2,883,236 471,623 14,813 44.8 43.7 46.4 37.6 47.7
Being purchased (e.g.
mortgage) 45,630 13,648 248 0.7 0.8 0.6 1.0 0.6
Relative not a household
member 851,630 218,145 8,550 25.8 22.7 30.7 24.2 26.5
Other private individual 1,439,021 370,415 8,480 25.6 28.9 20.5 33.5 22.4
Private employer 83,610 20,482 352 1.1 1.5 0.4 1.1 1.0
Other private agency 21,123 5,113 121 0.4 0.4 0.3 0.1 0.5 Public/Government ownership 118,804 22,126 421 1.3 1.6 0.8 2.1 0.9
Other 24,000 4,653 93 0.3 0.3 0.2 0.3 0.3

47
8.4 Construction Materials
The main material for outer wall of dwellings in the Municipality is cement and concrete
(77.1%). The percentage of dwellings with such walls is 88.5 percent in urban areas
compared with 72.4 percent in rural areas (Table 8.4). There is also the use mud brick/earth
(17.8%) for outer walls; however it is used by a higher percentage of households in the rural
areas (22.8%) than in urban areas (5.4%).
Table 8.4: Main construction material for outer wall of dwelling unit by type of locality
Material for Outer wall
Total
country Region
District
Total
Urban Rural Number Percent
Total 5,817,607 1,169,030 34,466 100.0
100.0 100.0
Mud brick/earth 1,991,540 250,238 6,136 17.8
5.4 22.8
Wood 200,594 27,438 366 1.1
1.4 0.9
Metal sheet/slate/asbestos 43,708 10,549 271 0.8
0.7 0.8
Stone 11,330 2,014 75 0.2
0.1 0.3
Burnt bricks 38,237 7,580 238 0.7
1.2 0.5
Cement blocks/concrete 3,342,462 840,519 26,557 77.1
88.5 72.4
Land Crete 104,270 19,878 682 2.0
2.2 1.9
Bamboo 8,206 1,381 47 0.1
0.1 0.2
Palm leaf/thatch (grass)/raffia 38,054 1,768 18 0.1
0.0 0.1
Other 39,206 7,665 76 0.2 0.4 0.1 Source: Ghana Statistical Service, 2010 Population and Housing Census
8.4.2 Constructional materials for floor of dwelling units
As shown in Table 8.5, the main material for the floor of dwelling units in the Municipality is
cement and concrete (81.5%). The percentage of dwellings with such floors is higher in urban
areas (83.9%) than in rural areas (80.5%). There is also the use of earth/mud for floors by
more than a tenth (12.9%) of households. Use of earth/mud for floors is however dominant in
rural areas (14.9%) than in urban areas (7.9%).
Table 8.5: Main construction material for the floor of dwelling unit by locality
Material for the floor
Total
Country Region
Type of locality
Total
Urban Rural Number Percent
Total 5,467,054 1,126,205 33,078 100.0 100.0 100.0
Earth/mud 872,161 164,333 4,256 12.9 7.9 14.9
Cement/concrete 4,255,611 875,714 26,948 81.5 83.9 80.5
Stone 32,817 8,731 387 1.2 0.6 1.4
Burnt brick 6,537 1,365 40 0.1 0.2 0.1
Wood 52,856 6,032 37 0.1 0.2 0.1
Vinyl tiles 57,032 15,120 364 1.1 2.0 0.7
Ceramic/porcelain/granite/marble tiles 88,500 19,826 556 1.7 2.7 1.3
Terrazzo/terrazzo tiles 85,973 32,460 437 1.3 2.4 0.9
Other 15,567 2,624 53 0.2 0.2 0.1 Source: Ghana Statistical Service, 2010 Population and Housing Census
Metal sheet (94.6%) is the main material used for roofing in the Municipality (Table 8.6).
The percentage of dwellings with such roofs exceeds 94 percent in both urban and rural areas.
The use of cement/concrete (1.3%) and thatch/palm leaf or raffia (1.3%) are the next common
material use for roofing in both urban and rural areas.
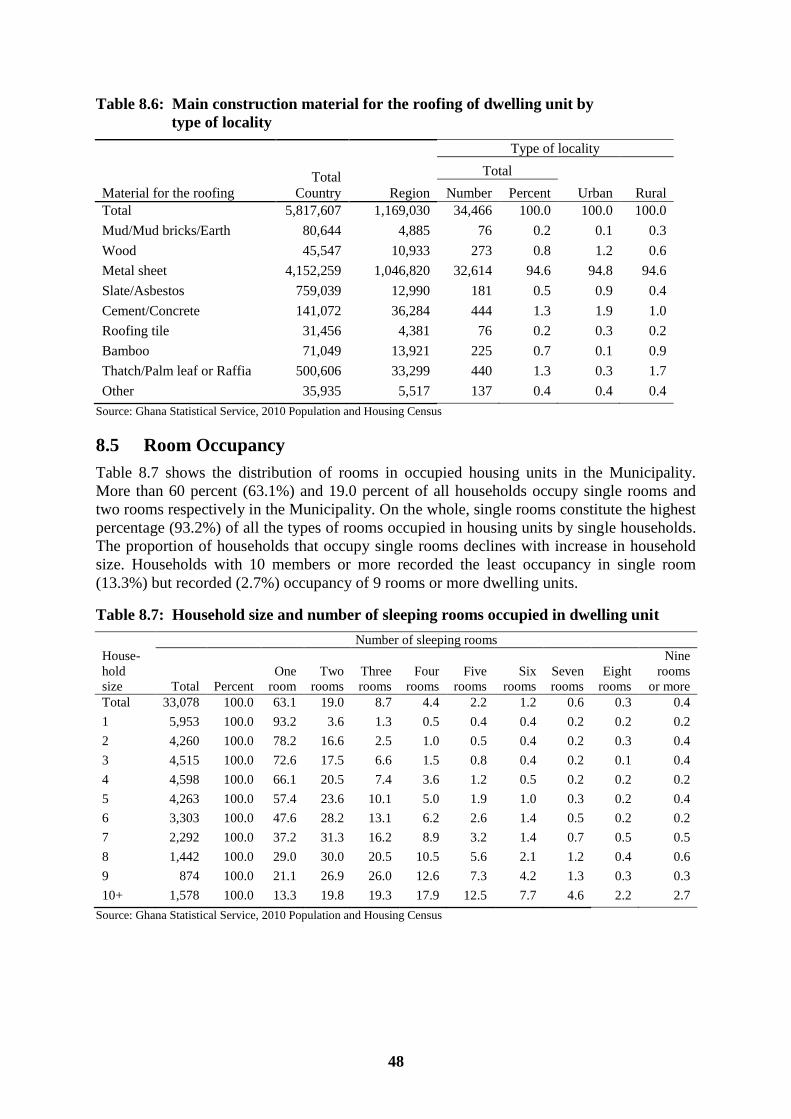
48
Table 8.6: Main construction material for the roofing of dwelling unit by
type of locality
Material for the roofing
Total
Country Region
Type of locality
Total
Urban Rural Number Percent
Total 5,817,607 1,169,030 34,466 100.0 100.0 100.0
Mud/Mud bricks/Earth 80,644 4,885 76 0.2 0.1 0.3
Wood 45,547 10,933 273 0.8 1.2 0.6
Metal sheet 4,152,259 1,046,820 32,614 94.6 94.8 94.6
Slate/Asbestos 759,039 12,990 181 0.5 0.9 0.4
Cement/Concrete 141,072 36,284 444 1.3 1.9 1.0
Roofing tile 31,456 4,381 76 0.2 0.3 0.2
Bamboo 71,049 13,921 225 0.7 0.1 0.9
Thatch/Palm leaf or Raffia 500,606 33,299 440 1.3 0.3 1.7
Other 35,935 5,517 137 0.4 0.4 0.4
Source: Ghana Statistical Service, 2010 Population and Housing Census
8.5 Room Occupancy
Table 8.7 shows the distribution of rooms in occupied housing units in the Municipality.
More than 60 percent (63.1%) and 19.0 percent of all households occupy single rooms and
two rooms respectively in the Municipality. On the whole, single rooms constitute the highest
percentage (93.2%) of all the types of rooms occupied in housing units by single households.
The proportion of households that occupy single rooms declines with increase in household
size. Households with 10 members or more recorded the least occupancy in single room
(13.3%) but recorded (2.7%) occupancy of 9 rooms or more dwelling units.
Table 8.7: Household size and number of sleeping rooms occupied in dwelling unit
Number of sleeping rooms
House-
hold
size Total
One
room
Two
rooms
Three
rooms
Four
rooms
Five
rooms
Six
rooms
Seven
rooms
Eight
rooms
Nine
rooms
or more Percent
Total 33,078 100.0 63.1 19.0 8.7 4.4 2.2 1.2 0.6 0.3 0.4
1 5,953 100.0 93.2 3.6 1.3 0.5 0.4 0.4 0.2 0.2 0.2
2 4,260 100.0 78.2 16.6 2.5 1.0 0.5 0.4 0.2 0.3 0.4
3 4,515 100.0 72.6 17.5 6.6 1.5 0.8 0.4 0.2 0.1 0.4
4 4,598 100.0 66.1 20.5 7.4 3.6 1.2 0.5 0.2 0.2 0.2
5 4,263 100.0 57.4 23.6 10.1 5.0 1.9 1.0 0.3 0.2 0.4
6 3,303 100.0 47.6 28.2 13.1 6.2 2.6 1.4 0.5 0.2 0.2
7 2,292 100.0 37.2 31.3 16.2 8.9 3.2 1.4 0.7 0.5 0.5
8 1,442 100.0 29.0 30.0 20.5 10.5 5.6 2.1 1.2 0.4 0.6
9 874 100.0 21.1 26.9 26.0 12.6 7.3 4.2 1.3 0.3 0.3
10+ 1,578 100.0 13.3 19.8 19.3 17.9 12.5 7.7 4.6 2.2 2.7
Source: Ghana Statistical Service, 2010 Population and Housing Census
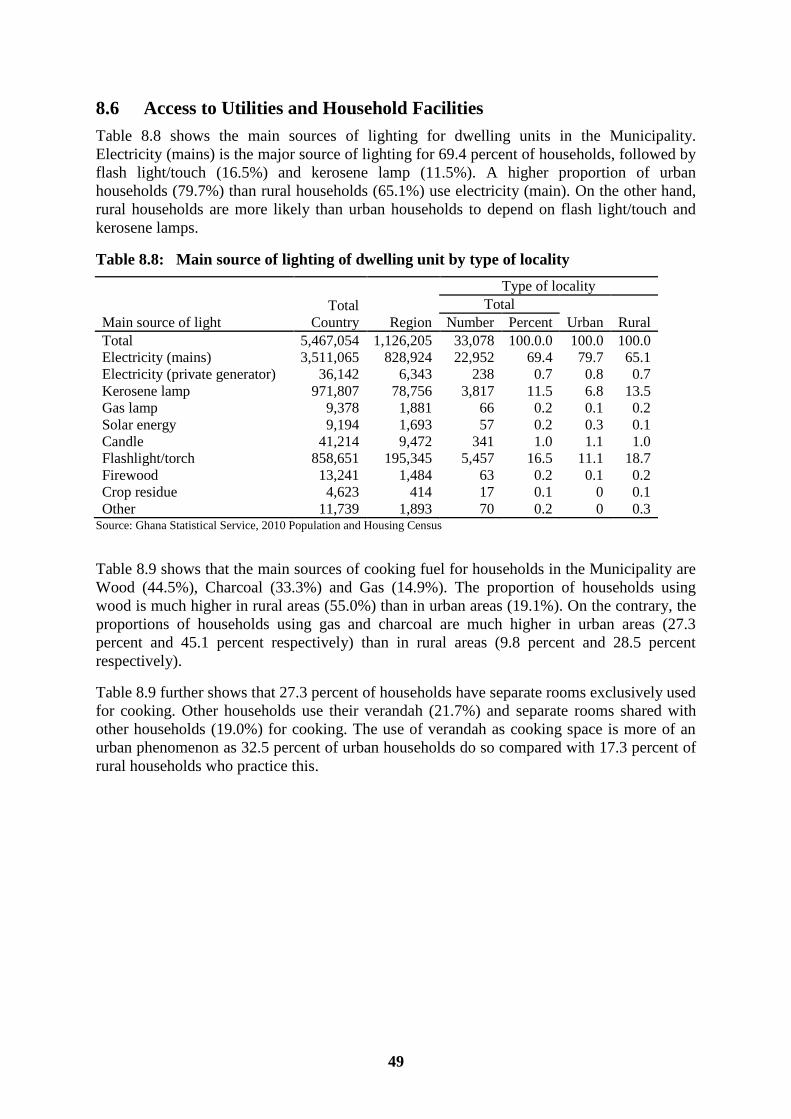
49
8.6 Access to Utilities and Household Facilities
Table 8.8 shows the main sources of lighting for dwelling units in the Municipality.
Electricity (mains) is the major source of lighting for 69.4 percent of households, followed by
flash light/touch (16.5%) and kerosene lamp (11.5%). A higher proportion of urban
households (79.7%) than rural households (65.1%) use electricity (main). On the other hand,
rural households are more likely than urban households to depend on flash light/touch and
kerosene lamps.
Table 8.8: Main source of lighting of dwelling unit by type of locality
Main source of light
Total
Country Region
Type of locality
Total
Number Percent Urban Rural
Total 5,467,054 1,126,205 33,078 100.0.0 100.0 100.0
Electricity (mains) 3,511,065 828,924 22,952 69.4 79.7 65.1
Electricity (private generator) 36,142 6,343 238 0.7 0.8 0.7
Kerosene lamp 971,807 78,756 3,817 11.5 6.8 13.5
Gas lamp 9,378 1,881 66 0.2 0.1 0.2
Solar energy 9,194 1,693 57 0.2 0.3 0.1
Candle 41,214 9,472 341 1.0 1.1 1.0
Flashlight/torch 858,651 195,345 5,457 16.5 11.1 18.7
Firewood 13,241 1,484 63 0.2 0.1 0.2
Crop residue 4,623 414 17 0.1 0 0.1
Other 11,739 1,893 70 0.2 0 0.3 Source: Ghana Statistical Service, 2010 Population and Housing Census
Table 8.9 shows that the main sources of cooking fuel for households in the Municipality are
Wood (44.5%), Charcoal (33.3%) and Gas (14.9%). The proportion of households using
wood is much higher in rural areas (55.0%) than in urban areas (19.1%). On the contrary, the
proportions of households using gas and charcoal are much higher in urban areas (27.3
percent and 45.1 percent respectively) than in rural areas (9.8 percent and 28.5 percent
respectively).
Table 8.9 further shows that 27.3 percent of households have separate rooms exclusively used
for cooking. Other households use their verandah (21.7%) and separate rooms shared with
other households (19.0%) for cooking. The use of verandah as cooking space is more of an
urban phenomenon as 32.5 percent of urban households do so compared with 17.3 percent of
rural households who practice this.

50
Table 8.9: Main source of cooking fuel and cooking space used by households
Source of cooking
fuel/cooking space
Total
country Region
District
Total
Urban Rural Number Percent
Source of cooking fuel
Total 5,467,054 1,126,205 33,078 100.0 100.0 100.0
None no cooking 306,118 91,717 1,987 6.0 6.9 5.6
Wood 2,197,083 335,439 14,724 44.5 19.1 55.0
Gas 996,518 237,251 4,928 14.9 27.3 9.8
Electricity 29,794 7,952 121 0.4 0.4 0.4
Kerosene 29,868 4,263 102 0.3 0.4 0.3
Charcoal 1,844,290 443,144 11,024 33.3 45.1 28.5
Crop residue 45,292 2,573 104 0.3 0.3 0.3
Saw dust 8,000 1,545 37 0.1 0.2 0.1
Animal waste 2,332 427 8 0.0 0.0 0.0
Other 7,759 1,894 43 0.1 0.3 0.1
Cooking space used by household
Total 5,467,054 1,126,205 33,078 100.0 100.0 100.0
No cooking space 386,883 105,491 2,390 7.2 8.0 6.9
Separate room for exclusive
use of household 1,817,018 319,235 9,025 27.3 26.0 27.8
Separate room shared with
other household(s) 410,765 165,781 6,288 19.0 16.2 20.2
Enclosure without roof 117,614 14,147 700 2.1 0.9 2.6
Structure with roof but
without walls 349,832 52,530 2,496 7.5 3.3 9.3
Bedroom/Hall/Living room) 74,525 4,918 139 0.4 0.5 0.4
Verandah 1,173,946 304,294 7,178 21.7 32.5 17.3
Open space in compound 1,115,464 155,848 4,732 14.3 12.4 15.1
Other 21,007 3,961 130 0.4 0.2 0.5
Source: Ghana Statistical Service, 2010 Population and Housing Census
8.7 Main Source of Water for Drinking and for other Domestic Use
Table 8.10 shows that bore-hole is the main source of drinking water for 60.9 percent of the
households in the Municipality, followed by pipe-borne water (24.2%). Sachet water is also
used by 2.3 percent of households in the Municipality. A higher proportion of urban
households (30.1%) than rural households (54.5%) use bore-hole water for drinking in the
Municipality.
Similarly, Table 8.10 indicates that bore-hole water (61.8%) and pipe borne water (24.0%)
are the most used for other domestic activities in the Municipality irrespective of locality.
Relatively higher proportions of households also depend on protected well water (8.3%) and
river/stream water (3.3%) for other domestic purposes. Protected wells are mostly used by
urban households (11.0%) than rural households (7.3%) while rivers/streams are mostly used
by rural households (4.4%) than urban households (0.8%).
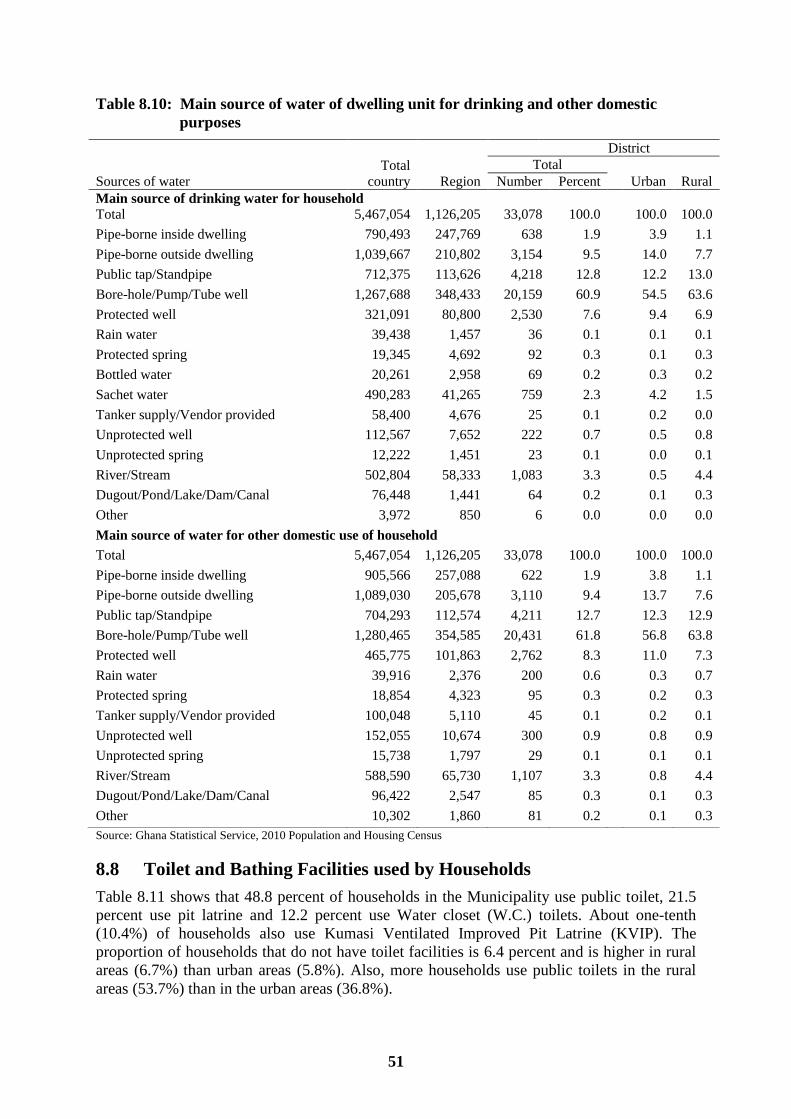
51
Table 8.10: Main source of water of dwelling unit for drinking and other domestic
purposes
Source: Ghana Statistical Service, 2010 Population and Housing Census
8.8 Toilet and Bathing Facilities used by Households
Table 8.11 shows that 48.8 percent of households in the Municipality use public toilet, 21.5
percent use pit latrine and 12.2 percent use Water closet (W.C.) toilets. About one-tenth
(10.4%) of households also use Kumasi Ventilated Improved Pit Latrine (KVIP). The
proportion of households that do not have toilet facilities is 6.4 percent and is higher in rural
areas (6.7%) than urban areas (5.8%). Also, more households use public toilets in the rural
areas (53.7%) than in the urban areas (36.8%).
Sources of water
Total
country Region
District
Total
Urban Rural Number Percent
Main source of drinking water for household
Total 5,467,054 1,126,205 33,078 100.0 100.0 100.0
Pipe-borne inside dwelling 790,493 247,769 638 1.9 3.9 1.1
Pipe-borne outside dwelling 1,039,667 210,802 3,154 9.5 14.0 7.7
Public tap/Standpipe 712,375 113,626 4,218 12.8 12.2 13.0
Bore-hole/Pump/Tube well 1,267,688 348,433 20,159 60.9 54.5 63.6
Protected well 321,091 80,800 2,530 7.6 9.4 6.9
Rain water 39,438 1,457 36 0.1 0.1 0.1
Protected spring 19,345 4,692 92 0.3 0.1 0.3
Bottled water 20,261 2,958 69 0.2 0.3 0.2
Sachet water 490,283 41,265 759 2.3 4.2 1.5
Tanker supply/Vendor provided 58,400 4,676 25 0.1 0.2 0.0
Unprotected well 112,567 7,652 222 0.7 0.5 0.8
Unprotected spring 12,222 1,451 23 0.1 0.0 0.1
River/Stream 502,804 58,333 1,083 3.3 0.5 4.4
Dugout/Pond/Lake/Dam/Canal 76,448 1,441 64 0.2 0.1 0.3
Other 3,972 850 6 0.0 0.0 0.0
Main source of water for other domestic use of household
Total 5,467,054 1,126,205 33,078 100.0 100.0 100.0
Pipe-borne inside dwelling 905,566 257,088 622 1.9 3.8 1.1
Pipe-borne outside dwelling 1,089,030 205,678 3,110 9.4 13.7 7.6
Public tap/Standpipe 704,293 112,574 4,211 12.7 12.3 12.9
Bore-hole/Pump/Tube well 1,280,465 354,585 20,431 61.8 56.8 63.8
Protected well 465,775 101,863 2,762 8.3 11.0 7.3
Rain water 39,916 2,376 200 0.6 0.3 0.7
Protected spring 18,854 4,323 95 0.3 0.2 0.3
Tanker supply/Vendor provided 100,048 5,110 45 0.1 0.2 0.1
Unprotected well 152,055 10,674 300 0.9 0.8 0.9
Unprotected spring 15,738 1,797 29 0.1 0.1 0.1
River/Stream 588,590 65,730 1,107 3.3 0.8 4.4
Dugout/Pond/Lake/Dam/Canal 96,422 2,547 85 0.3 0.1 0.3
Other 10,302 1,860 81 0.2 0.1 0.3
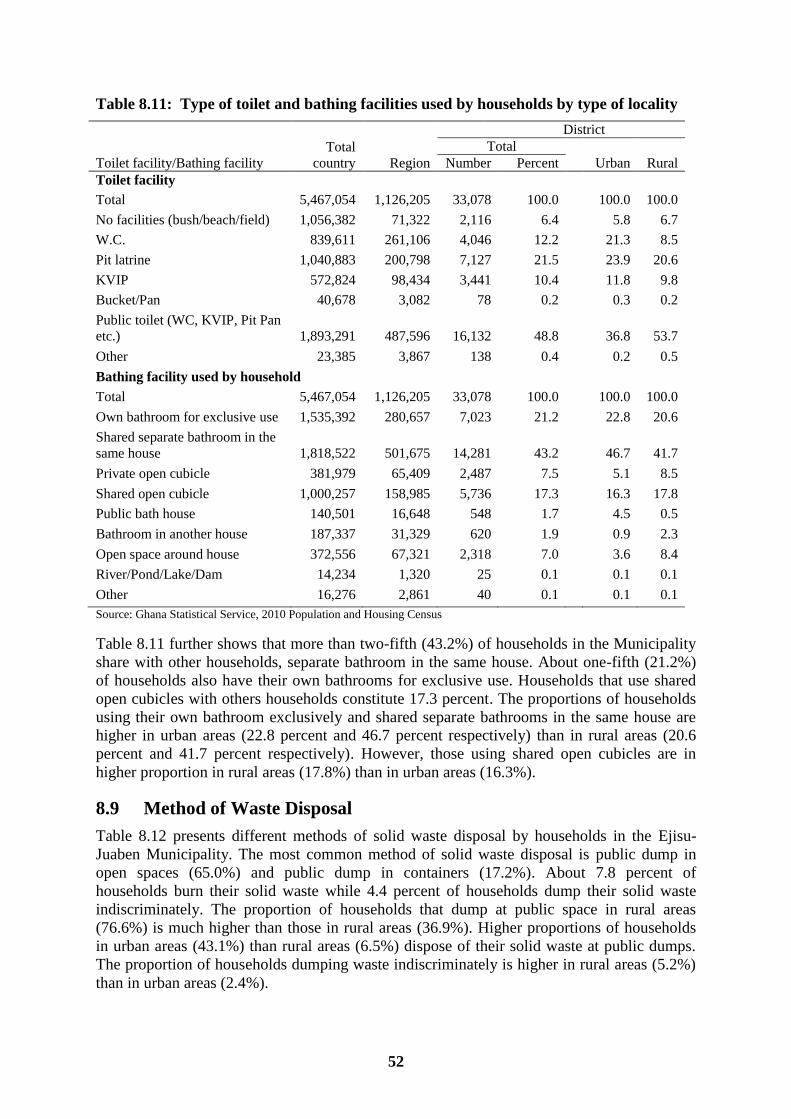
52
Table 8.11: Type of toilet and bathing facilities used by households by type of locality
Toilet facility/Bathing facility
Total
country
Region
District
Total
Urban Rural Number Percent
Toilet facility
Total 5,467,054 1,126,205 33,078 100.0 100.0 100.0
No facilities (bush/beach/field) 1,056,382 71,322 2,116 6.4 5.8 6.7
W.C. 839,611 261,106 4,046 12.2 21.3 8.5
Pit latrine 1,040,883 200,798 7,127 21.5 23.9 20.6
KVIP 572,824 98,434 3,441 10.4 11.8 9.8
Bucket/Pan 40,678 3,082 78 0.2 0.3 0.2
Public toilet (WC, KVIP, Pit Pan
etc.) 1,893,291 487,596 16,132 48.8 36.8 53.7
Other 23,385 3,867 138 0.4 0.2 0.5
Bathing facility used by household
Total 5,467,054 1,126,205 33,078 100.0 100.0 100.0
Own bathroom for exclusive use 1,535,392 280,657 7,023 21.2 22.8 20.6
Shared separate bathroom in the
same house 1,818,522 501,675 14,281 43.2 46.7 41.7
Private open cubicle 381,979 65,409 2,487 7.5 5.1 8.5
Shared open cubicle 1,000,257 158,985 5,736 17.3 16.3 17.8
Public bath house 140,501 16,648 548 1.7 4.5 0.5
Bathroom in another house 187,337 31,329 620 1.9 0.9 2.3
Open space around house 372,556 67,321 2,318 7.0 3.6 8.4
River/Pond/Lake/Dam 14,234 1,320 25 0.1 0.1 0.1
Other 16,276 2,861 40 0.1 0.1 0.1
Source: Ghana Statistical Service, 2010 Population and Housing Census
Table 8.11 further shows that more than two-fifth (43.2%) of households in the Municipality
share with other households, separate bathroom in the same house. About one-fifth (21.2%)
of households also have their own bathrooms for exclusive use. Households that use shared
open cubicles with others households constitute 17.3 percent. The proportions of households
using their own bathroom exclusively and shared separate bathrooms in the same house are
higher in urban areas (22.8 percent and 46.7 percent respectively) than in rural areas (20.6
percent and 41.7 percent respectively). However, those using shared open cubicles are in
higher proportion in rural areas (17.8%) than in urban areas (16.3%).
8.9 Method of Waste Disposal
Table 8.12 presents different methods of solid waste disposal by households in the Ejisu-
Juaben Municipality. The most common method of solid waste disposal is public dump in
open spaces (65.0%) and public dump in containers (17.2%). About 7.8 percent of
households burn their solid waste while 4.4 percent of households dump their solid waste
indiscriminately. The proportion of households that dump at public space in rural areas
(76.6%) is much higher than those in rural areas (36.9%). Higher proportions of households
in urban areas (43.1%) than rural areas (6.5%) dispose of their solid waste at public dumps.
The proportion of households dumping waste indiscriminately is higher in rural areas (5.2%)
than in urban areas (2.4%).
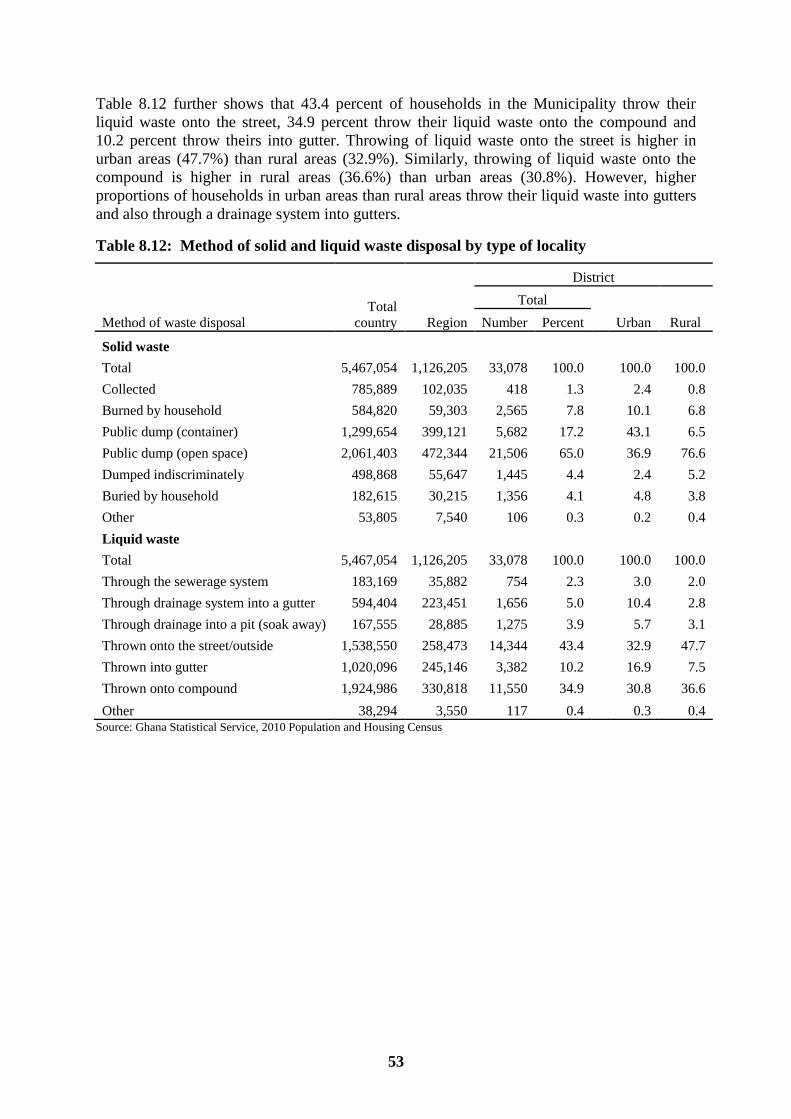
53
Table 8.12 further shows that 43.4 percent of households in the Municipality throw their
liquid waste onto the street, 34.9 percent throw their liquid waste onto the compound and
10.2 percent throw theirs into gutter. Throwing of liquid waste onto the street is higher in
urban areas (47.7%) than rural areas (32.9%). Similarly, throwing of liquid waste onto the
compound is higher in rural areas (36.6%) than urban areas (30.8%). However, higher
proportions of households in urban areas than rural areas throw their liquid waste into gutters
and also through a drainage system into gutters.
Table 8.12: Method of solid and liquid waste disposal by type of locality
Method of waste disposal
Total
country Region
District
Total
Urban Rural Number Percent
Solid waste
Total 5,467,054 1,126,205 33,078 100.0
100.0 100.0
Collected 785,889 102,035 418 1.3
2.4 0.8
Burned by household 584,820 59,303 2,565 7.8
10.1 6.8
Public dump (container) 1,299,654 399,121 5,682 17.2
43.1 6.5
Public dump (open space) 2,061,403 472,344 21,506 65.0
36.9 76.6
Dumped indiscriminately 498,868 55,647 1,445 4.4
2.4 5.2
Buried by household 182,615 30,215 1,356 4.1
4.8 3.8
Other 53,805 7,540 106 0.3
0.2 0.4
Liquid waste
Total 5,467,054 1,126,205 33,078 100.0
100.0 100.0
Through the sewerage system 183,169 35,882 754 2.3
3.0 2.0
Through drainage system into a gutter 594,404 223,451 1,656 5.0
10.4 2.8
Through drainage into a pit (soak away) 167,555 28,885 1,275 3.9
5.7 3.1
Thrown onto the street/outside 1,538,550 258,473 14,344 43.4
32.9 47.7
Thrown into gutter 1,020,096 245,146 3,382 10.2
16.9 7.5
Thrown onto compound 1,924,986 330,818 11,550 34.9
30.8 36.6
Other 38,294 3,550 117 0.4 0.3 0.4 Source: Ghana Statistical Service, 2010 Population and Housing Census
54
CHAPTER NINE
SUMMARY OF FINDINGS, CONCLUSIONS AND
POLICY IMPLICATIONS
9.1 Introduction
This section presents the summary of key findings emanating from the analyses of data of the
Ejisu-Juaben Municipality. The findings are outlined with respect to the demographic and
socio-economic characteristics, economic characteristics, Information and Communication
Technology (ICT), Disability, Agricultural activities and housing conditions. It also draws
conclusion and advises on implications for policy direction in improving the living conditions
of the inhabitants in the Municipality.
9.2 Summary of Findings and Conclusion
Demographic characteristics
The population of the Municipality stood at 143,762 in 2010. The population pyramid of the
Municipality for 2010 portray a scenario in developing countries, with broad base denoting a
youthful population (39.8%), and a narrow apex, indicating fewer aged persons aged 65 years
and older (5.1%). The Age Dependency Ratio and sex ratio of Ejisu-Juaben Municipality are
81.40 and 91.4 respectively. The Municipality has the major proportion of its population in
the rural (72.5%) than urban (27.5%) communities.
The Total Fertility Rate (TFR), General Fertility Rate (GFR), and Crude Birth Rate (CBR) of
the Municipality at 2010 were 3.5, 103.1 and 26.5 respectively. These are higher than TFR
(3.3), GFR (96.4) and CBR (26.0) in the Ashanti Region. In terms of mortality, crude death
rate was 6.2 deaths per 1,000 population of the Municipality in the year preceding the census.
The proportion of deaths attributable to accident or violence or homicide or suicide (13.5%)
was about six-time the proportion of death that can be attributed to other causes. Under-five
mortality was the highest in terms of age, with males, followed by age 70 years and above.
Social characteristics
The Municipality has a predominantly nuclear family households which constitute more than
one-fifth (28.0%) of the total households. The extended family households accounted for 17.8
percent of the total households. The average household size for the Municipality is 4.3. The
proportion of houses owned by household members was more than one-third (44.8%)
according to the 2010 Population and Housing Census. Although in Ghana the legal age at
marriage is 16 years, among those aged 12-14 years, 4.5 percent were married and further 1.3
percent were in consensual union. The 2010 Population and Housing Census reveal that 84.1
percent of the population professes the Christians faith (Catholic, Protestants,
Pentecostal/Charismatic and Other Christians)
An overwhelming proportion (84.7%) of the population 11 years and older are literate in one
language or another. Of the literate population, 73.1 percent are literate in English and a
Ghanaian language. The percentage of those who are literate in Ghanaian language only
(14.7%) is higher than that for English only (11.1%). Only 1.1 percent of the population is
literate in French in the Municipality.
55
More than 10 percent (12.9%) of the population in the Municipality have never attended
school. About 44 percent of the population have attended school in the past, while 42.9
percent are attending school now. More females (17.4%) than males (7.9%) have never
attended school. On the other hand, higher proportions of males (92.1%) than females
(82.6%) have ever attended school.
A greater proportion (46.9%) of those currently attending is in Primary level of education,
18.2 percent are at Junior High School and 16.5 percent are in Kindergarten. Thus, 81.6
percent of the population currently attending school are at Basic level of education. Only 2.7
percent of the school-going age population are at the tertiary level of schooling. Of those who
had attended in the past, 78.2 percent had had basic school education and 21.8 percent had
had secondary school or higher education.
In terms of sex, slightly more males (82.4%) than females (80.9%) are currently attending
basic school at the basic level. On the other hand, more females (13.3%) than males (12.5%)
of the population is attending secondary school or higher education level. Also, higher
proportion of females (82.8%) than males (73.3%) of the population had had basic school
education. On the contrary, a higher proportion of males (26.7%) than females (17.2%) had
had secondary school education.
Economic characteristics
The economically active population of the Municipality constitute a little less than three-
fourth (70.3%) of the population 15 years and older. Of the economically active population,
93.4 percent are employed whiles 6.6 percent are unemployed. Of those who were
unemployed, nearly two thirds (66.0%) were seeking work for the first time. The
economically not active population constituted 29.7 percent. More than half (52.8%) who
were economically not active were in full time education. The 2010 Population and Housing
Census of Ejisu-Juaben Municipality also show that, the employed male population age 15
years and older dominate all the occupations with the exception of skilled agriculture, fishery,
craft and related trades.
In terms of economic activities, more than one-third (36.7%) of the workforce were engaged
in agriculture, forestry and fishing. The results showed that agriculture, forestry and fishing
employed 37.3 percent of males and 36.1 percent of females. Wholesale and retail; repair of
motor vehicles and motorcycles was the second largest industry accounting for one-fifth
(20%) which comprised of more females (27.4%) than males (11.7%).
The results show that the private informal sector was the largest employer constituting 86.9
percent in the Ejisu-Juaben Municipality. This could account for the relatively low levels of
educational professional training among the employed population since these sectors do not
require high level of formal education.
Information communication technology
Currently, mobile phones are fast replacing the fixed telephone. Cellular phone is the most
widely used telecommunication tool in the Municipality as more than half (52.2%) of the
population aged 12 years and older own mobile phones in the Municipality. More males
(58.3%) than females (47.0%) 12 years and older owned mobile phones.
Generally, the proportion of the population using internet facility is quite low as only 5.5
percent of population 12 years and older used internet. Higher proportion of males (7.9%)
than females (3.5%) used the internet.

56
Disability
The number of persons with disability constitutes 2.7 percent of the total population. Slightly
more males (2.9%) than females (2.5%) have one form of disability or another. Sight (40.5%)
and Physical (29.4%) challenge are the most common types of disability in the Municipality,
constituting 69.9 percent. Sight and physical disability is common among the male and
female population irrespective of sex and locality of residence.
Agricultural activities
Less than half (47.0%) of all the households in the Municipality is engaged in agriculture.
The percentage of households that are engaged in agriculture is higher in rural areas (56.5%)
than in urban areas (23.9%).
Crop farming (96.8%) and livestock rearing (19.5%) are the commonest type of agricultural
activity among the households engaged in agriculture. For all the activities, the proportions of
agricultural households in rural areas are higher than in urban areas, except those engaged in
fish farming where the reverse is the case.
Chicken (70.3%) is the most reared animal by households in the Municipality. Other types of
animals reared by households are sheep (10.2%) and goat (8.3%).
Housing conditions
The total stock of houses in the Municipality is 17,994. The rural areas have a higher
proportion of the houses 13,767 (76.5%) than the urban areas 4,227 (23.5%). The average
number of households per house is 1.8 for the Municipality, with the urban areas having a
slightly higher value of 2.3 than the rural areas (1.7). Also the average household size is 4.3
and the ppopulation per house recorded for the Municipality is 7.8.
Majority (56.7%) of households in the Municipality occupy compound houses and about one-
quarter (25.9%) of households occupy Separate houses. Semi-detached houses (6.7%) and
flats/apartment (6.1%) provide dwellings for more than a tenth of households in the
Municipality.
A greater proportion (44.8%) of dwelling units is owned by household members in the
Municipality. Relatives who are not household members (25.8%) and other private
individuals (25.6%) also own about half of the dwelling units.
The main material for outer wall of dwellings in the Municipality is cement and concrete
(77.1%). The percentage of dwellings with such walls is 88.5 percent in urban areas
compared with 72.4 percent in rural areas. Also, the main material for the floor of dwelling
units is cement and concrete (81.5%). The percentage of dwellings with such floors is higher
in urban areas (83.9%) than in rural areas (80.5%).
Metal sheet (94.6%) is the main material used for roofing in the Municipality. The percentage
of dwellings with such roofs exceeds 94 percent in both urban and rural areas.
The main sources of lighting for dwelling units in the Municipality are Electricity (69.4%),
flash light/touch (16.5%) and kerosene lamp (11.5%). A higher proportion of urban
households (79.7%) than rural households (65.1%) use electricity (main). On the other hand,
rural households are more likely than urban households to depend on flash light/touch and
kerosene lamps.
57
Wood (44.5%), Charcoal (33.3%) and Gas (14.9%) are the main sources of cooking fuel for
households. The proportion of households using wood is much higher in rural areas (55.0%)
than in urban areas (19.1%). On the contrary, the proportions of households using gas and
charcoal are much higher in urban areas (27.3 percent and 45.1 percent respectively) than in
rural areas (9.8 percent and 28.5 percent respectively).
Bore-hole is the main source of drinking water for 60.9 percent of the households in the
Municipality, followed by pipe-borne water (24.2%). Sachet water is also used by 2.3 percent
of households in the Municipality.
About half (48.8%) of households in the Municipality use public toilet, 21.5 percent use pit
latrine and 12.2 percent use Water closet (W.C.) toilets. About one-tenth (10.4%) of
households also use Kumasi Ventilated Improved Pit Latrine (KVIP). The proportion of
households that do not have toilet facilities is 6.4 percent and is higher in rural areas (6.7%)
than urban areas (5.8%).
The major developmental issue in the Municipality in recent times is improved sanitation.
The most common method of solid waste disposal is public dump in open spaces (65.0%) and
public dump in containers (17.2%). About 7.8 percent of households burn their solid waste
while 4.4 percent of households dump their solid waste indiscriminately. More than two-fifth
(43.4%) of households in the Municipality throw their liquid waste onto the street, 34.9
percent throw their liquid waste onto the compound and 10.2 percent throw theirs into gutter.
Throwing of liquid waste onto the street is higher in urban areas (47.7%) than rural areas
(32.9%).
9.3 Policy Implications and Recommendations
Introduction
Many policy issues have a population dimension, usually about the number of people, their
age/sex or background etc. Demography is critical when developing policy for the future. A
clearly defined policy on population is the basis for a meaningful intervention in the
formulation of population-related programmes and projects. The interface between
population and other crosscutting issues, namely employment, housing, education, gender,
agriculture, is highlighted, and this is relevant in mainstreaming population factors into
sectorial policies and issues that are closely linked to poverty reduction.
The analyses of the 2010 Population and Housing Census have revealed important and key
demographic and socio-economic data about the population of the Municipality for policy
implications. This analytical framework seeks to closely reflect on the demographic features,
most notably growth rate, fertility, and mortality for population policy development and
programming in the Ejisu-Juaben Municipality. The policy implications and
recommendations are discussed below.
The population increase in the Municipality could be attributed to the three factors with more
emphasis on migration (in-migrants) and fertility rate. This is because the Municipality is a
per-urban stocked with social amenities. The availability of Senior High Schools,
universities, in-land port, vocational/technical schools and other institutions have become a
pull factor, which attracts people to the place. Notwithstanding this, the fertility rate among
women is higher compared to the regional record. The increasing population of the
Municipality can be a potential and at the same time a threat to socio-economic development.
The youthful population in the Municipality is a potential which can be harnessed for
development. However, it also informs decisions on what government agencies (Assembly)
58
could do to provide the pace to accommodate the population increase. This is so because,
when population continues to increase, it puts pressure on the existing social amenities. The
demand for education, health, sanitation among others begins to increase. It can also intensify
problems such as chronic underemployment and unemployment, especially in rural and urban
informal sectors of economic activity.
The population pyramid of the Municipality for 2010 portray a youthful population, and a
fewer aged persons. This puts the Age Dependency Ratio at 86.2 which means that, for every
100 people in the working age population, about 86.2 people depend on them which is higher
compared to the regional figure. This implies that, there will be more pressure on the working
age group for food, shelter, and clothing among others to cater for the dependent population.
The majority of the population in the rural areas implies that, the demand for social amenities
would increase. It may also have impact on the environment for increase in demand for fuel
wood (which is currently 83.5% in the rural areas in the Municipality) and agricultural land,
which, in turn, can result in an increased rate of deforestation. It also implies that majority of
the populace have been neglected in term of development, since development tends to
concentrate in urban localities than in rural localities in the Municipality.
The number of marriage among those aged 12-14 years and consensual union imply that there
is the likelihood of accelerating the growth rate in future. At any rate this trend is contrary to
the Constitution of Ghana and calls for immediate attention.
In taking a retrospective view of the above situation, the following can be recommended;
The Assembly could initiate steps to mitigate the negative impact of population
increase (more especially in the rural areas) now and for the next seven years.
The Assembly should provide more social amenities at the rural areas since it has a
greater proportion of the population.
There should be deliberate efforts by the Assembly in collaboration with the Ghana
Health Service and other NGOs to step up family planning activities especially to
reduce the Total Fertility Rate
Measures should be put in place to restrain early marriages in the Municipality.
Under-five mortality is the highest in terms of the age structure meaning that more children
below five years are dying compared to other age group. Under-5 mortality is one of the
Millennium Development Goal indicators (MDG 4) which is also, a leading indicator of child
health and overall development. The possible causes of under-five mortality in developing
countries according to the World Health Organization (2003) are acute respiratory infections,
notably pneumonia, and diarrhea diseases. The increase in under-five mortality in the
Municipality is a threat to achieving the MDGs at the local and national level. If the rate at
which children under five years continues to increase, all other things being equal, it will
reduce the youthful population and negatively impacting population.
Based on this, it is recommended that;
The Assembly in collaboration with the Ghana Health Service (GHS) and the Non-
governmental Organisations (NGOs) such as the X-Changes Delta and international
Organizations such as the United Nation Population Fund (UNFPA) should come up
with pragmatic programmes/measures of reducing the under-five mortality rate in the
Municipality.

59
The high literacy level among the populace is a good indicator of socio-economic
development. In order to maintain or increase the level of literacy in the Municipality, the
following are recommended;
The Assembly and the Ghana Education Service (GES) should put measures in place
to educate the populace (especially, the parents) on the importance of education.
Measures should be put in place to reduce school drop-out rate in the Municipality.
Economically, the Municipality has majority of its population employed in the various
sectors with agriculture, forestry and fishing having the largest share followed by wholesale,
retail, repair of motor vehicles and motorcycles. This suggests that the local economy is
mostly raw material produce based. The results show that the private informal sector is the
largest employer constituting 86.9 percent in the Ejisu-Juaben Municipality. This could
account for the relatively low levels of educational professional training among the employed
population since these sectors do not require high level of formal education. The higher
proportion of employed population implies more people will have something to live on and to
cater for the dependent population which invariably, reduces hardship and social vices which
does not augur well for development.
It is therefore recommended that;
More of programmes and projects of the Assembly and the National Board for Small
Scale Industries (NBSSI) as well as the Ministry of Food and Agriculture (MoFA)
implemented should be geared towards further development of agriculture, forestry
and fishing as well as the private informal sector.
The use of information and communication technology is increasing in the Municipality. The
number of people (12 years and older) using mobile phone is closer to the regional record and
this has facilitated easy communication and business. The Municipality’s share of internet
facilities usage in the region implies that, a significant number of the population is making
use of internet. The use of internet boosts business transactions more especially with financial
institutions. The more people become aware of the use of internet; the good it is for the banks
to adapt to the dynamism of society.
It is therefore recommended that;
The Assembly in collaboration with financial institutions and other communication
networks should further encourage and promote the use of information technologies.
The introduction of ICT center in the Municipality is a good attempt by the Assembly
of promoting information technology in the Municipality and it should be continued.
The Assembly together with the Ghana Education Service should ensure effective
monitoring of laptops distributed to schools by the Government of Ghana in the
Municipality.
The GES, should also effectively intensify the importance of ICT by engaging
teachers to teach it as subject in the various schools.
Disability is becoming a cross-cutting issue in development practice at the district level. The
analyses reveal two percent persons with some form of disability in the Ejisu-Juaben
Municipality. In terms of literacy level of disabled persons, 36.9 percent has never attended

60
school. This implies that the educational level of disabled persons is not encouraging since
more than one third has no educational background. Also, in terms of economic activity, 46.6
percent of persons with disability are economically active whiles 53.4 percent are
economically not active. Of those in the economically active population, 95.5 percent are
employed while only 4.5 percent are unemployed. This implies that majority of disabled
persons in the Municipality have means of living.
The following are recommended;
In recognizing the importance of persons with disability in the Municipality, efforts should be
geared toward integrating people with disability into the economic, housing, and other
infrastructure planning at all levels of the Municipality including ramps, walk ways,
pedestrian bridges, etc.
Measures should be in place to improve the educational achievements of disabled persons in
the Municipality.
Also, more jobs should be created for those who are unemployed.
Majority of the households in the Municipality use cement as their main construction
materials. The use of burnt bricks by households and even government agencies is very low.
This implies that, locally manufactured building materials are not largely used by households
in the Municipality. The Municipality is increasingly attracting people to the Central
Business District (CBDs) of Kumasi Metropolis and this pose housing problems. Though
rural areas have higher proportion of houses than urban areas, the population is rapidly
increasing coupled with acute shortage of houses in urban areas.
Based on this, the following is recommended;
The Assembly and other government agencies should promote the use of locally
manufactured building materials such as burnt bricks.
With regards to water and sanitation issues, the main source of drinking water comes from
borehole. This implies that the use of other source of drinking water namely; standpipes,
wells, sachet water, bottled water among others are low. On the other hand, source of water
from water bodies forms 4.7 percent in the rural areas. With the activities of illegal mining
(“galamsey”), water bodies are not safe for drinking anymore.
The highest reported toilet facilities used is public toilet. This implies that the populace relies
on the state’s social safety-net with little private sector provision of services. Also,
households with no toilet facility/open defecation are a threat to human health. Again, only a
small number of households throw liquid waste into gutters. The question is whether there is
lack of adequate drains in the Municipality or people are not educated to do so. Majority of
the populace throw liquid waste into the streets and compound which poses threat to human
health.
It is therefore recommended that the environmental department should be stocked with
resources to conduct frequent education on sanitation to the people in the Municipality.
It is hoped that with good policies in place such as construction and rehabilitation of toilet
facilities, the use of bush as toilet facility in the Municipality would be reduced massively in
the next five years.
61
Since majority of households depend on boreholes provided by the Assembly, effort should
be made to allocate funds from the District Assemblies Common Fund (DACF), the District
Development Facility (DDF), and the Urban Development Grants (UDG) to rehabilitate
existing boreholes, drill and install pumps on existing boreholes. This would increase water
coverage in the Municipality.
The Assembly could also organize clean-up exercises quarterly to ensure a clean and tidy
environment.
The Assembly should construct drains for easy disposing of liquid waste.
House-to-house collection of solid waste should be improved to reduce indiscriminate
dumping of solid waste.
The Municipality Assembly should strengthen the capacity of the sanitation agencies to
inculcate in people the proper and modern way of disposing solid waste in the Municipality.
The bye-laws on sanitation should be strictly implemented to ensure a clean environment in
the Municipality.
The use of wood as fuel for cooking in the Municipality is increasing. This has the tendency
of increasing deforestation which negatively affects the natural environment. The use of
flashlights as source of light could be due to the introduction of rechargeable varieties and
long-lasting batteries. The data further reveal that only one percent use candle as the main
source of lighting. This could be attributed to the dangers attached to the use of candle.
Based on this, it is recommended that;
The uses of substance made of wood as cooking fuel (firewood and charcoal) in the
Municipality calls for increased efforts to reduce the felling of trees for fire wood and
charcoal as well as implementing policies to reduce the use of firewood for cooking. This is
critical in reducing deforestation and its negative effects in the Municipality.
The Assembly in collaboration with the Energy Commission could initiate steps to inculcate
in people, the need to use LPG gas cooking fuel. The issue of reducing indiscriminate felling
of trees should reflect in the Annual Action Plans of the Assembly and implemented
accordingly.

62
REFERENCES
Arthur H, A., Thomas T. K, and Carl, H. (2011): Population Hand Book, 6th
Edition, 2011,
www.prb.org
Ghana Statistical Service (2010). 2010 Population and Housing Census, the National
Analytical Report Ghana Statistical Service, Accra
Ghana Statistical Service (2010). 2010 Population and Housing Census, the Ashanti Regional
Analytical Report Ghana Statistical Service, Accra
Ghana Web (2013). http://www.ghanaweb.com/GhanaHomePage/communication/ (Accessed
on 10th December, 2013).
Medium Term Development Plan (MTDP, 2010-2013). Ejisu-Juaben Municipality Assembly,
Ejisu-Ashanti Region.
World Bank (2010). Internet Users (per 100 people), Ghana: The World Bank, Accessed on
18th
March, 2013 from
http://data.worldbank.org/indicator/IT.NET.USER.P2?page=2&cid=GPD_44
(Accessed on 10th December, 2013).
World Health Organization (2003), 'Treatment of diarrhea: a manual for physicians and other
senior health workers', (Geneva: World Health Organization).

63
APPENDICES
Table A1: Household composition by type of locality
Household Composition
Total
Urban
Rural
Number Percent Number Percent Number Percent
Ghana 24,076,327 100.0
12,153,739 100.0
11,922,588 100.0
District 141,177 100.0
38,785 100.0
102,392 100.0
Nuclear family
Head only 5,953 4.2
1,865 4.8
4,088 4.0
Household with head and a spouse only 2,362 1.7
770 2.0
1,592 1.6
Household with head and biological/adopted children only 17,773 12.6
4,952 12.8
12,821 12.5
Household with head spouse(s) and biological/adopted children only 40,300 28.5
11,487 29.6
28,813 28.1
Extended family
Household with head spouse(s) biological/adopted children and relatives of the
head only 25,099 17.8
6,406 16.5
18,693 18.3
Household with head spouse(s) biological/adopted children relatives and
nonrelatives of the head 2,023 1.4
814 2.1
1,209 1.2
Household with head spouse(s) and other composition 4,617 3.3
1,350 3.5
3,267 3.2
Household with head biological/adopted children and relatives of the head only 28,246 20.0
6,672 17.2
21,574 21.1
Household with head biological/adopted children relatives and nonrelatives of the
head 2,540 1.8
751 1.9
1,789 1.7
Household with head and other composition but no spouse 12,264 8.7 3,718 9.6 8,546 8.3
Source: Ghana Statistical Service, 2010 Population and Housing Census
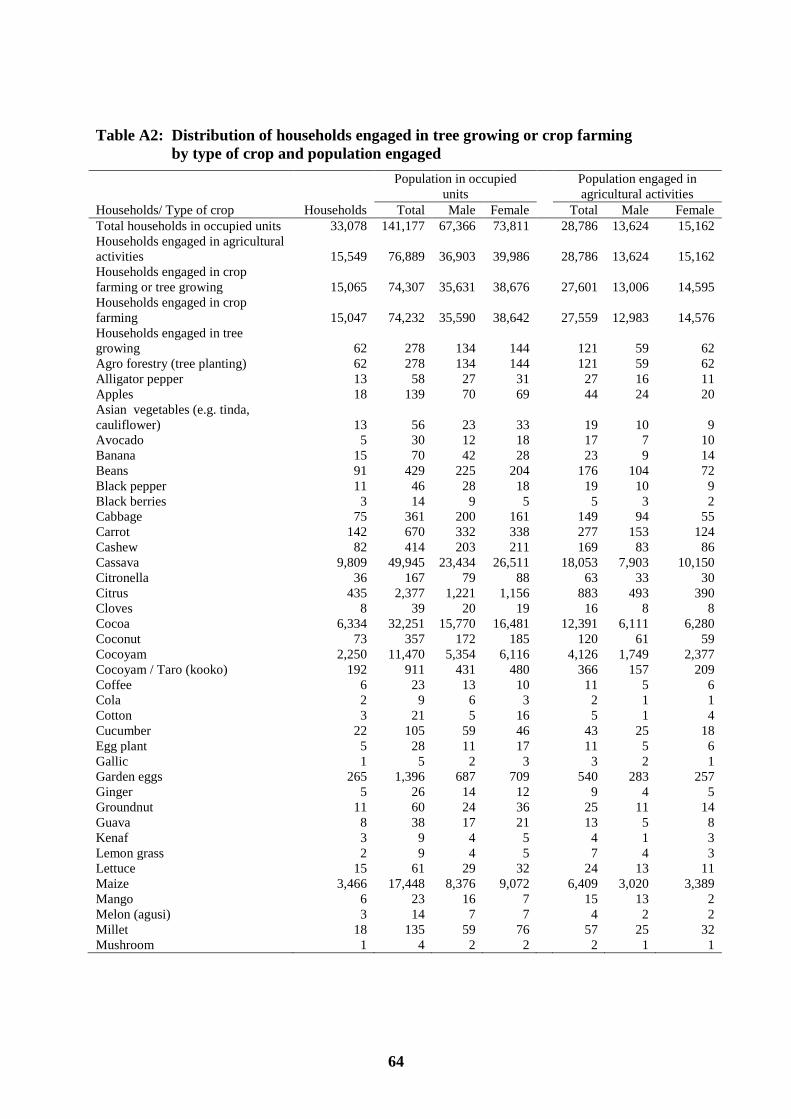
64
Table A2: Distribution of households engaged in tree growing or crop farming
by type of crop and population engaged
Households/ Type of crop Households
Population in occupied
units
Population engaged in
agricultural activities
Total Male Female Total Male Female
Total households in occupied units 33,078 141,177 67,366 73,811 28,786 13,624 15,162
Households engaged in agricultural
activities 15,549 76,889 36,903 39,986 28,786 13,624 15,162
Households engaged in crop
farming or tree growing 15,065 74,307 35,631 38,676 27,601 13,006 14,595
Households engaged in crop
farming 15,047 74,232 35,590 38,642 27,559 12,983 14,576
Households engaged in tree
growing 62 278 134 144 121 59 62
Agro forestry (tree planting) 62 278 134 144 121 59 62
Alligator pepper 13 58 27 31 27 16 11
Apples 18 139 70 69 44 24 20
Asian vegetables (e.g. tinda,
cauliflower) 13 56 23 33 19 10 9
Avocado 5 30 12 18 17 7 10
Banana 15 70 42 28 23 9 14
Beans 91 429 225 204 176 104 72
Black pepper 11 46 28 18 19 10 9
Black berries 3 14 9 5 5 3 2
Cabbage 75 361 200 161 149 94 55
Carrot 142 670 332 338 277 153 124
Cashew 82 414 203 211 169 83 86
Cassava 9,809 49,945 23,434 26,511 18,053 7,903 10,150
Citronella 36 167 79 88 63 33 30
Citrus 435 2,377 1,221 1,156 883 493 390
Cloves 8 39 20 19 16 8 8
Cocoa 6,334 32,251 15,770 16,481 12,391 6,111 6,280
Coconut 73 357 172 185 120 61 59
Cocoyam 2,250 11,470 5,354 6,116 4,126 1,749 2,377
Cocoyam / Taro (kooko) 192 911 431 480 366 157 209
Coffee 6 23 13 10 11 5 6
Cola 2 9 6 3 2 1 1
Cotton 3 21 5 16 5 1 4
Cucumber 22 105 59 46 43 25 18
Egg plant 5 28 11 17 11 5 6
Gallic 1 5 2 3 3 2 1
Garden eggs 265 1,396 687 709 540 283 257
Ginger 5 26 14 12 9 4 5
Groundnut 11 60 24 36 25 11 14
Guava 8 38 17 21 13 5 8
Kenaf 3 9 4 5 4 1 3
Lemon grass 2 9 4 5 7 4 3
Lettuce 15 61 29 32 24 13 11
Maize 3,466 17,448 8,376 9,072 6,409 3,020 3,389
Mango 6 23 16 7 15 13 2
Melon (agusi) 3 14 7 7 4 2 2
Millet 18 135 59 76 57 25 32
Mushroom 1 4 2 2 2 1 1
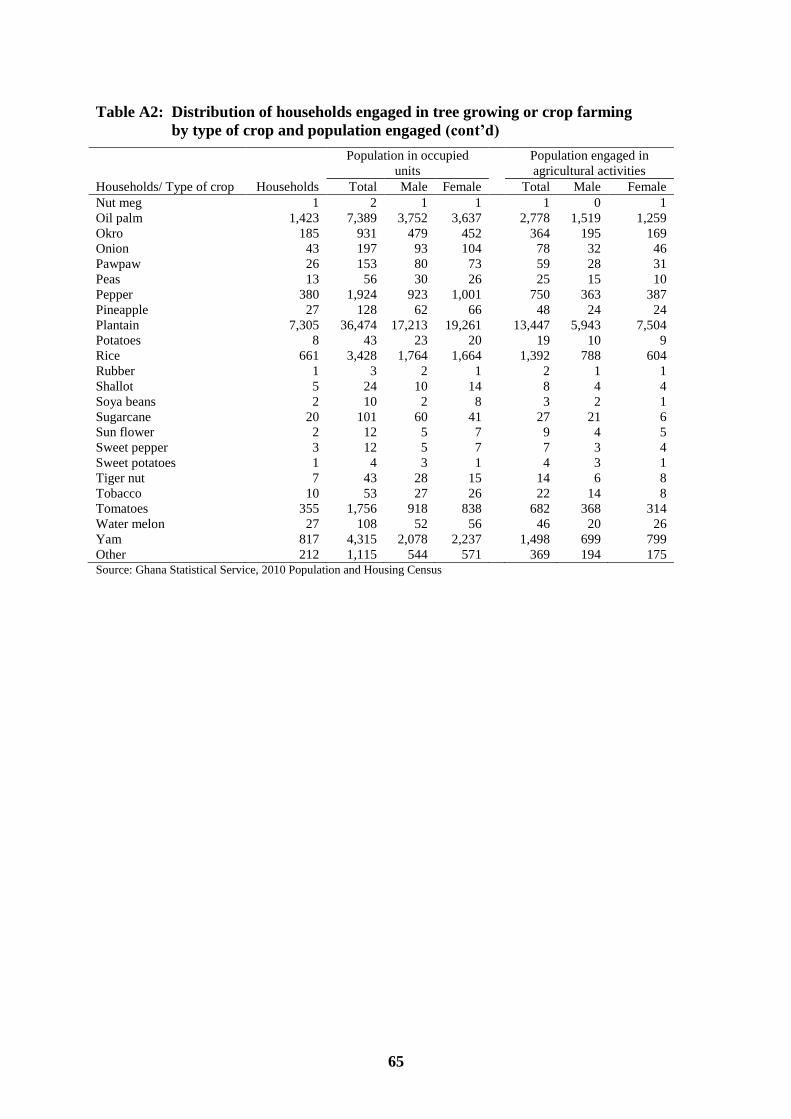
65
Table A2: Distribution of households engaged in tree growing or crop farming
by type of crop and population engaged (cont’d)
Households/ Type of crop Households
Population in occupied
units
Population engaged in
agricultural activities
Total Male Female Total Male Female
Nut meg 1 2 1 1 1 0 1
Oil palm 1,423 7,389 3,752 3,637 2,778 1,519 1,259
Okro 185 931 479 452 364 195 169
Onion 43 197 93 104 78 32 46
Pawpaw 26 153 80 73 59 28 31
Peas 13 56 30 26 25 15 10
Pepper 380 1,924 923 1,001 750 363 387
Pineapple 27 128 62 66 48 24 24
Plantain 7,305 36,474 17,213 19,261 13,447 5,943 7,504
Potatoes 8 43 23 20 19 10 9
Rice 661 3,428 1,764 1,664 1,392 788 604
Rubber 1 3 2 1 2 1 1
Shallot 5 24 10 14 8 4 4
Soya beans 2 10 2 8 3 2 1
Sugarcane 20 101 60 41 27 21 6
Sun flower 2 12 5 7 9 4 5
Sweet pepper 3 12 5 7 7 3 4
Sweet potatoes 1 4 3 1 4 3 1
Tiger nut 7 43 28 15 14 6 8
Tobacco 10 53 27 26 22 14 8
Tomatoes 355 1,756 918 838 682 368 314
Water melon 27 108 52 56 46 20 26
Yam 817 4,315 2,078 2,237 1,498 699 799
Other 212 1,115 544 571 369 194 175 Source: Ghana Statistical Service, 2010 Population and Housing Census
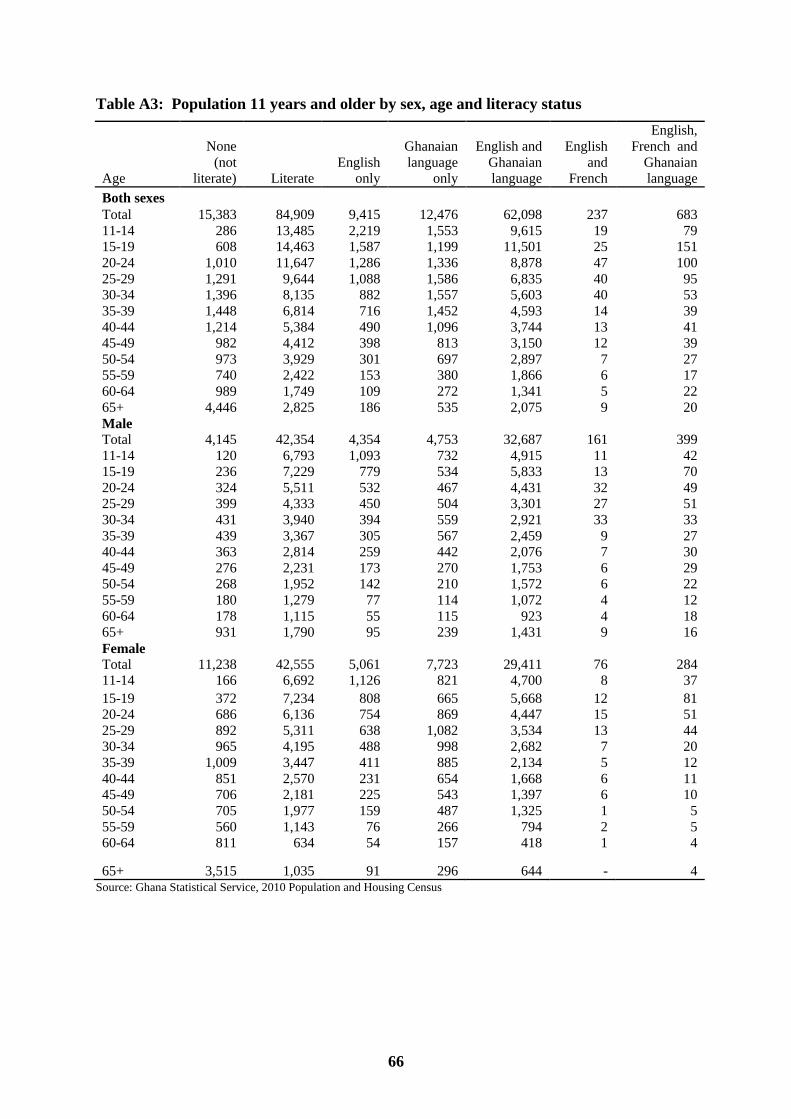
66
Table A3: Population 11 years and older by sex, age and literacy status
Age
None
(not
literate)
Literate
English
only
Ghanaian
language
only
English and
Ghanaian
language
English
and
French
English,
French and
Ghanaian
language
Both sexes
Total 15,383 84,909 9,415 12,476 62,098 237 683
11-14 286 13,485 2,219 1,553 9,615 19 79
15-19 608 14,463 1,587 1,199 11,501 25 151
20-24 1,010 11,647 1,286 1,336 8,878 47 100
25-29 1,291 9,644 1,088 1,586 6,835 40 95
30-34 1,396 8,135 882 1,557 5,603 40 53
35-39 1,448 6,814 716 1,452 4,593 14 39
40-44 1,214 5,384 490 1,096 3,744 13 41
45-49 982 4,412 398 813 3,150 12 39
50-54 973 3,929 301 697 2,897 7 27
55-59 740 2,422 153 380 1,866 6 17
60-64 989 1,749 109 272 1,341 5 22
65+ 4,446 2,825 186 535 2,075 9 20
Male
Total 4,145 42,354 4,354 4,753 32,687 161 399
11-14 120 6,793 1,093 732 4,915 11 42
15-19 236 7,229 779 534 5,833 13 70
20-24 324 5,511 532 467 4,431 32 49
25-29 399 4,333 450 504 3,301 27 51
30-34 431 3,940 394 559 2,921 33 33
35-39 439 3,367 305 567 2,459 9 27
40-44 363 2,814 259 442 2,076 7 30
45-49 276 2,231 173 270 1,753 6 29
50-54 268 1,952 142 210 1,572 6 22
55-59 180 1,279 77 114 1,072 4 12
60-64 178 1,115 55 115 923 4 18
65+ 931 1,790 95 239 1,431 9 16
Female
Total 11,238 42,555 5,061 7,723 29,411 76 284
11-14 166 6,692 1,126 821 4,700 8 37
15-19 372 7,234 808 665 5,668 12 81
20-24 686 6,136 754 869 4,447 15 51
25-29 892 5,311 638 1,082 3,534 13 44
30-34 965 4,195 488 998 2,682 7 20
35-39 1,009 3,447 411 885 2,134 5 12
40-44 851 2,570 231 654 1,668 6 11
45-49 706 2,181 225 543 1,397 6 10
50-54 705 1,977 159 487 1,325 1 5
55-59 560 1,143 76 266 794 2 5
60-64 811 634 54 157 418 1 4
65+ 3,515 1,035 91 296 644 - 4 Source: Ghana Statistical Service, 2010 Population and Housing Census

67
Table A4: Population by sex, number of households and houses in the
20 largest communities
Community Name
Sex
S/No. Total Male Female
House
holds Houses
1 Ejisu 12,898 6,146 6,752
3,191 1,238
2 Juaben 9,085 4,314 4,771
2,176 1,199
3 Fumesua 6,187 2,928 3,259
1,565 537
4 Bonwire 5,983 2,799 3,184
1,405 625
5 Kwamo 5,412 2,612 2,800
1,325 628
6 Besease 4,673 2,193 2,480
1,170 476
7 Kwaso 4,427 2,073 2,354
986 484
8 Onwe 4,343 1,956 2,387
1,028 438
9 Nobewam 3,940 1,878 2,062
952 485
10 Adumasa 3,350 1,638 1,712
782 371
11 Adarko Jachie 3,281 1,621 1,660
672 410
12 Essieninpong 3,275 1,539 1,736
704 410
13 Achiase 3,115 1,462 1,653
711 474
14 Donyina 2,978 1,387 1,591
720 368
15 Achinakrom 2,858 1,269 1,589
624 382
16 Krapa 2,764 1,330 1,434
700 297
17 Tikrom 2,685 1,278 1,407
523 297
18 New Koforidua 2,554 1,265 1,289
655 382
19 Akyawkrom 2,477 1,092 1,385
561 241
20 Amoam Achiase 2,353 1,112 1,241 550 234 Source: Ghana Statistical Service, 2010 Population and Housing Census

69
Table A5: Population by age group in the 20 largest communities
Community name
Age Group
S/No. All ages 0-4 5-9 10-14 15-19 20-24 25-29 30-34 35-39 40-44 45-49 50-54 55-59 60-64 65-69 70-74 75+
1 Ejisu 12,898 1,641 1,464 1,485 1,452 1,291 1,195 1,003 784 646 505 418 277 224 154 142 217
2 Juaben 9,085 1,276 1,135 1,136 946 836 728 672 586 460 314 312 189 140 96 105 154
3 Fumesua 6,187 800 742 722 648 577 547 527 429 303 236 171 157 98 61 70 99
4 Bonwire 5,983 782 800 760 668 593 429 390 295 287 203 201 134 115 69 80 177
5 Kwamo 5,412 754 621 584 570 517 517 429 353 289 216 170 100 96 59 49 88
6 Besease 4,673 635 602 625 496 452 372 341 256 176 175 180 87 76 50 56 94
7 Kwaso 4,427 608 577 565 516 395 322 229 220 191 171 157 96 110 60 90 120
8 Onwe 4,343 593 566 590 489 386 312 273 217 168 149 137 93 73 62 89 146
9 Nobewam 3,940 616 529 477 368 313 321 229 214 166 196 150 78 74 46 75 88
10 Adumasa 3,350 528 517 441 289 221 206 197 182 155 120 125 82 88 52 57 90
11 Adarko Jachie 3,281 448 396 352 323 497 272 231 207 172 102 84 54 46 22 34 41
12 Essieninpong 3,275 467 453 438 354 272 167 164 164 140 125 118 107 86 54 69 97
13 Achiase 3,115 444 388 393 299 239 228 158 169 121 133 132 98 84 48 76 105
14 Donyina 2,978 435 407 393 303 218 200 163 157 151 123 108 59 67 35 62 97
15 Achinakrom 2,858 409 436 397 366 216 163 146 117 100 75 83 69 56 52 66 107
16 Krapa 2,764 376 319 313 303 240 248 235 173 152 111 97 55 48 40 23 31
17 Tikrom 2,685 326 345 331 297 253 226 176 141 122 105 102 51 51 38 58 63
18 New Koforidua 2,554 342 354 366 249 209 151 128 150 115 102 99 62 62 50 42 73
19 Akyawkrom 2,477 344 355 313 275 196 201 177 148 108 84 76 47 46 36 20 51
20 Amoam Achiase 2,353 372 282 290 273 207 180 197 149 107 74 64 46 34 26 19 33
Source: Ghana Statistical Service, 2010 Population and Housing Census

70
LIST OF CONTRIBUTORS
Project Secretariat
Dr. Philomena Nyarko, Government Statistician
Mr. Baah Wadieh, Deputy Government Statistician
Mr. David Yenukwa Kombat, Acting Census Coordinator
Mr. Sylvester Gyamfi, DISDAP Project Coordinator
Mrs. Abena A. Osei-Akoto, Data Processing
Mr. Rochester Appiah Kubi Boateng, Data Processing
Mrs. Jacqueline Anum, Data Processing
Mrs. Samilia Mintah, Data Processing
Mr. Yaw Misefa, Data Processing
Mr. Ernest Enyan, Data Processing
Mr. Emmanuel George Ossei, Regional Statistician
Ms. Hanna Frempong Konadu, Formatting/Typesetting
Mrs. Mary Gyau, Formatting/Typesetting
Writers
Douglas Anyatewon Kwasi
Godfred Addai
Consultant
Dr. Eric Osei Assibey
Editor/ Reviewers
Mrs. Akua Dua-Agyeman
Mr. Johnson Owusu Kagya
Ms. Ernestina Turkson
Top Related