


![ISSN 1110 normal - kenanaonline.comkenanaonline.com/files/0064/64892/egyptian1.pdf · The Egyptian Poultry Science Journal [Editorial Board] Editor-in-Chief Prof. Dr M. A. Kosba,](https://static.fdocuments.in/doc/165x107/5eba0f5fdbecca23ae73a0c1/issn-1110-normal-the-egyptian-poultry-science-journal-editorial-board-editor-in-chief.jpg)


Languages
Pages
Legal


Egyptian Journal of Aquatic Biology & Fisheries
Zoology Department, Faculty of Science,
Ain Shams University, Cairo, Egypt.
ISSN 1110 – 6131
Vol. 24(4): 549 – 561 (2020)
www.ejabf.journals.ekb.eg
The residual effect of fish farms on the water quality of the Euphrates River, Iraq.
Muwafaq A. Rabeea1*, Ahmed S. Al-Rawi
2*, Osama J. Mohammad
2,
Bayan M. Hussien1
1
College of Applied Sciences- Hit, University Of Anbar, Iraq 2
College of Sciences, University Of Anbar, Iraq *Corresponding Authors: [email protected]; [email protected]
INTRODUCTION
Euphrates enters the Iraq border in a desert area within a relatively steep valley in
the physiological provinces (lower valleys and Al-Jezira); then, it leaves the rocky valley
and enters the plain sedimentary south of Hit city. It flows into lower locations caused by
tectonic and structural movements in the region (Fayyadh et al., 2016). The importance
of Euphrates is due to it constitutes a large proportion of life and is a vital source of all
activities of living organisms, which has made it the most consumed resources exposed to
ARTICLE INFO ABSTRACT Article History:
Received: June 2, 2020
Accepted: July 9, 2020
Online: July 12, 2020
_______________
Keywords:
Euphrates River
Fish farms
Water pollution
Water environment
This is the first study using spatial distribution maps and water level
fluctuations to highlight the impact of fish farms on the water quality of the
Euphrates River. Physical and chemical characteristics were estimated
before, during, and after the rainy season (October – December 2018) when
the water velocity and the level of the river were in fluctuation. The water
depth in the study area fluctuated between 4 and 4.5 meters. Field and
laboratory analyzes were carried out, obtaining the ecological indicators of
Dissolve Oxygen (DO), Biological Oxygen Demand (BOD5), Water
Temperature, pH, Total Dissolved Solids (TDS), Nitrate (NO3-), Phosphate
(PO43-
) and Turbidity (NTU). The impacts of fish farms cages on river water
for (DO, BOD5, and NO3-) have been determined using multi spatial
distribution maps. The results showed that the increase of NO3-
concentration within the fish cages site A is more by 51 times than its
normal concentration at the point A0, whereas, the decrease in DO
concentration is reached 31%. The effective contaminated distance in the
direction of downstream fish farm reaches more than 60 meters. The spatial
concentration rate of the nitrate enrichment with the flow direction ranges
from 0.58 to 0.60 mg/L for each meter. At the same time, the amount of
dilution gradient ranges from 0.30 to 0.32 mg/L/m during the monitoring
period. The spatial concentration rate of BOD5 enrichment was 0.085, 0.08,
and 0.06 mg/L/m, while the amount of dilution gradient was 0.04, 0.03, and
0.06 mg/L/m during October, November, and December, respectively.
Muwafaq A. Rabeea et al., 2020 550
pollution from various sources (Awomeso., 2010; Marcin and Ireneusz., 2018; Bayan
et al., 2020).
Demand for marine products increased in all developed countries, with an increase
reach 62% in 2003, while Tacon and Halwar (2007) predicted that fish consumption
could reach about 1 million tons in 2021. Water discharges from fish farms contain solid
or liquid organic pollutants, as well as the high turbidity of the flowing water changes the
ecosystems of water. This causes the lives of some aquatics to be threatened by the other.
The water environments, its physical, chemical, and biological properties are directly
affected by the production of fish farms by pollutants (Arisekar et al., 2019; Walid et
al., 2020). Many ecologists have described aquaculture as an environmental disaster due
to management errors. Healthy developments of fish farming require not only meeting the
needs of farmed fish but also pay attention to the environment (Tookwinas, 1996;
Cripps and Bergheim, 2000; Federica et al., 2014; Medhat et al., 2020).
Aquaculture systems in cages need further development. Fish farming in floating cages
can lead to many environmental risks, such as increased plant and algae growth. A
studies by (Renato et al., 2006; Mcmutry et al., 2007) confirmed using such water to
improve the quantity and quality of plants when using it as soluble fertilizers. Another
reason represented by escaping of farmed fish to the natural environment can affect on
fish living in natural water as well as the inconvenience and confusion of the security of
cage manufacturing and installation of terrestrial or aquatic animals in the region (Pillay.,
2004). Fish cages are thrown out toward the deeper water and more extreme operating
conditions, in order to reduce environmental impacts by increasing potential pollution
(Cremer., 2006; Lisac and Refa., 2006; Chen et al., 2007; Jose and Jim., 2007). Water
is considered as one of the most important factors in obtaining a good agricultural
investment. Therefore, it is necessary to collect requirements to make use of available
water resources to improve productivity, such as reusing water from fish ponds to irrigate
various crops (Cruz et al., 2000; Malik et al., 2017). Nowadays, Euphrates suffers from
increasing amounts of pollutants due to fish farming residues, which endanger both the
aquatic environment and the farms themselves. Therefore, this paper aims to shed light on
the Euphrates environment as a reference study for future research projects.
Study Area
The study area locates at western Iraq on the coordinates (X=291249-291302;
Y=3745095-3745173) (Fig 1) classified as dry climate, according to Mather (1974).
The average temperature, falling rains, and wind speed during the study period were 22.5
°C, 41 ml, 21 Km/h, respectively. The number of fish in the farms was about 50,000 fish
at an average weight of 1800 g/fish. The water velocity was 0.15, 0.19, and 0.16 m/sec in
November, October, and December, respectively. The depth of water was 3.7 meters in
October, increased about 50 cm in November then increased 10 cm in December.

551 The residual effect of fish farms on the water environment of the Euphrates River
Fig. 1 A map of the study area
MATERIALS AND METHODS
The monitoring points are located using the Global Positioning System (GPS) and
plotted the locations of survey networks on Geo-referenced base map using Surfer
Software11 within the study area. Some studied variables (DO, BOD5, and NO3-) are
produced as a spatial distribution map. Five Points (A, A1, A2, A3, A4, and A5) are fixed
to monitor the physical and chemical changes of river water passing through floating
cages for three months (Fig 1), then, comparing the characteristics of the river water in
these monitored points with the representative upstream zone at the location (A0).
Eighteen samples are collected for analysis during the monitoring period extended
from October to December (2018). The samples are collected in polyethylene bottles
washed by distilled and sterile water (APHA, 1998). The results are listed in Table 1.
Table 1 Physico-chemical analysis of Euphrates River
Variables A0
Northing(X)=3745173 Easting(Y)=291301
A 3745146 291282
A1 3745119 291270
A2 3745115 291265
A3 3745110
291261
A4 3745097 291248
Oct
ob
er
PH 8 8.5 7.8 7.9 7.9 7.9
Temp °C 21 21 21 22 21 22
Turb. NTU 3.6 10 8.7 8 5.3 3.5
TDS mg/l 450 455 460 452 480 470
NO3- mg/l 0.42 21.54 18.43 13.51 7.25 2.19
PO43-
mg/l 0.049 0.101 0.049 0.044 0.064 0.056
DO mg/l 9 5.6 8.1 8.5 8.4 8.6
BOD5 mg/l 1.2 4 2.3 2.1 2 1.5
Novem
ber
PH 8.4 8.6 8.6 8.5 8.4 8.4
Temp °C 19 19 19 19 20 19
Turb. NTU 30 30 30.4 30.5 30.1 30
TDS mg/l 535 535 490 490 520 530
NO3- mg/l 0.35 20.58 17.72 9.50 10.26 1.81
PO43-
mg/l 0.075 0.075 0.050 0.058 0.055 0.056
DO mg/l 7.8 5.8 6.9 7.1 7.6 7.8
Muwafaq A. Rabeea et al., 2020 552
BOD5 mg/l 2.5 3.9 3.6 3.7 3.8 2.4
Dec
em
ber
PH 8 8.4 7.9 7.9 8.1 8
Temp °C 17 18 18 19 18 18
Turb. NTU 4.4 6 6.1 5.7 4.9 4.1
TDS mg/l 490 491 525 530 520 515
NO3- mg/l 0.37 21.21 17.93 10.91 8.29 3.25
PO43-
mg/l 0.059 0.095 0.050 0.041 0.040 0.046
DO mg/l 8.2 5.8 8 8.3 8.1 8.1
BOD5 mg/l 1.8 3.8 2.6 2.7 2.2 1.8
RESULTS
According to the statistical correlation of Spearman coefficient (rs) = 1 - 6 ∑di² / n
(n² - 1), comparisons are carried out between the chemical and physical variables versus
DO and NO3-; where, dᵢ = xᵢ - yᵢ represents the difference in ranks for the i-th individual
and n denotes the number of individuals (Helsel and Hirsch., 2002).
The analysis has shown a positive correlation with some variables and a negative one
with the others (Table 2). The DO is one of the most important parameters of the
aquaculture environment. Thus, it regulates the metabolic processes as well as being one
of the most important elements that create good environmental conditions for various
neighborhoods (Eric et al., 2016). Table 2, shows reverse relation between DO and the
studied variables except for the water temperature shown weak linear positive relation
with DO. The reverse relation of DO with pH values is originated from the presence of
nitrogen as (NH3) in a reduction environment, which converted to a high concentration of
NO3- according to the oxidation-reduction reactions (Stumm and Morgan., 1981).
Another reverse correlation is observed between DO and TDS originated in the
precipitation of specific ions due to the oxidation reaction of different ions.
Table 2 Statistical correlations according to the results of Spearman Rank Coefficient Parameters DO NO3
- Temp pH BOD5 PO4
3- TDS
DO 1.0
NO3- -0.5511 1.0
Temp 0.3457 0.1011 1.0
pH -0.7688 0.1847 -0.1935 1.0
BOD5 -0.8808 0.7048 -0.1021 0.6542 1.0
PO43-
-0.5536 0.1259 0.0206 0.5087 0.4417 1.0
TDS -0.3725 -0.0737 -0.5407 0.3214 0.3869 0.0877 1.0
The dispersion of DO, BOD5 and NO3- was monitored and detected by spatial
distribution maps before, within and after fish farms (floating cages) with an area of 720
meters. Figures 1-A, 1-B and 1-C showed that DO concentration inside (A) the cages is
stable at a value ranged between 5.6 and 5.8 mg/L during the study period. Figure 2-A
shows that the highest concentration of DO in October is observed at the end of the farm
rather than in the middle (point A). This is due to the decline in water level by 3.7 m at a
water velocity of 0.15 m/sec. In Figures 2-B and 2-C, the highest concentration of DO

553 The residual effect of fish farms on the water environment of the Euphrates River
value is observed to be in a different location in the farm (middle). Then, the dilution
starts directly until reaching a concentration of 8 to 8.1 mg/L at point A1. The DO
saturation rate is 7.8 mg/L in November; this decrease is observed due to the thrived
suspended organic matters carried by the floods during the rainy season (November)
(Amirkolaie, 2008).
The water recovers its normal state after 60 meters distance at point A4 due to the
high water velocity, which reduced the time of dilution. In December and October, the
water needs further distance than A4 to recover DO concentration to its normal state
(A0). The study model indicates that DO concentration should be monitored continuously
when the water level fluctuates. The lowest water temperature (17 °C) is recorded during
the monitoring period in December, yet no changes observed in the concentration of DO
(Figure 4) despite the low temperature should help to maintain a greater amount of
oxygen (Nyanti et al., 2018). This behavior was neutralized since the fluctuation of the
river level changed its properties.
The BOD5 concentration maps (Fig. 3-A, 2-B and 3-C) revealed that the BOD5
plumes were located in the center of the cages, specifically at point A. In addition, there
was a difference in the distribution behavior observed during the October, November and
December periods. The highest BOD5 concentration is found in point A (4, 3.9 and 3.8
mg/L) in the monitoring months respectively, with an enrichment gradient coefficient of
0.085, 0.08 and 0.06 mg/L/m from point A0. The dilution gradient coefficient is 0.04,
0.03 and 0.060 mg/L/m after point A and towards point A4. The difference between
dilution and enrichment concentration mechanisms is due to the increase of organic
matter and nutrients as well as water velocity, where dilution of chemical ions is strongly
influenced by river flow (Pasquini and Sacchi., 2012).
Figure 3-A (October) shows that the water passing cages need more distance from
the cages to recover its normal state as in point A0, where relative high temperatures (Fig
4), low water level and high enrichment led to decrease the dilution rate. This led to an
increase in DO consumption by fishes let to high BOD5 concentration. The DO associate
with photosynthesis and respiration is a major cofactor affecting the acidic function
(Wetzel, 1983; François and Janet., 1993). The results obtained from Figure (4) showed
an alkaline condition (pH) at point A during the study period, where the DO
concentration is decreased accompanied by increasing in nitrogen concentration due to
the fish wastes, during October and December. However, the water outflow from the
fishery farm is recovered at a distance of 27.5 m (point A1), while the alkaline water
effect continued to point A3 in November.
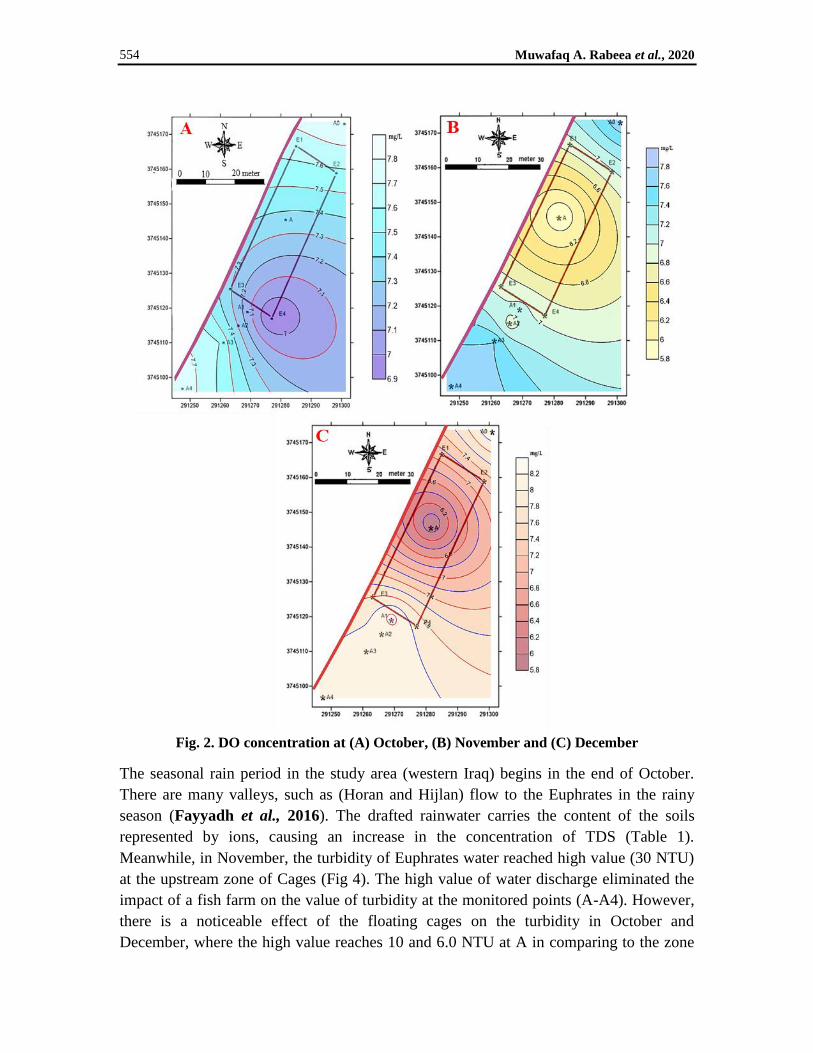
Muwafaq A. Rabeea et al., 2020 554
Fig. 2. DO concentration at (A) October, (B) November and (C) December
The seasonal rain period in the study area (western Iraq) begins in the end of October.
There are many valleys, such as (Horan and Hijlan) flow to the Euphrates in the rainy
season (Fayyadh et al., 2016). The drafted rainwater carries the content of the soils
represented by ions, causing an increase in the concentration of TDS (Table 1).
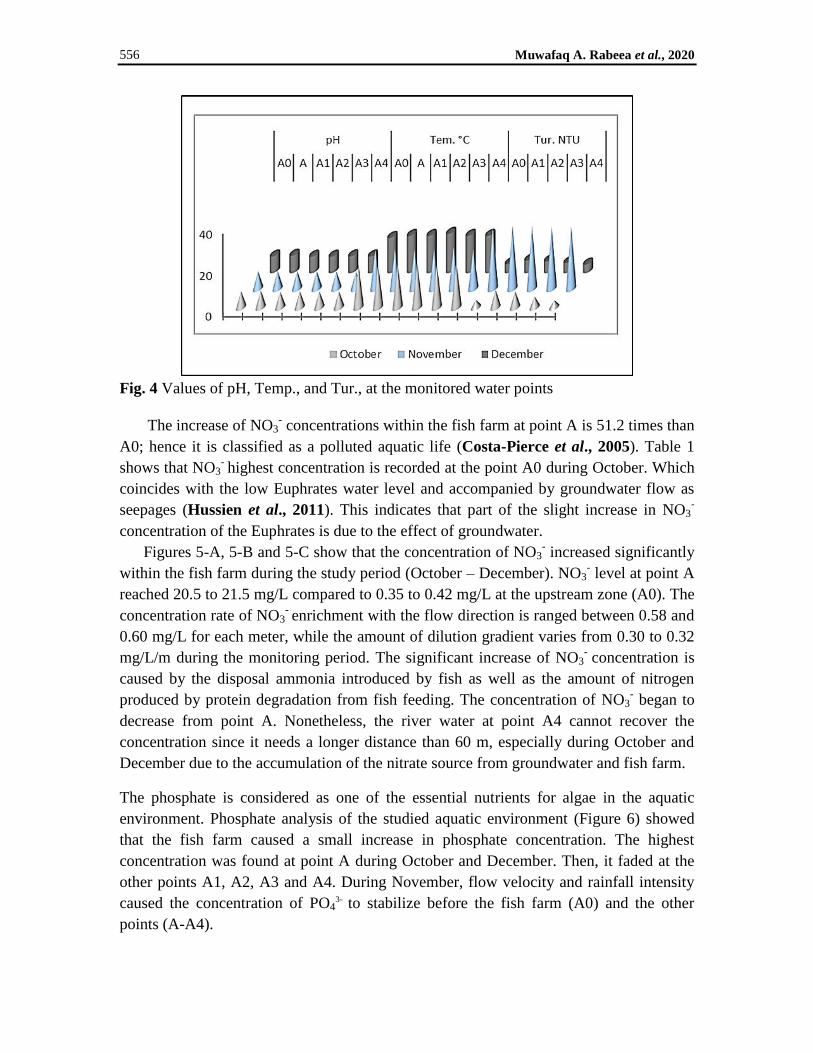
Meanwhile, in November, the turbidity of Euphrates water reached high value (30 NTU)
at the upstream zone of Cages (Fig 4). The high value of water discharge eliminated the
impact of a fish farm on the value of turbidity at the monitored points (A-A4). However,
there is a noticeable effect of the floating cages on the turbidity in October and
December, where the high value reaches 10 and 6.0 NTU at A in comparing to the zone

555 The residual effect of fish farms on the water environment of the Euphrates River
upstream Cages (A0) 3.6 and 4.4 NTU respectively. Finally, the turbidity is recovered to
the normal state (A0) at A4.
Fig. 3 BOD5 concentration at (A) October, (B) November and (C) December
Muwafaq A. Rabeea et al., 2020 556
Fig. 4 Values of pH, Temp., and Tur., at the monitored water points
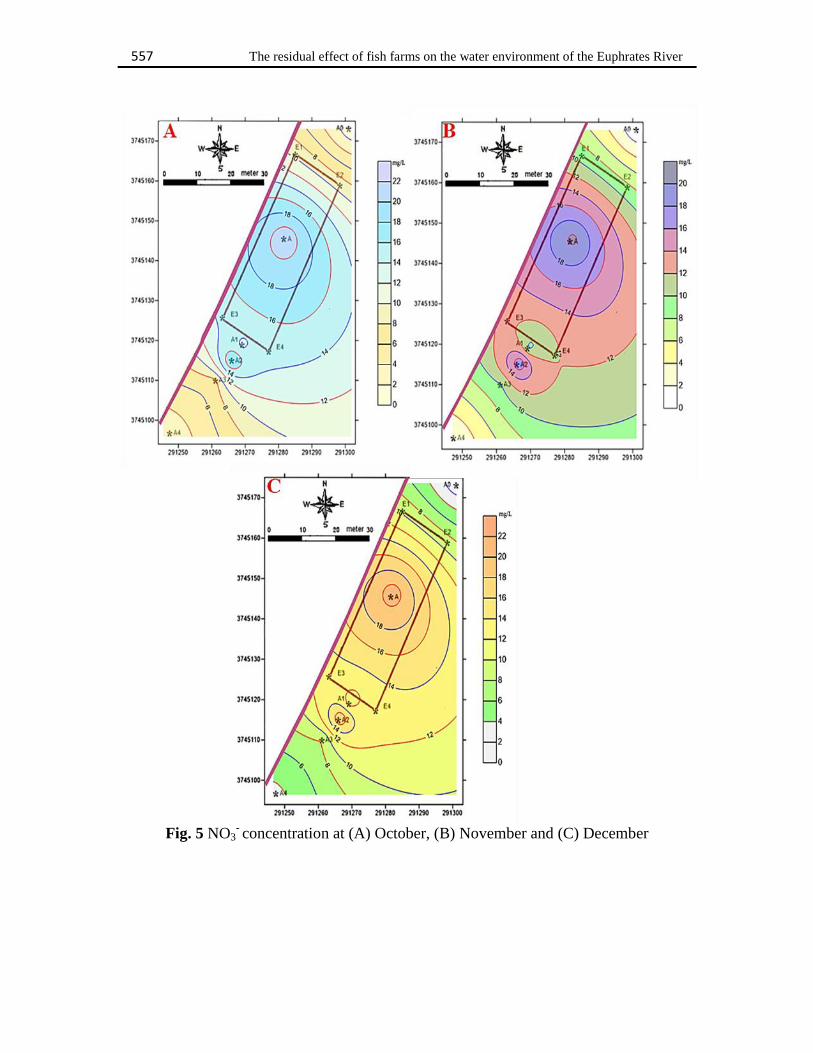
The increase of NO3- concentrations within the fish farm at point A is 51.2 times than
A0; hence it is classified as a polluted aquatic life (Costa-Pierce et al., 2005). Table 1
shows that NO3- highest concentration is recorded at the point A0 during October. Which
coincides with the low Euphrates water level and accompanied by groundwater flow as
seepages (Hussien et al., 2011). This indicates that part of the slight increase in NO3-
concentration of the Euphrates is due to the effect of groundwater.
Figures 5-A, 5-B and 5-C show that the concentration of NO3- increased significantly
within the fish farm during the study period (October – December). NO3- level at point A
reached 20.5 to 21.5 mg/L compared to 0.35 to 0.42 mg/L at the upstream zone (A0). The
concentration rate of NO3- enrichment with the flow direction is ranged between 0.58 and
0.60 mg/L for each meter, while the amount of dilution gradient varies from 0.30 to 0.32
mg/L/m during the monitoring period. The significant increase of NO3- concentration is
caused by the disposal ammonia introduced by fish as well as the amount of nitrogen
produced by protein degradation from fish feeding. The concentration of NO3- began to
decrease from point A. Nonetheless, the river water at point A4 cannot recover the
concentration since it needs a longer distance than 60 m, especially during October and
December due to the accumulation of the nitrate source from groundwater and fish farm.
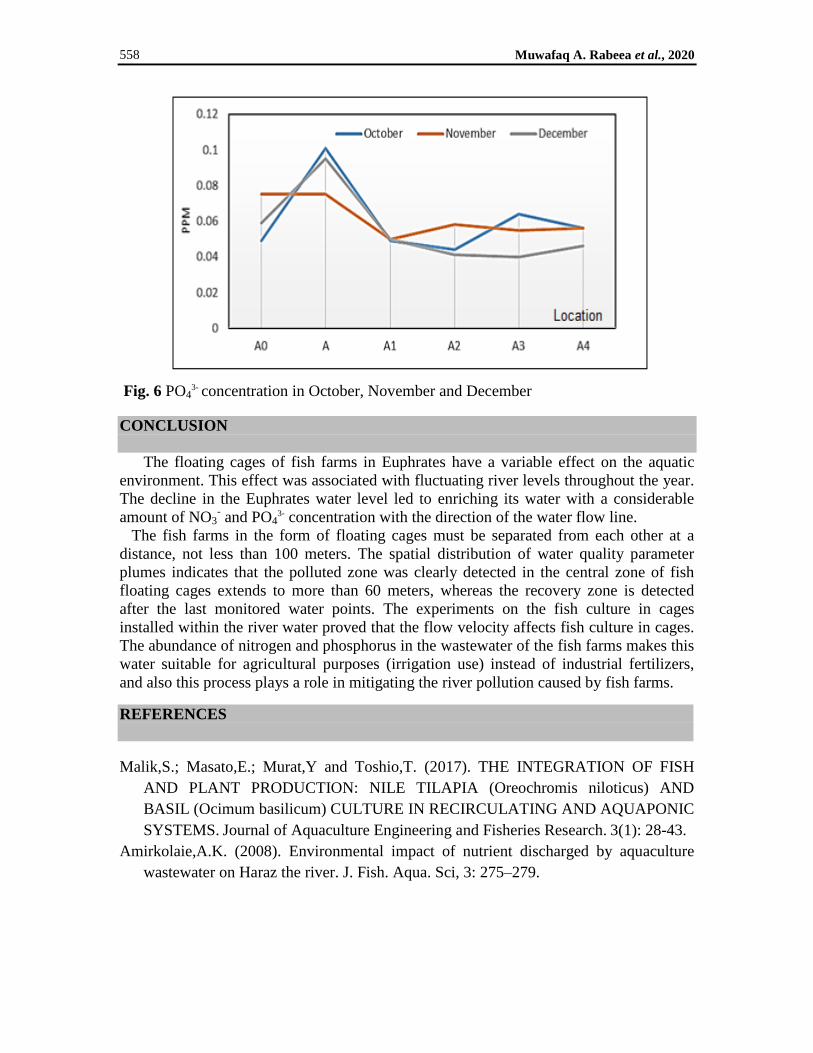
The phosphate is considered as one of the essential nutrients for algae in the aquatic
environment. Phosphate analysis of the studied aquatic environment (Figure 6) showed
that the fish farm caused a small increase in phosphate concentration. The highest
concentration was found at point A during October and December. Then, it faded at the
other points A1, A2, A3 and A4. During November, flow velocity and rainfall intensity
caused the concentration of PO43-
to stabilize before the fish farm (A0) and the other
points (A-A4).
557 The residual effect of fish farms on the water environment of the Euphrates River
Fig. 5 NO3
- concentration at (A) October, (B) November and (C) December
Muwafaq A. Rabeea et al., 2020 558
Fig. 6 PO4
3- concentration in October, November and December
CONCLUSION
The floating cages of fish farms in Euphrates have a variable effect on the aquatic
environment. This effect was associated with fluctuating river levels throughout the year.
The decline in the Euphrates water level led to enriching its water with a considerable
amount of NO3- and PO4
3- concentration with the direction of the water flow line.
The fish farms in the form of floating cages must be separated from each other at a
distance, not less than 100 meters. The spatial distribution of water quality parameter
plumes indicates that the polluted zone was clearly detected in the central zone of fish
floating cages extends to more than 60 meters, whereas the recovery zone is detected
after the last monitored water points. The experiments on the fish culture in cages
installed within the river water proved that the flow velocity affects fish culture in cages.
The abundance of nitrogen and phosphorus in the wastewater of the fish farms makes this
water suitable for agricultural purposes (irrigation use) instead of industrial fertilizers,
and also this process plays a role in mitigating the river pollution caused by fish farms.
REFERENCES
Malik,S.; Masato,E.; Murat,Y and Toshio,T. (2017). THE INTEGRATION OF FISH
AND PLANT PRODUCTION: NILE TILAPIA (Oreochromis niloticus) AND
BASIL (Ocimum basilicum) CULTURE IN RECIRCULATING AND AQUAPONIC
SYSTEMS. Journal of Aquaculture Engineering and Fisheries Research. 3(1): 28-43.
Amirkolaie,A.K. (2008). Environmental impact of nutrient discharged by aquaculture
wastewater on Haraz the river. J. Fish. Aqua. Sci, 3: 275–279.

559 The residual effect of fish farms on the water environment of the Euphrates River
APHA (1998) Standard Methods for the Examination of Water and Wastewater. 20th
Edition, American Public Health Association, American Water Works Association
and Water Environmental Federation, Washington DC.
Awomeso, J.A., Taiwo, A.W., Gbadebo, A.M., and Adenowo, J.A. (2010). Studies on the
pollution of water body by Textile Industry Effluent sin Lagos, Nigeria. Journal of
Applied Sciences in Environmental Sanitation, 5 (4): 353-359.
Bayan,M.H.; Muwafaq.A.R and Husam,N.M. (2020). Estimation of corrosion and
encrustation from groundwater chemistry of the aquifers: A case study of Al Hammad
zone. Environmental Nanotechnology, Monitoring & Management.14, 100334.
https://doi.org/10.1016/j.enmm.
Chen,J.; Guang,C.; Xu,H.; Chen,Z.; Xu,P.; Yan,X.; Wang,Y and Liu, J. (2007). A review
of cage and pen aquaculture: China. In: Cage aquaculture-Regional reviews and
global overview. Halwart, M.; Soto, D. and Arthur, J. R. (Eds.): 50-68. FAO Fisheries
Technical Paper. No. 498, Rome, FAO, 241 p.
Costa-Pierce,B.; Desbonnet,A.; Edwards,P and Baker,D. (2005). Urban Aquaculture.
CABI Publishing. Wallingford
Cremer,M.C.; Lan,H.P.; Schmittou,H.R and Jian,Z. (2006). Commercial scale production
of pompano Trachinotus ovatus in off-shore ocean cages: Results of 2004 and 2005
production tests in Hainan, China, by ASA-IM/USB. In Book of Abstracts, 2nd
International Symposium on Cage Aquaculture in Asia (CAA2), 3-8.
Cripps,S.J and Bergheim,A. (2000). Solids management and removal for intensive land-
based aquaculture production systems. Aquaculture Engineering, 22 : 33-56.
Cruz,E.M.; Al-Ameeri,A.A.; Al-Ahmed,A.K and Ridha,M.T. (2000). Partial budget
analysis of Nile tilapia oreochromis niloticus cultured within an existing agricultural
farming Kuwait. Asian fisheries science, 13 : 297-305.
Federica,D.; Pier,P.M and Slađana,P. (2014). Marine ecological footprint of Italian
Mediterranean fisheries. Sustainability, 6: 7482–7495.
FAO. (2016). Food and Agriculture Organization of the United Nations. The State of
World Fisheries and Aquaculture: Contributing to food security and nutrition for all.
Rome. 200 pp.
Fayyadh,A.S.; Hussien,B.M.; Al-Hamdani, M.M.; Salim,S.A.; Mukhlef,H.N and
Maher,A.A. (2016). Hydrologic System of Euphrates River (Spatial Analysis)
between Al-Qaem and Falluja. Iraqi Bulletin of Geology and Mining. 2: 1-12.
Eric,R.F.; Jonathan,A.W.; Chris,J.P and Marta,K.H .(2016). Critical Dissolved Oxygen
Tolerances of Whirling Disease-Resistant Rainbow Trout. N. Am. J. Aquac, 78:366–
373.
Helsel,D and Hirsch,R. (2002). Chapter A3, statistical methods in water resources.
Techniques of Water-Resources Investigations of the United States Geological
Survey, Book 4, Hydrologic Analysis and Interpretation, 510 p.
http://water.usgs.gov/pubs/twri/twri4a3/

Muwafaq A. Rabeea et al., 2020 560
Hussien,B.M.; Fayyadh,A.,S.; Hammed,J.M and Al Hamdani,M.A. (2011).
Hydrochemical model and probable pollution in the water of Euphrates River (Qaem–
Falluja). Arab J Geosci, DOI 10.1007/s12517-011-0390-8.
Jose,A and Jim,K. (2007). Geographic information systems, remote sensing and mapping
for the development and management of marine aquaculture. FAO Fisheries
Technical Paper. No. 458. Rome, FAO. 125 p.
Nyanti,L.; Soo,C.L.; Ahmad-Tarmizi,N.N.; Abu-Rashid,N.K.; Ling,T.Y.; Sim,S.F.;
Grinang,J.G,A and Lee,K.S.P. (2018). Effects of water temperature, dissolved oxygen
and total suspended solids on juvenile barbonymus schwanenfeldii (Bleeker, 1854)
and Oreochromis Niloticus (Linnaeus, 1758). AACL BiofluxOpen, 11 (2): 394-406.
Lisac,D and Refa,M. (2006). Open-sea farming: Operational constraints. In Book of
Abstracts, 2nd International Symposium on Cage Aquaculture in Asia (CAA2), 3-8
July, Hangzhou, China, 63 p.
Marcin,S and Ireneusz,C. (2018). Effect of Water Management Technology Used in
Trout Culture on Water Quality in Fish Ponds. Water, 10, 1264.
Mather,J.R. (1974). Climatology, Fundamental and application. Mc Graw Hill, USA.
Mcmutry,M.R.; Sanders,D.C.; Cure,J.D.; Hudson,R.G.; Haning,B.C and Amand,S.T.
(2007). Efficiency of water use of an integrated fish/vegetable co-culture system.
Journal of the world aquaculture society,28(4):420-428.
Medhat,H.H.; Safaa,I.T.; Ebrahim,A.S.; Amal,M.Y and Anas,A.H. (2020). Impact of the
water quality of El-Rahawy Drain on some genetic and histopathological aspects of
Oreochromis niloticus. Egyptian Journal of Aquatic Biology & Fisheries. 24(2): 19 –
38.
François,M.M and Janet,J.H. (1993). Principles and Applications of Aquatic Chemistry.
J. Wiley & Sons, New York. 588 p. ISBN-13: 978-0471548966.
Pasquini,A.I and Sacchi,G.A. (2012). Hydrochemistry and nutrients dynamic in the
Suquía River urban catchments, Córdoba, Argentina, Environ. Earth Sci, 65:453–467.
Pillay,T.V.R. (2004). Aquaculture and the environment. Oxford, Blackwell Publishing
Ltd.
Renato,S.C.; Celicina,M.S.; Borges,A and Francisco,B. (2006). Increasing cherry tomato
yield using fish effluent as irrigation water in northeast Brazil. Scientia
horticulturae,110 (1):44-50.
Stumm,W and Morgan,J.J. (1981). Aquatic Chemistry. An Introduction Emphasizing
Chemical Equilibria in Natural Waters. 2nd Edition. J. Wiley & Sons, New York. 780
pp.
Tacon,A.G.J and Halwart,M. (2007). Cage aquaculture: a global overview. In: Cage
aquaculture -Regional reviews and global overview. Halwart, M.; Soto, D. and
Arthur, J. R. (Eds.): 1-16. FAO Fisheries Technical Paper. No. 498, Rome, FAO, 241
p.

561 The residual effect of fish farms on the water environment of the Euphrates River
Tookwinas,S. (1996). Environmental impact assessment for intensive marine shrimp
farming in Thailand. SEAFDEC Asian Aquaculture, 49:119 -133.
Arisekar.U.; Robinson,J.S.; Geevaretnam,J.; Shalini,R.; Palani,K.; Asha,H and Rani,V.
(2019). Accumulation of organochlorine and pyrethroid pesticide residues in fish,
water, and sediments in the Thamirabarani river system of southern peninsular India.
Environmental Nanotechnology, Monitoring & Management.
https://doi.org/10.1016/j.enmm.2018.11.003
Walid,A.; Alaa E and Mohamed,A.F. (2020). Some Fisheries and Biological Aspects of
the Crayfish Procambarus clarkii (Girard, 1852) in the River Nile, Egypt. Egyptian
Journal of Aquatic Biology & Fisheries, 24(4): 33 – 42.
Wetzel,R.G. (1983). Limnology. 2nd Edition. Saunders College Publishing, Philadelphia.
767 pp.
Top Related