


Languages
Pages
Legal


Egypt Country Report
June 4, 2015
Edited by Dr. Roby Nathansom 1

Chapter 1 Poverty and income distribution
1. Introduction Poverty reduction is an essential component of development and constitutes one of the main
objectives of the Millennium Development Goals (MDG). While inequality is not refereed to
explicitly in the MDG, it is not a minor issue although some economists consider that as long
as poverty is minimized, there is no pressing need to care about inequality. Their argument is
that the concentration of wealth could generate savings, investment and growth at least in
early development stages. So, there is no reason to restrain the gains of the very rich. The
argument is reminiscent of the well-known Kuznets’ hypothesis. The latter states that as an
economy develops, market forces first increase and then decrease economic inequality.
Hence, at an early stage of development, equality can come at the expense of growth. There
are, however, strong counterarguments. First, basic economic principles show that the
distribution of income within a country has a direct impact on the welfare of its people.
Maximizing total welfare has always been at the heart of economic analysis. A more equal
distribution of national income means that aggregate welfare (where the welfare of
individuals is given equal weight) is higher for any given level of average per capita income.
Moreover, equity is central to the construction of socially inclusive states and the realization
of a strong climate of citizenship. Finally, observations show that high levels of inequality are
often found in the poorest countries (UNRISD, 2010). Hence, concerns about inequality have
intrinsic value.
This chapter focuses on the issues of poverty and inequality in Egypt. A survey by Bibi and
Nabli (2009) showed that the relevant literature is very limited. The authors also show that,
beside measurement issues, researches on poverty and inequality in Arab countries has
pursued two main tracks. The first one has focused on the links between growth and
inequality and its implications for poverty reduction. The second track focused on the impact
of public policies on poverty and inequality. The common findings are that growth was the
main source of the continuous poverty reduction in all Arab countries but Egypt; which has
experienced a redistributive effect in favor of the poor even during contraction periods.
Regarding policies, the focus in the Arab context was on public employment, social
expenditures, investment in human capital and globalization.
2

The chapter is organized as follows. Section 2 analyzes the status and evolution of inequality
and poverty in Egypt. Section 3 discusses the relationship between growth, poverty and
inequality in the country. Section 4 does the same regarding the relationship with public
employment. Section 5 asses the role of social policies while Section 6 examines the impact
of globalization on poverty and inequality. Section 7 concludes.
2. Status and evolution of inequality and poverty in Egypt Before going ahead with the analysis of the status and evolution of inequality and poverty in
Egypt, some caveats are in order and imply caution in the interpretation of the data. First, data
are not easily available. While most countries undertake regular household surveys, access to
the data is very difficult. Second, the surveys are unable to capture the incomes of the richest
sectors of the society which implies that the available inequality measures are most likely to
suffer underestimation. Third, the surveys’ results are not validated by comparisons with other
sources of data such as the labor market (wage statistics) or tax data. Finally, there is no
standardization of sampling and survey methods across Arab countries which implies that the
way countries rank according to the Gini index, for instance, might be spurious and only due
to differences in the ways the data are collected and treated (Nabli and Bibi, 2009). To limit
the impact of the above discussed issues on our analysis, we rely as much as possible on the
same data source that is, for this chapter, the World Development Indicators from the World
Bank.
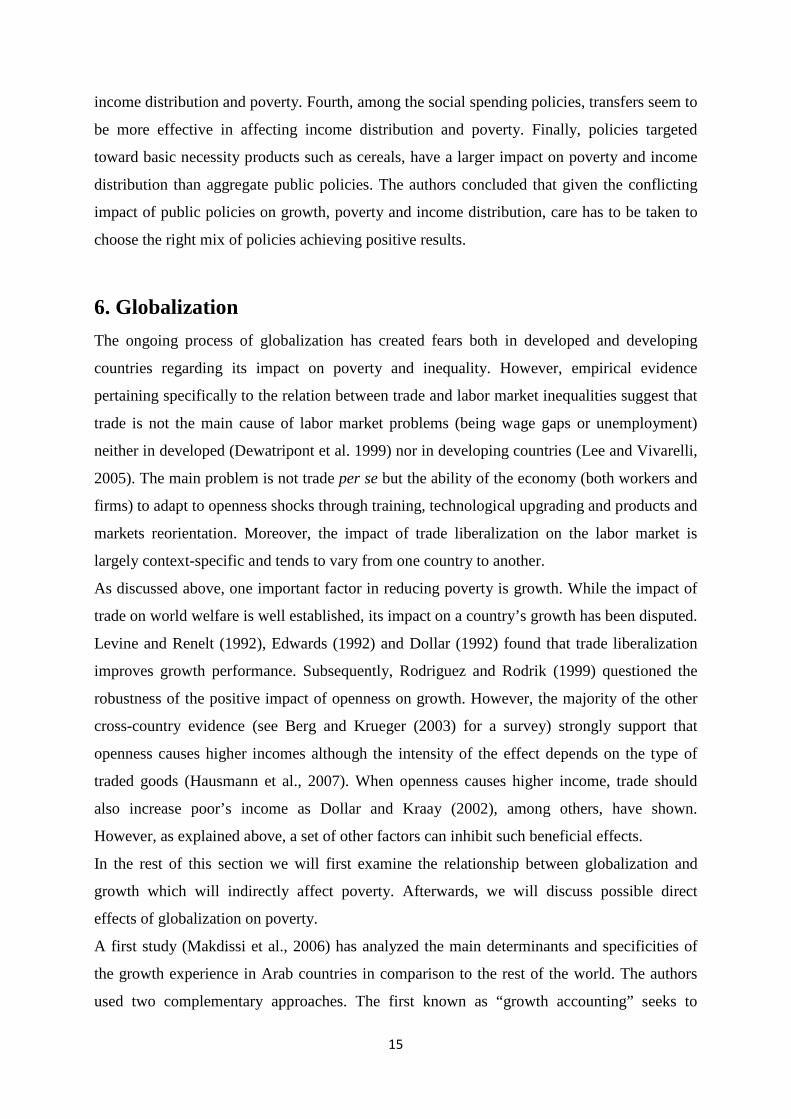
Figure 1 presents the 2005-2010 average Gini index and the change in the index between
1990 and 2010 for Egypt and comparable countries. Inside the Middle East and North Africa
(MENA) region, Egypt shows the lowest level of the Gini between 2005 and 2010. Compared
to the rest of the comparator countries, Egypt exhibits a Gini similar to Pakistan but lower
than any other country.
In terms of evolution, Egypt shows almost no change between 1990 and 2010. In the rest of
the comparator countries no specific pattern emerges. The evolution in Egypt may seem
disappointing. However, this is not necessarily the case. On the one hand, this country had a
GINI index already among the lowest during the period 1990-1995. Hence, improvement
cannot be expected to be impressive. On the other hand, India and Indonesia had comparable
levels to Egypt during the period 1990-1995 but have worsened their situations in 2010.
3

Figure 1: Gini coefficient level and evolution
Source: World Development Indicators
Figure 2 focuses on poverty as measured by the share of population living with US$ 1.25 and
2 (PPP) or less per day. The first threshold (1.25) is supposed to reveal extreme poverty while
the second concerns poverty. Extreme poverty seems very low in the MENA region, but
Yemen, in 2005-2010. It is also lower than in all other comparator countries. In general,
extreme poverty has declined between 1990 and 2010. In terms of poverty (threshold of 2),
Egypt does worse than the rest of MENA (Except Morocco and Yemen) and many other
comparator countries. In term of evolution, poverty in Egypt has been reduced similarly as in
other MENA countries but much lesser than in other countries.
To summarize, inequality in Egypt used to be and remains low in comparison to countries in
the Region and outside the Region. Extreme poverty is low and decreasing. In term of
0
10
20
30
40
50
60
70
Egyp
tJo
rdan
Yem
enTu
nisia Ira
nM
oroc
coIs
rael
Paki
stan
Indi
aIn
done
siaVi
etna
mSr
i Lan
kaN
icar
agua
Phili
ppin
esEl
Sal
vado
rPa
ragu
ayBo
livia
Guat
emal
aHo
ndur
as
Average 1990-1994
0
10
20
30
40
50
60
Egyp
tJo
rdan
Yem
enTu
nisia Ira
nM
oroc
coIs
rael
Paki
stan
Indi
aIn
done
siaVi
etna
mSr
i Lan
kaN
icar
agua
Phili
ppin
esEl
Sal
vado
rPa
ragu
ayBo
livia
Guat
emal
aHo
ndur
as
Average level: 2005-2010
-20
-15
-10
-5
0
5
10
15
Egyp
tJo
rdan
Yem
enTu
nisia Ira
nM
oroc
coIs
rael
Paki
stan
Indi
aIn
done
siaVi
etna
mSr
i Lan
kaN
icar
agua
Phili
ppin
esEl
Sal
vado
rPa
ragu
ayBo
livia
Guat
emal
aHo
ndur
as
Evolution: 1990-2010
4

poverty, Egypt is doing worse than the rest of MENA (Except Morocco and Yemen) and
many other comparator countries.
Figure 2: Poverty headcount ratio (PPP, % of population) level and evolution
Source: World Development Indicators
0
10
20
30
40
50
60
70
80
Jord
anIs
rael
Tuni
sia Iran
Egyp
tM
oroc
coYe
men
El S
alva
dor
Nic
arag
uaPa
ragu
aySr
i Lan
kaGu
atem
ala
Boliv
iaHo
ndur
asVi
etna
mPh
ilipp
ines
Paki
stan
Indo
nesia
Indi
a
Average Level ($1.25 a day): 2005-2010
0
10
20
30
40
50
60
70
80
Jord
anIs
rael
Tuni
sia Iran
Egyp
tM
oroc
coYe
men
El S
alva
dor
Nic
arag
uaPa
ragu
aySr
i Lan
kaGu
atem
ala
Boliv
iaHo
ndur
asVi
etna
mPh
ilipp
ines
Paki
stan
Indo
nesia
Indi
a
Average Level ($2 a day): 2005-2010
-50
-40
-30
-20
-10
0
10
20
Jord
anIs
rael
Tuni
sia Iran
Egyp
tM
oroc
coYe
men
El S
alva
dor
Nic
arag
uaPa
ragu
aySr
i Lan
kaGu
atem
ala
Boliv
iaHo
ndur
asVi
etna
mPh
ilipp
ines
Paki
stan
Indo
nesia
Indi
a
Evolution ($1.25 a day): 1990-2010
-50
-40
-30
-20
-10
0
10
20
Jord
anIs
rael
Tuni
sia Iran
Egyp
tM
oroc
coYe
men
El S
alva
dor
Nic
arag
uaPa
ragu
aySr
i Lan
kaGu
atem
ala
Boliv
iaHo
ndur
asVi
etna
mPh
ilipp
ines
Paki
stan
Indo
nesia
Indi
a
Evolution ($2 a day): 1990-2010
5

3. Growth, poverty and inequality As explained in the introduction, growth is one mechanism which can reduce inequality and
poverty. Dollar and Kraay (2002), among others, have shown that macroeconomic growth
translates 1 for 1 in poor’s income growth. While these findings seem robust to different
concepts of poverty, a set of other factors can inhibit such beneficial effects. Lopez (2004),
examining the impact of various policies on inequality, found that improvements in education
and infrastructure could lead to reducing income inequality while financial development,
trade openness and decreases in the size of the government might have the reverse effect i.e.
increase inequality. The calculations suggest that, at least in the short run, the negative impact
of these policies might offset the positive impact on inequality. However, the relationships are
complex and heterogeneous across countries and studies of this issue pertaining to Arab
countries are of a limited number.
In this section, we start with a casual examination of the evolution of inequality, poverty and
growth in Egypt and a set of similar countries before presenting the findings of the literature
pertaining to Egypt.
3.1 Statistical analysis
Figure 3 suggests that 4 countries are doing better than in Egypt in terms of the relationship
between growth and inequality. These are Jordan (MENA) and Nicaragua, El Salvador and
Pakistan which achieved more reduction in Gini between 1990 and 2010 with lower growth
rate than Egypt over the same period. The rest of the countries performed lesser than Egypt.
In particular, Vietnam, Morocco, India and Sri Lanka exhibit higher growth rate than Egypt
but increased inequality over the same period.
6

Figure 3: Growth and inequality
Source: World Development Indicators
Figure 4 focuses on the relation between growth and poverty using the same indicators and
time period as before. The reduction of extreme poverty (threshold of US$ 1.25) in Egypt
appears insufficient in comparison to other countries. In the MENA, Jordan is doing slightly
better: more reduction in extreme poverty with a lower growth rate. Outside the Region,
Pakistan, Nicaragua, Honduras and Philippines are doing much better than Egypt. Extreme
poverty has declined markedly in these countries while their growth rates were far below the
one of Egypt. Almost the same picture emerges when looking at poverty (threshold of US$
1.25): many countries did much better than Egypt.
-20
-15
-10
-5
0
5
10
15
GINI Evolution 1990-2010 GDP per capita, PPP (constant 2011 international $) Average growth 1990-2010
7
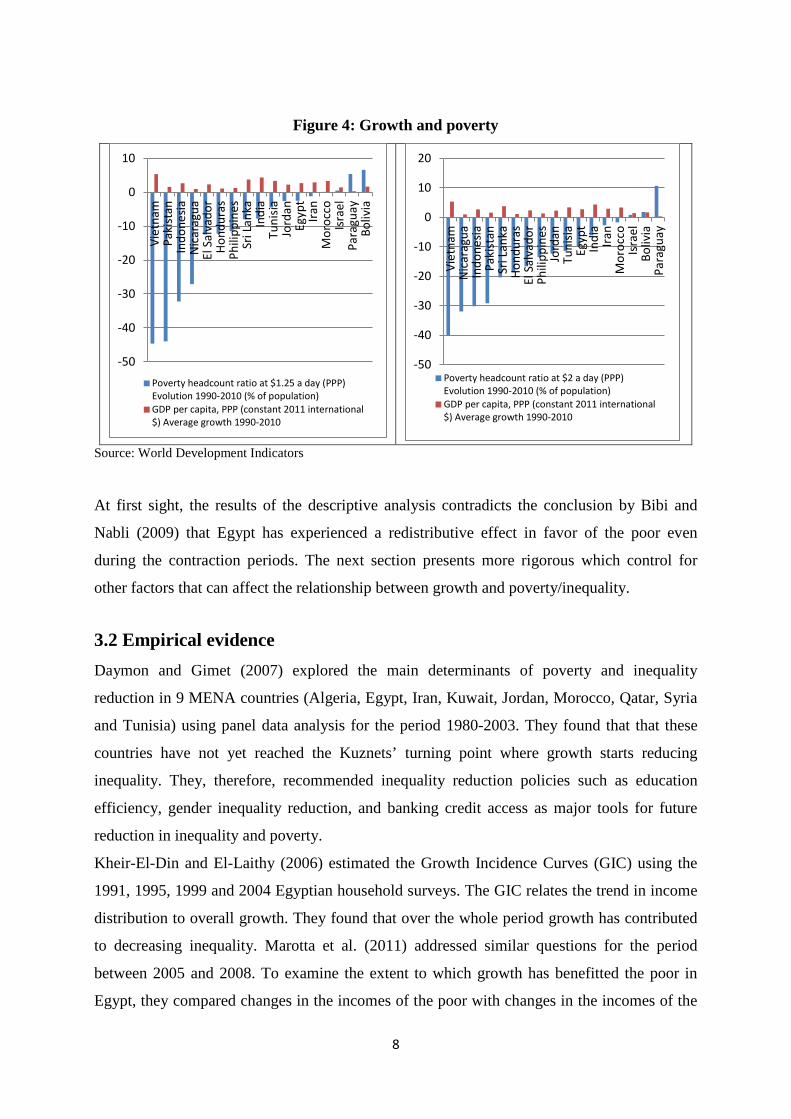
Figure 4: Growth and poverty
Source: World Development Indicators
At first sight, the results of the descriptive analysis contradicts the conclusion by Bibi and
Nabli (2009) that Egypt has experienced a redistributive effect in favor of the poor even
during the contraction periods. The next section presents more rigorous which control for
other factors that can affect the relationship between growth and poverty/inequality.
3.2 Empirical evidence Daymon and Gimet (2007) explored the main determinants of poverty and inequality
reduction in 9 MENA countries (Algeria, Egypt, Iran, Kuwait, Jordan, Morocco, Qatar, Syria
and Tunisia) using panel data analysis for the period 1980-2003. They found that that these
countries have not yet reached the Kuznets’ turning point where growth starts reducing
inequality. They, therefore, recommended inequality reduction policies such as education
efficiency, gender inequality reduction, and banking credit access as major tools for future
reduction in inequality and poverty.
Kheir-El-Din and El-Laithy (2006) estimated the Growth Incidence Curves (GIC) using the
1991, 1995, 1999 and 2004 Egyptian household surveys. The GIC relates the trend in income
distribution to overall growth. They found that over the whole period growth has contributed
to decreasing inequality. Marotta et al. (2011) addressed similar questions for the period
between 2005 and 2008. To examine the extent to which growth has benefitted the poor in
Egypt, they compared changes in the incomes of the poor with changes in the incomes of the
-50
-40
-30
-20
-10
0
10Vi
etna
mPa
kist
anIn
done
siaN
icar
agua
El S
alva
dor
Hond
uras
Phili
ppin
esSr
i Lan
kaIn
dia
Tuni
siaJo
rdan
Egyp
tIra
nM
oroc
coIs
rael
Para
guay
Boliv
iaPoverty headcount ratio at $1.25 a day (PPP)Evolution 1990-2010 (% of population)GDP per capita, PPP (constant 2011 international$) Average growth 1990-2010
-50
-40
-30
-20
-10
0
10
20
Viet
nam
Nic
arag
uaIn
done
siaPa
kist
anSr
i Lan
kaHo
ndur
asEl
Sal
vado
rPh
ilipp
ines
Jord
anTu
nisia
Egyp
tIn
dia
Iran
Mor
occo
Isra
elBo
livia
Para
guay
Poverty headcount ratio at $2 a day (PPP)Evolution 1990-2010 (% of population)GDP per capita, PPP (constant 2011 international$) Average growth 1990-2010
8

non-poor. Hence, growth is said pro-poor when the distributional changes accompanying
growth favor the poor. The results suggest that Egypt achieved impressive poverty reduction
between 2005 and 2008, thanks to rapid economic growth. For instance, the welfare of an
average person who was poor in 2005 increased by almost 10 percent per year between 2005
and 2008; this was sufficient to move this household out of poverty. However, the rich gained
more than the poor, especially in rural areas. Moreover, growth also exposed some non-poor
to negative dynamics, making them poor. As a result, inequality also increased during the
period attenuating the impact of growth on poverty reduction. Overall, over the period 2005-
2008 only 45 percent of the population in Egypt remained out of poverty. This implies that 55
percent of Egyptians experienced poverty or near-poverty during the same period. Over time,
however, the poverty and near-poverty rates fell from 46 percent to 36 percent.
5. Public employment, poverty and inequality The public sector has traditionally played an important role in Arab countries. It employs
between 14 and 40 percent of all workers (Figure 5). Egypt stands at an average level in
comparison to MENA countries but it stands at a much higher level in comparison to
countries such as Indonesia, Turkey, Mexico and Brazil. The employment conditions are, in
general, more favorable to workers (e.g. job safety, social security, wages etc.) in the public
than in the private sector which explains the preference of many workers for public jobs.
Figure 5: Average (2000s) employment shares in the public sector
Source: World Bank (2013)
Adams (2002) used national household survey data from Egypt and Jordan to examine the
impact of different sources of income - including nonfarm income- on rural income
9

inequality. He found that the poor in both countries are dependent on one particular source of
nonfarm income: government employment. In Egypt, the poor receive 43 percent of their
nonfarm income from government wages, while in Jordan the poor receive 60 percent of their
nonfarm income from this source. As a result, government employment represents an
inequality-decreasing source of income in both countries.
Adams and Page (2003) used cross country data and country-case studies to analyze trends in
poverty, inequality and economic growth in the MENA region. They showed that both
international remittances and government employment have a negative and statistically
significant impact upon both the level and the depth of poverty in the region. On average, a 10
percentage point increase in the share of remittances in GDP would reduce the poverty
headcount ($1.00 per person per day) by 5.7% in the MENA region while a 10 percentage
point increase in the share of government employment in total employment would reduce the
poverty headcount by 6.2%. Cross regions comparison also suggest that while public
employment does not have a statistically significant impact on poverty in the developing
countries as a whole, it reduces the incidence and the deficit of poverty in the MENA region
(Bibi and Nabli, 2009).
5 Redistribution policies, poverty and inequality 5.1 Description To provide protection to vulnerable population, many governments rely on social
redistribution policies such as social safety net interventions, price subsidies, and social
insurance schemes. Social safety nets (SSN) include cash or near-cash transfers (e.g., food
stamps), in-kind transfers (e.g., school feeding, mother/child complements, take-home food
rations), and fee waivers for essential services (e.g., schooling, health care, utilities, and
transportation). These programs are noncontributory in contrast to social insurance which
involves benefits that are based on prior contributions (e.g., unemployment insurance and old
age or disability pensions).
Many governments in the MENA tended to rely on a redistribution system based on universal
subsidies of basic consumption items. This guaranteed affordable access to food and fuel for
all citizens, irrespective of their needs. As a result, the region lags behind other regions in the
efficient use of SSN resources (Silva et al. 2013). In particular, MENA countries spend, on
average, 5.7 percent of GDP on subsidies, as opposed to 1.3 percent of GDP in the average
benchmark developing country (see Figure 6). In Egypt, subsidies represent almost the entire
10

amount of SSN. Moreover, with the exception of Iraq, MENA countries spend much more on
the more distorting and pro-rich fuel subsidies (4.5 percent of GDP Egypt) than on food
subsidies and ration cards (1.1 percent of GDP) as shown in Figure 7. In terms of non-
subsidies spending, most MENA countries, including Egypt, concentrate on cash transfer
programs (see Table 1).
Figure 6: SSN Spending with and without Subsidies, 2008–11
Source : (Silva et al. 2013)
Figure 7: Food and Fuel Subsidies, 2008–2011
Source : (Silva et al. 2013)
11

Table 1: Share (%) of Non-subsidy SSN Spending by Economy and Program Type. 2008–2011
Source : (Silva et al. 2013) Note : “—” (not available); “n.a.” (not applicable); “..” (negligible); or “0” (zero).
5.2 Impact
As a first assessment of the impact of SSN, Figure 8 presents the number of beneficiaries in
SSN programs as shares of the selected countries’ total populations. The Figure shows that
MENA countries vary widely in their SSN coverage. In some countries (such as Egypt, Iraq,
Kuwait, and Syria), nationwide coverage is quite low, while coverage in Yemen is extensive.
Coverage by cash transfers is the highest in Bahrain and Yemen. In Lebanon, hospital fee
waivers reach a large share of the population.
Figure 8: Nationwide Coverage of Non-subsidy SSNs, by Program Type, 2008–11
Source: (Silva et al. 2013). Note: SSN = social safety net. Each program’s coverage is added independently of others; this calculation assumes no overlap between SSN programs and thus represents the upper-bound estimate of SSN coverage.
12
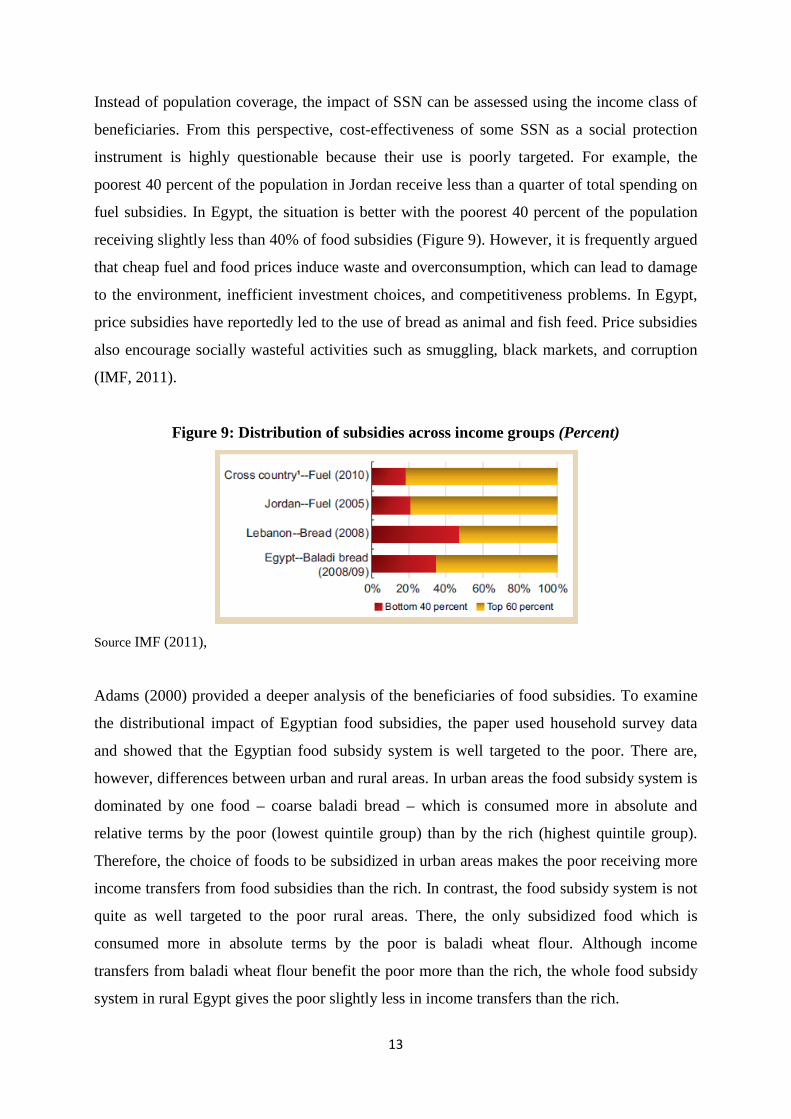
Instead of population coverage, the impact of SSN can be assessed using the income class of
beneficiaries. From this perspective, cost-effectiveness of some SSN as a social protection
instrument is highly questionable because their use is poorly targeted. For example, the
poorest 40 percent of the population in Jordan receive less than a quarter of total spending on
fuel subsidies. In Egypt, the situation is better with the poorest 40 percent of the population
receiving slightly less than 40% of food subsidies (Figure 9). However, it is frequently argued
that cheap fuel and food prices induce waste and overconsumption, which can lead to damage
to the environment, inefficient investment choices, and competitiveness problems. In Egypt,
price subsidies have reportedly led to the use of bread as animal and fish feed. Price subsidies
also encourage socially wasteful activities such as smuggling, black markets, and corruption
(IMF, 2011).
Figure 9: Distribution of subsidies across income groups (Percent)
Source IMF (2011),
Adams (2000) provided a deeper analysis of the beneficiaries of food subsidies. To examine
the distributional impact of Egyptian food subsidies, the paper used household survey data
and showed that the Egyptian food subsidy system is well targeted to the poor. There are,
however, differences between urban and rural areas. In urban areas the food subsidy system is
dominated by one food – coarse baladi bread – which is consumed more in absolute and
relative terms by the poor (lowest quintile group) than by the rich (highest quintile group).
Therefore, the choice of foods to be subsidized in urban areas makes the poor receiving more
income transfers from food subsidies than the rich. In contrast, the food subsidy system is not
quite as well targeted to the poor rural areas. There, the only subsidized food which is
consumed more in absolute terms by the poor is baladi wheat flour. Although income
transfers from baladi wheat flour benefit the poor more than the rich, the whole food subsidy
system in rural Egypt gives the poor slightly less in income transfers than the rich.
13

Given the financial burden of the subsidy programs and the issue of targeting, Egypt has
introduced at different instances changes to the basket of subsidized goods. Audet et al.
(2007), utilized consumption dominance curves to analyze the impacts on poverty brought by
the changes in the food subsidy system in Egypt using the Integrated Household Survey
(EIHS) of 1997. The analysis focused on the spending structure of Egyptian households to
better understand whether these reforms were an adequate tool for fighting poverty. At the
time of the survey, sugar, cooking oil, wheat and bread were subsidized and the reform
consisted in subsidizing sugar, cooking oil, macaroni, lentils and beans.
The results suggest that the reform has not been well founded in all cases. First, it would have
been appropriate to tax macaroni and increase subsidies on bread. Increase of the tax on
macaroni would have allowed an increased subsidy on bread. This would have induced a
reduction of all poverty indices. Therefore, this modification to the list of subsidized food
goods was not desirable even if the efficiency cost of taxing macaroni is 23% larger than that
of bread.
Second, it would have been appropriate to tax beans to subsidize tamwin bread. An increase
of taxes on beans would have allowed an increase in subsidy of tamwin bread and reduced
poverty for all indices. This change in the list of subsidized food goods is once again not a
desirable choice even if the efficiency cost of taxing “kid” beans (respectively other beans) is
62% (respectively 188%) superior to that of taxing tamwin bread.
Finally, the results also suggested that it would have been more appropriate to tax flour to
increase subsidies on lentils. Here, in contrast, replacing tamwin flour with lentils in the list of
subsidized food goods was a desirable decision from a poverty reduction perspective. Overall,
it seems that the changes brought to the list of subsidized food goods have not always been
relevant as a tool for fighting poverty.
Laabas and Limam (2004) compared several components of public policies and their impact
on poverty in seven Arab countries (Algeria, Morocco, Tunisia, Jordan, Yemen, Mauritania
and Egypt. The paper used a framework that accounts for the endogeneity of and interactions
between growth, income inequality, and poverty using different definitions of poverty and
alternative estimation methods. Several interesting results emerged. First, public policies
affect poverty only indirectly through their impact on income distribution. Second, policies
aimed at improving income distribution are more effective in affecting poverty than policies
targeted to improving mean consumption and growth. Third, government expenditures,
transfers and monetary policy aimed at reducing inflation have a positive impact on the extent
of poverty. In contrast, openness, although a pro-growth policy, has a negative impact on
14
income distribution and poverty. Fourth, among the social spending policies, transfers seem to
be more effective in affecting income distribution and poverty. Finally, policies targeted
toward basic necessity products such as cereals, have a larger impact on poverty and income
distribution than aggregate public policies. The authors concluded that given the conflicting
impact of public policies on growth, poverty and income distribution, care has to be taken to
choose the right mix of policies achieving positive results.
6. Globalization The ongoing process of globalization has created fears both in developed and developing
countries regarding its impact on poverty and inequality. However, empirical evidence
pertaining specifically to the relation between trade and labor market inequalities suggest that
trade is not the main cause of labor market problems (being wage gaps or unemployment)
neither in developed (Dewatripont et al. 1999) nor in developing countries (Lee and Vivarelli,
2005). The main problem is not trade per se but the ability of the economy (both workers and
firms) to adapt to openness shocks through training, technological upgrading and products and
markets reorientation. Moreover, the impact of trade liberalization on the labor market is
largely context-specific and tends to vary from one country to another.
As discussed above, one important factor in reducing poverty is growth. While the impact of
trade on world welfare is well established, its impact on a country’s growth has been disputed.
Levine and Renelt (1992), Edwards (1992) and Dollar (1992) found that trade liberalization
improves growth performance. Subsequently, Rodriguez and Rodrik (1999) questioned the
robustness of the positive impact of openness on growth. However, the majority of the other
cross-country evidence (see Berg and Krueger (2003) for a survey) strongly support that
openness causes higher incomes although the intensity of the effect depends on the type of
traded goods (Hausmann et al., 2007). When openness causes higher income, trade should
also increase poor’s income as Dollar and Kraay (2002), among others, have shown.
However, as explained above, a set of other factors can inhibit such beneficial effects.
In the rest of this section we will first examine the relationship between globalization and
growth which will indirectly affect poverty. Afterwards, we will discuss possible direct
effects of globalization on poverty.
A first study (Makdissi et al., 2006) has analyzed the main determinants and specificities of
the growth experience in Arab countries in comparison to the rest of the world. The authors
used two complementary approaches. The first known as “growth accounting” seeks to
15

disentangle the relative contribution of physical capital, labor and Total Factor Productivity
(TFP) to growth. The approach showed that, in comparison with other regions, TFP was not
an important source of growth in the Region meaning that growth relied mainly on the
accumulated stock of physical capital and on labor and not on their use in an efficient way.
Among the Arab countries, only Egypt, Morocco and Tunisia, which are the most open
economies among Arabs, had positive contribution of TFP to growth. The second approach,
associated with Barro, focuses mainly on the driver of TFP and is motivated by the findings
that, around the World, TFP is the main determinants of growth. Makdissi et al. (2006)
considered different determinants such as the efficient use of physical and human capital,
trade openness, quality of institutions, exports diversification and international
competitiveness. They found that openness is less beneficial to growth. The latter is due to the
fact that exports lack diversification and has low international competitiveness in Arab
countries.
The data used in Makdissi et al. (2006) cover the period 1960-1997. Since the late 1990s,
however, a number of reforms has been implemented in the concerned countries and might
have changed the situation. The analysis by Hassan et al. (2011) focused on a more recent
period (1980-2007) when openness has progressed well in some Arab countries like Egypt.
They found that in the Region trade was an important driver of growth and its estimated
impact became even higher than in a number of other regions. Moreover, trade seemed to
explain a higher proportion of growth than financial development and it Granger causes
growth. The authors concluded that trading is a critical variable in the region and that efforts
to reform and deepen the financial system would prove fruitful only if accompanied by
policies that provide an incentive to develop trade are set up.
Turning to poverty, Bibi and Nabli (2010) offered a comprehensive review of the findings
regarding the impact of trade in Arab countries. Regarding Egypt, Zaki (2011) focused on the
nexus between trade, gender and employment. He found that, at the macroeconomic level,
exports have a significant and positive effect on employment over the period 1960 to 2009.
Following the reforms that were launched in the 1990s and resumed in 2004, the effect of
exports on employment increased. At the individual level, exports affect men’s wages and
female’s probability of working. In other words, the adjustment on female labor market is
done through quantities and the one on male labor market is done through prices.
Said and Elshennawy (2010) investigated the impact of trade liberalization on manufacturing
employment and wages over the period 1993-2006 which coincides with significant reduction
in trade barriers and rising unemployment in Egypt. The econometric analysis showed that
16

unemployment has increased across all manufacturing industries and not only in those
industries most exposed to trade. Layoffs related to trade liberalization don’t explain a
significant share of unemployment. Moreover, the reduction in tariffs and the increasing
export orientation has been associated with an increase in wages in manufacturing industries.
However, the reduction in tariffs and the increase in export orientation have different impacts
across the quintiles of the wage distribution. Reduction of trade barriers has induced
unemployment or low pay of old age and low educational attainment work force.
Acar and Dogruel (2012) examined the sources of manufacturing pay inequality in Algeria,
Egypt, Iran, Jordan, Morocco and Turkey for the period 1980–1997. The findings show that
openness has a pay inequality-decreasing effect. However, it is the share of imports, not of
exports, that helps mitigating inequality.
7. Conclusion Poverty and inequality reduction are essential components of development. Beside economic
development, poverty and inequality reduction are central to the construction of socially
inclusive states and the realization of a strong climate of citizenship. This chapter focused on
the issues of poverty and inequality in Egypt. It presented an assessment of the extent of the
two phenomena and the role of various policies in them. These policies include pro-growth
measures, public employment, social transfer and subsidies and openness to trade.
The assessment showed that inequality in Egypt used to be and remains low in comparison to
countries in the Region and outside the Region. However, Egypt shows almost no change
between 1990 and 2010 regarding inequality. Extreme poverty is very low in Egypt and even
lower than in all other comparator countries. In general, extreme poverty has declined
between 1990 and 2010. In terms of poverty, Egypt does worse than the rest of MENA
(Except Morocco and Yemen) and many other comparator countries. In term of evolution,
poverty in Egypt has been reduced similarly as in other MENA countries but much lesser than
in other countries.
Among the policies targeting poverty reduction, those aiming at fostering growth play an
important role. In Egypt growth seems to have contributed to the reduction of poverty and
inequality. However, the performance seems insufficient in comparison to similar countries.
Another policy concerns public sector employment. The latter seems to have reduced poverty
in Egypt. However, this was at the costs of having a large public sector which cannot be
sustainable. The size of public sector in Egypt stands at an average level in comparison to
17

MENA countries but it stands at a much higher level than comparator countries such as
Indonesia, Turkey, Mexico and Brazil. Egypt also relied on social redistribution policies such
as social safety net (SSN) interventions, price subsidies, and social insurance schemes to fight
poverty. The country spends around 7% of its GDP in such policies which is much higher
than in the average benchmark developing country. Subsidies represent almost the entire
amount of SSN in Egypt. Non-subsidies spending concentrate on cash transfer programs. In
term of targeting such policies toward the poor, Egypt performs better than many countries in
the Region with the poorest 40 percent of the population receiving slightly less than 40% of
food subsidies. However, it is frequently argued that cheap fuel and food prices induce waste
and overconsumption, which can lead to damage to the environment, inefficient investment
choices, and competitiveness problems. Moreover, there are differences between urban and
rural areas. The whole subsidy system in rural Egypt gives the poor slightly less in income
transfers than the rich. Egypt has introduced at different instances changes to the basket of
subsidized goods but the evidence suggests that the reform has not been well founded in all
cases. Finally, the ongoing process of globalization, which has created fears both in developed
and developing countries regarding its impact on poverty and inequality, seems to have
contributed to poverty and inequality reduction through its effect on growth. Recent evidence
suggests that openness was an important driver of growth and its estimated impact is even
higher than in a number of other regions. There are however, differences across population
classes. Reduction of trade barriers has induced unemployment or low pay of old age and low
educational attainment work force.
18
References Adams Jr, R. H. (2002), "Nonfarm Income, Inequality, and Land in Rural Egypt" Economic Development and Cultural Change, 50:2, pp. 339-363.
Adams, Jr, R. H. (2000), "Self‐Targeted Subsidies: The Political and Distributional Impact of the Egyptian Food Subsidy System", Economic Development and Cultural Change, 49:1, pp. 115-136.
Adams, R. H., and J. Page (2003), "Poverty, inequality and growth in selected Middle East and North Africa countries, 1980–2000" World Development, 31:12, pp. 2027-2048.
Audet, M., D. Boccanfuso and P. Makdissi (2007), “Food Subsidies and Poverty in Egypt: Analysis of Program Reform using Stochastic Dominance”, Journal of Development and Economic Policies, 9:2, pp. 57-79.
Belkacem L. and I. Limam (2004), "Impact of public policies on poverty, income distribution and growth", Arab Planning Institute, Kuwait.
Berg, A. and A. O. Krueger (2003), “Trade, Growth, and Poverty: A Selective Survey, IMF Working Paper No. 03/30
Bibi, S. and M. K. Nabli (2009), "Income inequality in the Arab region: Data and measurement, patterns and trends", Middle East Development Journal, 1:02, pp. 275-314.
Daymon, C. and C. Gimet (2007), "Les déterminants de l'inégalité et le rôle de l'équité dans les pays du Moyen-Orient et de l'Afrique du Nord", Région et Développement, 25, pp 1-11.
Dewatripont M. , A. Sapir and Kh. Sekkat (1999), Trade and Jobs in Europe: Much Ado about Nothing, Oxford University Press, Oxford.
Dollar, D. (1992), “Outward-Oriented Developing Countries Really Do Grow More Rapidly: Evidence from 95 LDCs, 1976-85”, Economic Development and Cultural Change, pp. 523-544
Dollar, D. and A. Kraay (2001), Trade, Growth and Poverty, World Bank Research Department Working Paper no 2615, World Bank Washington, D.C.
Edwards S. (1992), Trade orientation, distortions and growth in developing countries, Journal of Development Economics, 39, pp. 31-57.
Hassan, M. K. , B. Sanchez and, J.-S. Yu (2011), Financial development and economic growth: New evidence from panel data, The Quarterly Review of Economics and Finance, 51, pp. 88–104
Hausmann, R, J. Hwang, and D. Rodrik, (2007) “What you export matters”, Journal of Economic Growth, 12:1, pp.1-25.
International Monetary Fund, IMF (2011), Regional economic outlook, Middle East and Central Asia, Washington, D.C.
Kheir-El-Din, H. and H. El-Laithy (2006), "An Assessment of Growth, Distribution, and Poverty in Egypt: 1990/91-2004/05", The Egyptian Centre for Economic Studies (ECES), Cairo
19
Lee, E. and Vivarelli M. (2005) (Eds) Understanding Globalization, Employment and Poverty Reduction (New York: Palgrave Macmillan).
Levine, R., and D. Renelt (1992), “A Sensitivity Analysis of Cross-Country Growth Regressions”, American Economic Review, 82:4, pp. 942-963.
Makdisi, S., Fattah, Z., and Limam, I. (2006). Determinants of Growth in the MENA Countries. Contributions to Economic Analysis, North Holland, pp. 31-60.
Marotta, D., Yemtsov, R., El-Laithy, H., Abou-Ali, H., and Al-Shawarby, S. (2011), “Was growth in Egypt between 2005 and 2008 pro-poor? From Static to Dynamic Poverty Profile”, World Bank Policy Research Working Paper Series.
Rodríguez, F. and D. Rodrik (2001), “Trade Policy and Economic Growth: A Skeptic’s Guide to the Cross-national Evidence”, in B. Bernanke and K. S. Rogoff (eds.), Macroeconomics Annual 2000 (MIT Press for NBER, Cambridge, MA).
Silva, J., V. Levin, and M. Morgandi (2013), “Inclusion and resilience: the way forward for social safety nets in the Middle East and North Africa”, World Bank Publications.
United Nations Research Institute for Social Development (UNRISD) (2010), “Combating poverty and inequality: structural change, social policy and politics”, Geneva, Switzerland
World Bank (2013), “Jobs for Shared Prosperity: Time for Action in the Middle East and North Africa”, World Bank, Washington D.C.
20
Chapter 2 Education, Vocational Training and the Labor Market
1. Introduction The role of human capital as a major driver of economic development is, now, recognized
both in theoretical and empirical literatures. Better education and health services enhance
productivity and earnings of the workers which translates in higher economic growth.
Moreover, human capital formation can contribute to poverty alleviation and the reduction of
inequalities. Increase in the level of education increases the lifetime earnings of an individual.
Recent evidence confirms such highly significant human capital effect: higher average years
of education are negatively associated with income inequality (see e.g. Lustig et al., 2013 and
Huber and Stephens, 2014).
Egypt is the most populous country in the Arab world with a population exceeding 80 million.
More than half of the population is younger than 24 years old. The size of the population
currently in initial education and training is estimated at more than 18 million. Moreover, an
estimated 600 000 Egyptians enter the workforce every year. Although the percentage
completing a higher education degree has increased, the skills and knowledge gained from
initial education and training are often poorly aligned with the needs of the labor market. This
is evidenced by the high level of unemployment among the youth, especially secondary
school graduates and university graduates. High levels of unemployment are coupled with
evidence of job vacancies, which shows the mismatch between the demand and the supply of
skills produced by the educational and training system.
The Egyptian labor market is heterogeneous in various respects. The first one relates to the
distinction between public sector and private sector employment. Employment in the private
sector is, in turn, divided into two further segments, salaried employees and the self-
employed. Finally, there is a distinction between formal and informal sector employment.
While formal employment is dominant in the public sector, informal employment in the
private sector is estimated at 70% (Assaad, 2009).
These characteristics reinforce the role of human capital as an entry point for improving the
growth, poverty and inequality problems in Egypt. This chapter focuses on the Egyptian
education system and its achievements. Section 2 presents the educational system with special
emphasizes on higher education and vocational training. Section 3 offers a statistical analysis
of the country’s achievement in term of unemployment, education and vocational training.
21
Section 4 deals with the issue of skill mismatch while Section 5 discusses the supply of
training by firms. The conclusion is in Section 6.
2. Educational system 2.1 General background1 The Egyptian constitution states that that literacy is a national responsibility. Education is
recognized as a basic right of each citizen and is guaranteed by the State. The current
Egyptian education system consists of a number of levels comprising public (governmental)
and private sectors. However, even the private educational sector is supervised by the
government in order to ensure its compliance with the State’s educational policy.
In terms of financing, the public education system in Egypt is free and open to the masses.
The Ministry of Finance (MoF) is responsible for the overall finance policy and for
determining the budget allocations. However, the public funding mechanism does not take
into consideration the efficiency of institutions and there are no mechanisms to measure
performances. There is also no direct connection between the allocation received by each
institution and its actual needs. Finally, the development and improvement of the schooling
system are also supported financially by a range of international institutions such as the World
Bank, UNESCO, UNICEF, Ford Foundation and USAID.
The Egyptian government is in charge of the formulation of policy, organization,
administration and supervision pertaining to education. The authority over the education
system is shared by various levels of central and local authorities. Most of the legislative
entitlements lie with the President and the People’s Assembly but subordinated to
constitutional directives. The execution and general administration for nearly the whole
system of education is the responsibility of Ministry of Education. Higher education is under
the supervision of the Ministry of Higher Education and Scientific Research. At the local
levels, the implementation of educational policy is the duty of the relevant bodies of
governorates, cities and villages.
All schools are managed by their specific structure and each university, college and other
higher education institute is governed by its own deputies. Their representatives constitute
Councils in charge of collaboration within the academic society and with the Minister of
Higher Education. Important topics and projects are further discussed during national
conferences dedicated to selected problems and particular areas of education.
1 This section draws on Stopikowska and El-Deabes (2012).
22

According to the Egyptian constitution, basic education is compulsory. It lasts 9 years and
covers 2 cycles: 6 years primary stage and 3 years preparatory stage. The latter can offer
general or vocational programs. Secondary education (general, middle-level technical and
vocational) lasts 3 or 5 years (high-level technical education). Secondary schools leavers can
join freely post-secondary but not tertiary educational institutions. Education at the middle
technical institutes lasts for 2 years and at the higher technical institutes 4-5 years. The
students leaving higher technical institutes are awarded diplomas of advanced technical
education.
To apply to universities, secondary school leavers must hold appropriate certificates or
diplomas with the highest score. The first-stage of higher education at the university lasts 4-6
years while at the next stage takes 2-5 years. After receiving an MA degree a graduate can
apply for a doctorate after at least 2-year studies.
Education at all levels is provided by both public and private institutions. The latter can be
religious (run by Muslims or Christians) or non-religious private institutions, Egyptian or
foreign. However, like public institutions, private institutions are under the supervision of the
government.
International schools can offer a curriculum of another country (e.g. British, American) but
they need to be certified by the Ministry to allow their graduates to enroll in Egyptian
governmental universities. Graduates of each level of private education receive equal
certificates and qualifications as graduates of governmental institutions.
The Azharite system takes an important position in the Egyptian education system. It has the
same curriculum as public education but with more attention to Islamic studies. Azharite
graduates can continue academic studies at Al-Azhar or any other private educational
institution but their number is limited for governmental colleges and institutes. The Azharite
system is an independent network of schools subordinate to the Al-Azhar University, under
the supervision of the Supreme Council of Al-Azhar (headed by Grand Sheikh) which
cooperates directly with the Prime Minister.
There are also other educational services at different levels offered to specific categories of
students. The “kuttab” is the traditional Islamic school which provides the society with both
religious instruction, memorizing fragments of Quran and basic reading and writing skills. It
plays a supplementary role for education even in contemporary times. However, the number
of “kuttab” is decreasing noticeably. Other classes or schools are tailored to the needs of the
blind and partially-sighted, the deaf and auditory impaired or with other disabilities: the
mentally retarded and the rheumatic heart diseased. Attention is also paid to talented children
23

with the aim of preparing scientific elite for the development of the Egyptian science. Finally,
there is adult education targeting the increase of literacy among the Egyptian society and the
eradication of illiteracy.
2.2 Higher Education2 Higher education in Egypt is provided by universities and by higher institutes, both technical
and non-technical. Together, technical and non-technical higher institutes (both private and
public) represent a significant proportion of student. They enroll about 20% of students in the
tertiary education system.
The governance of the Egyptian higher education is highly centralized. The hierarchy starts
from the President of the country who appoints heads of all principal entities. The Ministry of
Higher Education (MoHE) has jurisdiction over all higher education institutions (either public
or private) and is responsible for planning, formulating policies and controlling quality. The
admissions process for students entering the higher education system is under the
responsibility of the Central Placement Office while the distribution of students among public
universities is the task of the MoHE. Three supreme councils operate under the MoHE and
supervise all higher education institutions. These are the Supreme Council of Universities
(SCU), which governs all public universities, the Supreme Council for Private Universities
(SCPU), which governs all private universities and the Supreme Council for Technical
Colleges (SCTC), which governs all technical colleges.
The National Authority for Quality Assurance and Accreditation of Education (NAQAAE),
established in 2006, serves as an independent accrediting body for all types and levels of
education in Egypt (higher education, pre-university, technical and vocational education and
training). Its tasks are to foster quality assurance measures, prepare institutions accreditation,
and grant accreditation.
In public universities, the University Council is responsible for management. It is composed
of senior faculty members, deans of faculties, the President of the University, vice- presidents
and public figures with a strong educational background. Departments and faculties are self-
managed and rely on votes and departmental meetings for decisions on major issues. There is
also a parallel body, the professors club, which is responsible for airing grievances of faculty.
The club is normally run by an elected board and acts as a trade union. University presidents
2 This section draws on Barsoum (2014)
24
had the right to appoint deans but after the 2012 revolution, the election of deans was
reinstated.
Except for the American University in Cairo founded in 1919 as a private non-profit
American institution, all Egyptian universities were exclusively public until the early 1990s.
In 1992, a law was passed to authorize and regulate the establishment of private universities.
Following the promulgation of the law, four new universities opened their doors in 1996,
followed by five institutions in 2000 and six universities in 2006. Private institutions need
NAQAAE accreditation to start and continue operation.
The legal framework for private higher education institutions in Egypt does not make a clear
distinction between for-profit and not-for-profit institutions. Private higher education
institutions in Egypt rely on student fees to pay for operating expenditures. The fees structure
is highly diverse e.g. higher institutes can charge LE 3,000 per year while foreign private
universities could reach LE 100,000 per year.
2.3 Vocational training3 Vocational education and training (VET) refers to the educational process involving, in
addition to general education, the study of technologies and related sciences, and the
acquisition of practical skills, attitudes, understanding and knowledge relating to occupations
in various sectors of economic and social life (Source: UNESCO Revised Recommendation,
2001). The term technical and vocational education and training (TVET) is used as an
equivalent term for VET in many countries
Vocational education and training are frequently perceived as a way to improve the youths’
opportunities, especially those who lack the resources, skills or motivation to continue with
higher education, on the labor market. The aim is to improve their chances of a successful
professional career by aligning the initial education more closely to particular vocations and
tasks demanded in the labor market. It is also thought to reduce the problem of mismatch
which is often seen as a main source of the high degree of unemployment in developing
countries.
Like many MENA countries, in Egypt the coordination of a common VET strategy proves
difficult despite the involvement of private sector and social partners. Consequently, the
linkage between skills provided by the VET system and those demanded by the private sector
is weak. A project initiated by the European Training Foundation about the monitoring of
VET in Mediterranean countries (including Egypt) noted weaknesses with respect to the
3 This section draws on Eichhorst et al. (2012)
25

evaluation practice. Monitoring and evaluation predominantly focused on input indicators
(teachers, facilities, curricula) rather than the success of the VET in achieving training
objectives. Furthermore, when performance-based indicators were used, they did not seem to
be adequately exploited to re-assess and improve the current system.
As discussed above, compulsory education is made up of a primary and a preparatory level.
The primary stage takes six years, while the preparatory level runs for three years. Pupils who
pass the final exam at the end of primary school move to preparatory schools while those who
fail after two attempts can either proceed to vocational preparatory schools or withdraw from
education.
The general secondary level lasts three years while the secondary vocational orientation takes
three and five years. Tertiary level education includes universities and non-university
institutions. Non-university institutions are middle technical institutes offering two years
courses and higher technical institutions offer four years courses. Note that universities train
technical teachers while higher technical schools prepare students for employment in specific
industries.
In recent years, greater emphasis is being placed on developing industry-related VET systems
that foster local partnerships between industry and training centers. These practices seek the
development of alternative ways of providing practical skills. They are expected to have
beneficial effects on curriculum reform. They include training through industry attachments
such as the dual system and apprenticeships, in-service training and re-training of workers.
Figure 1 summarizes the VET process.
26
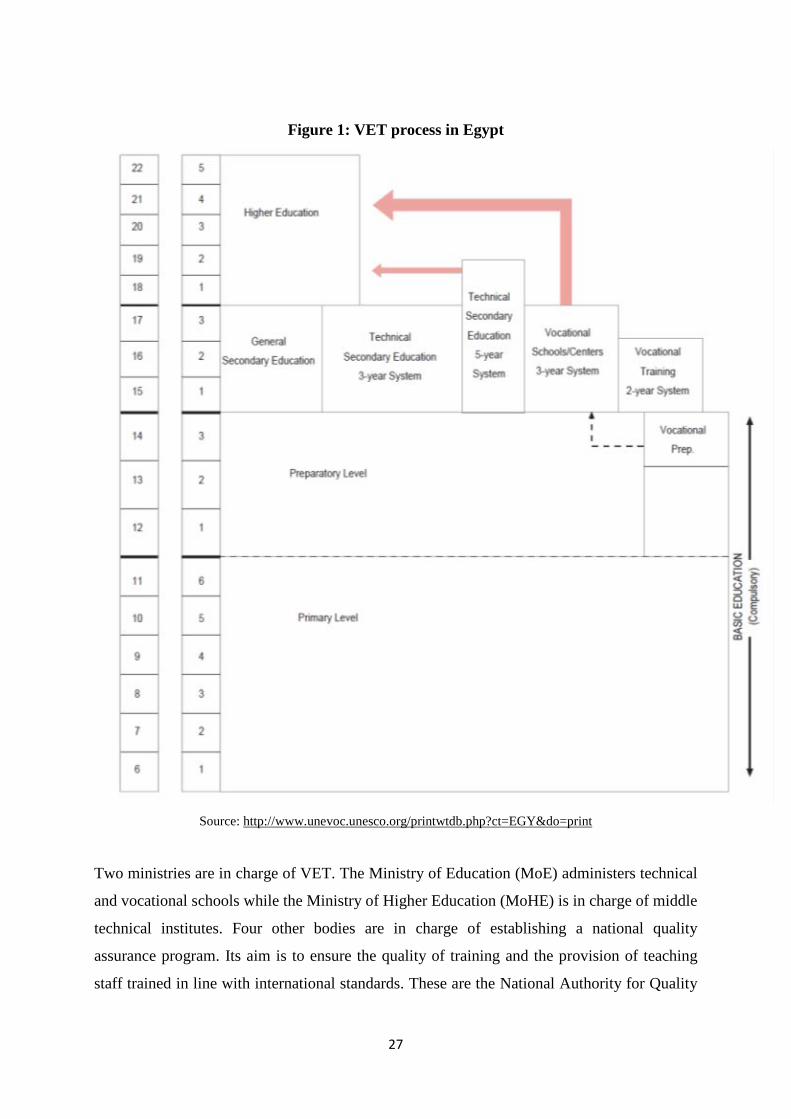
Figure 1: VET process in Egypt
Source: http://www.unevoc.unesco.org/printwtdb.php?ct=EGY&do=print
Two ministries are in charge of VET. The Ministry of Education (MoE) administers technical
and vocational schools while the Ministry of Higher Education (MoHE) is in charge of middle
technical institutes. Four other bodies are in charge of establishing a national quality
assurance program. Its aim is to ensure the quality of training and the provision of teaching
staff trained in line with international standards. These are the National Authority for Quality
27
Assurance and Accreditation of Education, the National Quality Program, the Egyptian
Organization for Standardization and Quality and the Egyptian Accreditation Council.
There are three fields on the technical/vocational level: industrial, commercial and
agricultural. The funding of VET centers predominantly occurs via public budget allocations
(based on past enrollment). More specifically, the VET system is financed through:
1. Student fees: Student fees are usually limited to cover administrative costs. Secondary
VET education is generally free of charge. Some institutions may charge fees but they
revert in their entirety to the Ministry of Finance. Institutions may also support
students providing monthly allowances.
2. State’s budget allocations: The funding is still low although it has increased in the
recent years.
3. Donors and international partners: Such funding is provided through grants and loans
to government ministries and through internationally-funded VET programs.
International donors include: The European Union, the World Bank and various
foreign governments (Canada, France, Germany, United States, etc.).
As alluded to above, new entrants in the job market are often seen as inadequately prepared
(Angel-Urdinola and Semlali, 2010). The Vocational Training System is questioned and many
observers argue that the VET system largely fails to achieve its objective (Diego et al., 2013).
Among the proposed reasons, one finds:
1. The high fragmentation of the VET system: 1 237 vocational training centers,
affiliated to 27 ministries or authorities and operating independently in 19 different
governorates. This induces a lack of coordination across training programs and with
respect to the needs of the labor market. In addition, curricula are not reviewed
frequently, many courses do not meet the needs of industry and the private sector and
monitoring and evaluation of the effects of training programs on labor market
outcomes of participants is highly deficient.
2. As discussed above regarding the education system in general, ministries allocate their
budgets to the providers of vocational training without any consideration of their
performance.
3. Trainers are not adequately trained for their specific task. Only 35% of trainers had a
pedagogical training and only 50% had attended an advanced practical training. In
addition, a larger majority of equipment in training centers is in bad conditions (due to
the lack of maintenance), depleted or underutilized.
28
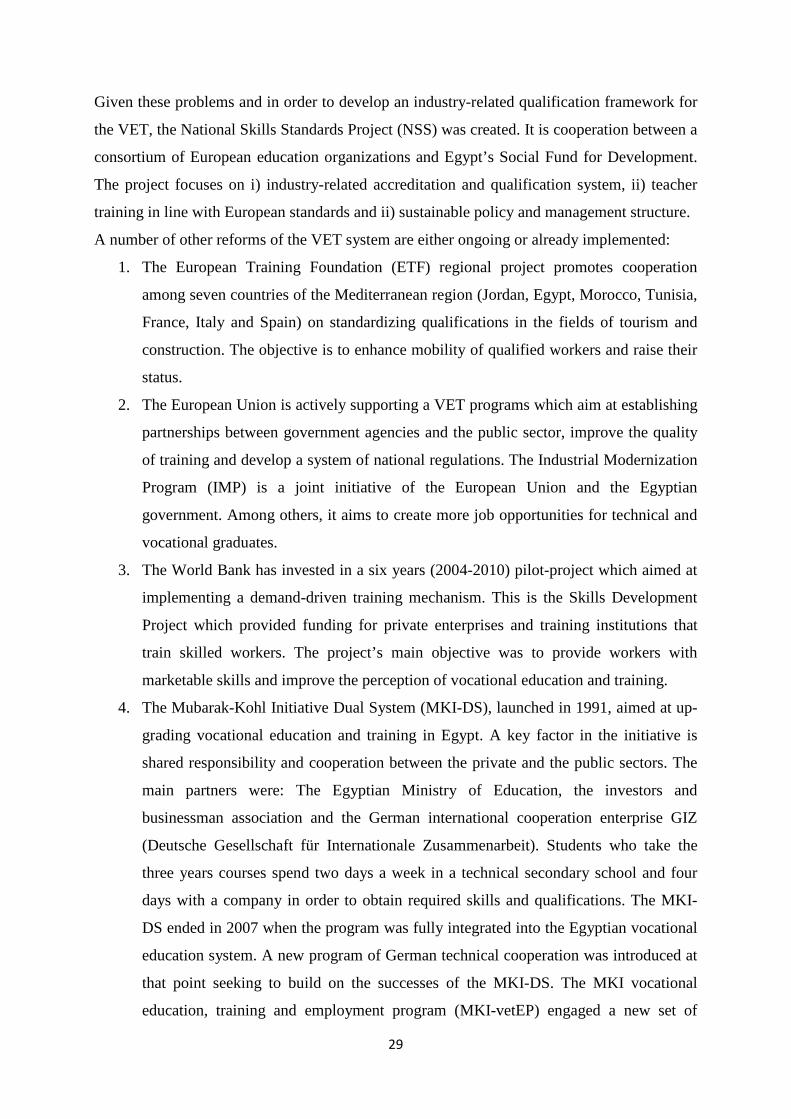
Given these problems and in order to develop an industry-related qualification framework for
the VET, the National Skills Standards Project (NSS) was created. It is cooperation between a
consortium of European education organizations and Egypt’s Social Fund for Development.
The project focuses on i) industry-related accreditation and qualification system, ii) teacher
training in line with European standards and ii) sustainable policy and management structure.
A number of other reforms of the VET system are either ongoing or already implemented:
1. The European Training Foundation (ETF) regional project promotes cooperation
among seven countries of the Mediterranean region (Jordan, Egypt, Morocco, Tunisia,
France, Italy and Spain) on standardizing qualifications in the fields of tourism and
construction. The objective is to enhance mobility of qualified workers and raise their
status.
2. The European Union is actively supporting a VET programs which aim at establishing
partnerships between government agencies and the public sector, improve the quality
of training and develop a system of national regulations. The Industrial Modernization
Program (IMP) is a joint initiative of the European Union and the Egyptian
government. Among others, it aims to create more job opportunities for technical and
vocational graduates.
3. The World Bank has invested in a six years (2004-2010) pilot-project which aimed at
implementing a demand-driven training mechanism. This is the Skills Development
Project which provided funding for private enterprises and training institutions that
train skilled workers. The project’s main objective was to provide workers with
marketable skills and improve the perception of vocational education and training.
4. The Mubarak-Kohl Initiative Dual System (MKI-DS), launched in 1991, aimed at up-
grading vocational education and training in Egypt. A key factor in the initiative is
shared responsibility and cooperation between the private and the public sectors. The
main partners were: The Egyptian Ministry of Education, the investors and
businessman association and the German international cooperation enterprise GIZ
(Deutsche Gesellschaft für Internationale Zusammenarbeit). Students who take the
three years courses spend two days a week in a technical secondary school and four
days with a company in order to obtain required skills and qualifications. The MKI-
DS ended in 2007 when the program was fully integrated into the Egyptian vocational
education system. A new program of German technical cooperation was introduced at
that point seeking to build on the successes of the MKI-DS. The MKI vocational
education, training and employment program (MKI-vetEP) engaged a new set of
29

partners from the state, private sector and civil society in order to address youth
employment. The objective of MKI-vetEP is to improve interactive employability of
young people through training and labor market institutions.
5. In cooperation with the European Union, an extensive “TVET Reform Program” was
implemented in Egypt between 2005 and 2013. This reform program has a core focus
on strengthening the labor market link by establishing local and sectoral Enterprise
Training Partnerships (ETP).
6. Finally, other programs have been set up in specific cities to address particular
problems. A program of Education and Training of the Egyptian Youth in Fayoum
Governorate was created in order to enhance the employability in Egypt and abroad. It
focused on the renovation and upgrading of selected educational/vocational training
centers in Fayoum and on the activation of orientation/counseling for local students.
The Ministry of Education (MoE) and the USAID-funded Egypt´s Competitiveness
Program (ECP) have established school-based employment units in eight pilot schools
in Alexandria, Port Said and Sharkia. These units will provide employment
opportunities for technical school students in the food processing, clothing, and
tourism sectors. Through agreements with factory owners, students will receive hands-
on training and gain real-work experiences in factories that will raise students’
chances of being hired immediately after graduation.
3. Statistical analysis 3.1 International comparison Education
Figure 2 presents the percentage and its evolution of the population between 15 and 65 which
has never been enrolled in official education in Egypt and in comparator countries. The
percentage in Egypt is the highest in the Region after Morocco and Yemen. It is higher than in
any comparator countries outside the Region except India and Nicaragua. Like in almost all
comparator countries, the percentage is slightly decreasing between 2000 and 2010.
30

Figure 2: Percentage of the population between 15 and 65 never enrolled in education
Source: Barro and Lee (2013)
Figure 3 presents the percentage and its evolution of the population between 15 and 65
holding only a primary degree in Egypt and in comparator countries. The percentage in Egypt
is the lowest in the Region after Algeria. It is much lower than in many comparator countries
and slightly decreasing between 2000 and 2010. However, looking at Figure 4 which presents
the percentage of the population between 15 and 65 having completed primary and secondary
degrees (but not tertiary), the situation of Egypt seems more comfortable. The Egyptian
percentage is similar to many other countries such as Turkey, Mexico and Brazil. It also
shows non-negligible increase between 2000 and 2010. Finally, Table 5 which gives similar
information to the previous tables but focus on people having primary, secondary and tertiary
degrees shows that Egypt is lagging behind many countries in and outside the MENA region.
However, the Egyptian percentage is increasing between 2000 and 2010.
Figure 3: Percentage of the population between 15 and 65 having completed only
primary
Source: Barro and Lee (2013)
0,0010,0020,0030,0040,0050,0060,0070,0080,00
Alge
riaEg
ypt
Iran
Jord
anM
oroc
coSy
riaTu
nisia
Yem
enAr
gent
ina
Boliv
iaBr
azil
Colo
mbi
aCo
sta
Rica
Ecua
dor
Indi
aIn
done
siaIs
rael
Mal
aysia
Mex
ico
Nic
arag
uaPh
ilipp
ines
Sri L
anka
Thai
land
Turk
eyVi
etna
m
2000
2005
2010
0,005,00
10,0015,0020,0025,0030,0035,0040,0045,00
Alge
riaEg
ypt
Iran
Jord
anM
oroc
coSy
riaTu
nisia
Yem
enAr
gent
ina
Boliv
iaBr
azil
Colo
mbi
aCo
sta
Rica
Ecua
dor
Indi
aIn
done
siaIs
rael
Mal
aysia
Mex
ico
Nic
arag
uaPh
ilipp
ines
Sri L
anka
Thai
land
Turk
eyVi
etna
m
2000
2005
2010
31

Figure 4: Percentage of the population between 15 and 65 having completed only primary and secondary
Source: Barro and Lee (2013)
Figure 5: Percentage of the population between 15 and 65 having completed primary, secondary and tertiary
Source: Barro and Lee (2013)
Unemployment
The unemployment rate in Egypt is high like all countries in the Region. It has increase since
2010 while the same rate has decreased in Algeria, Jordan and Morocco. However, such
increase might be linked to the political instability since 2011 since Tunisia, Yemen and Syria
(“Arab Spring countries”) show also an increase. Unemployment rates in all countries of the
Region (including Egypt) are higher than in comparator countries.
0,0010,0020,0030,0040,0050,0060,00
Alge
riaEg
ypt
Iran
Jord
anM
oroc
coSy
riaTu
nisia
Yem
enAr
gent
ina
Boliv
iaBr
azil
Colo
mbi
aCo
sta
Rica
Ecua
dor
Indi
aIn
done
siaIs
rael
Mal
aysia
Mex
ico
Nic
arag
uaPh
ilipp
ines
Sri L
anka
Thai
land
Turk
eyVi
etna
m
2000
2005
2010
0,00
5,00
10,00
15,00
20,00
25,00
Alge
riaEg
ypt
Iran
Jord
anM
oroc
coSy
riaTu
nisia
Yem
enAr
gent
ina
Boliv
iaBr
azil
Colo
mbi
aCo
sta
Rica
Ecua
dor
Indi
aIn
done
siaIs
rael
Mal
aysia
Mex
ico
Nic
arag
uaPh
ilipp
ines
Sri L
anka
Thai
land
Turk
eyVi
etna
m
2000
2005
2010
32

Figure 6: Unemployment rate (% of total labor force)
Source: World Development Indicators
One of the most frequently cited issues concerning the MENA is the high unemployment
among graduates. To see how Egypt stands in this respect, Figure 7 presents the share of the
unemployed having a tertiary degree in total unemployment. The figure confirms the
seriousness of the problem in Egypt. Even if one disregard the period post 2011, Egypt shows
the highest share of unemployed having a tertiary degree than in any other country in the
sample but Philippines.
Figure 7: Unemployed with tertiary education (% of total unemployment)
Source: World Development Indicators
0
5
10
15
20Al
geria
Egyp
tIra
nJo
rdan
Mor
occo
Syria
Tuni
siaYe
men
Arge
ntin
aBo
livia
Braz
ilCo
lom
bia
Cost
a Ri
caEc
uado
rIn
dia
Indo
nesia
Mal
aysia
Mex
ico
Nic
arag
uaPh
ilipp
ines
Sri L
anka
Thai
land
Turk
eyVi
etna
m
Average 2005-2009 Average 2010-2013
05
1015202530354045
Alge
riaEg
ypt
Iran
Jord
anM
oroc
coSy
riaTu
nisia
Yem
enAr
gent
ina
Boliv
iaBr
azil
Colo
mbi
aCo
sta
Rica
Ecua
dor
Indi
aIn
done
siaM
alay
siaM
exic
oN
icar
agua
Phili
ppin
esSr
i Lan
kaTh
aila
ndTu
rkey
Viet
nam
Average 2005-2009 Average 2010-2013
33
3.2 Education in Egypt. The above documented high percentage of the population which has never been enrolled in
official education in Egypt pushed the State to increase the number of schools in the whole
country. The national total network of school buildings has increased by 1.5% a year. More
attention has been devoted to rural regions where the increase is 2%. However the size of
classes is still too big with an average of 30-45 pupils per class in basic education. In some
areas (Alexandria, Giza – primary classes) the number reaches even more than 50 students
(Stopikowska and El-Deabes, 2012).
Table 1 shows the number of students at different educational stages and schools by gender,
region (rural and urban) and organizer (public and private). In total, there are slight
differences by gender (in favor of male) and by region (in favor of urban). The most
noticeable difference is between organizers. The private sector is enrolling less than 10% of
the total. Looking by education stage, the gender difference is marked in secondary industrial,
agricultural (in favor of male), commercial (in favor of female) and technical and special
needs education (in favor of male). There are much less rural students in the general
secondary education than urban, which reduces their chances for education at higher levels.
The same holds in technical and vocational schools.
34

Table 1: Numbers of Students at Different Educational Stages and Schools (2009/2010).
Source: Stopikowska and El-Deabes (2012).
Table 2 gives the number of classes and schools at different stages by region and organizer. It
shows that primary classes are mostly in rural areas while general secondary, technical and
vocational classes are mainly located in urban areas. This might hinder the rural youth’s
access to education. The Table also shows that private education is mainly concentrated in the
primary and preparatory levels.
35

Table 2: Numbers of Classes and Schools of Different Stages (2009/2010).
Source: Stopikowska and El-Deabes (2012).
Regarding the higher education system, there are 623 academic institutions. Among these 34
are universities and 589 are faculties and institutes. They enroll a total of approximately 4
million students. Commercial and educational studies are the most popular fields followed by
arts, humanities and law. Medical, pharmaceutical and, particularly, dentistry studies are
comparatively limited. The gender disparity at the level of higher education is not very
significant: the ratio of female enrollment to male was around 85% in 2008 (Stopikowska and
El-Deabes, 2012).
Beside the education system, the lifelong learning system, that allows workers to ensure
continued upgrading of their knowledge, is still underdeveloped in Egypt. Figure 8 suggests
that firms in Arab countries are still not taking an active part in training programs. In Egypt,
the share of firms offering formal training in the total number of firms is the lowest in the
Region but Algeria although it witnessed a non-negligible increase between 2000 and 2009. It
remains, however, lower than in almost all other comparator countries outside the Region.
36

Figure 8: Firms offering formal training (% of firms)
Source: World Development Indicators
4. Skill Mismatch Following Angel-Urdinola and Semlali (2010), Egyptian employers face difficulties recruiting
qualified workers. The results of the World Bank enterprises survey of 2008 indicate that
firms identify worker skills and education among their top five constraints to business
climate. Table 3 gives the results of this survey concerning skills assessment by employers of
young applicants. Only 18% of all firms interviewed find that workers’ skills are very good.
Table 3: Young applicants’ skills assessment by employers (% of employers)
Source: Angel-Urdinola and Semlali. (2010).
El-Hamidi, (2010), using the Egypt Labor Market Panel Surveys of 1998 and 2006, examined
the magnitude and the evolution of the education-occupation mismatch by gender and by
occupational categories. The main findings are as follows: there is evidence of an education-
occupation mismatch in the Egyptian private sector. Table 4 shows that the overall incidence
0102030405060708090
Alge
ria
Egyp
t
Jord
an
Mor
occo
Syria
Arge
ntin
a
Boliv
ia
Braz
il
Colo
mbi
a
Cost
a Ri
ca
Ecua
dor
Indi
a
Indo
nesia
Mal
aysia
Mex
ico
Nic
arag
ua
Phili
ppin
es
Sri L
anka
Thai
land
Turk
ey
Viet
nam
Average2000 - 2004 Average2005 -2009
37

has declined from 51% to 42% between 1998 and 2006 irrespective of the gender. Males are
more likely to be mismatched than females. The drop in the mismatch shows up in over
education while the share of under-educated workers has increased. In both years, males are
more likely to be mismatched than females and the decrease is more noticeable for females
mainly due to the drop in over education.
Table 4: The Incidence of Educational Mismatch by Gender, 1998 and 2006
Source: El-Hamidi, (2010)
In term of professional categories, the highest mismatch in 2006 is found for Legal Senior
Officers and Managers, Clerks, Technical Professionals and in elementary occupations.
Between 1998 and 2006, these categories (Except elementary occupations) witnessed marked
increase in the mismatch while Craft related workers and plant and machine operators showed
a noticeable decrease (See Table 5).
Table 5: The Incidence of Education-Occupation Mismatch
Source: El-Hamidi, (2010)
Looking to the incidence by years of experience, Table 6 shows that while for male the
mismatch was decreasing with the years of experience in 1998, it became increasing in 2006.
38

Table 6: The Incidence of Educational Mismatch by Years of Experience and Gender,
1998 and 2006
Source: El-Hamidi, (2010)
Table 7 which focuses on the mismatch by occupational group, reveals that blue collar jobs
have adjusted quickly to changes: in 1998 adequately educated workers represented 40% and
53% in 2006 for males and respectively 45% and 63 for females. A similar improvement can
be observed for professionals. For white collars, the situation improved for males and
deteriorated for females. However, the changes are very small.
Table 7: The Incidence of Mismatch by Occupational Groups and Gender, 1998 and
2006
Source: El-Hamidi, (2010)
El Hamidi (2010) conducted an econometric analysis to examine the rates of return to over,
under and adequate education. She found that returns of over educated white collar and blue
collar males are higher than returns for adequately educated males and are greater in 2006
than in 1998. Females in white collar jobs, both over and undereducated, receive higher
returns than adequately educated females in 1998. In 2006, however, returns to over-
education were higher and returns to under-education were lower than adequate education.
39

Females in blue collar jobs are being penalized if they are inadequately matched, especially in
2006, and are rewarded less than males.
Bertoni, and Ricchiuti (2014) used the Labor Market Panel Surveys 2006 and 2012 to
investigate the role of individual and contextual characteristics in determining individuals’
probability of being unemployed. They found that for females, younger and more educated
workers, the probability of being unemployed is higher and interpret this as revealing
education-occupation mismatch. Moreover, a later entrance in the labor market leads to a
reduction of individual unemployment probability. In addition, a married individual (being
male of female) who is in head of its household, living in rural governorates, or in areas
interested by higher university, shows a lower probability of being unemployed.
Bartlett (2013) examined the skill mismatch by education level. The analysis is based on a
mismatch ratio define as follows. For a given education level, the ratio equals the share of
unemployed people to the share of employed people with the same level of education. A ratio
above 1 is a signal of a ‘positive’ mismatch. This means that there is an excess supply of labor
with that education level. The education system is supplying ‘too many’ workers at that
qualification level to the economy relative to demand. The opposite conclusion holds if the
ratio is below 1.
Table 8 presents the ratio for different education levels by gender over the period 2005-2010.
Overall, the results show serious imbalances in the labor market irrespective of the education
groups. There are, however, important differences across education levels and gender.
Workers with at most primary education experience strong negative mismatch while those
with secondary education and above experience strong positive mismatch. The mismatch ratio
is especially large for those with university and higher education (above 2 since 2007).
There are also significant gender imbalances. The mismatch for women with either general or
vocational secondary education is positive and higher than for male. In contrast the mismatch
is positive and higher for males who have university education than for women.
40

Table 8: Mismatch ratios in Egypt, 2005-10
Source: Bartlett (2013)
5. Training by firms The high share of graduates in unemployment reveals both the mismatch between the demand
and supply of skills and the low involvement of firms in training. Graduates have, in general,
the necessary background to learn and adapt to new tasks. Beyond the education system, the
training by firms allows workers to ensure continued upgrading of their knowledge but is still
underdeveloped.
Figure 8 in Section 3 has shown that firms in Arab countries are still not taking an active part
in training programs. In Egypt, the share of firms offering formal training in the total number
of firms is the lowest in the Region but Algeria although it witnessed a non-negligible
increase between 2000 and 2009. It remains, however, lower than in almost all other
comparator countries outside the Region.
A number of empirical studies investigated the impact of firm sponsored training in
developing countries. Revenga et al. (1994) found that in Mexico training reduces the mean
duration of unemployment and increases the monthly earnings of men. Attanasio et al. (2008)
showed that training raises earnings and employment in Colombia. Aedo and Nuñez (2001),
focusing on Argentina, concluded that training positively affects earnings and employment.
41
Rosholm et al. (2007) focused on the impact of training on workers' earnings in Kenyan and
Zambian manufacturing firms and found weak support for a positive return on training.
To our best knowledge, only Achy and Sekkat (2011) and Sekkat (2011) have addressed a
similar question for an Arab country; namely Morocco. Achy and Sekkat (2011) using a large
sample of big and small firms covering seven industries in Morocco, found that firms’
investment in human capital (i.e. training) allows them creating jobs. Sekkat (2011), using a
similar sample but focusing on productivity, showed that the intensity of training has a
significant and positive impact on productivity in small and medium enterprises. No similar
analysis seems to exist for Egypt.
6. Conclusion
Human capital formation is widely recognized as a vehicle of economic growth, poverty
alleviation and reduction of inequalities. However, statistical figures show that the share of
population between 15 and 65 which has never been enrolled in official education in Egypt is
the highest in the Region after Morocco and Yemen. It is higher than in any comparator
countries outside the Region (except India and Nicaragua) although the Egyptian constitution
sets education as a fundamental right of each citizen and basic education is compulsory. In
term of people having completed a tertiary degree, their share in the population between 15
and 65 is lower in Egypt than in many countries in and outside the MENA region.
At the same time, Egyptian employers seem facing difficulties in recruiting qualified workers.
In 2008 only 18% of firms interviewed find that workers’ skills are very good. However,
beside the education system, the lifelong learning system, that allows workers to ensure
continued upgrading of their knowledge, is still underdeveloped in Egypt. In this country, the
share of firms offering formal training in the total number of firms is the lowest in the Region
but Algeria and is lower than in almost all other comparator countries outside the Region.
Many analysts attribute this situation to the mismatch between demands of the labor market
and the skills produced by the educational and training system. The Egyptian education
system is broadly comparable to many systems around the World. It consists of preprimary,
primary, secondary and tertiary levels. Basic education is compulsory and lasts 9 years: 6
years primary stage and 3 years preparatory stage. From the end of primary, the system offers
general or vocational programs. Education at all levels is provided by both public and private
institutions. Public education is free and open to the masses. Private education can be
religious (run by Muslims or Christians) or non-religious, Egyptian or foreign. However, like
public institutions, private institutions are under the supervision of the government. The
42

financing of public education does not take into consideration the efficiency of institutions
and their performances. There is also no direct connection between the allocation received by
each institution and its actual needs. The Vocational Training System is also criticized by
many observers who argue that it has largely failed to achieve its objective. This is attributed
to its high fragmentation (too many actors), a poorly targeted funding and insufficient
qualification of trainers. To improve the performance of the VET system a number of reforms
are either ongoing or already implemented. Among these, the Mubarak-Kohl Initiative Dual
System (MKI-DS), launched in 1991, seems to have had a high successes.
43
References Achy, L. and Kh. Sekkat (2011), “Training, new equipment and job creation: A firm-level analysis using Moroccan data”, European Journal of Development Research, 23:4, pp. 615-629.
Aedo, C. and Nunez, S. (2001), “The Impact of Training Policies in Latin America and the Caribbean: The Case of ‘Programa Joven”, Inter-American Development Bank, Working paper R-483.
Angel-Urdinola, D. F. and A. Semlali (2010), "Labor markets and school-to-work transition in Egypt: Diagnostics, constraints, and policy framework" MPRA Paper No. 27674.
Angel-Urdinola, D. F., A. Kuddo and A. Semlali (2013), "Building Effective Employment Programs for Unemployed Youth in the Middle East and North Africa", World Bank Publications.
Attanasio, O., A. Kugler and C. Meghir (2008), “Training disadvantaged youth in Latin America: evidence from a randomized trial”, National Bureau of Economic Research, No. w13931.
Barro, R. J. and J. W. Lee (2013), "A new data set of educational attainment in the world, 1950–2010", Journal of Development Economics, 104, pp. 184-198.
Barsoum, G. (2014), "Aligning incentives to reforming higher education in Egypt: The role of private institutions", Economic Research Forum, WP n° 833.
Bartlett, W (2013), "Skill mismatch, education systems, and labor markets in EU neighborhood policy countries", SEARCH Working Papers WP5/20.
Bertoni, E. and G. Ricchiuti (2014), “A Multilevel Analysis of the Unemployment in Egypt”, Universita'degli Studi di Firenze, Dipartimento di Scienze per l'Economia e l'Impresa, No. wp2014_23.
David, A. and Ch. Nordman (2014), "Skill mismatch and migration in Egypt and Tunisia", Document de travail UMR DIAL DT/2014-05.
Eichhorst, W., N. Rodríguez-Planas, R. Schmidl and K. F. Zimmermann (2012), “A Roadmap to Vocational Education and Training Systems around the World”, IZA DP No. 7110
El-Hamidi, F. (2010), "Education-Occupation Mismatch and the effect on wages of Egyptian Workers", Handbook on International Studies in Education, pp. 1-23.
Huber, E. and J. D. Stephens (2014), "Social Investment in Latin America", https://www.sas.upenn.edu/dcc/sites/www.sas.upenn.edu.dcc/files/Huber%20-%20Social%20Investment%20in%20Latin%20America.pdf
44
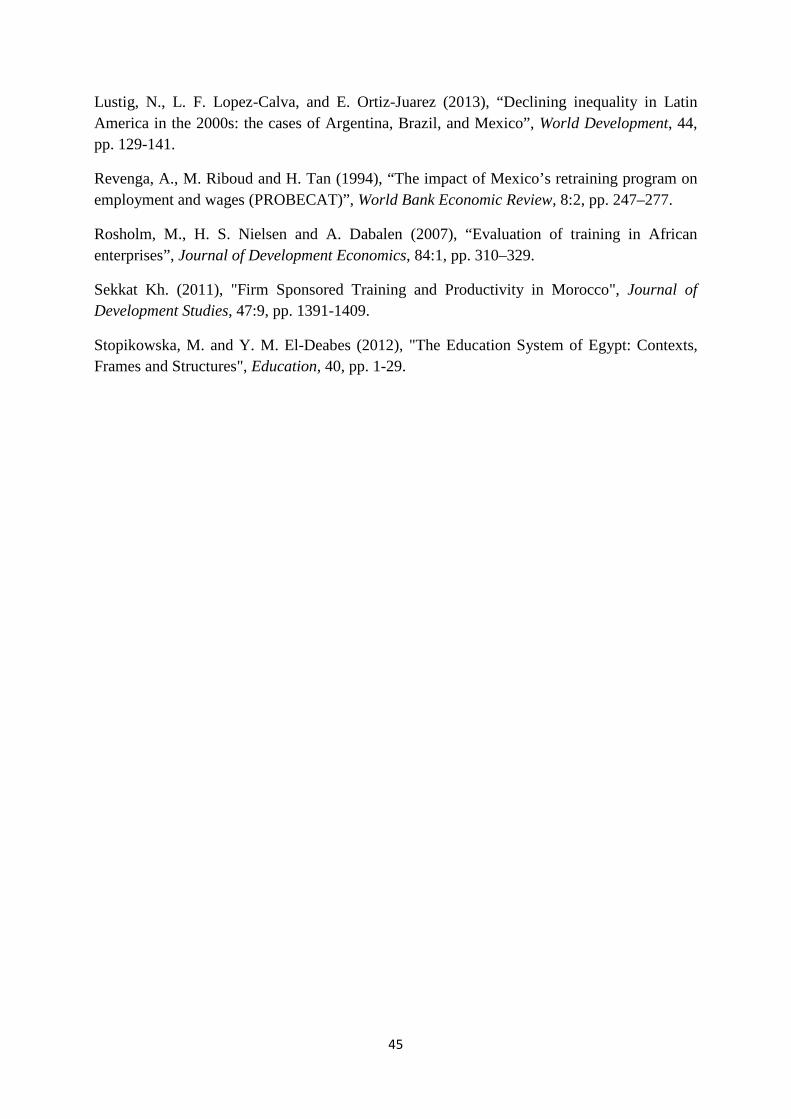
Lustig, N., L. F. Lopez-Calva, and E. Ortiz-Juarez (2013), “Declining inequality in Latin America in the 2000s: the cases of Argentina, Brazil, and Mexico”, World Development, 44, pp. 129-141.
Revenga, A., M. Riboud and H. Tan (1994), “The impact of Mexico’s retraining program on employment and wages (PROBECAT)”, World Bank Economic Review, 8:2, pp. 247–277.
Rosholm, M., H. S. Nielsen and A. Dabalen (2007), “Evaluation of training in African enterprises”, Journal of Development Economics, 84:1, pp. 310–329.
Sekkat Kh. (2011), "Firm Sponsored Training and Productivity in Morocco", Journal of Development Studies, 47:9, pp. 1391-1409.
Stopikowska, M. and Y. M. El-Deabes (2012), "The Education System of Egypt: Contexts, Frames and Structures", Education, 40, pp. 1-29.
45
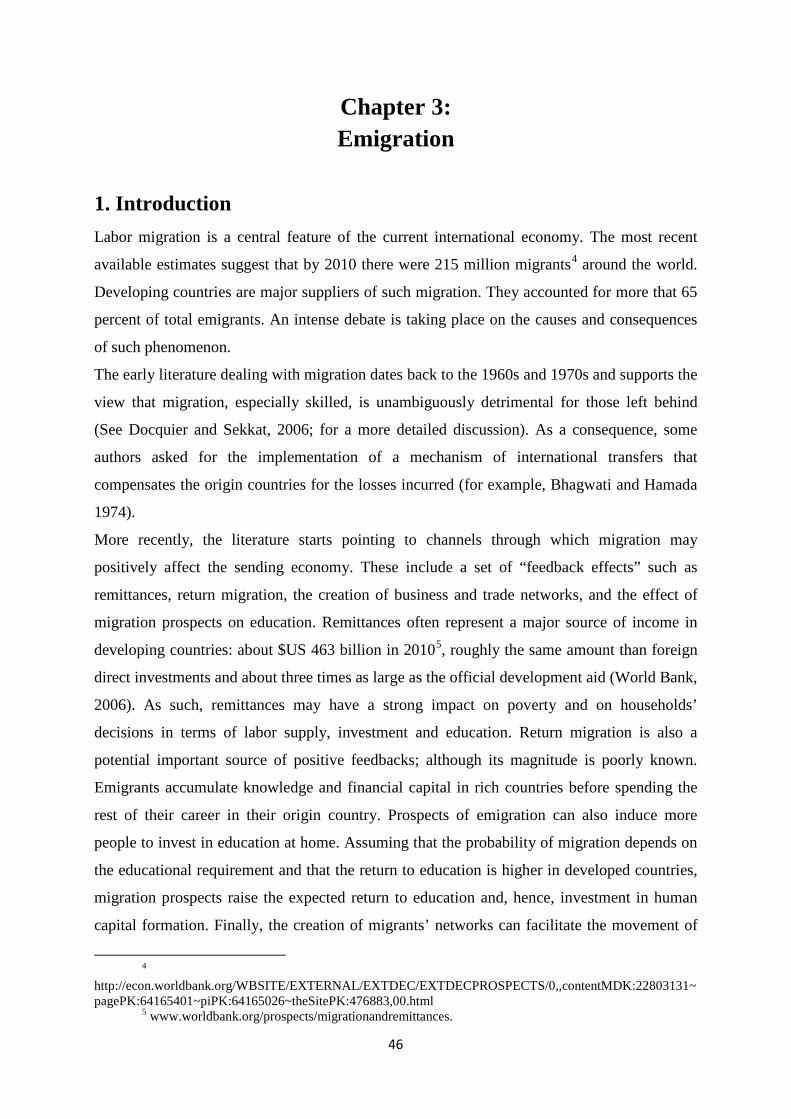
Chapter 3: Emigration
1. Introduction Labor migration is a central feature of the current international economy. The most recent
available estimates suggest that by 2010 there were 215 million migrants4 around the world.
Developing countries are major suppliers of such migration. They accounted for more that 65
percent of total emigrants. An intense debate is taking place on the causes and consequences
of such phenomenon.
The early literature dealing with migration dates back to the 1960s and 1970s and supports the
view that migration, especially skilled, is unambiguously detrimental for those left behind
(See Docquier and Sekkat, 2006; for a more detailed discussion). As a consequence, some
authors asked for the implementation of a mechanism of international transfers that
compensates the origin countries for the losses incurred (for example, Bhagwati and Hamada
1974).
More recently, the literature starts pointing to channels through which migration may
positively affect the sending economy. These include a set of “feedback effects” such as
remittances, return migration, the creation of business and trade networks, and the effect of
migration prospects on education. Remittances often represent a major source of income in
developing countries: about $US 463 billion in 20105, roughly the same amount than foreign
direct investments and about three times as large as the official development aid (World Bank,
2006). As such, remittances may have a strong impact on poverty and on households’
decisions in terms of labor supply, investment and education. Return migration is also a
potential important source of positive feedbacks; although its magnitude is poorly known.
Emigrants accumulate knowledge and financial capital in rich countries before spending the
rest of their career in their origin country. Prospects of emigration can also induce more
people to invest in education at home. Assuming that the probability of migration depends on
the educational requirement and that the return to education is higher in developed countries,
migration prospects raise the expected return to education and, hence, investment in human
capital formation. Finally, the creation of migrants’ networks can facilitate the movement of
4 http://econ.worldbank.org/WBSITE/EXTERNAL/EXTDEC/EXTDECPROSPECTS/0,,contentMDK:22803131~pagePK:64165401~piPK:64165026~theSitePK:476883,00.html
5 www.worldbank.org/prospects/migrationandremittances.
46

goods, factors, and ideas between the migrants’ host and home countries. Ethnic networks
help overcoming information problems linked to the nature of the goods exchanged.
A very recent strand of the literature is now focusing on the non-economic impacts on the
origin country. Such impacts cover a wide range of dimensions including ethnic
discrimination, fertility, corruption, democracy and the quality of institutions.
Drawing on the above insight from the literature, this chapter examines the impact of
migration on economic development and growth in Egypt. The chapter is organized as
follows. Section 2 provides a statistical analysis of the Egyptian emigration in general and by
destination and education level. Section 3 discusses the determinants of such emigration.
Section 4 examines the impacts of this emigration on the home country. It distinguishes
between the economic (remittances, return migration etc.) and the non-economic impacts
(fertility, quality of institutions, democracy etc.). Section 5 concludes.
2. Statistical analysis 2.1 International comparison Figure 1 shows that Egyptian emigrants represent slightly more than 4% of the total
population living in Egypt. This percentage, although non-negligible, is far below the one in
many countries in the Region. Egyptian emigrants are mainly located in other Arab countries
(Figure 2). The share of such emigrant in total emigration is much higher than in other
country in the Region. In Algeria, Morocco, Tunisia and Turkey the large majority of
emigrants is located in Europe. Such differences in destinations between countries in the
Region might explain a number of differences in the impact of emigration across countries as
we will see below.
47

Figure 1: Emigration rate in 2010 (% of the population)
Source:
http://econ.worldbank.org/WBSITE/EXTERNAL/EXTDEC/EXTDECPROSPECTS/0,,contentMDK:22803131~
pagePK:64165401~piPK:64165026~theSitePK:476883,00.html
Figure 2: Emigration by destination in 2010 (%)
Source:
http://econ.worldbank.org/WBSITE/EXTERNAL/EXTDEC/EXTDECPROSPECTS/0,,contentMDK:22803131~
pagePK:64165401~piPK:64165026~theSitePK:476883,00.html
When discussing the impact of emigration on the source country, two dimensions have
attracted a lot of attention. These are remittances which often represent a major source of
income in developing countries and brain drain which is generally thought to be a major cost
to such countries. Hence the rest of the international comparison will focus of these two
dimensions.
Figure 3 present the share in GDP of personal remittances received by selected countries in
the Region. Between 2000 and 2012 the largest share, although decreasing, is found in Jordan.
For the rest of the countries, Egypt has the second highest share after Morocco. Over the
0,002,004,006,008,00
10,0012,0014,0016,00
0%10%20%30%40%50%60%70%80%90%
100%
Others
EU
Arab countries
North America
48
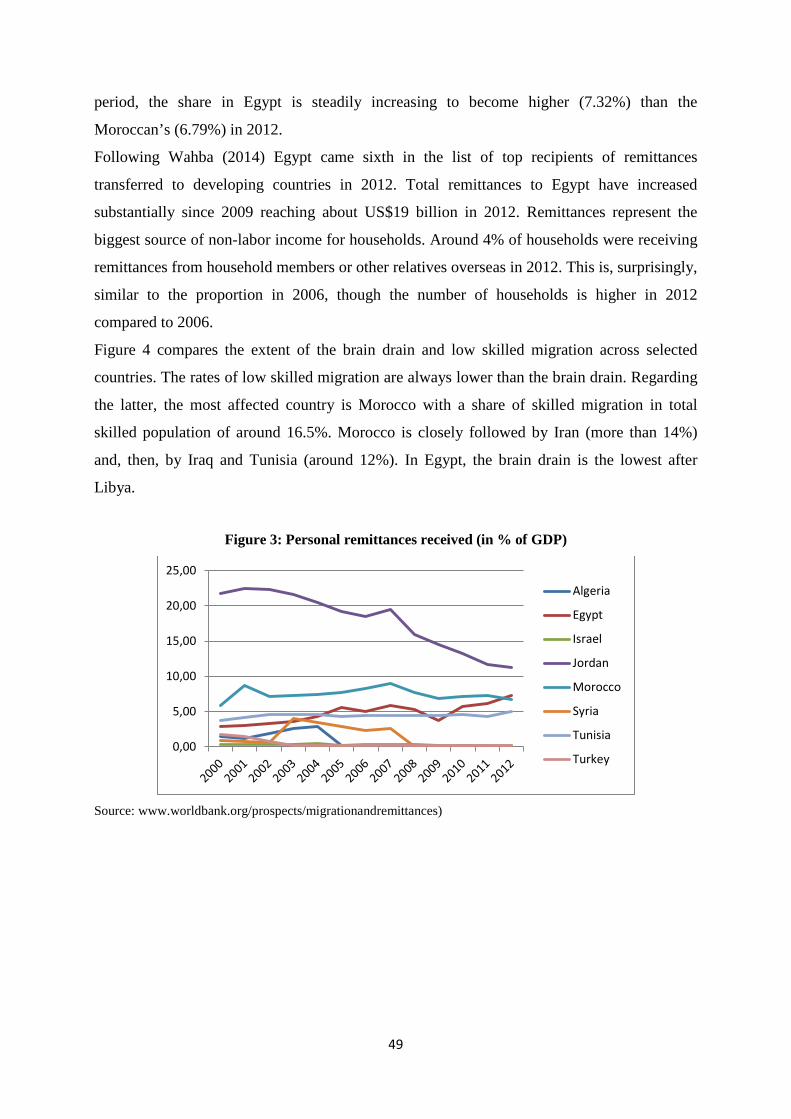
period, the share in Egypt is steadily increasing to become higher (7.32%) than the
Moroccan’s (6.79%) in 2012.
Following Wahba (2014) Egypt came sixth in the list of top recipients of remittances
transferred to developing countries in 2012. Total remittances to Egypt have increased
substantially since 2009 reaching about US$19 billion in 2012. Remittances represent the
biggest source of non-labor income for households. Around 4% of households were receiving
remittances from household members or other relatives overseas in 2012. This is, surprisingly,
similar to the proportion in 2006, though the number of households is higher in 2012
compared to 2006.
Figure 4 compares the extent of the brain drain and low skilled migration across selected
countries. The rates of low skilled migration are always lower than the brain drain. Regarding
the latter, the most affected country is Morocco with a share of skilled migration in total
skilled population of around 16.5%. Morocco is closely followed by Iran (more than 14%)
and, then, by Iraq and Tunisia (around 12%). In Egypt, the brain drain is the lowest after
Libya.
Figure 3: Personal remittances received (in % of GDP)
Source: www.worldbank.org/prospects/migrationandremittances)
0,00
5,00
10,00
15,00
20,00
25,00Algeria
Egypt
Israel
Jordan
Morocco
Syria
Tunisia
Turkey
49
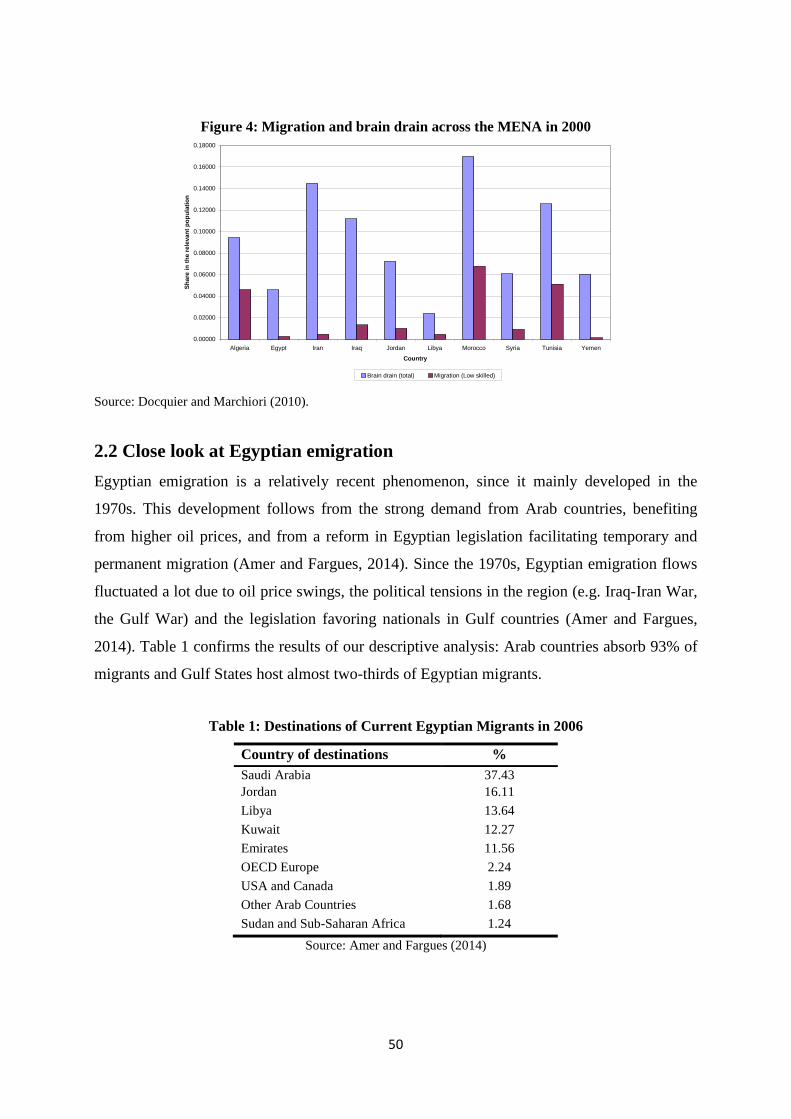
Figure 4: Migration and brain drain across the MENA in 2000
Source: Docquier and Marchiori (2010).
2.2 Close look at Egyptian emigration Egyptian emigration is a relatively recent phenomenon, since it mainly developed in the
1970s. This development follows from the strong demand from Arab countries, benefiting
from higher oil prices, and from a reform in Egyptian legislation facilitating temporary and
permanent migration (Amer and Fargues, 2014). Since the 1970s, Egyptian emigration flows
fluctuated a lot due to oil price swings, the political tensions in the region (e.g. Iraq-Iran War,
the Gulf War) and the legislation favoring nationals in Gulf countries (Amer and Fargues,
2014). Table 1 confirms the results of our descriptive analysis: Arab countries absorb 93% of
migrants and Gulf States host almost two-thirds of Egyptian migrants.
Table 1: Destinations of Current Egyptian Migrants in 2006
Country of destinations % Saudi Arabia 37.43 Jordan 16.11 Libya 13.64 Kuwait 12.27 Emirates 11.56 OECD Europe 2.24 USA and Canada 1.89 Other Arab Countries 1.68 Sudan and Sub-Saharan Africa 1.24
Source: Amer and Fargues (2014)
0.00000
0.02000
0.04000
0.06000
0.08000
0.10000
0.12000
0.14000
0.16000
0.18000
Algeria Egypt Iran Iraq Jordan Libya Morocco Syria Tunisia Yemen
Country
Shar
e in
the
rele
vant
pop
ulat
ion
Brain drain (total) Migration (Low skilled)
50
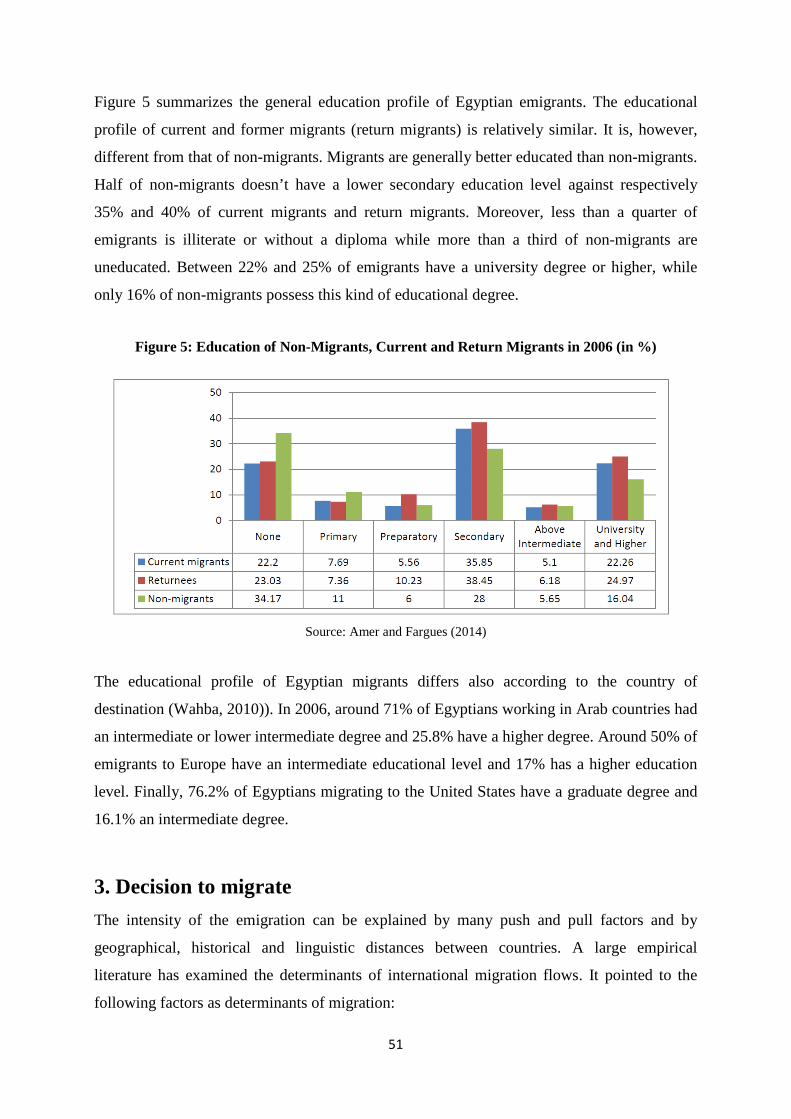
Figure 5 summarizes the general education profile of Egyptian emigrants. The educational
profile of current and former migrants (return migrants) is relatively similar. It is, however,
different from that of non-migrants. Migrants are generally better educated than non-migrants.
Half of non-migrants doesn’t have a lower secondary education level against respectively
35% and 40% of current migrants and return migrants. Moreover, less than a quarter of
emigrants is illiterate or without a diploma while more than a third of non-migrants are
uneducated. Between 22% and 25% of emigrants have a university degree or higher, while
only 16% of non-migrants possess this kind of educational degree.
Figure 5: Education of Non-Migrants, Current and Return Migrants in 2006 (in %)
Source: Amer and Fargues (2014)
The educational profile of Egyptian migrants differs also according to the country of
destination (Wahba, 2010)). In 2006, around 71% of Egyptians working in Arab countries had
an intermediate or lower intermediate degree and 25.8% have a higher degree. Around 50% of
emigrants to Europe have an intermediate educational level and 17% has a higher education
level. Finally, 76.2% of Egyptians migrating to the United States have a graduate degree and
16.1% an intermediate degree.
3. Decision to migrate The intensity of the emigration can be explained by many push and pull factors and by
geographical, historical and linguistic distances between countries. A large empirical
literature has examined the determinants of international migration flows. It pointed to the
following factors as determinants of migration:
51

• The difference in income across countries.
• The share of population between 15 and 39 years in the origin and host countries.
• The stock of immigrants
• The extent of poverty in the country of origin.
Marfouk (2006) used bilateral emigration data from 153 developing countries to 30 receiving
countries in 2000 to estimate the determinants of bilateral emigration stocks. The originality
lies in the distinction between skilled and unskilled emigration. Table 2 gives the elasticity of
bilateral emigration rates to all explanatory variables.
52

Table 2: Elasticity of the emigration rate
Source: Docquier and Sekkat (2006). Note: Dependent variable: emigration rate (in percentage), estimation method: Tobit regressions, Numbers between brackets are the absolute values of the t-ratios; ** significant at 1%; *significant at 5%.
These regressions show that the determinants of migration vary across education group. A
global regression without education distinction then hides a very strong heterogeneity. In
particular, the results show that:
• High-skill workers are more affected by differences in terms of living standards. A ten
percent increase in the income per capita gap between receiving and sending countries
results in an increase of high-skill emigration rate by 7.9%, against 4.5% for low-skill
workers.
• The effect of distance is negative for both skilled and unskilled workers, and the effect
of distance squared is positive, i.e. the marginal effect of distance is decreasing.
53

• Past colonial links are important. The impact of this variable is more pronounced for
unskilled workers.
• Skilled and unskilled emigration rate are inversely related to unemployment rate at
destination. High skilled migration is more affected by job opportunities at destination
than low-skilled migration.
• The population in the receiving country is a proxy of the immigration capacity and of
economic opportunity at destination. Related to the income effect, skilled workers are
more sensitive to economic opportunities.
• Social welfare programs affect positively both skilled and unskilled migration.
• The size of young cohorts in the country of origin is an important factor that drives
South-North emigration.
• Importantly, more deaths in civil wars induce more emigration for both skilled and
unskilled.
• Linguistic proximity is significant only for high-skill migrants. The explication is that
the skills acquired prior to migration are more transferable to the destination countries
sharing the same language.
• Finally, the EU immigration policy discourages both high-skill and low-skill
emigration. The elasticity is particularly negative for the skilled. In contrast, the four
traditional immigration nations (Australia, Canada, New Zealand, and the United
States) favor all types of immigration but mainly skilled immigration.
Amer and Fargues (2014) offer a microeconomic analysis of the determinants of emigration in
Egypt. More precisely, the study presents the findings of a recent survey on orientation
towards emigration of Egyptian youth. This survey was designed by the Migration Policy
Centre and was conducted through phone interviews by the Egyptian Centre for Public
Opinion Research (Baseera) in 2013. Amongst 2 509 persons aged 18-35 that were
interviewed by phone, 468 (18.7%) have declared that they have an intention to emigrate.
Among them, 81.8% were males and 18.2% females. Out of the 468, 104 (22%) envisaged
permanent emigration and 364 (78%) a long-term but not non-permanent migration.
The authors split the emigration drivers into three groups: individual characteristics; the
current situation at the time of the survey; and familiarity with migration.
Three individual characteristics were found to drive emigration:
1. University education: 65.4% of the cases have a university education (whether they
graduated or not).
54

2. Marital status: 50.9% of the cases are still unmarried. Having family responsibilities is
a disincentive to migration.
3. Religion: Being a Christian is a driver of emigration.
Three dimensions related to the present situation of the country contribute to inciting young
people to emigrate.
1. Seeking (better) employment: Finding a job is the main driver of emigration among
young Egyptians.
2. Over-qualification: Dissatisfaction with a current job and underemployment are
actually strong reasons why young people contemplate emigration.
3. Lack of confidence in the stability of Egypt: potential emigrants declared their concern
about the future of their country, a sentiment that is associated with a desire to
migrate.
Two aspects of the contacts with emigrants make emigration a realistic option:
1. Exposure to other’s migration experience: 87.1% of respondent who declared an
intention to migrate have heard about expatriate co-nationals while the percentage is
70.4% among those who did not declare intention to migrate. Exposure to other
migration experiences becomes an even stronger driver of migration if experiences of
expatriate co-nationals are reported to be positive.
2. Country where relatives and friends abroad live: This determines the willingness to
emigrate irrespective of the country where the relatives or friends live except for Saudi
Arabia. Fewer potential emigrants have relatives or friends living in Saudi Arabia. By
contrast, having relatives and friends living in the West (e.g. USA, Canada and
France) is a powerful migration driver.
The survey sheds also some light on the reasons for return. Asked about what would prompt
them to return to Egypt, a majority of respondents declared that family issues would be a
pressing reason. But only a minority thought that finding a suitable job in Egypt or getting
married would be a sufficient reason for them to return once abroad. The importance of return
factors does not vary along gender lines.
4. Impacts of migration on the home country The early literature dealing with migration dates back to the 1960s and 1970s and supports the
view that migration, especially skilled, is unambiguously detrimental for those left behind. As
a consequence, some authors have asked for the implementation of a mechanism of
55
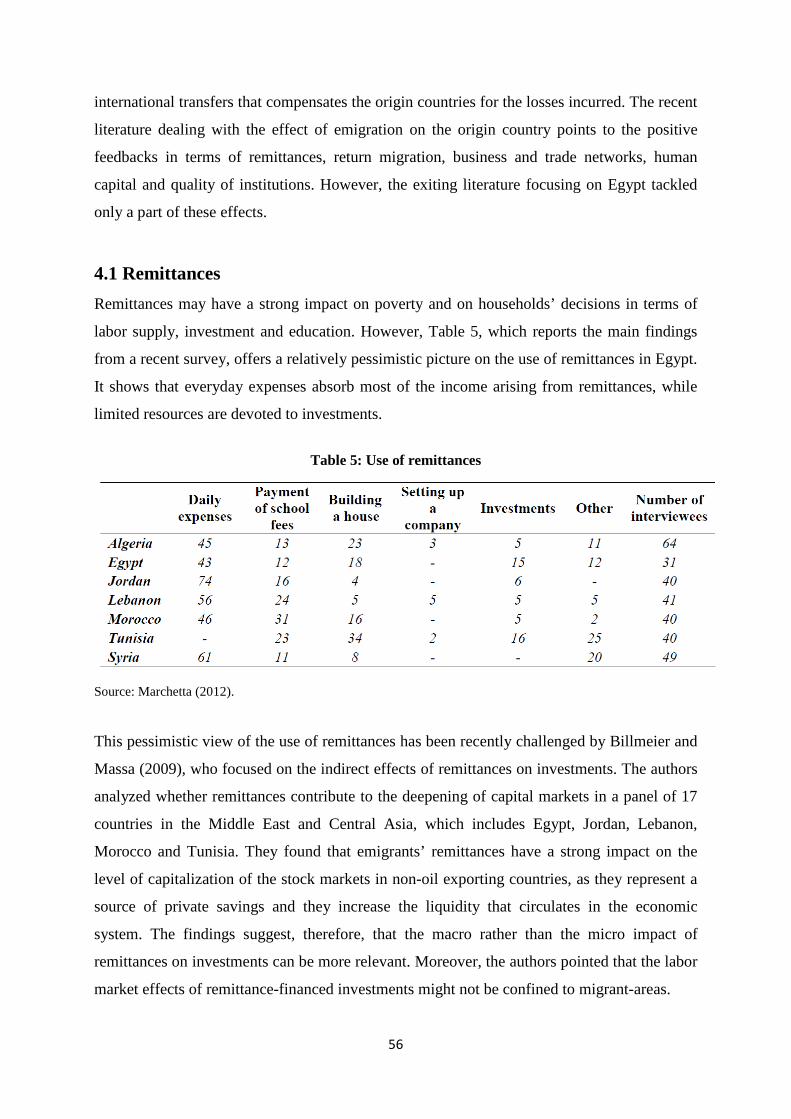
international transfers that compensates the origin countries for the losses incurred. The recent
literature dealing with the effect of emigration on the origin country points to the positive
feedbacks in terms of remittances, return migration, business and trade networks, human
capital and quality of institutions. However, the exiting literature focusing on Egypt tackled
only a part of these effects.
4.1 Remittances Remittances may have a strong impact on poverty and on households’ decisions in terms of
labor supply, investment and education. However, Table 5, which reports the main findings
from a recent survey, offers a relatively pessimistic picture on the use of remittances in Egypt.
It shows that everyday expenses absorb most of the income arising from remittances, while
limited resources are devoted to investments.
Table 5: Use of remittances
Source: Marchetta (2012).
This pessimistic view of the use of remittances has been recently challenged by Billmeier and
Massa (2009), who focused on the indirect effects of remittances on investments. The authors
analyzed whether remittances contribute to the deepening of capital markets in a panel of 17
countries in the Middle East and Central Asia, which includes Egypt, Jordan, Lebanon,
Morocco and Tunisia. They found that emigrants’ remittances have a strong impact on the
level of capitalization of the stock markets in non-oil exporting countries, as they represent a
source of private savings and they increase the liquidity that circulates in the economic
system. The findings suggest, therefore, that the macro rather than the micro impact of
remittances on investments can be more relevant. Moreover, the authors pointed that the labor
market effects of remittance-financed investments might not be confined to migrant-areas.
56
Adams and Page (2003) examined the impacts of oil rents, remittances and government
employment on inequality and poverty reduction. They have estimated simple econometric
models using a set of 50 developing countries, including Egypt. These models link either the
poverty or the inequality level to the level of the above mentioned variables plus other control
variables. The results on the impact of remittances on poverty suggest that remittances
significantly reduce poverty in the MENA region. The effect is higher than in other
developing countries. However, remittances don’t seem to have a significant impact on
inequality in the Region. The authors concluded that remittances from abroad may have been
spread well across the whole population, reducing the absolute poverty but leaving the overall
inequality situation unchanged.
Sharaf (2014) examined the long-run causal link between remittances and GDP in Egypt for
the period 1977–2012. The results showed that remittances and GDP have a long run
relationship, with a statistically significant, positive causality running from remittances to
GDP. However, the latter is not found to be a long-run determinant of remittances in Egypt.
The findings confirm the importance of remittances in promoting economic growth in Egypt.
Elseoud (2014) investigated the impact of workers’ remittances on different macroeconomic
variables in Egypt during the period 1991-2011. The findings show the existence of long run
relationship between workers' remittances and the macroeconomic variables. In particular,
there is a unidirectional causality running from remittances to private capital formation and to
exports while there is bidirectional causality between remittances and private consumption,
government spending, and economic growth.
Elbadawy and Roushdy (2009) focused on the impact of international migration and
remittances on child schooling and child work in Egypt using the Egypt Labor Market Panel
Survey of 2006. It was found that remittances have a strong positive effect on attendance for
university-aged boys. Migration has a positive effect on the likelihood of attending school for
young girls and a mild effect on school attendance of university aged girls. With respect to
child work, migration and remittances were found to significantly reduce young boys’ work.
However, living in a migrant household seems to increase the likelihood of light domestic
work for older boys. As for girls’ work, remittances reduce long-duration domestic work.
Koska et al. (2013) mitigated to some extent the above results. They studied the roles that
migration and remittances play in the human capital formation of children in Egypt using the
Egypt Labor Market Panel Surveys of 1998 and 2006. The paper considers two opposing
effects of remittances and emigration. One the one hand, remittances can have a positive
income effect and, thus, increase the household's education. On the other hand, remittances
57
may have a detrimental effect if they signal that unskilled work can be rewarding, and
additional income can be earned independently of schooling. Moreover, emigration may lead
to an increase in the domestic workload of the non-migrant household member which
decreases the time allocated to schooling. The findings show that both the positive income
effect and the negative family disruption effect co-exist. On average, a 10% increase in the
likelihood of receipt of remittances increases the likelihood of school enrollment by 1.5% and
decreases the likelihood of labor force participation by 3%. Hence, the emigration enabling
effect seems to dominate the remittances disabling effect.
Majeed (2014), focusing on poverty, studied the impact of remittances using cross-country
panel data set of 65 developing countries including Egypt over the period 1970–2008. The
study differs from the existing literature on poverty impact of remittances by explicitly noting
the importance of financial development in shaping the link. The author showed that the effect
of remittances on poverty depends on the level of financial development of a remittances
receiving economy. Those economies that have a low level of financial development seem to
acquire an unfavorable effect of remittances while economies with comparatively developed
financial systems do not suffer from the adverse effects of remittances. In sum, remittances
accentuate not ameliorate poverty in countries with the low level of financial development.
4.2 Return migration Following Wahba (2007), the issue of return migration is particularly interesting in the case of
Egypt. First, emigration is temporary in nature. Therefore, return migration is not necessarily
the result of failed experience overseas. Second, the purpose of emigration is employment and
not education. In other words, Egyptian migrants do not migrate to acquire higher degrees and
formal education. This allows separating the impact of overseas work experience from that of
acquisition of formal education. Third, return migrants in Egypt tend to be heterogeneous in
their educational levels which allows differentiation between the impact of overseas work
experience on educated and uneducated workers
Regarding the impact of return migration on the source country, McCormick and Wahba
(2001) studied the linkages between overseas employment and savings on one hand and
entrepreneurial activity upon return on the other hand. Using an econometric model of the
probability of being entrepreneur, they found evidence supporting the hypotheses that both
overseas savings, and the duration of stay overseas increase the probability of becoming an
entrepreneur amongst literate returnees to Egypt. Amongst illiterate returnees, overseas
savings alone increase the probability of becoming an entrepreneur. The results for literates
58
suggest that skill acquisition overseas may matter more substantially than savings in
explaining how overseas opportunities influence entrepreneurship upon return.
Wahba (2007) focused on wages of migrants after return and on how they are affected by
temporary overseas work experience and the human capital that migrants have acquired
overseas. In order to examine the extent to which temporary overseas-work experience affects
human capital and wages on return, she estimated the wage differential between the waged
employees who are return migrants and those who are non-migrants. Using data from the
1998 Egypt Labor Market Survey and the Labor Force Sample Survey, she found that
temporary migration results in a wage premium on migrants’ return. On average, return
migrants earn around 38 percent more than non-migrants.
Wahba and Zenou (2012) investigated how physical capital and social capital interact in
determining whether return migrants are more likely to become entrepreneurs than non-
migrants from Egypt. Social capital can play a role as a determinant of entrepreneurship
because entrepreneurs rely on their contacts for information and services. The life abroad
might deprive the emigrant from a part of his social capital in the source country. The results
showed that, even after controlling for the role of social capital, an overseas returnee is more
likely to become an entrepreneur than a non-migrant. Although migrants may lose their social
capital, they accumulate savings and experience overseas that increase their chances of
becoming entrepreneurs.
Marchetta (2012) examined whether returnees are able to keep their enterprises alive in
Egypt. The acquisition of skills in the host countries might improve returnees’ entrepreneurial
abilities. Moreover, their accumulated savings might not only help to pay the start-up costs
but could also loosen credit constraints. The analysis also take into account that emigrants
might lose part of the social capital and that once back home they have better opportunities as
salaried workers. As a result, they might have fewer incentives to struggle for the survival of
their enterprise. The results show that entrepreneurial activities established by Egyptian
returnees have a significantly higher probability of surviving over time than those established
by non-returnees. They also confirm the importance of the length of the migration experience
and savings as determinants of occupation choice. There is, however, a difference according
to education level: Less educated invest more. The percentage of highly educated returnees
represent 28% of those who invested in an entrepreneurial activity and 47% of those who did
not invest, with this difference being statistically significant. The data also show that the
destination matters: returnees from Europe have a higher likelihood of being entrepreneurs.
59
4.3 Other impacts So far, the reported findings dealt with the economic impacts of emigration on the origin
country. A very recent strand of the literature is now focusing on the non-economic impacts
on the origin country. Such impacts cover a wide range of dimensions including ethnic
discrimination, fertility, quality of institutions and democracy.
Fargues (2006) examined the impact of remittances on the demographic evolution of
developing countries. He explored the fertility situation of three Mediterranean countries:
Morocco, Turkey and Egypt, and found that remittances are associated with lower fertility in
the first two and higher fertility in the third one. He suggested that differences in fertility rates
in the main destination countries might be the cause of this divergent fertility behavior.
Migrants from Turkey and Morocco mostly reside in Europe where demographic transition is
complete, while Egyptian workers mainly live in the states of Persian Gulf where fertility
rates remain high.
The above findings can, however, be interpreted differently. It might not be the results of
remittances but the effect of the “culture” in the country of destination. This is referred to in
the literature as the “transfer of norms”. The relevance of international migration goes well
beyond the movement of people since it also represents a powerful mechanism to transmit
ideas and behavior across borders. Furthermore, return migration could exert an influence
because returnees could play a catalytic role, spreading changing attitudes towards fertility
also towards stayers. Beine et al. (2008) find evidence for a small positive effect of
international remittances on home country fertility. However, their study indicates a much
larger impact of the transfer of fertility norms.
Bertoli and Marchetta (2015) examined the idea of the “transfer of norms” by testing whether
a temporary migration experience in an Arab country exerts a significant influence on the
fertility choices of Egyptian households. More precisely the question is whether a returnee
from a high-fertility destination country has a larger number of children than couples of
stayers. They used the 2006 Egyptian Labor Market Panel Survey which gives the total
number of live births recorded by a couple. The results show that return migration has a
significant and positive influence on the total number of children. Egyptian couples where the
husband is returnee from an Arab country have a significantly larger number of children. The
point estimates of the impact of return migration on the total number of children in returnee
households range between 1.14 and 1.43 children. Since the average fertility rate in the
countries of destination of Egyptian migrants is between 1.04 and 1.55 children per woman,
60
Egyptian returnees seem to have a number of children closer to the norm that prevails at
destination than to the one prevailing at origin.
Beine and Sekkat (2013) focused on another dimension of the “transfer of norms”. They
examined the impact emigration on the quality of institutions in the origin country. They
found evidence that total migration affects directly the change in institutions. The impact is
positive: emigration to high institutional quality countries is associated with an improvement
in the quality of institutions in the origin country. The impact through skilled migration is
much higher. Moreover, the impact depends on the host country’s institutions. The quality of
the latter has positive and significant effects on the quality of institutions in the origin country
especially when skilled migration is considered. Overall, these results lend support to the
hypothesis of transfer of institutional norm from the host to the home country.
Beine and Sekkat (2014) addressed a similar question to the preceding paper (i.e. the
influence of international emigration on the evolution of the quality of institutions in the home
country) but focused on the potential difference in the impact depending on the status of the
destination country (i.e. former colonizer, economic power or political power). They also
examined whether the impact depends on the quality of institutions in the host country. The
results show that the status and the quality of institutions of the country of destination matter
and that while emigration to former colonizers has no effect on the quality of institutions in
the origin country, emigration to economically powerful countries (Initial members of the
OECD) or the politically powerful countries (permanent members of the Security Council of
the Unites Nations) has a positive feedback on the quality of institutions in the home country.
61
5. Conclusion Egyptian emigrants represent slightly more than 4% of the total population living in Egypt
which is far below the one in many countries in the Region. The largest share of Egyptian
emigrants is mainly located in other Arab countries. This is much higher than in other
countries in the Region. The educational profile of emigrants is different from that of non-
migrants: Migrants are generally better educated than non-migrants. The educational profile
of Egyptian migrants differs also according to the country of destination: around 71% of
Egyptians working in Arab countries had an intermediate or lower intermediate degree and
25.8% have a higher degree. In contrast, 76.2% of Egyptians migrating to the United States
have a graduate degree and 16.1% an intermediate degree. Such differences in destinations
between countries in the Region might explain a number of differences in the impact of
emigration across countries. For instance, Egyptian emigration flows fluctuated a lot due to
oil price swings, the political tensions in the region (e.g. Iraq-Iran War, the Gulf War) and the
legislation favoring nationals in Gulf countries
The motivation for emigrations can be split into three groups: individual characteristics
(Degree of education, marital status and religion), the current situation (Finding a job,
dissatisfaction with a current job and lack of confidence in the stability of Egypt) and
familiarity with migration (Exposure to other’s migration and country where relatives and
friends abroad live).
The literature points to channels through which emigration may have economic and non-
economic effects on the sending economy. The economic effects include a set of “feedback
effects” such as remittances, return migration, the creation of business and trade networks,
and the effect of migration prospects on education. The non-economic effects cover a wide
range of dimensions including ethnic discrimination, fertility, corruption, democracy and the
quality of institutions. This is referred to in the literature as the “transfer of norms” because
international migration also represents a mechanism of transmission of ideas and behaviors
across borders.
The evidence pertaining to Egypt confirms the importance of remittances for promoting
economic growth and reducing the absolute poverty but not inequality. It was also found that
remittances have a strong positive effect on attendance of university aged boys and on the
likelihood of attending school for young girls but a mild effect on school attendance of
university aged girls. Although, remittances may have some detrimental effects (e.g. income
62

without efforts and increase of the domestic workload for stayers), the findings show that the
positive effect overcompensate the negative effect. Evidence for Egypt also supports the hypotheses that both overseas savings and work
experiences increase the probability of becoming an entrepreneur amongst returnees to Egypt.
Moreover, entrepreneurial activities established by Egyptian returnees have a significantly
higher probability of surviving over time than those established by non-returnees. Although
migrants may lose their social capital, these positive effects persist. Finally, temporary
migration results in a wage premium on migrants’ return. On average, return migrants earn
around 38 percent more than non-migrants.
In terms of non-economic impacts, available evidence for Egypt shows that emigration can
affect fertility and the quality of institutions. Egyptian couples where the husband is returnee
from an Arab country have a significantly larger number of children. Emigration has also an
impact of the quality of institutions. The impact depends on the host country’s institutions.
Good quality of the host country’s institutions has positive and significant effects on the
quality of institutions in the origin country especially through skilled migration.
63

References Adams, R. H. and J. Page (2003), "Poverty, inequality and growth in selected Middle East and North Africa countries, 1980–2000", World Development, 31:12, pp. 2027-2048.
Amer, M. and Ph. Fargues (2014), “Labor Market Outcomes and Egypt’s Migration Potential”, European University Institute, No. 2014/55.
Bertoli, S. and F. Marchetta (2015), "Bringing It All Back Home–Return Migration and Fertility Choices", World Development, 65, pp. 27-40.
Bhagwati, J. and K. Hamada (1975), “Domestic distortions, imperfect information and the brain drain”, Journal of Development Economics, 2:3, pp. 265-279.
Billmeier, A. and I. Massa (2009), “What drives stock market development in emerging markets: institutions, remittances or natural resources?”, Emerging Markets Review, 10, pp. 23-35.
Docquier, F. and Kh. Sekkat (2006), "The brain drain: what do we know?" Agence Française de Développement, Département de la Recherch, Paris
Elbadawy, A. and R. Roushdy (2009), "Impact of international migration and remittances on child schooling and child work: The case of Egypt", Paper for the World Bank’s MENA International Migration Program funded by the European Commission, World Bank, Washington, DC
Elseoud, M. S. A. (2014), "Do Workers' Remittances Matter for the Egyptian Economy?", International Journal of Applied Operational Research, 4:1; pp. 1-26.
Koska, O. A., P. Ö. Saygin, S. Çağatay and A. Artal-Tur (2013), “International migration, remittances, and the human capital formation of Egyptian children”, International Review of Economics and Finance, 28, pp. 38-50.
Marchetta, F. (2012), “The Impact of Migration on the Labor Markets in the Arab Mediterranean Countries”, Middle East Development Journal, 4:1.
Sharaf, M. F. (2014), "The Remittances-Output Nexus: Empirical Evidence from Egypt." Economics Research International Economics, Article ID 965240, http://dx.doi.org/10.1155/2014/965240
Wahba, J. (2010), “Labor Markets Performance and Migration Flows in Egypt”, National Background Paper, European Commission, Occasional Paper 60, Volume III.
Wahba, J. (2014), “Through the Keyhole: International Migration in Egypt”, Economic Research Forum Working Paper 830.
Wahba, J. and Y. Zenou (2012), “Out of sight, out of mind: Migration, entrepreneurship and social capital”, Regional Science and Urban Economics, 42:5, pp. 890-903.
64

Chapter 4: Labor regulations, trade unions and workers
1. Introduction Almost all countries have a system of laws and institutions intended to protect the interests of
workers. This system covers three fields of the labor market: employment, collective
bargaining and social security. Employment laws govern the individual employment contract.
Collective bargaining concerns the negotiation, adoption, and enforcement of agreements
between groups of workers and employers. It also covers organization of trade unions and
their actions. Finally, social security laws deal with responses to social needs and conditions
such as sickness, pension, disability, unemployment, and maternity (Botero et al. 2004).
The impacts of such a system on the economy oppose two different views. One view sees
such arrangements as providing important social protection for workers as well as an
instrument conductive to economic performance. The other view, considers that such
regulations impede adjustments to economic shocks, discourage hiring, and favor “insiders”
(Betcherman et al. 2001). They are also seen as obstacles to the development of the
manufacturing sector in many developing countries. However, the empirical support to each
view is mixed and doesn’t allow a clear cut conclusion. Many studies failed to find an
association between labor market laws and employment outcomes while others find that
stricter labor market laws are associated with lower employment (Diego et al. 2010)
The issue is particularly relevant for Egypt; a country lagging in term of industrialization and
exhibiting weak economic performance. Such outcomes are attributed by some observers to
institutional constraints that have hampered the activities of the private sector in general, and
the private manufacturing sector in particular. Among these constraints, the most cited are
financial sector policies, tax administration, energy policies, labor market regulation and
bureaucratic systems. Note, however, that these problems are not specific to Egypt. They are
widespread among many developing countries, particularly among those that followed import
substitution industrialization (Getachew and Sickles, 2007).
The purpose of this chapter is to examine the labor market regulations and institutions in
Egypt. This will be accomplished in four Sections. The next section focuses on labor
regulations. Section 3 presents the framework for the functioning of labor unions. Section 4
concludes.
65

2. Labor regulations
2.1 Brief history Until 2003, labor market regulation in Egypt was governed by Law 137 (enacted in 1981) and
its numerous decrees of application. The law guaranteed a number of protections to workers
which have subsequently been considered as too rigid for the private sector to develop
adequately. For instance, the lifetime job security for workers was protected and required a
written contract specifying the nature of the work and the agreed compensation. After the
three-month probationary period, the worker cannot be dismissed as long as the contract
remains in effect. Temporary contracts automatically become permanent if renewed after the
initial contract expires. Dismissal is allowed only following complex and costly procedures in
cases of severe offenses, which include adopting a false identity or committing a ‘grave’ error
(Getachew and Sickles, 2007).
By the early 1990s, Egypt, like many developing countries initiated a structural adjustment
program aiming at orienting the planned economy towards a market-based one. Reforms
encompassed macro-economic stabilization, trade liberalization, the ease the bureaucratic
burden and labor laws. In 1991, the government set up a committee, composed of
representatives of the only existing labor union, business, Ministry of Labor, legal
communities and the ILO, in order to draft new labor legislation. In 1994 a draft was agreed
on but it was submitted to Parliament and passed only in 2003. The new law has, in particular,
altered the practice of tenured employment. It allows employers to engage workers
indefinitely on “temporary” fixed-term contracts and to dismiss them at the termination of
those contracts at their sole discretion (Beinin, 2012).
2.2 The current situation At present, the main rules pertaining to the Labor market are in the Labor Law No. 12/2003
and the Relief Fund Law No 156/2002. Regarding social security, the main law is the Social
Insurance Law No 79/75. In general all laws governing employment contracts must
incorporate ILO conventions and recommendations. There are Core ILO conventions and
other ILO conventions. Among the MENA 18 countries, only seven, including Egypt, have
ratified all ILO core Conventions. Regarding the other ILO Conventions, Egypt is the only
66

MENA country which has ratified all of them; 63. The main rules governing labor contracts
are summarized in Table 1.
67

Table 1: Main labor regulations
Regulations on Fixed-Term Contracts (FTC)
FTC prohibited for a permanent task
Maximum duration of a FTC, not including any renewals
Rules for renewing a FTC beyond the original maximum
term
Maximum cumulative duration of a FTC relationship including
all renewals
Maximum duration of a FTC (in months), not including any
renewals No No limit, but employee may
terminate after 5 years No limit No limit No
Regulation on Minimum Wages (MW)
MW for a 19-year-old Worker in his/her first job? Ratio of MW to Average Wage
Agreement by the parties (in practical terms, 165 L/month) 11%
Regulation Concerning Standard Workdays and Overtime.
The length of the standard work day?
Maximum overtime limit in normal circumstances
Premium for overtime work Days in the typical work week in manufacturing
Maximum number of working hours allowed in a day
8 hours 2 hrs./day 35% during the day; 70% for the night
5 or 6 10
Regulation Concerning Standard Workdays and Overtime (Continued)
Maximum number of working days per week
The workweek for a single worker can extend to 50 hours per week for 2 months/year to respond to
a seasonal increase in production?
Mandatory pay premium for night work (% of salary)
Mandated decreased shift time for night work
6 Yes No No
Regulation Concerning Rest and Vacations
Minimum number of hours of rest required by law between workdays?
Legally defined specific weekly rest day? Mandatory paid annual vacation (in working days) after 20 years of continuous employment?
14 N/A 30
Regulation on Maternity Leave Maternity protection under Law No 12, of 2003, covers women working in the Private Sector. Women civil servants, household workers, members of the employer's family and agricultural workers are excluded from the scope of application of this law. Civil servants and workers employed by public sector bodies are covered by
separate legislation. A woman worker may not obtain maternity leave more than twice throughout her period of employment Maternity Leave Normal duration
Compulsory leave
Financing of benefits
Maternity Leave Extension Non-discrimination and employment security
90 days taken before or after confinement
45 days after confinement
Social security and the
employer
A woman working in an enterprise employing 50 workers or more may obtain 2 years' unpaid leave to care for her child (optional
maternity leave). This leave is only granted twice during her period of employment. Civil servants may take this type of leave three
times during the entire period of employment.
N.A.
Regulation Concerning Dismissal of Redundant Worker
An employer can terminate the employment contract of a worker on the basis of redundancy
The employer must notify a third party before dismissing one
redundant worker
The employer needs the approval of a third party in order to dismiss one redundant worker
The employer must notify or consult a third party before
dismissing a group of 9 redundant workers
Yes Yes, both notify and consult Yes Yes, both notify and consult
Regulation Concerning Dismissal of Redundant Worker (Continued)
There is a retraining or reassignment obligation before an employer can make a worker redundant
There are priority rules that apply to redundancy dismissals or lay-offs
There are priority rules that apply to re-employment?
No Yes No
Regulation Concerning Firing Costs Legal notice
Period for redundancy dismissal after 20 years of continuous employment
Severance pay formula? Severance pay for dismissal after 20 years of continuous employment?
1 months for employees, workers and laborers; Since a small scale redundancy is not allowed, there is no legally specified severance formula. The severance requirement for a collective dismissal is 1 month for each of
the first 5 years and 1.5 months for any years beyond 5.
27.5 months
Unemployment Protection Regimes
The country has an unemployment protection scheme
Funding of the unemployment protection scheme
Amount and duration of the unemployment benefit
Yes The employer at the rate of 2% of the wages of the insured
persons
60% of the last wage of the insured person. The indemnity shall continue to be paid to the insured person until the day preceding the date of his being engaged in an
employment or for a period of 16 weeks whichever is earlier. This period shall be extended to 28 weeks if the contribution period to this insurance exceeds 24 months. The indemnity shall also be paid during the period of vocational training determined
by the Manpower office Source: Adapted from Angel-Urdinola and Kuddo (2010)
68

Compared to other countries in the Region, Egypt presents some specificities. It is with
Algeria, Iran, and Kuwait the only country having an unemployment insurance (UI).
However, the system is not fully utilized. In Egypt, for instance, during the period 2001-07
less than 350 people per year received the benefits (Angel-Urdinola and Kuddo, 2010). The
reasons are, among others, a lack of public awareness about UI, restrictive eligibility
conditions and the difficulty of documenting a “just-cause” firing decision.
Egypt is also among the half of the countries in the MENA having set a minimum wage. In
cases where many firms have “monopsonistic” power on the labor market and workers have
low mobility minimum wages are particularly useful. This is the case in Egypt where, for
instance, unemployment rates vary highly across governorates (form less than 5% Luxor,
Fayoum and Suhag to 16% in Dakhalia). In spite of this, workers, especially women, don’t
seem to move to better from worse performing locations in order to seek better job
opportunities (Angel-Urdinola and Kuddo, 2010). Note, however, that like in many MENA
countries sanctions for non-compliance with minimum wage rules exist but are weakly
enforced.
In terms of annual leave, Egypt is among the most generous countries in the MENA; up to 30
working days. The shortest mandatory annual leave is in Lebanon; 5 working days. This is the
minimum recommended by the ILO Convention. As a matter of comparison, mandatory paid
annual leave in the private sector firms varies between 20 and 25 working days in European
countries (Kuddo, 2009).
Like most MENA countries, Egypt offers maternity leave but it is among the least generous;
90 days taken before or after confinement with 45 compulsory days after confinement. In
contrast, maternity leave is 14 weeks in Algeria and Morocco. The shortest duration is in
Tunisia (30 days). Moreover, Egypt has established certain restrictions on maternity leave.
For example, a woman may not obtain maternity leave more than twice throughout her period
of employment.
The termination of workers due to redundancy is authorized but with some restrictions.
Employers should notify and seek approval of a third party regarding individual dismissals.
There are also priority rules for re-employment. Moreover, an employer is required to give 3
months’ notice before a redundancy termination, and the severance pay for a worker with 20
years of service equals 27.5 months of wages. While in most MENA countries, advance
notice is in general one month, it is three months in Egypt.
69

Finally, Egypt is less restrictive on working hours than other countries in the Region. It does
not impose restrictions on night work or on weekly holiday work. It allows 6-day workweeks
and permits 50-hour workweeks for 2 months
2.3 Application of the rules While these regulations might seem very constraining to firms, they are applied and enforced
differently in different countries. For instance, in some countries (Jordan, Egypt), labor
regulations in special economic zones are applied separately from national labor laws.
It remain however, that in some countries (mainly Lebanon, Oman, Syria, and Egypt), labor
regulation is perceived by firms as a major constraint, while in other countries like Jordan,
Algeria, Morocco, and West Bank and Gaza this is true to a lesser extent. In Egypt, according
to the 2008 Investment Climate Assessment (ICA) survey, labor regulations and mandatory
contributions appear as major constraints, limiting formal employment for many enterprises.
Manufacturing firms, service firms, and hotels reported that they would hire respectively a net
of 21 percent, 9 percent, and 15 percent more workers if there were no restrictions to hiring
and firing workers (Angel-Urdinola and Kuddo 2010).
To assess the real strength of the constraints of the labor regulation, Angel-Urdinola and
Kuddo, (2010) present a series of widely used indexes. The Employing Workers index (EWI,
A higher value of the index suggests more rigidity in the labor law) shows that Egypt (and
also Lebanon, Jordan, Yemen, Iraq, Iran, Syria, and West Bank Gaza), is aligned to
international benchmarks in other developing regions such as Latin America and South Asia).
The index is higher in Tunisia, Algeria, and Morocco.
Another useful index is the Difficulty of Hiring Index (DHI). This index is low in Egypt as
well as in Iran, Syria, and Jordan. In Algeria, Lebanon, Djibouti, and Morocco, the DHI is
high by regional and international benchmarks.
The “Rigidity of Hours Index” (HDI) indicates that the HDI in MENA is lower than that in
OECD, ECA, and Sub-Saharan African, close to that in LAC, and higher than that in South
and East Asia. Within MENA, the HDI is low in Lebanon, Syria, Jordan, and Kuwait and
aligned to international standards in Egypt, Qatar, United Arab Emirates, Yemen, Iran, and
Iraq. In Oman, Saudi Arabia, WBG, Algeria, Djibouti, and Morocco, the DHI is high
compared to regional and international benchmarks (suggesting more rigid regulation).
Finally, the “Difficulty of Redundancy Index” (DRI) reflects the extent to which regulation
restrain firing. It is based on the requirements of notifications/justifications for dismissal, the
70
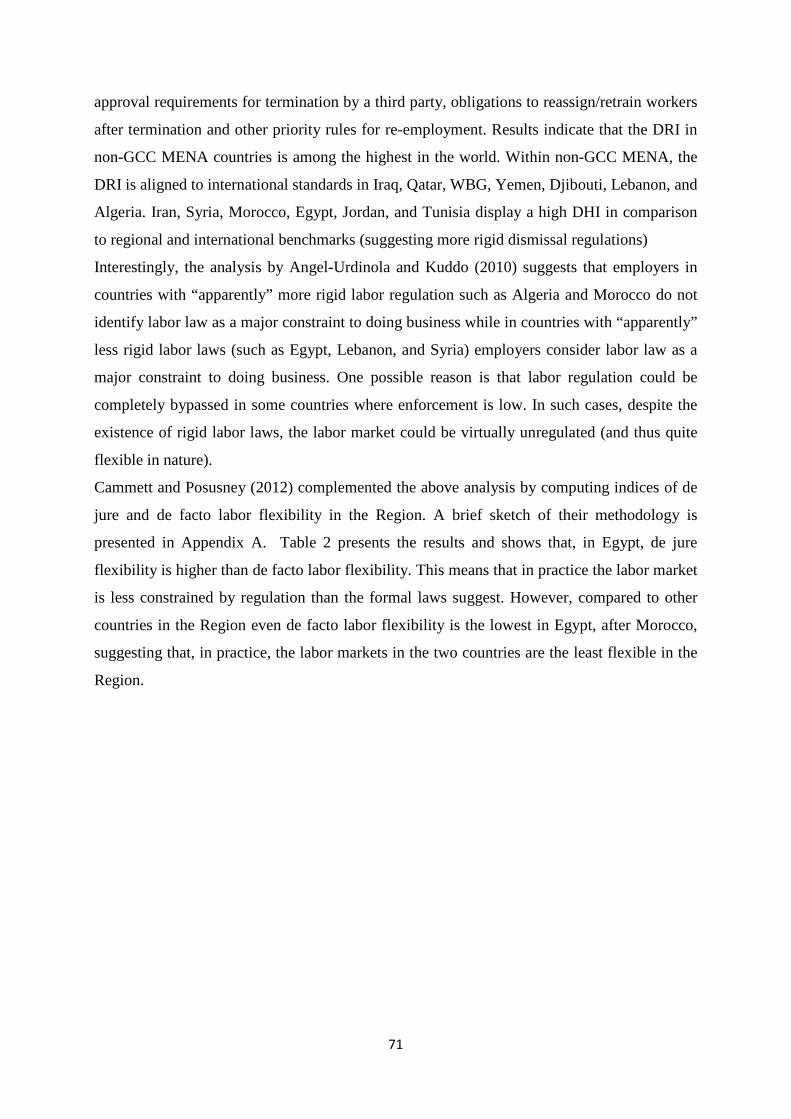
approval requirements for termination by a third party, obligations to reassign/retrain workers
after termination and other priority rules for re-employment. Results indicate that the DRI in
non-GCC MENA countries is among the highest in the world. Within non-GCC MENA, the
DRI is aligned to international standards in Iraq, Qatar, WBG, Yemen, Djibouti, Lebanon, and
Algeria. Iran, Syria, Morocco, Egypt, Jordan, and Tunisia display a high DHI in comparison
to regional and international benchmarks (suggesting more rigid dismissal regulations)
Interestingly, the analysis by Angel-Urdinola and Kuddo (2010) suggests that employers in
countries with “apparently” more rigid labor regulation such as Algeria and Morocco do not
identify labor law as a major constraint to doing business while in countries with “apparently”
less rigid labor laws (such as Egypt, Lebanon, and Syria) employers consider labor law as a
major constraint to doing business. One possible reason is that labor regulation could be
completely bypassed in some countries where enforcement is low. In such cases, despite the
existence of rigid labor laws, the labor market could be virtually unregulated (and thus quite
flexible in nature).
Cammett and Posusney (2012) complemented the above analysis by computing indices of de
jure and de facto labor flexibility in the Region. A brief sketch of their methodology is
presented in Appendix A. Table 2 presents the results and shows that, in Egypt, de jure
flexibility is higher than de facto labor flexibility. This means that in practice the labor market
is less constrained by regulation than the formal laws suggest. However, compared to other
countries in the Region even de facto labor flexibility is the lowest in Egypt, after Morocco,
suggesting that, in practice, the labor markets in the two countries are the least flexible in the
Region.
71
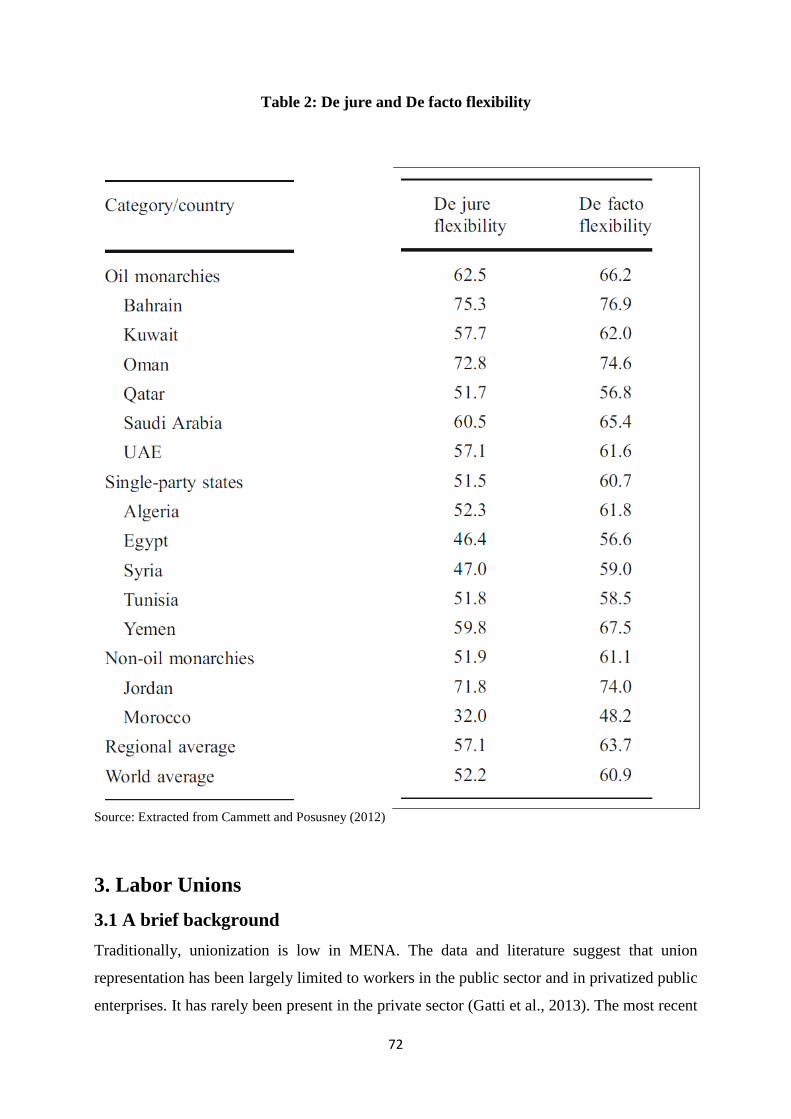
Table 2: De jure and De facto flexibility
Source: Extracted from Cammett and Posusney (2012)
3. Labor Unions 3.1 A brief background Traditionally, unionization is low in MENA. The data and literature suggest that union
representation has been largely limited to workers in the public sector and in privatized public
enterprises. It has rarely been present in the private sector (Gatti et al., 2013). The most recent
72

estimates of union density and collective bargaining coverage in different countries are
presented in Table 3. In term of density, Egypt stands in the middle of the ranking with a rate
(16.1%) higher than in some developing countries (Colombia, Nicaragua, El Salvador and
Costa Rica) but also lower than in others (Brazil, Syria and Guatemala). In term of collective
bargaining coverage, Egypt ranks fifth (2.1%) out of the 24 countries in the Table. It is far
behind Mexico, Chile and Costa Rica (more than 9%).
Table 3: Trade union density and collective bargaining coverage 2007 - 2010 Density ( % of total employment) Bargaining coverage ( % employment)
Brazil 17.8 Australia 34.7 Colombia 2.2 Austria 79.4 Costa Rica 10.3 Canada 26.4 Cyprus 55.1 Chile 9.8 Egypt 16.1 Costa Rica 11.8 El Salvador 8.1 Egypt 2.1 Germany 16.2 El Salvador 2.5 Guatemala 34 Finland 67.8 Nicaragua 3.4 Germany 54.6 Norway 65.2 Italy 73.6 Spain 15.7 Luxembourg 60.7 Sweden 74.8 Mexico 9 Switzerland 17.7 Nicaragua 3.5 Syria 19.4 Niger 0.2 United Kingdom 24.5 Paraguay 1.2 Peru 2.4 Philippines 0.6 Portugal 25.8 Sierra Leone 3.5 Spain 61.2 Switzerland 39.8 United Kingdom 32.2 United States 12.3 Venezuela 4.7
Source: Adapted from Hayter and Stoevska (2011).
In a large majority of Arab countries, labor unions acted as an explicit partner in state-led
industrialization and modernization. Table 4 shows that there is a single union per country
except for Morocco (three unions). Again except for Morocco, the single union is affiliated or
assimilated to a party which is, in general, the single and ruling party. In Egypt workers had
no representation in the union’s structures which were composed of only bureaucratic figures
in charge of stabilizing the political and economic regimes. The Ministry of Manpower also
served as head of the national trade union’s confederation (Gatti et al., 2013).
73

Table 4: Structure of labor unions
Source: Gatti et al. (2013). Note: “a” Describes the setup before the revolution in the Arab Republic of Egypt and Tunisia and regime change in Iraq.
Since 1957 the state-sponsored Egyptian Trade Union Federation (ETUF) has been the sole
legal trade union federation in Egypt, a status formalized in Law 35 of 1976. In the 2000s,
ETUF claimed a membership of 3.8 million out of a waged labor force of about 27 million.
Almost all its members work in the government or public business sectors. The ETUF’s
structure is based on the dominance of the public sector (Beinin, 2012). With the uprising
against the Mubarak regime, some 1,000 new unions independent of the ETUF have been
lunched (Beinin, 2013). Many of them are affiliated with one of the two new federation: the
Egyptian Federation of Independent Trade Unions (EFITU) or the Egyptian Democratic
Labor Congress (EDLC).
3.2 Legal framework for unions The International Trade Union Confederation (ITUC, 2014) points to the following set of legal
provisions that constrain labor union activity in Egypt:
1. Freedom of association and organization
a. Restrictions on workers' right to form and join the union of their choice. The law
imposes a system of trade union monopoly where workers do not have the right
to establish occupational organizations outside the existing trade union structure.
In the case of liberal professions, the Constitution allows the establishment of
only one trade union per profession.
b. Restrictions on trade unions' right to organize their management: Restrictions
on the right to elect representatives and to self-administer in full freedom. The
government can request the removal of the executive committee of a trade union
74

if it has provoked work stoppages or absenteeism in a public service or
community services. Also the union cannot freely organize activities and
formulate programs.
2. Collective bargaining
a. Restrictions on the free and voluntary bargaining: these include the requirement
of authorities' approval of freely concluded collective agreements and
compulsory conciliation and /or binding arbitration procedure in the event of
disputes during collective bargaining. The authorities or employers have also
the power to unilaterally annul, modify or extend content and scope of
collective agreements.
b. Limitations or ban of collective bargaining in certain sectors: Public servants of
the state agencies including the local governments do not have the right to
collective bargaining. Domestic and similar workers and workers who are
members of the employer’s family and dependent upon the latter do not have the
right to collective bargaining.
3. Strikes
a. There are barriers to lawful strike actions such as undue, unreasonable or
unjustified prerequisites. Workers must obtain the prior approval of the
Confederation of Trade Unions for the organization of strike actions.
b. There are excessive civil or penal sanctions for workers and unions involved in
non-authorized strike actions. Workers who have participated in legitimate
strike action can be penalized on the grounds that the strike notice did not
specify the duration of the strike.
c. There are also limitations or ban of strikes in certain sectors. Public servants in
state agencies including local public administrations and public authorities, do
not have the right to strike. Discretionary determination or excessively long list
of "essential services" in which the right to strike is prohibited or severely
restricted. The law provides for recourse to compulsory arbitration in services
which are not essential in the strict sense of the term. Specific limitations
concern the EPZ. Domestic and similar workers and workers who are members
of the employer’s family and dependent upon the latter do not have the right to
strike.
75
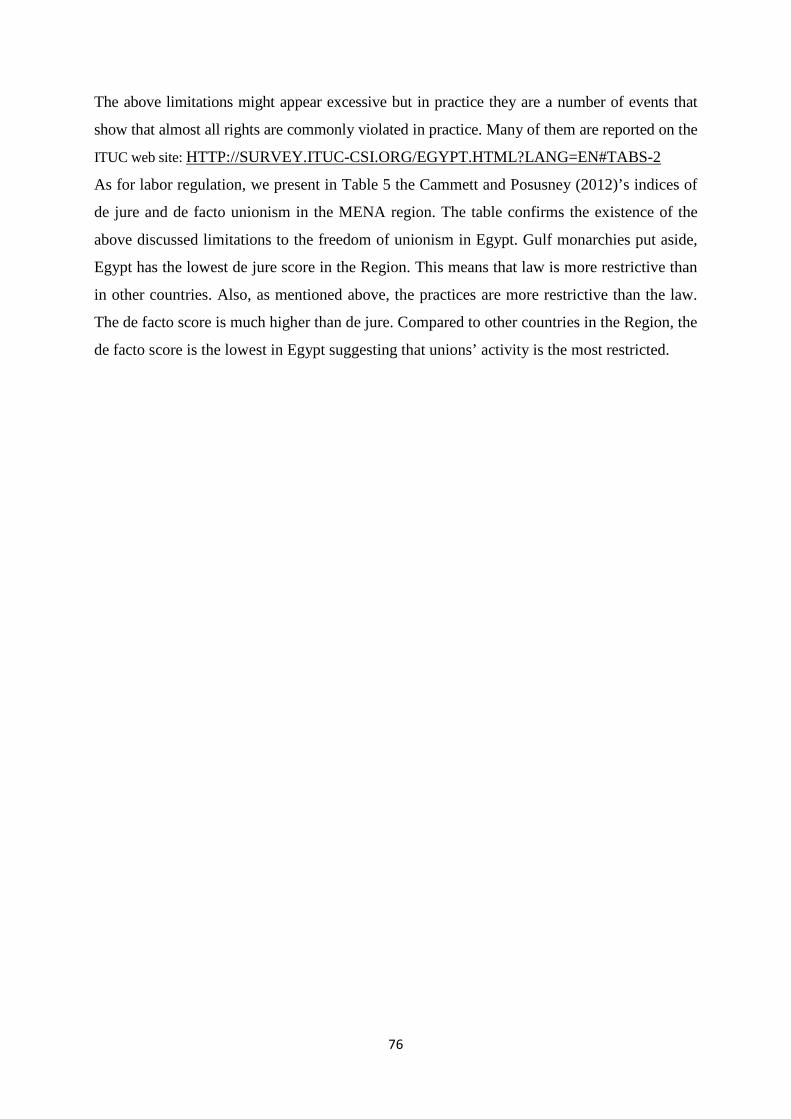
The above limitations might appear excessive but in practice they are a number of events that
show that almost all rights are commonly violated in practice. Many of them are reported on the
HTTP://SURVEY.ITUC-CSI.ORG/EGYPT.HTML?LANG=EN#TABS-2 ITUC web site:
As for labor regulation, we present in Table 5 the Cammett and Posusney (2012)’s indices of
de jure and de facto unionism in the MENA region. The table confirms the existence of the
above discussed limitations to the freedom of unionism in Egypt. Gulf monarchies put aside,
Egypt has the lowest de jure score in the Region. This means that law is more restrictive than
in other countries. Also, as mentioned above, the practices are more restrictive than the law.
The de facto score is much higher than de jure. Compared to other countries in the Region, the
de facto score is the lowest in Egypt suggesting that unions’ activity is the most restricted.
76
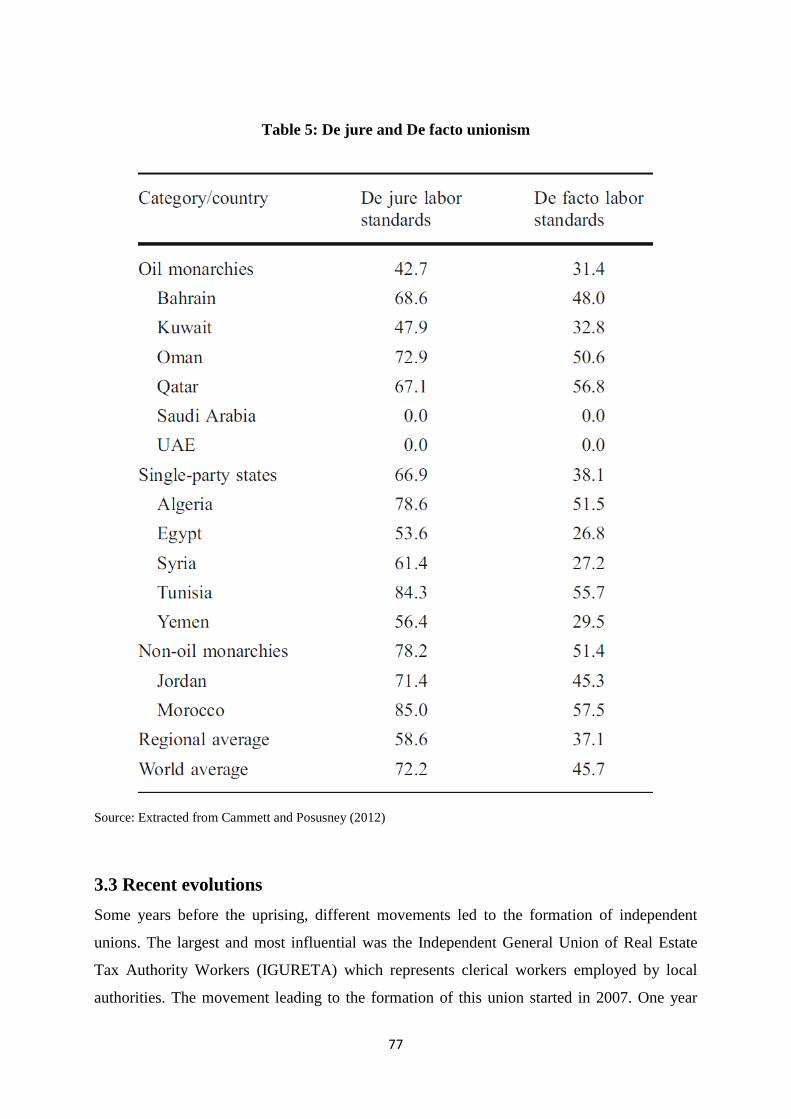
Table 5: De jure and De facto unionism
Source: Extracted from Cammett and Posusney (2012)
3.3 Recent evolutions Some years before the uprising, different movements led to the formation of independent
unions. The largest and most influential was the Independent General Union of Real Estate
Tax Authority Workers (IGURETA) which represents clerical workers employed by local
authorities. The movement leading to the formation of this union started in 2007. One year
77

later, over 30,000 of some 50,000 concerned clerical workers joined the new union. Although
illegal, the Ministry of Manpower recognized the new union in 2009. Two independent unions
of health-care technicians and teachers were also founded before the end of 2010.
IGURETA and the independent unions of health-care technicians and teachers initiated a new
federation (Federation of Independent Trade Unions, EFITU). The formation of the EFITU
was announced on January 2011. The original founders were joined by the retirees’ association
and representatives of textile, pharmaceutical, chemical, iron and steel, and automotive
workers from industrial zones in Cairo, Helwan, Mahalla al-Kubra etc. The EFITU claims a
membership of about 200 unions and 2 million blue and white collar workers. EFITU has been
most successful among public service workers and is relatively weaker in the manufacturing
sector (Beinin, 2012).
The Egyptian Democratic Labor Congress (EDLC) was formally established in 2011 as an
independent trade union federation with a reported membership of 186 unions. It was founded
by the president of the NGO CTUWS and former labor leader at the Helwan Iron and Steel
factory (Abdalla, 2012). The CTUWS is the Center for Trade Unions and Workers’ Services, a
well-known Egyptian NGO defending labor rights since 1999. It has always played an important
role in supporting labor leaders legally and technically. The CUTWS thinks that the process
of transformation has to come as a result of a longer-term integration process as guarantee for
the new institution’s efficiency. Today, it is working on transforming the EDLC into a
sustainable federation.
The two new federations (EFITU and EDLC) differ with regard to their strategic and
organizational visions and on their views regarding political involvement. Contrary to EFITU,
the EDLC does not consider itself a federation of trade unions but rather a labor-oriented
coalition of local trade unions. It pursues an educational “bottom-up” approach based on the
“virtue” of teaching workers about democratic trade unionism as a long-term guarantee for a
sustainable and effective institutionalization of labor representation. In contrast, EFITU is
officially labeled as a federation with institutional and legal competence for the political
representation of labor. It has a “top-down” approach for the promotion of workers’ interests
and seeks a role in the political arena. It is also hierarchically organized and has a centralized
internal structure. To raise its political leverage, EFITU seeks to incorporate as many of the
newly founded trade unions as possible into the federation and is trying to become more
integrated into the political arena. Table 5 shows that while the old ETUF has the largest share
of the labor force, the share of the new EFITU is significant.
78
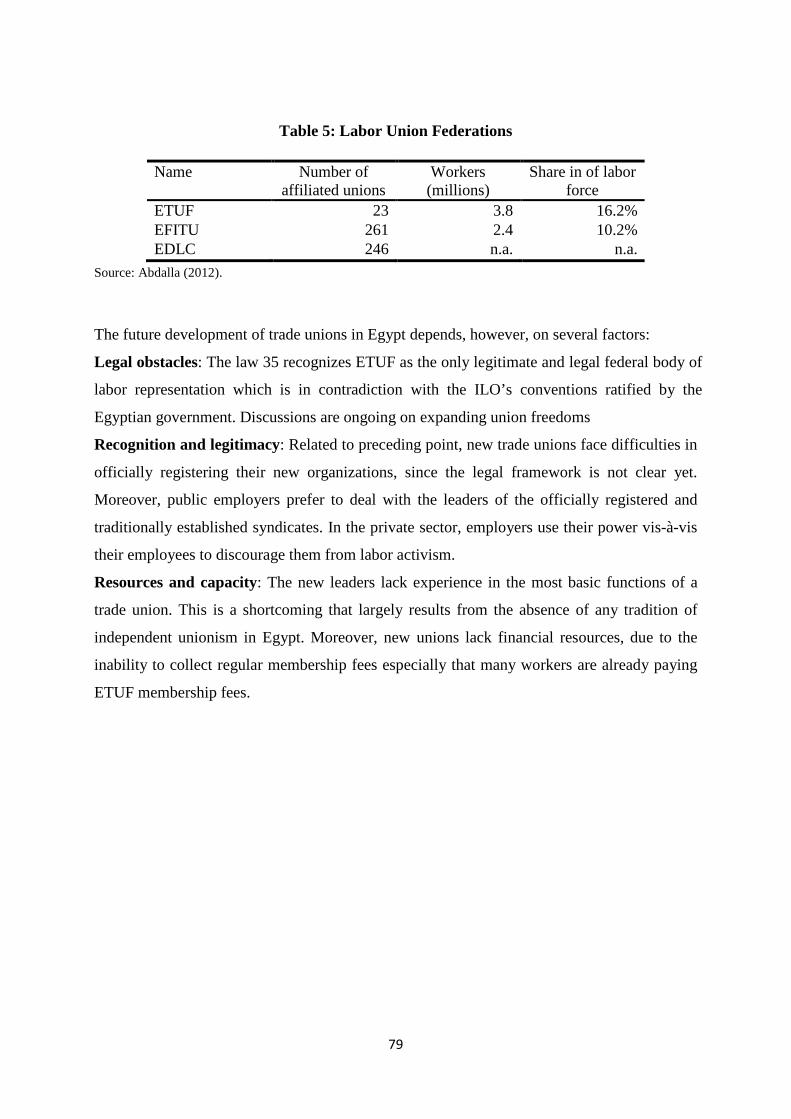
Table 5: Labor Union Federations
Name Number of affiliated unions
Workers (millions)
Share in of labor force
ETUF 23 3.8 16.2% EFITU 261 2.4 10.2% EDLC 246 n.a. n.a.
Source: Abdalla (2012).
The future development of trade unions in Egypt depends, however, on several factors:
Legal obstacles: The law 35 recognizes ETUF as the only legitimate and legal federal body of
labor representation which is in contradiction with the ILO’s conventions ratified by the
Egyptian government. Discussions are ongoing on expanding union freedoms
Recognition and legitimacy: Related to preceding point, new trade unions face difficulties in
officially registering their new organizations, since the legal framework is not clear yet.
Moreover, public employers prefer to deal with the leaders of the officially registered and
traditionally established syndicates. In the private sector, employers use their power vis-à-vis
their employees to discourage them from labor activism.
Resources and capacity: The new leaders lack experience in the most basic functions of a
trade union. This is a shortcoming that largely results from the absence of any tradition of
independent unionism in Egypt. Moreover, new unions lack financial resources, due to the
inability to collect regular membership fees especially that many workers are already paying
ETUF membership fees.
79
4. Conclusion
The system of laws and institutions governing the labor markets aims at protecting workers
and organize their relationships with employers. Some view such systems as beneficial to
both workers and employers while others consider that such systems impede adjustments to
economic shocks, discourage hiring and constitute an obstacle to the development of the
manufacturing sector in developing countries. However, the empirical support to each view is
mixed and doesn’t allow a clear cut conclusion.
This paper examines the system of laws and institutions governing the Egyptian labor market.
The country is lagging in term of industrialization and exhibiting weak economic performance
which some observers attribute to institutional constraints, including labor market rules, that
have hampered the activities of the private sector in general, and the private manufacturing
sector in particular.
The analysis has shown that in the framework of the structural adjustment program the
country has adopted important reforms especially regarding the labor market. The old law (of
1981) which guaranteed a number of protections to workers but considered as too rigid for the
private sector has been replaced by a new one in 2004. The new law has, in particular, altered
the practice of tenured employment, allowed employers to engage workers indefinitely on
“temporary” fixed-term contracts and to dismiss them at the termination of those contracts.
Comparison to the laws in other MENA countries shows that the new law is, in a majority of
cases, more restrictive to employers. However, looking at the situation in practice suggests
that the enforcement of such provisions is not that stringent and leaves room for a non-
negligible degree of flexibility.
One important aspect of the labor market institutions is the freedom to create and operate a
labor union. In this respect, Egypt is very restrictive. Until the late 2000s, representation of
workers was, by law, the monopoly of one union: The Egyptian Trade Union Federation
(ETUF). The latter is affiliated to the ruling party and its leaders were composed of only
bureaucratic figures with no representatives of workers. By now, two independent unions
have been created: The Federation of Independent Trade Unions (EFITU) and the Egyptian
Democratic Labor Congress (EDLC). However, further development and independence of
unionism in Egypt could be hampered by a number of obstacles being legal (The law still
recognizes only ETUF), operational (new trade unions face difficulties in officially
registering, public employers prefer to deal with the leaders of the ETUF and private
80

employers discourage workers from labor activism) or financial and human (leaders’ lack of
experience and inability to collect regular membership fees).
81

Appendix A: Calculation of the jure and the de facto indices (Source: Stallings, 2010)
De jure labor standards (DJLS) are estimated by evaluating national labor legislation with
respect to 17 indicators pertaining to freedom of association, the right to bargain collectively,
and the right to strike. The authors consulted labor law texts, ICFTU Annual Reports, US
State Department Annual Human Rights Reports, ILO Committee on Freedom of Association
reports, and other secondary sources to determine scores. The formula used to calculate the
index is the following:
DJLS= 100 - {[(FA + CB + RS)/35]*100}
where FA is freedom of association, CB is collective bargaining and RS is right to strike. The
method for calculating FA, CB and RS varies depending on whether a country has
prohibitions in these areas or not. In cases of general prohibitions, the weighted value of each
score is as follows:
1. FA=15
2. CB=10
3. RS=10
In cases of no general prohibitions, the weighted value of each score is determined by the sum
of the specific violations.
To assess de facto labor standards (DFLS), the authors incorporate indicators for rule of
law, associational and organizational rights, and observed violations. The formula used to
calculate the index is:
DJLS= 100 - {[(FA + CB + RS + VIOL + ROLW + AOR)/45.83]*100}
where VIOL is the sum of violations of labor rights, ROLW is the World Bank indicator for
rule of law rescaled and AOR is the Freedom House indicator of Associational and
Organization Rights rescaled. As with DJLS, the raw scores are adjusted to a 0–100 scale with
higher scores reflecting stronger labor standards.
82
References
Abdalla, N. (2012), "Egypt's Workers-From Protest Movement to Organized Labor" Stiftung Wissenschaft Und Politik German Institute for International and Security Affairs 32.2012.
Angel-Urdinola D. F. and A. Kuddo (2010), “Key Characteristics of Employment Regulation in the Middle East and North Africa”, The World Bank. http://siteresources.worldbank.org/SOCIALPROTECTION/Resources/SP-Discussion-papers/Labor-Market-DP/1006.pdf
Beinin, J. (2012), “The Rise of Egypt's Workers”, Carnegie Endowment for International Peace.
Beinin, J. (2013), “Workers, Trade Unions and Egypt's Political Future”, Middle East Research and Information Project. http://www.merip.org/mero/mero011813
Betcherman, G. A. Luinstra and M. Ogawa (2001), "Labor market regulation: international experience in promoting employment and social protection", World Bank, Social Protection Discussion Paper Series 128.
Botero, J. C., S. Djankov, R. La Porta, F. Lopez-de-Silanes and A. Shleifer, A. (2004), “The Regulation of Labor”, Quarterly Journal of Economics, 119:4, pp. 1339-1382.
Cammett, M. and M. P. Posusney (2010), "Labor standards and labor market flexibility in the Middle East: free trade and freer unions?", Studies in Comparative International Development 45.2, pp. 250-279.
Gatti, R., M. Morgandi, R. Grun, S. Brodmann, D. Angel-Urdinola, J. M. Moreno, D. Marotta, M. Schiffbauer and E. M. Lorenzo (2013), “Jobs for shared prosperity: time for action in the Middle East and North Africa”, The World Bank.
Getachew L. and R. C. Sickles (2007), "The policy environment and relative price efficiency of Egyptian private sector manufacturing: 1987/88–1995/96", Journal of Applied Econometrics, 22:4, pp. 703-728.
Hayter, S. and V. Stoevska (2011), “Social Dialogue Indicators: International Statistical Inquiry 2008-09”, Technical Brief, ILO
International Trade Union Confederation (ITUC): HTTP://SURVEY.ITUC-CSI.ORG/EGYPT.HTML?LANG=EN#TABS-2, visited: 18 February 2014
Kuddo, A. (2009); “Labor Laws in Eastern European and Central Asian Countries: Minimum Norms and Practices”, SP Discussion Paper No. 0920, The World Bank.
Stallings, B. (2010), “Globalization and Labor in Four Developing Regions: An Institutional Approach”, Studies in Comparative International Development, 45:2, pp. 127-150
Wahba, J. and R. Assaad (2015), “Flexible Labor Regulations and Informality in Egypt”, Economic Research Forum, Working Paper 915
83

Chapter 5
Trade Agreements
1. Introduction Egypt is part of a number trade agreements. It is a contracting party to the GATT since 1970
and a WTO member since 1995. As such it participates actively in the multilateral trading
system. It grants at least MFN treatment to its entire WTO trading partners. Egypt has also
signed the Greater Arab Free Trade Area (GAFTA) program in 1997. The GFTA aims at
facilitating and developing trade among Arab countries. This agreement which entered into
force on 1 January 1998 is considered as the new driver of Arab economic integration. In
2004, Egypt signed the so-called Agadir Agreement with Jordan, Morocco, and Tunisia which
targets faster and larger implementation of integration than under the GAFTA.
As regards the EU, the first Cooperation Agreement between the EC and Egypt was signed in
1977. In June 2001, the Association Agreement between the EU and Egypt was signed. It
came into force in 2004. The EU and Egypt signed also in November 2010 a protocol
establishing a dispute settlement mechanism. Bilateral negotiations on liberalization of trade
in services and establishment are also taking place. Following exploratory discussions in
2012, a dialogue on the Deep and Comprehensive Free Trade Area (DCFTA) was launched in
June 2013. It is worth noting that although any Euro-Mediterranean Association Agreement
signed by the EU and its Mediterranean partners is agreed on a bilateral basis, the EU pays
particular attention to measures which can enhance regional economic integration, and in
particular the process launched among the four Southern Mediterranean partners in the
framework of the Agadir agreement.
In July 1999, Egypt and the United States signed a Trade and Investment Agreement. The
agreement aims at establishing a Council on Trade and Investment composed of
representatives of both governments. The Council meets regularly to discuss specific trade
and investment matters. Working groups have been established on customs administration and
reform, government procurement, Sanitary and Phyto-sanitary (SPS) issues, and agricultural
tariff issues.
Under the U.S. umbrella, Egypt signed a trade protocol with Israel on 14 December 2004. The
protocol establishes what are called "qualified industrial zones" in Egypt. Products from these
84
zones will enjoy duty-free access to the United States, provided that 35% of their components
are the product of Israeli-Egyptian cooperation.
Egypt has signed the agreement for a Common Market for Eastern and Southern Africa
(COMESA) in 31 October 2000. Partners are Djibouti, Kenya, Madagascar, Malawi,
Mauritius, Sudan, Zambia, and Zimbabwe. It targets the elimination of tariffs on COMESA
originating products.
Finally, Egypt has signed or is negotiating a number of other bilateral and regional trade
agreements (e.g. with EFTA and Turkey).
This chapter analyses the Egyptian main free trade agreements with the EU and Arab
countries with the aim of shedding light on their impact on the economy and social
development. Section 2 discusses the two main trade agreements: the EU-Egypt integration
and the pan Arab agreements. Section 3 analyzes the Egyptian trade both in merchandise and
commercial services including its evolution, composition and origin/destination. Section 4
analyzes the impacts of the Egyptian two main trade agreements as well as the foreseen
extension of the agreement with the EU (DCFTA).
2. Integration agreements In this section we focus on two main processes: the EU-Egypt integration and the pan Arab
agreements. In order to situate the Egyptian trade agreements, a useful benchmark is the
Balassa’s classification. This distinguishes five stages of economic integration: 6
1. Free Trade Areas (FTAs): these are agreements by which member countries eliminate
trade barriers among themselves while maintaining their individual national barriers
against third countries. Normally, strict rules of origin and expensive customs
inspection are necessary to prevent trade deflection.
2. Customs Unions (CUs): within this type of agreements, member countries remove all
barriers to trade among themselves and adopt a common set of tariffs to be applied to
third countries; consequently, the adoption of intra-CU rules of origin and the need for
customs inspection become obsolete.
3. Common Markets (CMs): these are arrangements that comprise all the characteristics
of a CU, but also allow for mobility of factors of production.
6 Some add a sixth stage concerning political union
85
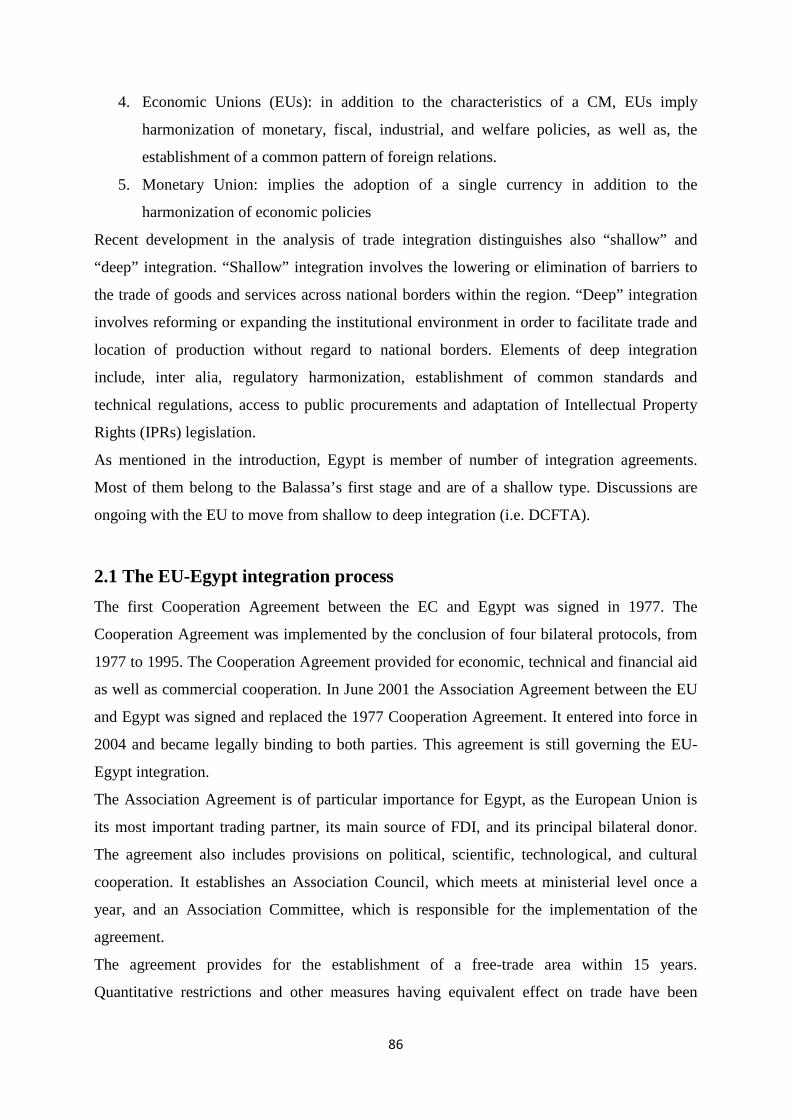
4. Economic Unions (EUs): in addition to the characteristics of a CM, EUs imply
harmonization of monetary, fiscal, industrial, and welfare policies, as well as, the
establishment of a common pattern of foreign relations.
5. Monetary Union: implies the adoption of a single currency in addition to the
harmonization of economic policies
Recent development in the analysis of trade integration distinguishes also “shallow” and
“deep” integration. “Shallow” integration involves the lowering or elimination of barriers to
the trade of goods and services across national borders within the region. “Deep” integration
involves reforming or expanding the institutional environment in order to facilitate trade and
location of production without regard to national borders. Elements of deep integration
include, inter alia, regulatory harmonization, establishment of common standards and
technical regulations, access to public procurements and adaptation of Intellectual Property
Rights (IPRs) legislation.
As mentioned in the introduction, Egypt is member of number of integration agreements.
Most of them belong to the Balassa’s first stage and are of a shallow type. Discussions are
ongoing with the EU to move from shallow to deep integration (i.e. DCFTA).
2.1 The EU-Egypt integration process The first Cooperation Agreement between the EC and Egypt was signed in 1977. The
Cooperation Agreement was implemented by the conclusion of four bilateral protocols, from
1977 to 1995. The Cooperation Agreement provided for economic, technical and financial aid
as well as commercial cooperation. In June 2001 the Association Agreement between the EU
and Egypt was signed and replaced the 1977 Cooperation Agreement. It entered into force in
2004 and became legally binding to both parties. This agreement is still governing the EU-
Egypt integration.
The Association Agreement is of particular importance for Egypt, as the European Union is
its most important trading partner, its main source of FDI, and its principal bilateral donor.
The agreement also includes provisions on political, scientific, technological, and cultural
cooperation. It establishes an Association Council, which meets at ministerial level once a
year, and an Association Committee, which is responsible for the implementation of the
agreement.
The agreement provides for the establishment of a free-trade area within 15 years.
Quantitative restrictions and other measures having equivalent effect on trade have been
86
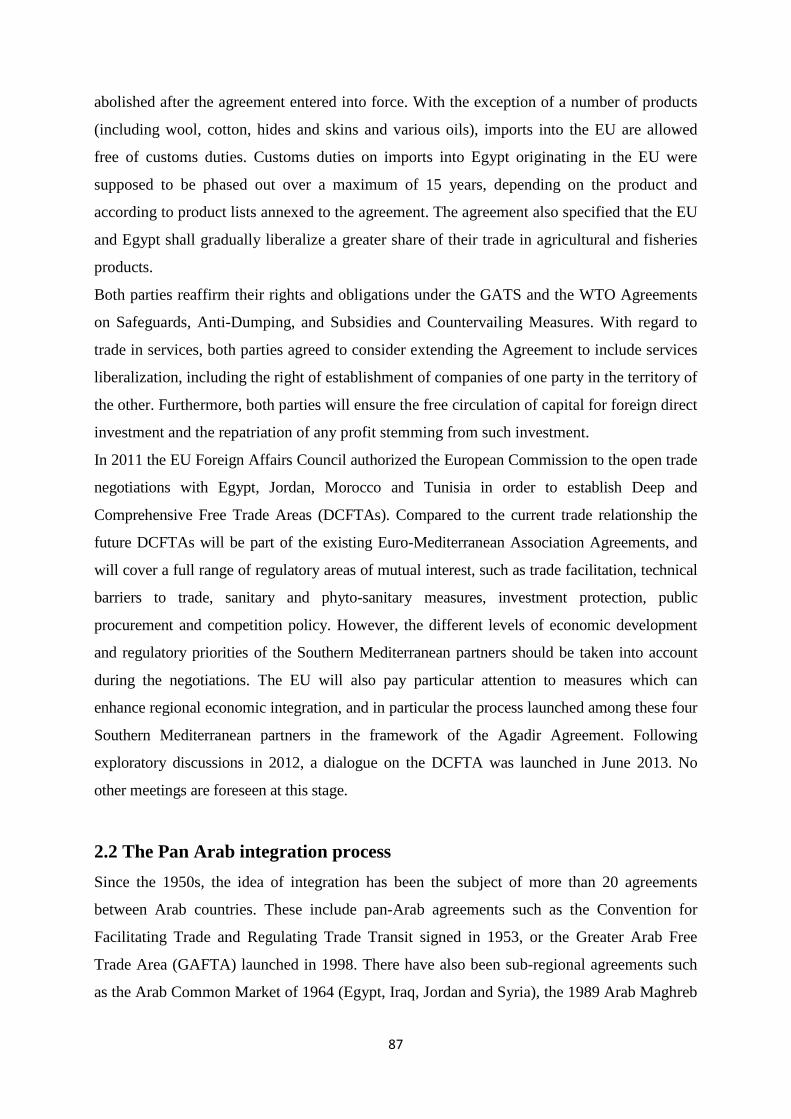
abolished after the agreement entered into force. With the exception of a number of products
(including wool, cotton, hides and skins and various oils), imports into the EU are allowed
free of customs duties. Customs duties on imports into Egypt originating in the EU were
supposed to be phased out over a maximum of 15 years, depending on the product and
according to product lists annexed to the agreement. The agreement also specified that the EU
and Egypt shall gradually liberalize a greater share of their trade in agricultural and fisheries
products.
Both parties reaffirm their rights and obligations under the GATS and the WTO Agreements
on Safeguards, Anti-Dumping, and Subsidies and Countervailing Measures. With regard to
trade in services, both parties agreed to consider extending the Agreement to include services
liberalization, including the right of establishment of companies of one party in the territory of
the other. Furthermore, both parties will ensure the free circulation of capital for foreign direct
investment and the repatriation of any profit stemming from such investment.
In 2011 the EU Foreign Affairs Council authorized the European Commission to the open trade
negotiations with Egypt, Jordan, Morocco and Tunisia in order to establish Deep and
Comprehensive Free Trade Areas (DCFTAs). Compared to the current trade relationship the
future DCFTAs will be part of the existing Euro-Mediterranean Association Agreements, and
will cover a full range of regulatory areas of mutual interest, such as trade facilitation, technical
barriers to trade, sanitary and phyto-sanitary measures, investment protection, public
procurement and competition policy. However, the different levels of economic development
and regulatory priorities of the Southern Mediterranean partners should be taken into account
during the negotiations. The EU will also pay particular attention to measures which can
enhance regional economic integration, and in particular the process launched among these four
Southern Mediterranean partners in the framework of the Agadir Agreement. Following
exploratory discussions in 2012, a dialogue on the DCFTA was launched in June 2013. No
other meetings are foreseen at this stage.
2.2 The Pan Arab integration process
Since the 1950s, the idea of integration has been the subject of more than 20 agreements
between Arab countries. These include pan-Arab agreements such as the Convention for
Facilitating Trade and Regulating Trade Transit signed in 1953, or the Greater Arab Free
Trade Area (GAFTA) launched in 1998. There have also been sub-regional agreements such
as the Arab Common Market of 1964 (Egypt, Iraq, Jordan and Syria), the 1989 Arab Maghreb
87
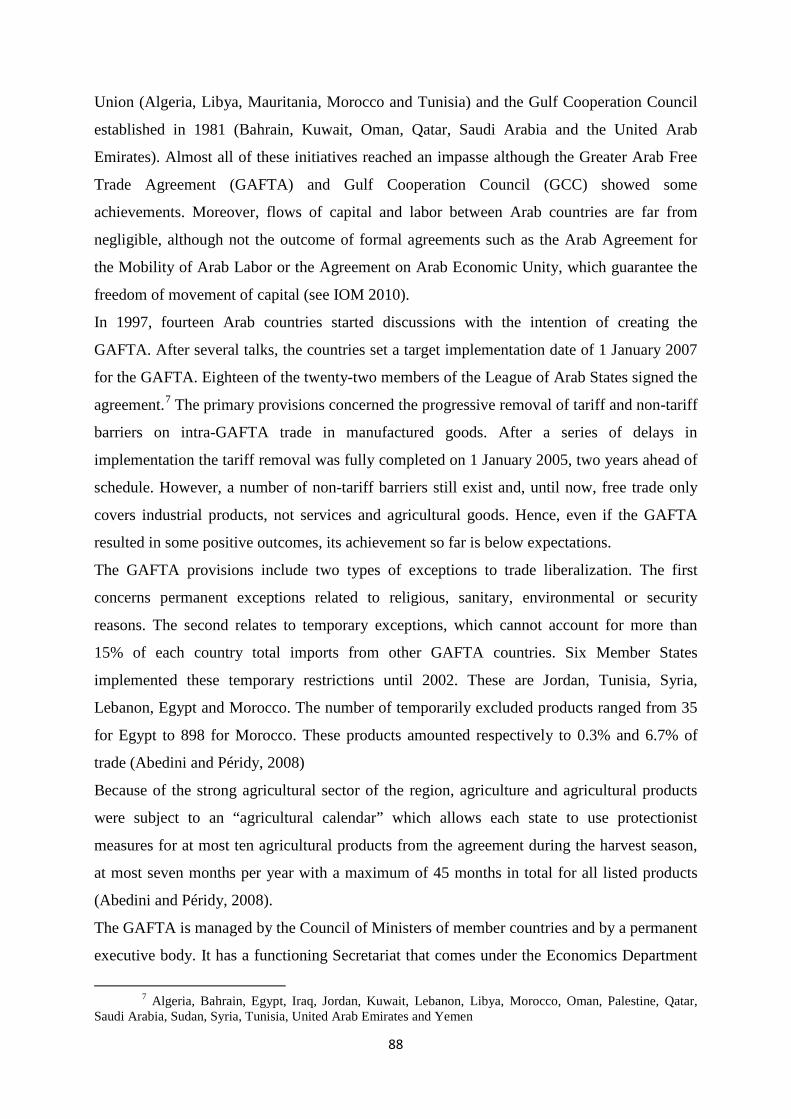
Union (Algeria, Libya, Mauritania, Morocco and Tunisia) and the Gulf Cooperation Council
established in 1981 (Bahrain, Kuwait, Oman, Qatar, Saudi Arabia and the United Arab
Emirates). Almost all of these initiatives reached an impasse although the Greater Arab Free
Trade Agreement (GAFTA) and Gulf Cooperation Council (GCC) showed some
achievements. Moreover, flows of capital and labor between Arab countries are far from
negligible, although not the outcome of formal agreements such as the Arab Agreement for
the Mobility of Arab Labor or the Agreement on Arab Economic Unity, which guarantee the
freedom of movement of capital (see IOM 2010).
In 1997, fourteen Arab countries started discussions with the intention of creating the
GAFTA. After several talks, the countries set a target implementation date of 1 January 2007
for the GAFTA. Eighteen of the twenty-two members of the League of Arab States signed the
agreement.7 The primary provisions concerned the progressive removal of tariff and non-tariff
barriers on intra-GAFTA trade in manufactured goods. After a series of delays in
implementation the tariff removal was fully completed on 1 January 2005, two years ahead of
schedule. However, a number of non-tariff barriers still exist and, until now, free trade only
covers industrial products, not services and agricultural goods. Hence, even if the GAFTA
resulted in some positive outcomes, its achievement so far is below expectations.
The GAFTA provisions include two types of exceptions to trade liberalization. The first
concerns permanent exceptions related to religious, sanitary, environmental or security
reasons. The second relates to temporary exceptions, which cannot account for more than
15% of each country total imports from other GAFTA countries. Six Member States
implemented these temporary restrictions until 2002. These are Jordan, Tunisia, Syria,
Lebanon, Egypt and Morocco. The number of temporarily excluded products ranged from 35
for Egypt to 898 for Morocco. These products amounted respectively to 0.3% and 6.7% of
trade (Abedini and Péridy, 2008)
Because of the strong agricultural sector of the region, agriculture and agricultural products
were subject to an “agricultural calendar” which allows each state to use protectionist
measures for at most ten agricultural products from the agreement during the harvest season,
at most seven months per year with a maximum of 45 months in total for all listed products
(Abedini and Péridy, 2008).
The GAFTA is managed by the Council of Ministers of member countries and by a permanent
executive body. It has a functioning Secretariat that comes under the Economics Department
7 Algeria, Bahrain, Egypt, Iraq, Jordan, Kuwait, Lebanon, Libya, Morocco, Oman, Palestine, Qatar, Saudi Arabia, Sudan, Syria, Tunisia, United Arab Emirates and Yemen
88

of the Arab League. The program also calls for the chambers of industry and commerce in
Arab countries to monitor implementation.
On 25 February 2004, Egypt signed a free-trade agreement with Jordan, Morocco, and
Tunisia. The so-called Agadir Agreement commits the parties to removing substantially all
tariffs on trade between them by 1 January 2005, and to intensifying economic cooperation
with regard to standards and customs procedures. The agreement also covers government
procurement, financial services, contingency measures, intellectual property, and dispute
settlement. The conclusion of this agreement was considered to be a major step towards the
objective of creating a Euro-Mediterranean free trade-zone in 2010, as it also contains rules
on bilateral and diagonal cumulation.
3. Trade This section analyzes Egyptian trade both in merchandise and commercial services including
evolution, composition and origin/destination.
3.1 Total trade Figure 1 and 2 present the export orientation in Egypt and other countries in the Region as
measured by merchandise and commercial service exports in percentage of GDP respectively.
In terms of merchandise exports, Egypt shows the lowest and slightly declining share over the
whole period. The share of commercial service exports in GDP was among the highest at the
beginning of period and declined steadily to become among the lowest in 2012. Until 2010,
merchandise and commercial service exports have broadly equal weight in GDP. In the other
countries, commercial services represent, in general, a lower share of GDP than merchandise
exports. After 2008, the share of commercial service exports showed a sharp decline and the
share of merchandise exports a less marked decline. While the other countries also witnessed
a decline after 2008, they all recovered after 2009 in contrast to Egypt.
89
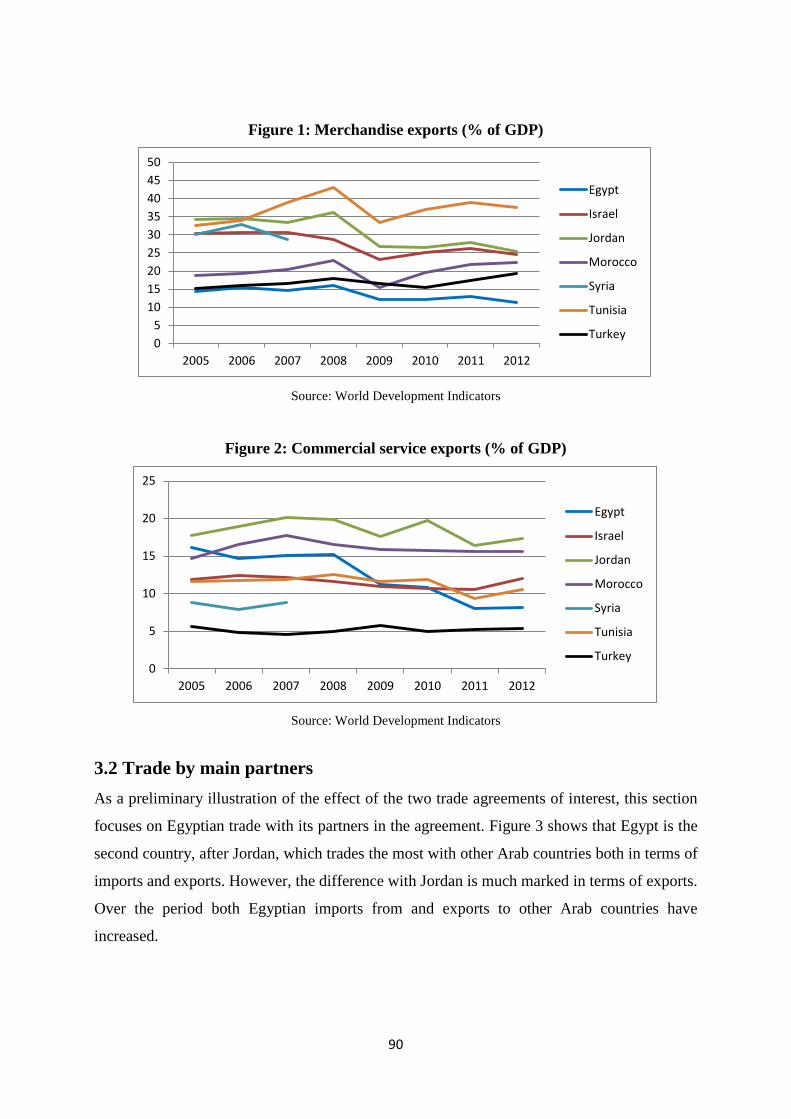
Figure 1: Merchandise exports (% of GDP)
Source: World Development Indicators
Figure 2: Commercial service exports (% of GDP)
Source: World Development Indicators
3.2 Trade by main partners As a preliminary illustration of the effect of the two trade agreements of interest, this section
focuses on Egyptian trade with its partners in the agreement. Figure 3 shows that Egypt is the
second country, after Jordan, which trades the most with other Arab countries both in terms of
imports and exports. However, the difference with Jordan is much marked in terms of exports.
Over the period both Egyptian imports from and exports to other Arab countries have
increased.
05
101520253035404550
2005 2006 2007 2008 2009 2010 2011 2012
Egypt
Israel
Jordan
Morocco
Syria
Tunisia
Turkey
0
5
10
15
20
25
2005 2006 2007 2008 2009 2010 2011 2012
Egypt
Israel
Jordan
Morocco
Syria
Tunisia
Turkey
90

Figure 3: Share of merchandise export to and import from the Arab World
(% of total)
Source: World Development Indicators
With respect to the other main partners, the share of Egyptian exports to the EU is lower than
in the rest of the countries except Jordan. It is much lower than in Morocco, Tunisia and
Turkey. The share of exports to the EU is decreasing in all countries except Israel. The share
of Egyptian exports to North America is among the lowest far below the Israeli and the
Jordanian. This share is decreasing.
In terms of imports, the share of Egyptian imports from the EU is lower than in the rest of the
countries except Jordan. It is much lower than in Morocco, Tunisia and Turkey. The share of
imports from the EU is decreasing in all countries. The share of Egyptian imports from North
America is low and similar to one in other countries except Israel where it is the highest.
0
10
20
30
40
50
60
70Exports
Egypt, Arab Rep. Jordan Morocco Tunisia
0
5
10
15
20
25
30
35
40Imports
Egypt, Arab Rep. Jordan Morocco Tunisia
91

Figure 4: Share of merchandise export to the UE and North America (% of total)
Source: COMTRADE
Figure 5: Share of merchandise import from the UE and North America (% of total)
Source: COMTRADE
3.3 Composition of trade The type of a country’s exports being important for its growth (Hausmann et al., 2007), this
section focuses on the composition of exports. Given their importance in the Egyptian
exports, the analysis will cover commercial services in addition to merchandise exports.
0
10
20
30
40
50
60
70The EU
0
10
20
30
40
50
60
70 North America
Average 1994-1999 Average 2000-2004 Average 2005-2010 Average 2010-2013
0
10
20
30
40
50
60The EU
0
10
20
30
40
50
60
Egypt Israel Jordan Morocco Tunisia Turkey
North America
Average 1994-1999 Average 2000-2004 Average 2005-2010 Average 2010-2013
92
Figure 6 shows that Egypt contrasts with the rest of the countries in that a large share of its
merchandise exports is composed of oil. Such share has, however, steadily declined over the
period of observation in favor of manufactures which represent the largest share of Egyptian
exports since 2009; although lower than in the other countries.
93

Figure 6: Breakdown of merchandise exports by type of good (%)
Source: World Development Indicators
0%
20%
40%
60%
80%
100%
Egypt
0%
20%
40%
60%
80%
100%
Israel
0%10%20%30%40%50%60%70%80%90%
100%
Jordan
0%
20%
40%
60%
80%
100%
Morocco
0%10%20%30%40%50%60%70%80%90%
100%
Tunisia
0%10%20%30%40%50%60%70%80%90%
100%
Turkey
Agricultural raw materials exports (% of merchandise exports) Food exports (% of merchandise exports)
Fuel exports (% of merchandise exports) Manufactures exports (% of merchandise exports)
Ores and metals exports (% of merchandise exports)
94

Figure 7 shows that travel and transport represent more than 80% of the Egyptian exports of
commercial services. These two sectors occupy also a large share in the other countries except
Israel where ICT services are the most important component (over 60%) of commercial
services. Although lower than in Israel, the share of ICT services is also important in Morocco
(around 33%). Like for merchandise, Egyptian exports of commercial services seem still
dominated by traditional activities.
95
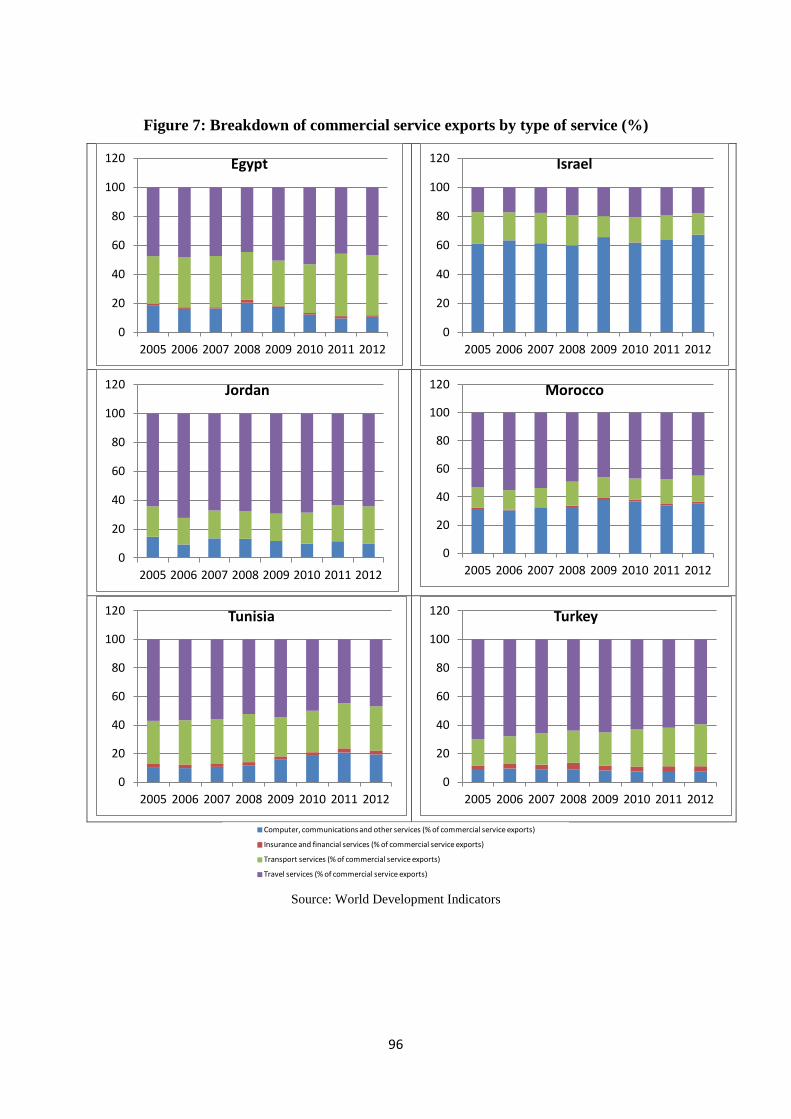
Figure 7: Breakdown of commercial service exports by type of service (%)
Source: World Development Indicators
0
20
40
60
80
100
120
2005 2006 2007 2008 2009 2010 2011 2012
Egypt
0
20
40
60
80
100
120
2005 2006 2007 2008 2009 2010 2011 2012
Israel
0
20
40
60
80
100
120
2005 2006 2007 2008 2009 2010 2011 2012
Jordan
0
20
40
60
80
100
120
2005 2006 2007 2008 2009 2010 2011 2012
Morocco
0
20
40
60
80
100
120
2005 2006 2007 2008 2009 2010 2011 2012
Tunisia
0
20
40
60
80
100
120
2005 2006 2007 2008 2009 2010 2011 2012
Turkey
Computer, communications and other services (% of commercial service exports)
Insurance and financial services (% of commercial service exports)
Transport services (% of commercial service exports)
Travel services (% of commercial service exports)
96

4. Impacts of Egyptian trade agreements 4.1 Current agreements To assess the actual gains from economic integration, the approach commonly used is based
on econometric estimation of gravity models. De Wulf and Maliszewska (2009) surveyed the
works focusing on the Barcelona process.8 They provided qualitative and sectoral assessment
of the effects on trade and investment in Egypt, Israel, Jordan, Morocco, and Tunisia. The
assessment indicated that the Barcelona process has contributed to increase trade with the EU
only in the cases of Egypt and Tunisia. No evidence of any impact of the process on trade of
Morocco, Jordan and Israel with the EU was found.
In addition to assessing the impact of the Barcelona process, Söderling (2005) addressed the
following additional question: Are there significant unexploited export markets for the MENA
region? The author applied the gravity model to a panel dataset covering 90 countries and
about 90 percent of total world trade. The results first showed that there are many non-EU
export markets that are underexploited by the southern Mediterranean countries. On the top of
such markets there is the US’s. It is highly unexploited by Jordan, Morocco, Syria, and
Tunisia, while Algeria and Egypt over-export to the United States. Japan and a number of
other Asian countries are also important unexploited non-EU markets. Israel is another
untapped market, in particular for Jordan and Egypt despite the Egypt-Israel-US signed
agreement. Regarding the Barcelona process itself, the results show that Egypt slightly over-
export to the EU while Algeria and Syria, both predominantly hydrocarbon exporters, over-
export significantly to the EU. Overall, the results suggest that several MENA countries are
substantially under-exploiting the United States as an export market. Moreover, the impact of
integration efforts with the European Union has been moderate but significant in individual
cases.
Cieślik and Hagemejer (2009) conducted a similar analysis to Söderling (2005). The main
difference is that they control for the effects of other pluri-lateral and bilateral free trade
agreements concluded by the MENA countries among themselves as well as with countries
located outside the region. These include: the EFTA agreements, the Arab Maghreb Union,
the Arab Cooperation Council, various bilateral agreements between MENA countries as well
8 The Barcelona Process was launched in November 1995 by the Ministers of Foreign Affairs of the 15 EU members and 12 Mediterranean partners. It formed the basis of the Euro-Mediterranean Partnership which has expanded and evolved into the Union for the Mediterranean. It was based on the principles of joint ownership, dialogue and co-operation, seeking to create a Mediterranean region of peace, security and shared prosperity.
97
as bilateral agreements with the EU associated states (now new EU member countries) in
Central and Eastern Europe and the NAFTA countries: Canada, Mexico and the US. The
sample covers the period of 1980-2004 and 196 trading partners of seven MENA countries:
Algeria, Egypt, Morocco, Tunisia, Israel, Jordan and Turkey. The authors found that while the
EU Association Agreements increased significantly imports of the MENA countries from the
EU, they did not contribute to the expansion of their exports to the EU markets.
Ferragina et al. (2009) provide a comparison of the relative success of the intra-European
Agreements (i.e. with the CEECs) versus the Barcelona process. They first computed the
potential (not actual) trade between members of the intra-European Agreements on one hand
and between members of the Barcelona process on the other hand. Then, they compared the
potential and the actual trade over the two liberalization periods to see the contribution of
each process. The results show that the trade potential between the EU and the South
Mediterranean area is far from being fully exploited and that the situation is worsening. The
ratio of the actual volume of trade to the potential level of trade is between 20% and 30%
percent of the potential level. Conversely, the CEECs show much higher and increasing
ratios.
Abedini and Péridy (2008) tried to assess the ex-post impact of the GAFTA. They found that
the agreement resulted in a gross increase in trade of approximately 20% in the period 1988-
2005. A problem with this conclusion is that GAFTA was only implemented gradually after
1998 (in initial steps of 10 percent, later accelerated to 20 percent a year to achieve full
implementation in 2005). Thus, there is an attribution/identification problem. Other events
also need to be controlled for such as expansion of the EU, the exclusion of some agricultural
products from GAFTA during much of the period (e.g. agriculture is the most dynamic import
for Syria), and the gradual abolition of textile quotas under the WTO during the period.
Péridy (2005) estimated the trade potential among the Agadir free trade agreement countries.
Results show that trade flows remains dramatically low between these countries, as a result of
high trade costs. In particular, the estimated border effects clearly reflect a significant trade
integration deficit in this area. There is also a limited export potential between these countries,
due to their lack of trade complementarity. The author concludes that the Agadir Agreement
may only have limited trade effects.
Freund and Portugal-Perez (2012) studied the effect of the various agreements involving Arab
countries (e.g. GAFTA, EU-MENA, Turkey-MENA, Agadir and US-MENA) on trade after
their entry into force and implementation. They found small effects from GAFTA, EU-
MENA and Turkey-MENA agreements, which are less than standard PTAs. In contrast,
98
effects from Agadir and US-MENA have been at or above standard PTAs. There are,
however, important differences between export and import effects and across countries.
Disaggregating the effects, they found that agreements with the EU have served EU exporters,
with no evidence of a positive and significant effect on MENA’s exports. In contrast, the
additional success of agreements with the US is limited to the US-Jordan agreement. Only
Agadir has had an effect similar to those of a standard PTA. Overall, current trade agreements
have not stimulated trade in an economically meaningful way.
The studies reviewed so far have focused on trade in goods. Konan (2003) considered for
Tunisia and Egypt the effects of both trade in goods and in services. In particular, she
examined three different dimensions of integration: shallow integration, reduction in non-
tariff barriers (NTBs), and the liberalization of barriers to trade in services. The combination
of the three dimensions has led to five scenarios: i) shallow integration; ii) preferential
liberalization, either through the Euro-Med initiative or the PAFTA; iii) multilateral
liberalization; iv) deep integration, in which NTBs on goods are eliminated; and v) services
liberalization consisting of reduction of barriers on cross-border trade as well as barriers to
foreign direct investment (FDI) in the service sector. Table 1 summarizes the impact on gross
domestic product (GDP) of the various combinations.
The gain from trade liberalization promoting only an elimination of tariffs is significantly
greater in percentage terms for Tunisia than for Egypt except in one case. The gain from the
GAFTA alone in Egypt is two percent of GDP while a shallow Egypt-EU trade agreement
would have a negligible impact.
Turning to deeper integration scenarios, the results show that a liberalization involving
elimination of both tariffs and non-tariff barriers to trade in goods yields significantly higher
gains than those of shallow integration. In general, GDP gains in Egypt are twice higher,
although their levels are still modest compared to Tunisia’s.
The findings pertaining to the service liberalization scenarios show that while the benefits of
border liberalization alone are positive, adding reforms that facilitate FDI induces substantial
additional gains in both countries. The gains are comparable in both countries. While in
Tunisia GDP gains are comparable to those assumed to be achievable through deep
liberalization of trade in goods, Egypt seems to benefit more from liberalization that focuses
on services rather than trade in goods.
99

Table 1: Change in GDP (%) following scenarios of integration
Scenarios Tunisia Egypt Shallow: tariffs only Euro-Med Agreement 3.03 0.90 GAFTA -0.07 2.05 GAFTA plus Euro-Med 3.02 0.85 MFN 2.12 0.45 Euro-Med PAFTA plus MFN 2.20 0.45 Deep: tariffs plus goods NTBs GAFTA plus Euro-Med 8.26 1.87 Unilateral MFN Euro-Med 8.82 1.33 GAFTA plus MFN 8.85 1.49 Services liberalization Services Border Liberalization 0.74 2.49 Services Investment Liberalization 7.79 8.39 Full Services Liberalization 8.78 8.71 Combination GAFTA (tariffs only) -0.07 2.05 GAFTA, Euro-Med, MFN (tariffs only) 4.31 0.45 GAFTA plus Euro-Med (tariffs plus goods NTBs) 8.26 1.87 GAFTA, Euro-Med, MFN (tariffs plus goods NTBs) 8.85 1.49 Services Liberalization (no change in goods barriers) 8.78 8.71 GAFTA plus Shallow Goods and Services Liberalization 4.85 0.81 GAFTA plus Deep Goods, Services and FDI Liberalization 16.49 8.2
Source: Konan (2003). MFN = ‘most favored nation’; unilateral tariff reduction.
4.1 Foreseen agreements: DCFTA between the EU and Egypt. The DCFTA between the EU and Egypt is still under negotiation. The evaluation of its effect
concerns, therefore, only the expected impacts.
A first study has been commissioned by the EU to an external consulting firm. The resulting
report (ECORYS, 2014), presents the expected economic, social and environmental impacts
of a DCFTA between the EU and Egypt. The study is based on a mix of quantitative and
qualitative analyses, as well as stakeholder consultations and used a Computable General
Equilibrium (CGE) model to assess the impacts. The model produces both short run and long
run results, the difference being that in the long run capital is allowed to reallocate between
sectors. The scenario that is used to simulate the likely impact of the agreement assumes:
1. Tariffs will only be reduced in agriculture because tariffs on industrial goods are
already eliminated. Agriculture tariffs in Egypt on EU imports are assumed to be
100

reduced by 80 percent, while tariffs in the EU on Egyptian imports will be reduced by
95 percent;
2. Non-tariff measures (NTMs) in services are assumed to be reduced by three percent
for Egyptian services entering the EU, and five percent for EU services entering
Egypt;
In the short run, GDP is expected to increase by 1.2 percent in Egypt. In the long run, the
increase is expected to be 1.8 percent. The analysis of the effects of the different ways of
liberalization shows that reducing NTMs in goods is by far the most important contributor to
the expected gains from the DCFTA, accounting for more than half of the gains. The
reduction in agricultural tariffs, although much smaller, also significantly contribute to the
income gains.
Total trade is also expected to expand for Egypt, with an estimated increase of 8 percent for
both exports and imports in the short run and 25 percent in the long run. Exports to the EU are
even expected to expand by almost 17 percent in the short run and even 50 percent in the long
run.
In the short run, wages for low, medium and high skilled workers are expected to increase by
1.9 percent, 4.8 percent and 0.1 percent respectively. In the long run, these expected wage
changes may be less positive, and for low skilled workers they even turn negative.
Another study conducted by four academics (Ghoneim et al., 2012) also allows shedding
light on the potential impacts of the DCFTA. It estimated a gravity model for trade between
the EU and 11 Southern Mediterranean countries and uses the results to simulate the effect on
trade. Taking into account the fact that protection due to NTMs is generally much greater than
that due to tariffs (except for Algeria and Tunisia) and that Morocco, Tunisia and Egypt
exhibit the lowest protection (less than 25%). The calculation of trade creation due to shallow and
deep integration reveals that:
1. Tariff removal is expected to produce moderate or limited gains, except in Algeria,
and Tunisia (to a lesser extent), since both countries show higher tariffs than the other
Mediterranean countries. Egypt and Morocco show moderate import increases due to
tariff removal (about 30%). For the other countries (Lebanon, Jordan, Israel and
Turkey), only a limited import increase can be expected from further shallow
integration, since the potential gains have been almost fully achieved due to past tariff
liberalization, both multilaterally (GATT) and regionally (Barcelona agreement).
2. Conversely, the elimination of NTMs is expected to lead to strong trade gains. With
regard to imports, the expected increase range from about 25% in Morocco and
101

Tunisia to 60% in Algeria. The other countries are in intermediate positions, showing
imports increase which scales from 32% (Lebanon) to 39% (Egypt and Jordan).
Exports increases, although significant (35%) are, however, smaller than import
increases.
3. Trade gains due to deep integration can also been reinforced further through the
reduction in trade and logistics costs
Beside the fact that these results concern only expected not actual impacts, the DCFTA raises
serious concerns related to the dynamic impacts of some provisions. Recall that, compared to
the current trade relationship, the future DCFTAs will cover a full range of regulatory areas of
mutual interest, such as trade facilitation, technical barriers to trade, sanitary and phyto-
sanitary measures, IPRs, investment protection, public procurement and competition policy.
Shadlen (2005) argued that greater degrees of deep integration means that developing
countries accept new constraints regarding the management of inward foreign investment,
intellectual property etc. The additional constraints imposed by regional-bilateral agreements
are most threatening to national capacities for industrial upgrading and in general much more
restrictive than under the WTO provisions. For instance, under the NAFTA, Mexico can no
longer screen and veto foreign (specifically US and Canadian) acquisitions. Only in the case
of purchases of extraordinarily high levels, and where foreign owners come to acquire more
than forty percent of a Mexican firm, are purchases subject to government authorization.
Mexico cannot attempt to influence firms’ hiring and training practices or restrict in any way
rights of repatriation of investment capital, payments, profits and royalties.
Shadlen (2005) also pointed to problems related to the Intellectual Property Rights (IPRs). For
instance, developing countries that enter into regional-bilateral agreements with the US
typically accept obligations in the area of IPRs that go far beyond what is required as WTO
members. Requirements that signatories offer increased patent protection via ‘pipeline’
protection and extended periods of data exclusivity are standard characteristics of such
agreements. But many pharmaceutical companies did not apply for patents in developing
countries, frequently because pharmaceutical products were not patentable at the time the
invention was made. To provide “pipeline” protection is to grant patents to products that are
not new for the duration of the patent in the first country. Moreover, when pharmaceutical
firms seek approval for drugs from local regulatory authorities, they are ordinarily required to
submit test data. If access to this data is blocked, producers of generic medicines cannot gain
regulatory approval without replicating costly and time-consuming clinical trials. Again,
while TRIPs places limited obligations on states regarding the treatment of test data, the US
102

invariably pushes for minimums of five years of data exclusivity in regional-bilateral
agreements.
Such obligations included in the US RTAs do not necessarily fit the developmental
perspectives of its developing partners. The imposition of deep integration elements in the
field of pharmaceuticals for example is likely to create social unrest (Ghoneim, 2008). This is
confirmed by an OXFAM (2004) report which showed that the terms that the US imposes
regarding IPR in the pharmaceutical sector in its FTAs as “TRIPS+” obligations close off the
public health safeguards available to WTO members under TRIPS. This restricts access to
affordable medicines in developing countries.
Finally, harmonization of standards and regulations requires that a developing country
establishes conformity assessment procedures and institutions. It must also have the capacity
to accredit its testing laboratories. Many developing countries like Egypt do not have labs
offering this higher level of capability (Ghoneim, 2008).
5. Conclusion Egypt is part of number trade agreements. These include WTO, GFTA, Agadir, the EU-Egypt
the US-Egypt, The Turkey-Egypt, the Israel-Egypt and the COMESA. This chapter has
presented and examined the impact of the Egyptian main free trade agreements with the EU
and Arab countries.
The evolution of Egyptian trade over time doesn’t show a strong effect of such agreements.
The share of merchandise exports in GDP is lower than in many countries in the region and is
slightly decreasing since 2005. The share of commercial service exports in GDP, which was
among the highest in the Region at the beginning of the 2000s, has declined steadily to
become among the lowest in 2012. In terms of partner, Egypt is trading a lot with other Arab
countries both in terms of imports and exports. Over the period both Egyptian imports from
and exports to other Arab countries were increasing. In contrast, the share of the EU in
Egyptian exports is lower than in the rest of the countries in the Region. This share is also
decreasing. North America’s share in Egyptian exports is among the lowest in the Region and
is far below the Israeli and the Jordanian. This share is decreasing.
Since, the type of a country’s exports is important for its growth, we also examined the
composition of exports. For both merchandise and commercial services, Egyptian export is
still dominated by traditional activities. Although the share of oil, which was the main
merchandise exports at the beginning of the period, steadily declined over the period of
observation in favor of manufactures, the latter remain under represented in comparison to
103

other countries in the Region. Travel and transport represent more than 80% of the Egyptian
exports of commercial services.
The review of the empirical assessment of the gains from economic integration shows mixed
affects. As regards Europe, the Barcelona process has contributed to increase trade with the
EU only in the cases of Egypt and Tunisia. Egypt seems also exporting a lot to the United
States which is not the case of many Arab countries. There are, however, unexploited export
markets. Japan and a number of other Asian countries are important unexploited non-EU
markets. Israel is another untapped market, in particular for Jordan and Egypt despite the
Egypt-Israel-US signed agreement. Turning to intra-MENA agreements, small effects from
GAFTA and Turkey-MENA agreements are found. In contrast, effects from AGADIR have
been at or above standard PTAs.
Turning to deeper integration scenarios, the results show that a liberalization involving
elimination of both tariffs and non-tariff barriers to trade in goods yields significantly higher
gains than those of shallow integration. In general, GDP gains in Egypt are twice higher,
although their levels are still modest compared to Tunisia’s. The DCFTA between the EU and
Egypt is still under negotiation. The evaluation of its effect concerns, therefore, only the
expected impacts. Estimated effects on trade are contradictory. Besides, the DCFTA raises
serious concerns related to the dynamic impacts of some provisions (e.g. trade facilitation,
technical barriers to trade, sanitary and phyto-sanitary measures, IPRs, investment protection,
public procurement and competition policy). Fears stem for the fact that constraints imposed
by regional-bilateral agreements, such as NAFTA, are more severe and threatening to national
capacities of industrial upgrading than under the WTO provisions.
104
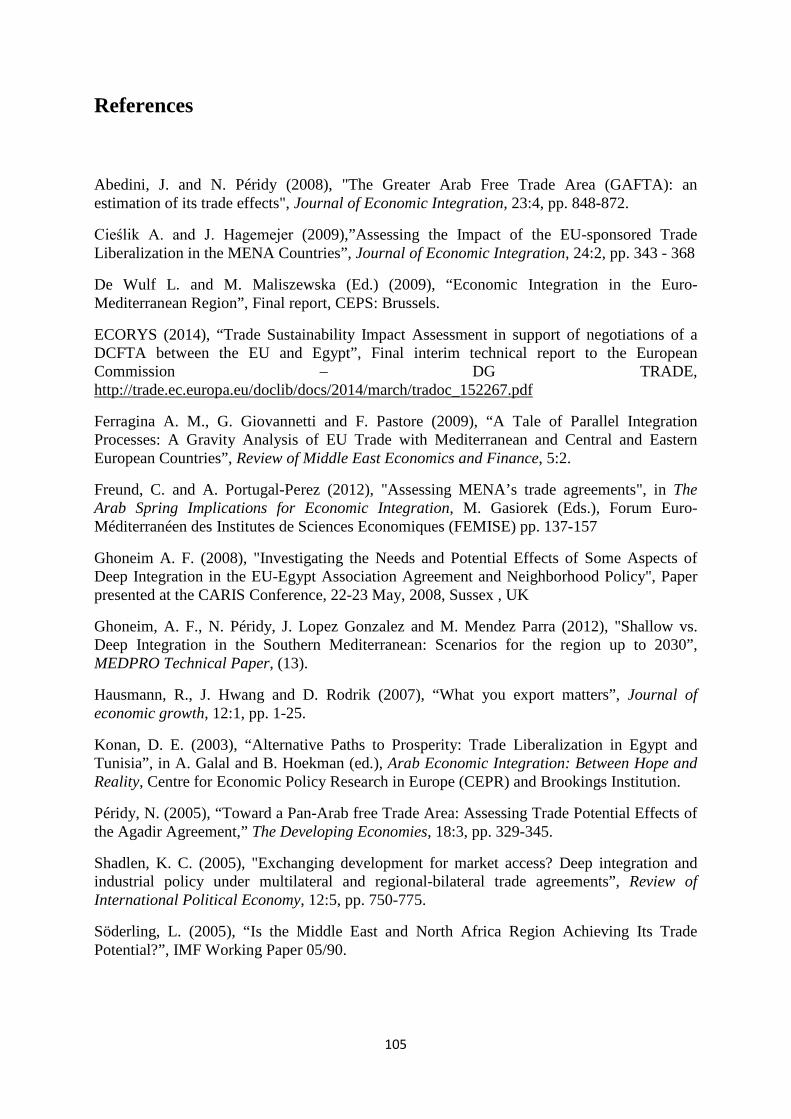
References
Abedini, J. and N. Péridy (2008), "The Greater Arab Free Trade Area (GAFTA): an estimation of its trade effects", Journal of Economic Integration, 23:4, pp. 848-872.
Cieślik A. and J. Hagemejer (2009),”Assessing the Impact of the EU-sponsored Trade Liberalization in the MENA Countries”, Journal of Economic Integration, 24:2, pp. 343 - 368
De Wulf L. and M. Maliszewska (Ed.) (2009), “Economic Integration in the Euro-Mediterranean Region”, Final report, CEPS: Brussels.
ECORYS (2014), “Trade Sustainability Impact Assessment in support of negotiations of a DCFTA between the EU and Egypt”, Final interim technical report to the European Commission – DG TRADE, http://trade.ec.europa.eu/doclib/docs/2014/march/tradoc_152267.pdf
Ferragina A. M., G. Giovannetti and F. Pastore (2009), “A Tale of Parallel Integration Processes: A Gravity Analysis of EU Trade with Mediterranean and Central and Eastern European Countries”, Review of Middle East Economics and Finance, 5:2.
Freund, C. and A. Portugal-Perez (2012), "Assessing MENA’s trade agreements", in The Arab Spring Implications for Economic Integration, M. Gasiorek (Eds.), Forum Euro-Méditerranéen des Institutes de Sciences Economiques (FEMISE) pp. 137-157
Ghoneim A. F. (2008), "Investigating the Needs and Potential Effects of Some Aspects of Deep Integration in the EU-Egypt Association Agreement and Neighborhood Policy", Paper presented at the CARIS Conference, 22-23 May, 2008, Sussex , UK
Ghoneim, A. F., N. Péridy, J. Lopez Gonzalez and M. Mendez Parra (2012), "Shallow vs. Deep Integration in the Southern Mediterranean: Scenarios for the region up to 2030”, MEDPRO Technical Paper, (13).
Hausmann, R., J. Hwang and D. Rodrik (2007), “What you export matters”, Journal of economic growth, 12:1, pp. 1-25.
Konan, D. E. (2003), “Alternative Paths to Prosperity: Trade Liberalization in Egypt and Tunisia”, in A. Galal and B. Hoekman (ed.), Arab Economic Integration: Between Hope and Reality, Centre for Economic Policy Research in Europe (CEPR) and Brookings Institution.
Péridy, N. (2005), “Toward a Pan-Arab free Trade Area: Assessing Trade Potential Effects of the Agadir Agreement,” The Developing Economies, 18:3, pp. 329-345.
Shadlen, K. C. (2005), "Exchanging development for market access? Deep integration and industrial policy under multilateral and regional-bilateral trade agreements”, Review of International Political Economy, 12:5, pp. 750-775.
Söderling, L. (2005), “Is the Middle East and North Africa Region Achieving Its Trade Potential?”, IMF Working Paper 05/90.
105
Top Related