
![Class 8 The Capital Asset Pricing Model. Efficient Portfolios with Multiple Assets E[r] 0 Asset 1 Asset 2 Portfolios of Asset 1 and Asset 2 Portfolios.](https://static.fdocuments.in/doc/165x107/56649e505503460f94b4758c/class-8-the-capital-asset-pricing-model-efficient-portfolios-with-multiple.jpg)


Languages
Pages
Legal


UC BerkeleyCUDARE Working Papers
TitleEfficient asset portfolios and the theory of normal backwardation
Permalinkhttps://escholarship.org/uc/item/59c8m4x6
AuthorsCarter, Colin A.Rausser, Gordon C.Schmitz, Andrew
Publication Date1982
eScholarship.org Powered by the California Digital LibraryUniversity of California

4' . Division of Agricultural Sciences UNIVERSITY OF " CALIFORNIA
.' •...
Working Paper No. 133 Q(\/,
EFFICIEJ'-.T ASSET PORTFOLIOS A.J'J'D TIlE TIlEORY ;. ~ OF NORMI\l, BACKWARDATION
Colin A. Carter, Gordon C. Rausser, and Andrew Schmitz
GIANNINJ FOUNDATION 011' AGRICULTURAL ECONOMICS
LIBRARY
JAN 20'1982
California Agricultural Experiment Station Giannini Foundation of Agricultural Economics
January 1982
133, rev
\.


4 . EFFICIENT ASSET PORTFOLIOS AND THE THEORY OF NORMAL BACKWARDATION*
Keynes (1930), with his theory of normal backwardation, emphasized the finan
cial risk posed by the necessity for carrying inventories of agricultural
products, and he suggested futures markets exist to fa~ilitate hedging. 1 In
his view, futures prices are unreliable estimates of the cash or spot price
prevailing on the date of expiry of the futures contract. He belie~ ed it .
"normal" for the futures price to be a downward biased estimate of the forth
coming spot price. This theory, in effect, argues that speculatrirs sell Ilin_
surance ll to hedgers and that the market is "normally" inefficient since the
futures price is not an unbiased estimate of the subsequent spot price. 2
Keynes argued that hedgers use futures markets to avoid risks and they pay, on
the average, a significant premium to the speculator for this insurance. The
long speculator realizes the premium by refusing to purchase a contract from
the short hedger except at the price below that which the futures price is
expected to approach.
Telser (1959, 1960) and Cootner (1960) have both . tested their interpreta-
tion of the theory of normal backwardation and have obtained conflicting
results. Cootner found evidence to support the theory of normal backwarda-
tion, while Telser's conclusions were contrary. · Several other writers have
also tested the validity of the theory of normal backwardation. A succinct
summary of their findings is given by Rockwell (1967) when he describes the
state of the theory:
While the theory of normal backwardation may be valid for particular
markets under special conditions, it is not adequate as a general
explanation of the flow of profits in commodity markets (p. 110).
2.
More recently, Dusak (1973) has examined the existence of a risk premium
within the context of the capital asset pricing model (CAPM). Within this
approach, she argues that the Keynesian notion of a risk premium takes on a
new interpretation. Namely, the risk premium required on a futures contract
should depend on the extent to which the variations in prices are systemati
cally related to variations in the return on total wealth. If the CAPM
applies and if the risk of a futures contract is independent of the risk of
changes in the value of all assets taken together (i.e., no systematic risk»)
then investors will not have to be paid for that risk. The Keynesian insur
ance interpretation, on the other hand, identifies the risk of a futures asset
solely with its own price variability. Dusak uses the CAPM to generalize the
Keynesian formulation and tests for both types of risk in the futures market
for these commodities; she concludes that wheat, corn, and soybean futures
contracts are not risky assets whether they are held independently or as part
of a larger portfolio of assets. These results are appealing since, in con-
trast to Keynes, Cootner, and Telser, they do not rest on a difference in
taste or attitude toward risk among hedgers and speculators.
In a separate study, Schiff (19B1) also found that, for commodities such
as corn and soybeans, futures prices do not include a risk premium. He sup-
ports the Dusak results. However, for cotton, he finds that hedgers do pay a
risk premium. He distinguishes between commodities such as corn, which are
affected mostly by supply shocks due to weather, and those such as cotton
which are more closely related to general economic conditions. He suggests
that, for those commodities in which variance in returns is due largely t~
supply shocks caused by weather variability, a risk premium is not expected to
exist. In contrast, for those commodities in which return variances are ,
3.
principally related to demand conditions and thus general economic activity, a
risk premium is expected.
The principal problems with Dusak's investigation is that it is based on a
misspecified model, and it is restricted to a small set of commodities where
systematic risk is most likely to be absent. The purpose of this paper is to
correct these two principal deficiencies of the Dusak model. Our analysis
focuses on the original and the newer (Ousak) version of the Keynesian theory
of normal backwardation and the implications for market efficiency. In
Dusak's analysis, it was implicitly assumed that speculators are net long
throughout the life of a futures contract and that the well-diversified port
folio of speculators contain only common stocks. In relaxing both of these
highly Questionable assumptions, we show that, contrary to Dusak's results,
holding futures contracts is a risky business and that the "generalized"
Keynes' theory of normal backwardation has some merit. Our results are con-
sistent with Rockwell's conviction that the Keynesian theory is valid under
special conditions. Moreover, we test the generalized Keynes' theory using
the same commodities (wheat, corn, and soybeans) investigated by Dusak and add
a subset of commodities more closely related to the general level of economic
activity (cotton and live cattle).
The Capital Asset Pricing Model
Using the familiar mean-variance criterion, a general equilibrium model of the
pricing of capital assets under uncertainty has been developed by Sharpe (1964)
and Lintner (1965a, 1965b). Their model assumes that the market's partici-
pants are risk-averse, expected utility-maximizing investors; and it develops
a measure of the risk of an asset and the consequent equilibrium relationship
between the asset's risk and its one-period expected return. ,

., 4~
The major result of the CAPM is often summarized as:
(I)
where E is the expectation operation; tildes represent random variables; R. J
is the return on asset j; Re is the return on the market portfolio; R is the
return on a riskless asset; and Sj = COV(R j , Re)/var(Re). The systematic s ' -(nondiversifiable) risk of asset j, OJ' is equal to Bj a(Re ) < Expressed in
units of market risk, o(Re), the coefficient Bj represents the systematic risk
of asset j.
The expression in equation (1) follows that, if investors are generally
risk averse and make their portfolio decisions according to the two-parameter
(mean and variance) model, then we should, on average, observe a positive
trade-off between risk and return along the set of efficient portfolios. The
observed asset market returns (R.) should be a reflection of investors' at-J
tempts to hold efficient portfolios. An efficient portfolio possesses minimum
risk for a given level of expected return. The efficient set of portfolios is
shown by bd in figure 1. All portfolios that lie to the right of the envelope
curve, bd, are inefficient.
The consumer's attitudes toward risk and return are summarized in the in-
difference curves labeled II' ••• , 14 in figure 1. The optimal port-
folio is represented by point e; and, for the consumer who chooses point e, we
should expect to observe the expected return-risk relationship for individual
assets as in equation (1).
The CAPM has been slightly reformulated and applied to futures market
contracts by Dusak (1973), Black (1976), an~ Stoll (1979). These efforts
represent an extension of the work of Johnson (1960) and Schrock (1971) who ~

E (F· ' 'e
p ~ s r.-:ree{ F.a t.e of I,) t.ere5 t
I .. I
~----------~--
Ind1~ferenCE Curv~
/ betwee:-l Ri sk an::
All 0:' :'10 r portfcli c s
5.
. cr~~)
Figure 1. Consumer Equilibrium in the eAPN
\

6.0
,
had previously adapted the Markowitz mean-variance framework to the futures
market.
From equation (1), E(~j) can be expressed as a return over a given time
period. If Pjo is the start-of-period price of asset j and Pj1 is its
end-of-period price, one can write equation (1) as:
E(Po1 - 8 ) J JO _ R =
Po
(POl - Po) cov J JO R
P jo 'e
JO
Multiplying equation (2) by PjQ yields:
E (PJ"1 - p" ) - RP 0 = JO JO
(2 )
(3 )
Since the start-of-period value of a futures contract is zero and the end-of-
period value of a futures contract ;s the change in the futures price over the
period, ~P, one can set PjO equal to zero, substitute AP j for Pj1 , and
rewrite equation (3) as:
or
\,
(4 )
(5 )

7.
Equation (5) expresses a positive linear relationship between the risk of
a futures contract and its expected price change (expected return). It is
important to note. that, in this model, risk is measured from a portfolio point
of view, i.e., the risk of a futures contract is measured by its contribution
to the risk of the investor's portfolio. As formulated in equation (5), the
nondiversifiable portion of the futures market asset j1s return can be pre-
sumed to be captured by its estimated relationship with returns on the market
portfolio.
The Dusak Results
The empirical counterpart of equation (5) is:
-Rt = a j + BjXt + €t t 1, 2, 3, ••• , T (6)
where Rt is theone-period return on an individual asset j, xt is the one
period return on the efficient portfolio, a j is the normalized unsystematic
risk of asset j, and 8j is the normalized systematic risk of asset j. It is
assumed that E(~j) = 0 for all t; var(~t) = a~ for all t; cov(~t' €v) = 0 for
all t J v; plim(r~=lit~t/T)= 0; and the number of observations is equal to T.
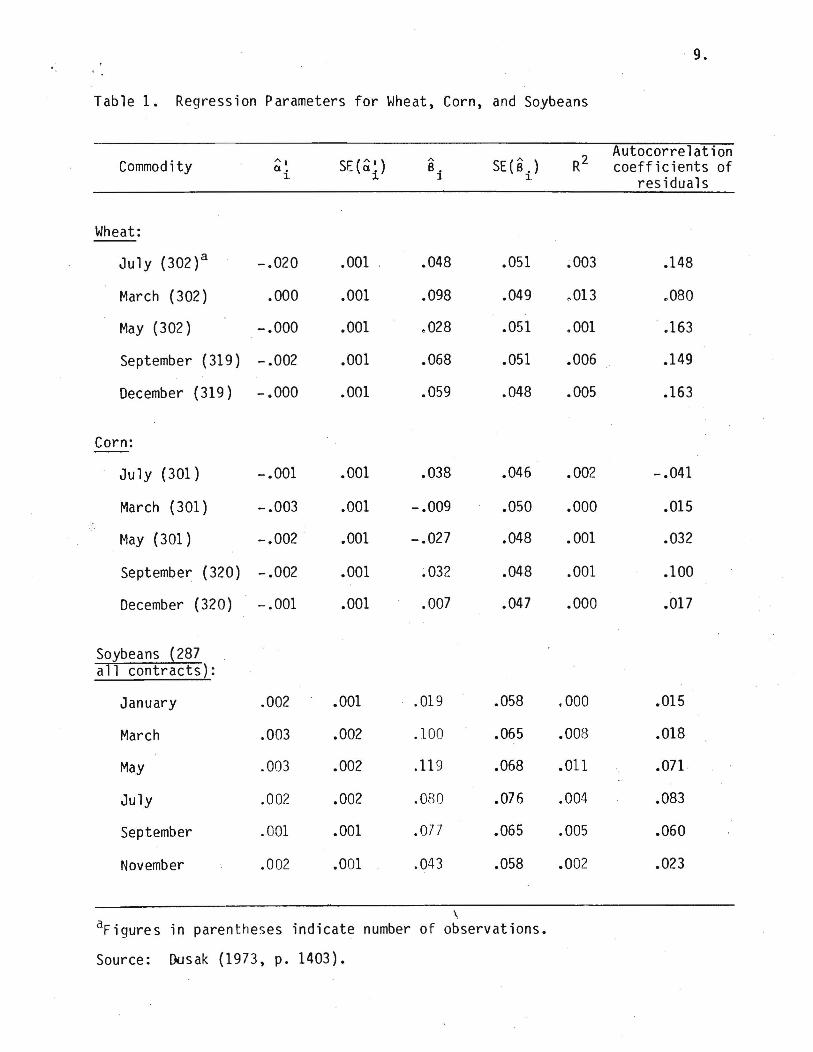
The relationship in equation (6) is often referred to as the market
model. Its parameters have been estimated by Dusak for returns in the wheat,
corn, and soybean futures market. In a portfolio framework, Dusak argues that
the risk premium of a futures contract should depend only on B (the systematic
risk of the asset) in equation (6). This portfolio measure of risk is viewed
as being more important than the measure of nonmarket risk [a in equation (6)J
because the level of nonmarket risk can be ~iversified away.

For the independent variable in equation (6), Dusak selects the Standard
and Poor (S&P) Index of 500 Common Stocks as a proxy for the return on the
efficient portfolio. Semimonthly returns on the futures contracts are em
ployed as the dependent variable. Her data were collected for a 15-year
period from 1952 to 1967, .and her regression results are presented in
table 1. The principal conclusion of the Dusak paper is that futures con
tracts are not risky assets whether they are held independently or as part of
a larger portfolio of assets.
There are two major problems associated with Dusak's analysis. The first
is that she implicitly assumes that speculators are net long throughout the
life of the futures contract. Empirical evidence indicates this is errone
ous. The second is that she uses the return on the value-weighted S&P Index
of 500 Common Stocks as a proxy variable for the return on the efficient mar
ket portfolio. An alternative proxy (one which gives eaual weight to a stock
and a commodity index) has more intuitive appeal and is more representative of
an efficient portfolio. Bodie and Rosansky (1980) have shown that a market
portfolio comprised of common stocks augmented by commodity futures could re
sult in a one-third reduction in variance with no concomitant decline in mean
return.
A Respecified Futures Market
As mentioned above, Dusak failed to account for changing speculative positions
in the futures market and failed to include commodities in the wealth (port
folio) index. These two issues will be discussed in this section, and an al-"
ternative specification of the capital market line in eauation (6) will be
proposed.
9.
Table 1. Regression Parameters for Wheat, Corn, and Soybeans
A R2 Autocorrelation
Commodity AI SE (~~) SE (B. ) coefficients of a. Si 1 1 residuals
Wheat:
July (302)a -.020 .001 .048 .051 ~003 .148
March (302) .000 .001 .098 .049 ~ 013 .080
May (302) -.000 .001 .028 .051 .001 . • 163
September (319 ) -.002 .001 .068 .051 .006 .149
December (319 ) -.000 .001 .059 .048 .005 .163
Corn:
July (301 ) -.001 .001 .038 .046 .002 -.041
March (301) -.003 .001 -.009 .050 .000 .015
May (301) -.002 . .001 -.027 .048 .001 .032
September (320) -.002 .001 ~032 .048 .001 .100
December (320) -.001 .001 .007 .047 .000 .017
Soybeans (287 all contracts):
January .002 .001 .019 .058 .000 .015
March .003 .002 .100 .065 .008 .018
May .003 .002 .119 .068 .Oll .071
July .002 .002 .080 .076 .004 .083
September .001 .001 .077 .065 .005 .060
November .002 .001 .043 .058 .002 .023
" aFigures in parentheses indicate number of observations.
Source: Ousak (1973, p. 1403).

The Market Index
For the market index in equation (6), Ousak selected the S&P Index of 500 Com-
mon Stocks. Taken alone, the S&P Index does not account for the price insta
bility of the nation's stock of agricultural and nonagricultural commodities.
This results in biased estimates of the degree of systematic risk one should
expect for futures contracts if the CAPM is properly interpreted.
The relative importance of commodity assets is attested by the fact that,
in 1977, 42.9 million contracts were traded on U. S. commodity futures ex
changes. The value of commodities represented by the contracts traded was
estimated at ~1.23 trillion. The market value of stocks listed on all regis
tered exchanges in 1977 was less than this and approximately equal to $950
billion. Total farm assets in the United States in 1977 had a market value of
approximately ~655 billion. In any event, commodities have a more important
place in the economy than recognized by Ousak.
A more important consideration is the fact that Dusak assumes the CAPM
represents a reasonable abstraction from reality and serves as a measure of
expected returns in the futures market under normal conditions. However, she
fails to appreciate the assumption implicit in the CAPM that the investor
holds the "efficient portfolio" [equation (6)]. Bodie and Rosansky have shown
that common stock returns and commodity futures returns are negatively corre
lated, and this provides evidence for the inclusion of commodity assets in any ,
efficient portfolio. Commodity assets are not explicitly included in Dusak's
portfoliO index. 3
The above arguments suggest that a more appropriate "efficient portfolio"
return variable in equation (6) would be an index composed of the S&P Index of ,

11.
500 Common Stocks and the Dow Jones and Company (DJ&C) commodity futures in-
dex. Since this variable is a theoretical construct and is unobservable,
alternative indexes could be proposed. In our analysis, each of the two com-
ponents will be equally weighted.
Changing Speeulative Positions
In the security market literature, it is no longer traditionally assumed that
the covariance between the return of a stock and the market rate of return
(the B value) is stable over time. The instability of the parameter may arise
from changing technology in an industry, variable management decisions, or
accounting practices. Stochastic B values have been empirically verified by
Sunder (1973), Campanella (1972), and Kon and Jen (1978).
There has been virtually no discussion in the literature on the nature of
the systematic risk of a futures contract except for Sharpe's (1978,p. 419)
suggestion that the market (systematic) risk of a futures position might
change during the season as positions of speculators and hedgers change. On
the other hand, the specific level or nonmarket risk of a futures contract has
received a disproportionate amount of attention in the literature. Its exist
ence was the subject of the famous Cootner-Telser debate. 4 Cootner provided
theoretical and empirical evidence to support the notion that the nonmarket
rate of return (n.) is a stochastic variable that is a function of net hedgJ
ing pressure. This generalized the Keynesian theory of normal backwardation
to allow for variable trader's positions.
There is no a priori reason to adopt Dusak's assumption that the level of
nonmarket return [the n parameter in equation (6)J or the level of systematic
risk [the B parameter in equation (6)] for ~ futures contract is stationary
over time. The Sharpe (1964) and Cootner (1960) hypotheses will be "

12,.
entertained in the estimation of equation (6) in this paper. The parameters
in equation (6) will be assumed to be stochastic and a function of net specu-
lative positions. More specifically~ a and B are stochastic and will be
specified as a function of the net market position of large speculators repre-
sented by Zt. For a single asset~ the relationship between the stochastic
parameters (a j and Bj ) and the exogenous influence Ztis of the
form: 5
where a, B,~, and, are nonstochastic and where et and vt are error terms .
Let E(et , Et) = E(Vtt ~t) = 0 and let var(et ) = o~~ var(v t ) =
2 0v and cov(et , vt ) = 0ev·
Combining equations (6) and (7), we may write
- -Rt = a j + ~jZt + BjXt + 'jXtZt + ut
where
and where
\ ,
(7)
(8)
(9 )
(10)

13.
222 If a£, av' a e, and aev are known, the best linear unbiased estimator
of ai' 6 i , Bi' and Yi is provided by generalized least squares (GLS).
Unfortunately, these variances and the covariance are unknown and thus a two
stage Aitken estimator is required, with the first stage capturing estimates
222 of a£, av' a e and aev and the second-stage estimates of ai' 6 i ,
Bi , and ~i conditioned upon the first-stage estimates.
In what follows, we employ an approach developed by Mundlak and Rausser
(1979). The components of var (ut ) are estimated by applying ordinary least
squares (OLS) to equation (8) from which we obtain the estimated residuals.
These residuals, ~2 = ~, are then employed as dependent variables in the
regression,
(14)
where M is the matrix M = [I - X*{X*I x*)-l X*IJ with each element re
placed by its square and x equals matrix x with each element replaced by its
square. The resulting estimates ~2 contain all variance elements of var
(u t ) appearing in equation (10). These estimates are then entered into a
GLS framework or the second Aitken stage to obtain asymptotically efficient
Empi rica l Results
Equation (8) was estimated for returns in the soybean, corn, wheat, cotton,
and cattle futures markets. For the first three commodities (those ex am ined
by Ousak), the results for OlS and GLS are reported in tables 2 and 3, respec
tively. The dependent variables (Rt ) used in the regressions are the first
\

14~
differences of the natural logarithms of weekly average futures prices col--
lected from 1966 through 1976. The independent, Zt' variables were obtained
from the Commodity Futures Trading Commission reports. They represent the
percentage of reporting speculators that were net long, and thus Zt lies in
the interval between zero and one. 6 Finally, the xt variables represent
first differences of the natural logarithms of the market index (the S&P and
DJ&C indices weighted equally) minus the 90-day Treasury Bill rate converted
to a weekly interest rate.
The estimated risk coefficients (8) in table 2 are generally significantly
different from zero at the .05 percent level of confidence but these t ratios
are overstated. The "correct" t ratios in table 3 indicate th~ GLS estimates
of 8 have relatively large associated standard errors. Nevertheless, the mag
nitudeof th: estimated risk coefficients is an important finding. It is in-
teresting to compare these with Dusak's results in table 1. The contrast is
striking. Not one of her estimates of the level of systematic risk (8) is
much different from zero and almost all of the t ratios are less than one.
Note that the positive 8 i values in tables 2 and 3 suggest that a signi
ficant portion of the risk associated with holding a wheat, corn, or soybean
futures contract cannot be diversified away. The expected return from holding
these assets should, therefore, be larger than the riskless rate of interest.
Note also that the degree of systematic risk is not constant across contracts
for any of the commodities reported in tables 2 and 3. In the case of soy
beans, the highest estimate of systematic risk measure ;s .936 for the July
contract and the lowest ;s .35 for the September contract (table 3).
The low t ratios associated with the Yi estimates in tables 2 and 3 sug
gest that the degree of systematic risk is no larger during periods when

Table 2. Ordinary Least-Squares Regression Parameters for \~eat, Corn, and Soybeans
• x x " Conu no di t y a 1 ta1 B tS1 °1 t 01 Y1 tr1 1
\~eat:
~1arch (539)a -.024 -(,.87 .721 2. w", .041 7. 14 .)t1'i n.Rn rl<l y (529) -.027 -7. \)q .1104 1 • ; \ .0,17 fl. 1 7 · 7. J J n.t1'! July ( 5 34 ) -.02) -(,.<j\ • 9 ') t 1 . 11 r, .040 (, . n 1 -.17.0 - () • 2 r, September ( 540) -.02J. - (,. J 2 • (,70 2.(,!) · n 1'} (, . (,7 • (, V) 1. 4) December (531 -.022 -fl.JH . • (,r'l1 2.r,') • n 1 'J (, • (, q · ') 7'1 1 . J.1
Corn: March ( 542) -.015 -4.S!J .(,0(' 1. R(, .026 4.93 • 247 n.t1fl r-1<l y ( 538) -.01') -4.')1 .6 J (, 1. '1; .02') 4.80 • 172 n .1 t1 July (544) -.012 -3."4fJ · 4 ') I) 1 • 3 q .o7.n 3.84 · 1 J t1 o . (, !l Septe:nber ( 542) -.014 - 3 . ') 7 • (d,O 1.IlH · n 7. 3 4. 16 .17'; o . J;' December (532) . -.017 -4 .82 .'j7') t . 7n .qJ.R 5.23 • 1 (, .... , n. 7 l
Soybeans:
Janua ry ( 544 ) -.009 - 2. 71 .724 2.24 .020 3. 18 · 21 J a . ) (i March (542) -.010 - 1 • 32 .77 t 2. 7') .02t1 4 . 1 fJ -.041 -0.f)1l r--Iay (538 ) -.011 -}. H!) · (,4 a 1. () 1 • O:! 1 3 . 14 · I 7 n f) . 2. 1 July (544) -.001 - 3. 04 1.044 J. 1 :J • fl 2 (, J. no -.tlfJ7 -n.HI l\ugust (536 ) -.0 II -1.!l4 · 7 l3 2. J 'J · 0 ;~ Il ) . 71 • 2. 4 (, n . t1 :' September (539 ) -.010 - 2 . 'J '} .544 t • ., (, · n:u 1. 4), .1l'!t1 n.H', November (540) "-.010 - J. 2 t .847 2.Q7 · (}) I . ~. "12 -.n;'H -Il.nr,
aFigures in parentheses indicate number of observations.
Source: Estimated.
R2
• 27. · 24 · I 'I · 27. • '2 3
• J ') · 14
I "J • L
• 1 I • 1 (,
• 10 .11 .08 .of) .11 · 10 · 1 2
D.W.
1. 5(1 1. r;"3 1. 77. 1 . 'j r, J • r; 4
1. 42 1. Il 2 1. 'i 2 1. 48 1. J t]
1. (,7 1. 41 1. S4 1. 47 1. 4 (, 1. 48 1. 4 ~
~ VI
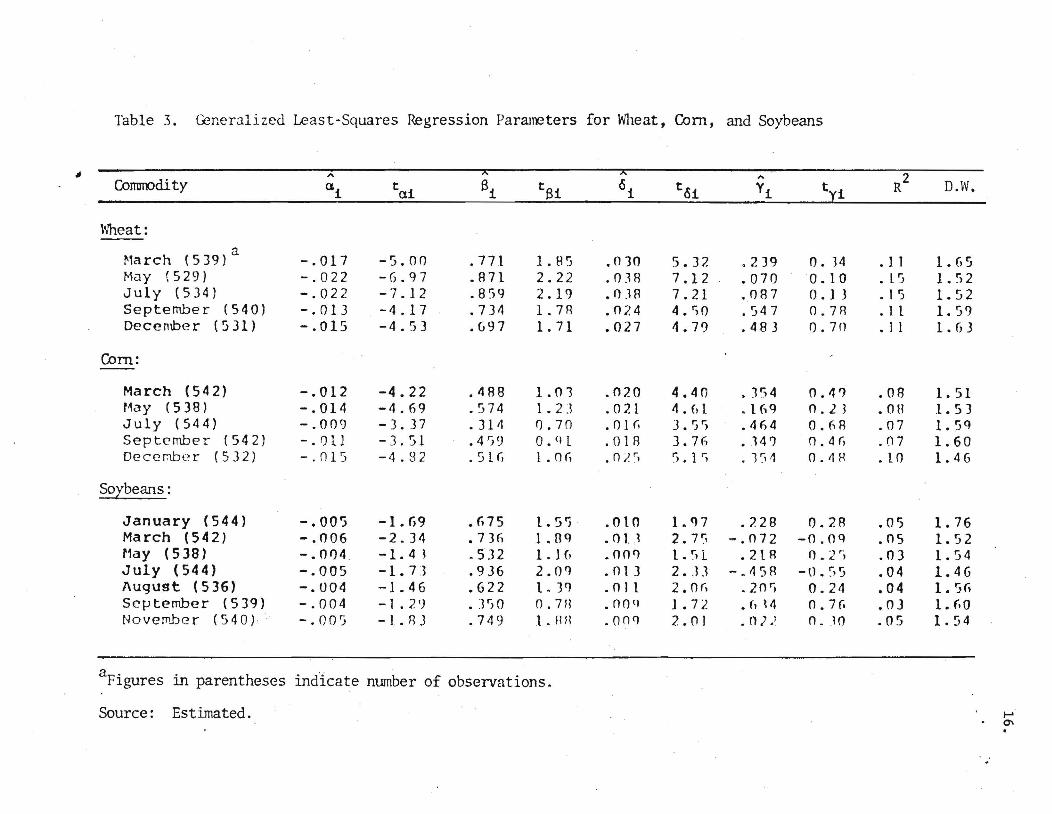
Table 3. Generalized Least-Squares Regression Parrureters for Wheat, Corn, and Soybeans
~ " '" A "-
ColTUOOdi t Y a i tai t\ tSi 6i to! Yi tYi
Wheat:
~'arch (539) a -.017 -5.00 .771 1. H 5 .010 5.32 .2)9 O. 14 Mo:1Y (529) -.022 -G.97 .R71 2.22 .038 7.12 .070 0.10 July ( 534 ) -.022 -7.12 .859 2.19 .038 7.21 .087 O. 1 3 September (540) -.013 " -4.17 · 7 J 4 1. 7R .024 4.')0 · 54 7 0.7R December (J 31) -.015 -4.5) .G97 1. 71 .027 4.7~ .48 3 0.70
Corn:
March (542) -.012 -4.22 .498 1. 0"3 .020 4.40 • J,) 4 0.4') r1ay (538 ) -.014 -4.69 .S74 1. 2 J .021 4 • (,1 .169 0.2 3 July ( 544' -.009 - 3. J 7 · 31 tl 0.70 . 0 1 (, J.'j') .464 0.68 September ( 542) -.011 -3.51 · 4'> <J 0.q1 .018 3.76 • "14') o . 4 r, December ( 532) -.015 -4.82 · 'j H, 1 . 0 (, .0 r, 5 . 1 'l · 1 ~,., O.tlH
Soybeans:
January (544) -.00'3 -1.(,9 .(j75 1. 5 r; .010 1. q7 .7.28 0.28 March (542) -.006 -2. 34 • 7 3 fl 1. nq .01' 2.7r:. -.072 -O.Oq r1ay (538 ) -.0()4 -1. 4 ~ .532 1 . 1 (, .001) 1. r,l .2 t 8 o 0) r-
,. L .,
July (544) -.005 -1.73 .936 2.01") .01 ) 2. J 3 -.458 -0.:,5 I\ugust (536) -.004 -1.46 .622 1 . 3 fJ .011 2.0(, .20r, 0.24 September (539 ) -.004 - 1 . 2 tJ • J'j 0 n.7!! .noq 1 .7"2- · (, ~" 0.7(. November (540) "0" -.00') -1.R3 · 749 1 . H fl .OOf) 2.("11 .0 l " o . .10
aFigures in parentheses indOicate number of observations.
Source: Estimated.
R2
.11 · l 'j · I 'j .11 · ) 1
.08
.O!!
.07
.07 · 10
.05
.05
.03
.04
.04
.OJ
.05
D.W.
1. (j 5 1. 52 1. :, 2 1. 59 1. 6 3
1. 51 1. 5) 1. 'jq
1. 60 1. 4 G
1. 76 1. 'j 2 1. 54 1. 46 1. 'j (j 1.60 1. ~4
1-'" 0\

17.
speculators are net short than it is during the periods when they are net
long. These results must be interpreted with some caution in light of the
fact that Xt and Xt • Zt in equation (8) are not orthogonal. 7
For the nonmarket rate of returns measure (a j ) and its systematic change
associated with net speculator positions, the results are extremely interest-
ing. The estimated a. and ~. values are almost all significantly differ-1 1
ent from zero and the ~i values tend to be roughly twice as large as the
ai values, and they are of opposite sign. This result provides an interest-
ing interpretation of the Cootner hypothesis. Recall that the value of a . = J
a i + 6iZt represents the expected value of the nonmarket component of a -futures contract's excess return. When Zt is equal to .5, the net pos it ion
of speculators is neither long nor short; and the results in tables 2 and 3
-suggest that the nonmarket returns are near zero. When Zt > .5, speculators
are net long and the rate of return is greater than the amount predicted by -
the market model. Similarly, when Zt < .5, speculators are net short, and
there are negative returns in excess of the market return. Negative returns
are desirable to a short speculator. The value of ~. + i.z t repres~nts 1 1
the expected value of the nonmarket component of a futures contract's excess
return. Our results indicate that it is significantly different from zero and
that it is a function of net speculative positions. This provides support for
the Cootner hypothesis of a significant degree of normal backwardation in the
futures market given an appropriate interpretation of the net position of
speculators.
For commo rl ities more closely related to the general l evel of economic
activity (cot t on and live cattle), the GLS estimates are r eported in table 4.
These result s for the nonmarket component, ~i + ~iZt' conform to the
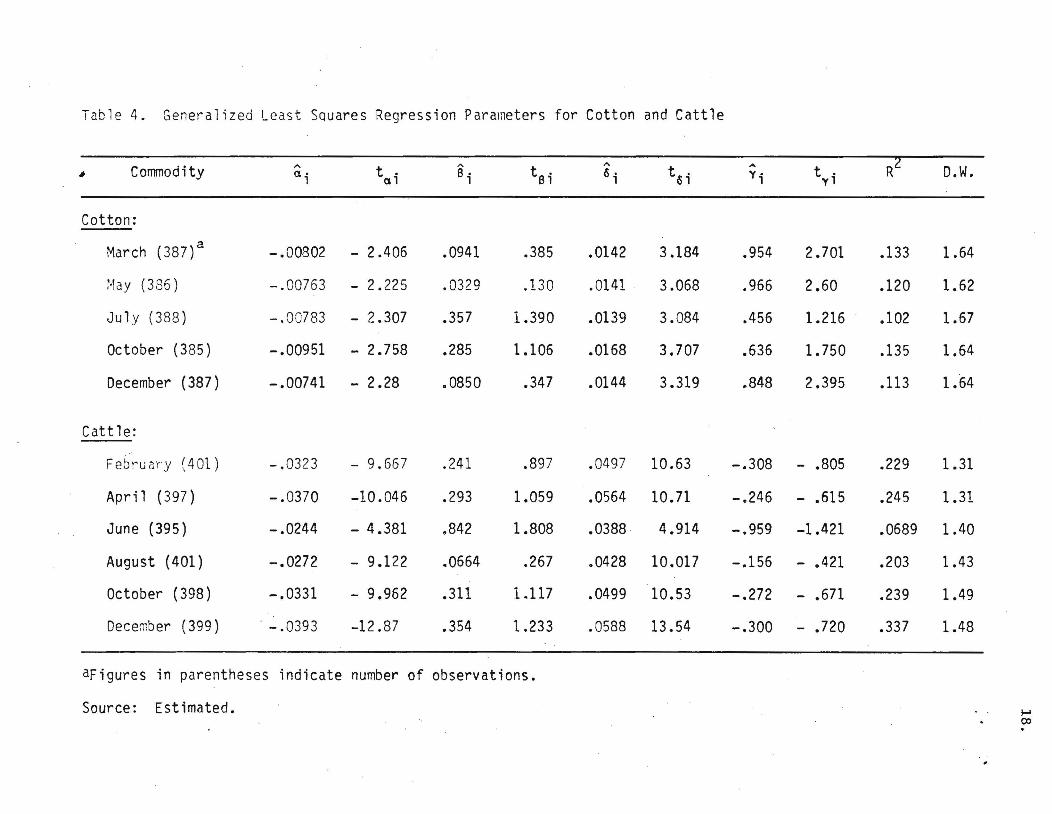
Table 4. Generalized Least Squares Regression Parameters for Cotton and Cattle
Commodity '" "-
tel "-
t6; ... R2 D.W. ~ a· t . e; 6· y. t .
1 al 1 1 yl
Cotton:
March (387) a - .00802 - 2.406 .0941 .385 .0142 3.184 .954 2.701 .133 1.64
Hay (386) -.00763 - 2.225 .0329 .130 .0141 . 3.068 .966 2.60 .120 1.62
July (388) -.00783 - 2.307 .357 1.390 .0139 3.084 .456 1.216 .102 1.67
October (385) -.00951 - 2.758 .285 1.106 .0168 3.707 .636 1.750 .135 1.64
December (387) -.00741 - 2.28 .0850 .347 .0144 3.319 .848 2.395 .113 1.64
Cattle:
February (401) -.0323 - 9.667 .241 .897 .0497 10.63 -.308 - .805 .229 1.31
April (397) -.0370 -10.046 .293 1.059 .0564 10.71 -.246 - .615 .245 1.31
June (395) -.0244 - 4.381 .842 1.808 .0388 4.914 -.959 -1.421 .0689 1.40
August (401) -.0272 - 9.122 .0664 .267 .0428 10.017 -.156 - .421 .203 1.43
October (398) -.0331 - 9.962 .311 1.117 .0499 10.53 -.272 - .671 .239 1.49
December (399) . - .0393 -12.87 .354 1.233 .0588 13.54 -.300 - .720 .337 1.48
aFigures in parentheses indicate number of observations.
Source: Estimated. ..... co .
19.
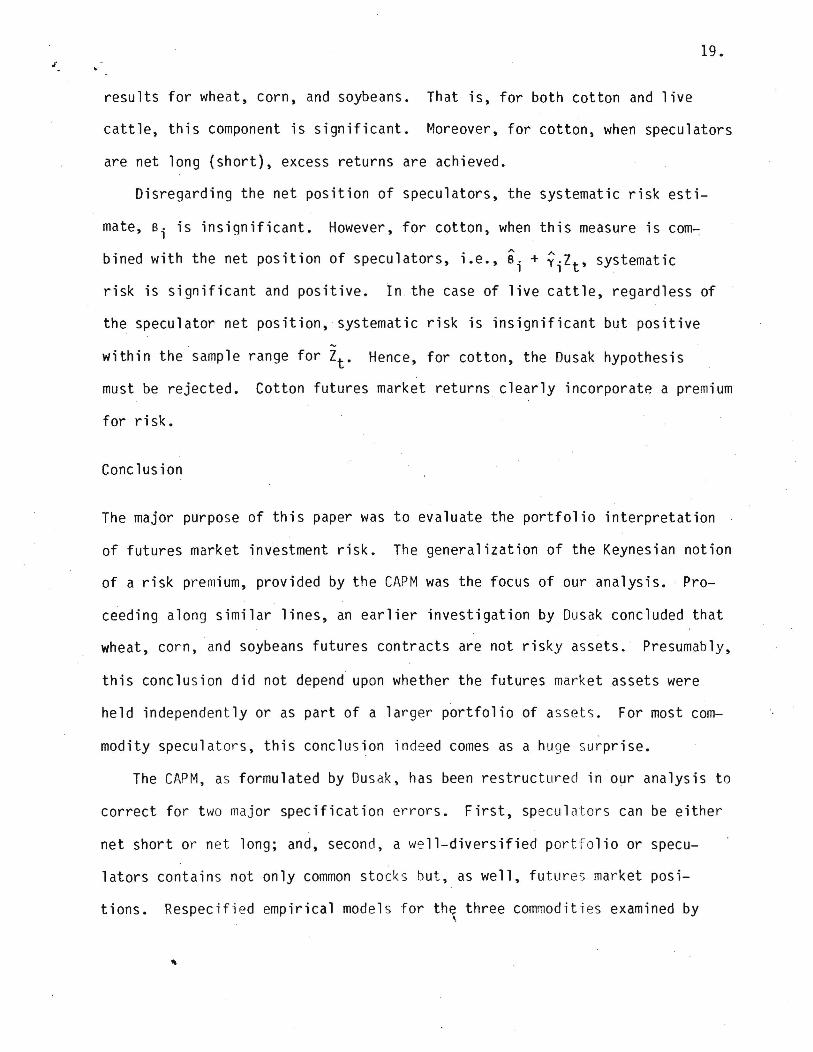
results for wheat, corn, and soybeans. That is, for both cotton and live
cattle, this component is significant. Moreover, for cotton, when speculators
are net long (short), excess returns are achieved.
Disregarding the net position of speculators, the systematic risk esti-
mate, Bi is insignificant. However, for cotton, when this measure is com~ A
bined with the net position of speculators, i.e., Bi + YiZt' systematic
risk is significant and positive. In the case of live cattle, regardless of
the speculator net position, systematic risk is insignificant but positive
within the sample range for Zt. Hence, for cotton, the Dusak hypothesis
must be rejected. Cotton futures market returns clearly incorporate a premium
for risk.
Conclusion
The major purpose of this paper was to evaluate the portfolio interpretation
of futures market investment risk. The generalization of the Keynesian notion
of a risk premium, provided by the CAPM was the focus of our analysis. Pro-
ceeding along similar lines, an earlier investigation by Dusak concluded that
wheat, corn, and soybeans futures contracts are not risky assets. Presumably,
this conclusion did not depend upon whether the futures market assets were
held independently or as part of a larger portfolio of assets. For most com-
modity speculators, this conclusion indeed comes as a huge surprise.
The CAPM, as formulated by Dusak, has been restructured in our analysis to
correct for two major specification errors. First, speculators can be either
net short or net long; and, second, a well-diversified portfolio or specu-
lators contains not only common stocks but, as well, futures market posi-
tions. Respecified empirical models for th\ three commodities examined by

20~ ~
Dusak--wheat, corn, and soybeans--reveal significant and positive systematic
risk for a number of futures contracts. In addition, the "nonmarket" rate of
return measure proved to be generally significant. For commodities more
closely linked to the general level of economic activity (cotton and live
cattle), similar results were obtained. The results for cotton are particu
larly striking. Not only do net long (short) speculators earn excess returns
but the degree of systematic risk is conditioned upon whether speculators are
net short or net long.
Foran efficient portfolio and an application of the CAPM to futures con
tracts that allows for changing speculative position, our analysis supports
the generalized Keynesian theory of "normal" backwardation. Given an appro
priate interpretation of the net position of speculators, a generalized ver
sion of Cootner's risk premium is also consistent with our results. In any
event, commodity speculators who have lost large sums of money will be
deli~hted to learn that, in general, the risk they faced could not have been
"diversified away."
\

.. . .. 21.
References
Black, F. liThe Pricing of Commodity Contracts." Journal of Financial Eco
nomics 2(1976): 167-79.
Bodie, Z., and Rosansky, V. I. "Risk and Return in Commodity Futures."
F inanci a 1 Analysts Journal 36 (May-June, 1980): 27-31.
Campanella, F. B. The Measurement of Portfolio Risk Exposure. Lexington,
Mass.: Lexington Books, 1972.
Cootner, P. H. "Returns to Speculators: Telser Versus Keynes." Journal
of Political Economy 68, no. 4 (August 1960): 396-404.
Dusak, K. "Futures Trading and Investor Returns: An Investigation of
Corrunodity Market Risk Premiums." Journal of Political Economy 81, no. 6
(November/December 1973): 1387-1406.
Johnson, L. L. liThe Theory of Hedging and Speculation in Commodity Futures."
Review of Economic Studies 27(June 1960): 139-51.
Keynes, J. N. A Treatise on Money. Vol. 2. London: Macmillan, 1930.
Kon, S. J., and Jen, F. C. · "Estimation of Time-Varying Systematic Risk and
Performace for Mutual Fund Portfolios: An Application of Switching Re~
gression."· Journal of Finance 2(1978): 457-75.
Lintner, J. "Security Prices, Risk, and Maximal Gains from Diversification."
Journal of Finance 20, no. 4 (December 1965a): 587-615.
liThe Valuation of Risk Assets and the Selection of Risky Invest
ments in Stock Portfolios and Capital Budgets." Review of Economics and
Statistics 47, no. 1 (February 1965b): 13-37.
Mundlak, Y., and Rausser, G. C. "Structural Change, Parameter Variation,
and Forecasting." Working Paper No. 76. Department of Aqricultural and
Resource Economics, University of California, Berkeley, 1979.

Rockwell, C. S. "Normal Backwardation, Forecasting, and the Returns to
Commodity Futures Traders." Food Research Institute Studies 7(1967):
107-30.
Samuelson, Paul. "Proof that Properly Anticipated Prices Fluctuate Randomly."
Industrial Management Review 6(Spring 1965): 41-50.
Schiff, M. W. "The Comparative Predictive Accuracy of Rational Expectations
Price Forecasts and Future Prices or do Futures Prices Incorporate a Risk
Premium?" unpublished paper, University of Chicago, 1981.
Schrock, N. W. "The Theory of Asset Choice: Simultaneous Holding of Short
and Long Positions in Futures Markets." Journal of Political Economy 79,
no. 2 (March/April 1971): 270-93.
Sharpe, W. "Capital Asset Prices: A Thoery of Market Equilibrium Under Con
. ditions of Risk." Journal of Finance 19(5eptember 1964): 425-42.
Investments. Englewood Cliffs, NJ: Prentice-Hall, 1978.
Stein, Jerome L. "Speculative Price: Economic Welfare and The Indiot of
Chance." Review of Economics and Statistics 63(May 1981): 223-232.
Stoll, Hans R. "Commodity Futures and Spot Price Determination and Hedging in
Capital Market Equilibrium." Journal of Financial and Quantitative Analy
sis 15(1979): 873-94.
Sunder, S. "An Empirical Study of Stock Prices and Risk as They Relate to
Accounting Changes in Inventory Valuation Methods." Ph.D. dissertation,
Carnegie-Mellon University, 1973.
Telser, L. G. "Futures Tradinq and the Storage of Cotton and Wheat."
Journal of Political Economy 66, no. 3 (June 1959): 233-55.
"Returns to Speculators: Telser~. Keynes: Reply." Journal
of Pol it i ca 1 Economy 67 (August 1960): \404-15.

• , Footnotes
* Giannini Foundation Paper No.
23 •
(for identification only).
lAS with a good portion of Keynes' work, his theory of normal backward a-
tion has been given many interpretations. The following discussion of this
theory is, therefore, more of a discussion of post-Keynes interpretations of
his theory.
2loosely defined, when the futures market price, PT(t) at time t, of a
contract which matures at time, T, is an unbiased estimate of the forthcoming
spot price at T discounted by any long-run trends, the efficiency criterion is
satisfied. For further clarification, see Samuelson (1965) and Stein (1981).
3Commodities held by public firms, whose stocks are included in the S&P
Index, are implicitly included in her market index even though she does not
state so.
4The specific level of risk is the risk of a futures contract that is
independent of the "market" (portfolio) returns. Cootner and Telser measured
the risk of a futures contract solely by its own price variability. We are
interpreting their arguments to also apply to u j = Rt - 8jXt - Et.
5For the formal derivations and frameworks for other time-varying parame
ter formulations, see Mundlak and Rausser (1979).
6Excludes spreading positions.
7Given the very large sample sizes used, we can be reasonably confident
th at the estimates of Band yare robust; but du e to the multicoll~nearity
problem, their associated standard errors may be imprecise. It should be
not ~d, however, that, wh en the interaction term (xtZ t ) was deleted, the
bas ic results were robust. ,

., . .i
Top Related