


Languages
Pages
Legal

Effects of water salinity and exercise on Atlantic salmon performance as postsmolts in land-based closed-containment systems
B.F. Terjesen1*, T. Ytrestøyl1, J. Kolarevic1, S. Calabrese2,3, B.O. Rosseland4, H-C. Teien4, Å. Åtland5, T.O. Nilsen2, S. Stefansson2, S.O. Handeland6, Jorn Schoordik7, jH. Takle1
1Nofima, 2Univ. of Bergen, 3Marine Harvest Norway, 4Norw. Univ. of Life Sciences; 5NIVA; 6UNI Research; 7Hoogeschool Zeeland
11.09.2013 1AIW#5
Background
• Loss of fish in Norwegian production at same level now, ~20% during cage phase, as 12 years ago (Arealutvalget 04/02/11)
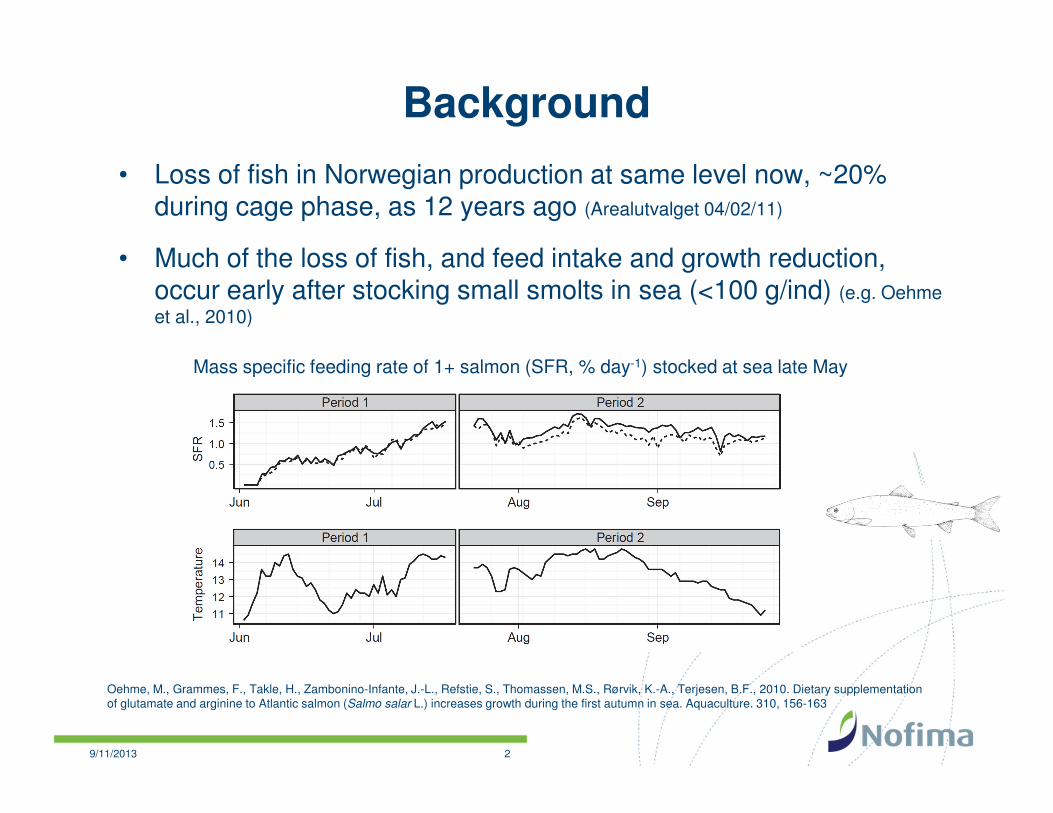
• Much of the loss of fish, and feed intake and growth reduction, occur early after stocking small smolts in sea (<100 g/ind) (e.g. Oehmeet al., 2010)
9/11/2013 2
Oehme, M., Grammes, F., Takle, H., Zambonino-Infante, J.-L., Refstie, S., Thomassen, M.S., Rørvik, K.-A., Terjesen, B.F., 2010. Dietary supplementation of glutamate and arginine to Atlantic salmon (Salmo salar L.) increases growth during the first autumn in sea. Aquaculture. 310, 156-163
Mass specific feeding rate of 1+ salmon (SFR, % day-1) stocked at sea late May
Background cont’d
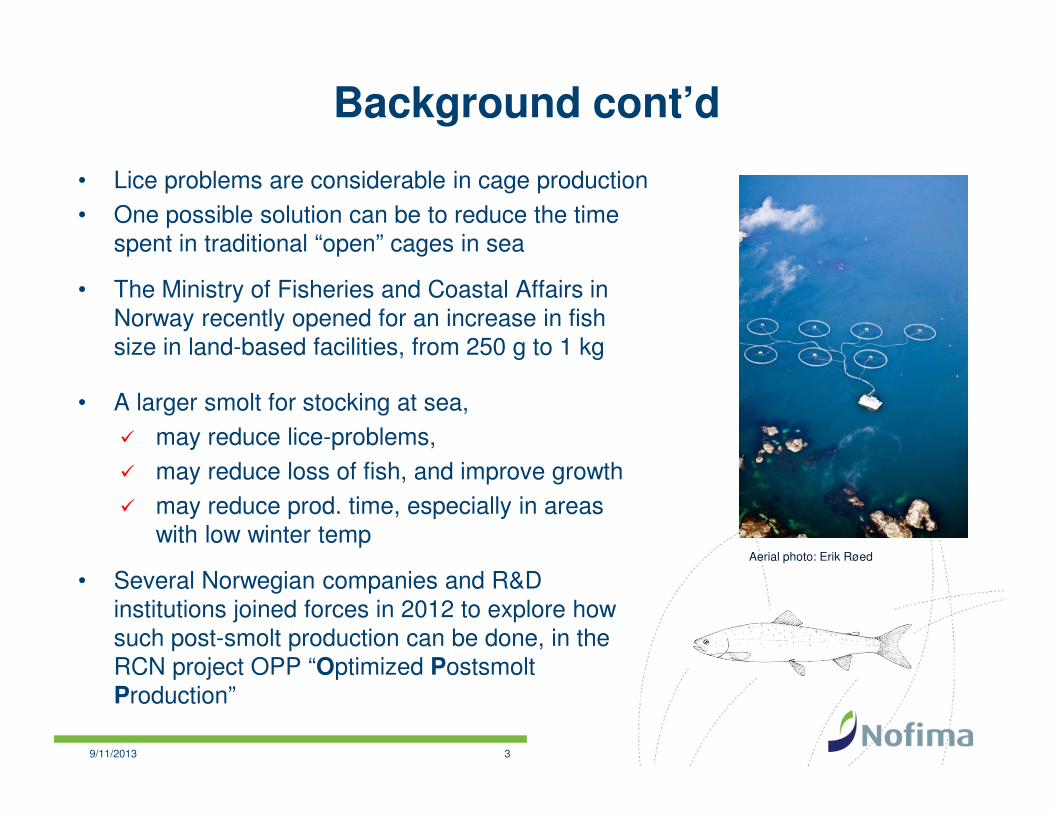
• Lice problems are considerable in cage production• One possible solution can be to reduce the time
spent in traditional “open” cages in sea
• The Ministry of Fisheries and Coastal Affairs in Norway recently opened for an increase in fish size in land-based facilities, from 250 g to 1 kg
• A larger smolt for stocking at sea,� may reduce lice-problems, � may reduce loss of fish, and improve growth� may reduce prod. time, especially in areas
with low winter temp
• Several Norwegian companies and R&D institutions joined forces in 2012 to explore how such post-smolt production can be done, in the RCN project OPP “Optimized PostsmoltProduction”
9/11/2013 3
Aerial photo: Erik Røed
Main objective in OPP
To develop basic and applied knowledge about how the time spent in open cages in sea can be reduced, by increasing the time on land or in semi-closed systems at sea, and to determine the consequences for the performance, physiology, and welfare of the fish and production costs
9/11/2013 4
Smolt prod in freshwaterRAS land-
based
Postsmolt in seawater? RAS land-
based
Shorter periodin cagesbefore
slaughter
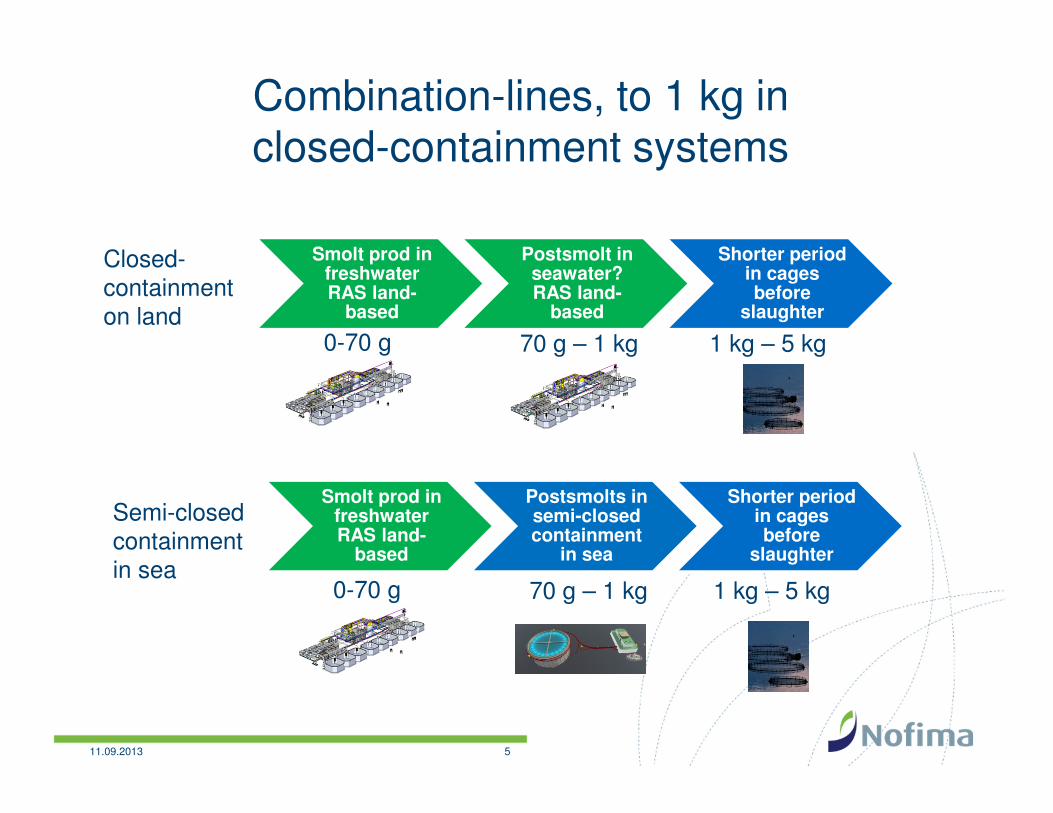
Combination-lines, to 1 kg in closed-containment systems
11.09.2013
0-70 g 70 g – 1 kg 1 kg – 5 kg
Closed-containmenton land
5
Smolt prod in freshwaterRAS land-
based
Postsmolts in semi-closedcontainment
in sea
Shorter periodin cagesbefore
slaughter
0-70 g 70 g – 1 kg 1 kg – 5 kg
Semi-closedcontainmentin sea

OPP: Problems to tackle
• Problem: Cato Lyngøy, former Group Technical Manager Technology & Environment Marine Harvest, and chairman in OPP:
«So far we have not seen any closed-containment system that is sufficiently cost-effective, for production of a postsmolt up to 1 kg, neither on land or in sea» (IntraFish, 29/10/12)
• Problem: Insufficient biological knowledge of what the physiological requirements of Atlantic salmon postsmolts are in closed containment systems, for optimal technology performance, fish performance, welfare, and health
9/11/2013 6
To be tested in OPP: Land-based RAS (recirculating aquaculture systems) for production to 1 kg
To be tested in OPP: Production in semi-closed containment systems in sea to 1 kg (21 000 m3 vol, 450 m3/min flow)
Photo: Aquafarm Equipment
Nofima Centre for Recirculation in Aquaculture, Sunndalsøra, Norway

Salinity in land-based RAS, combination-line
• SW-RAS may have higher running costs than FW-RAS due to:
� CO2 removal efficiencies are lower in SW than in FW (e.g. Moran, 2010)
� Ammonia removal is lower in SW compared to FW (e.g. Chen et al, 2006)
• Results in need for largerinstallation and/or higher flow
• Or can postsmolts be kept at lower salinity in RAS, and still handle full-strength SW at stocking in sea?
9/11/2013 7
Nofima Centre for Recirculation in Aquaculture (NCRA), Sunndalsøra, Norway
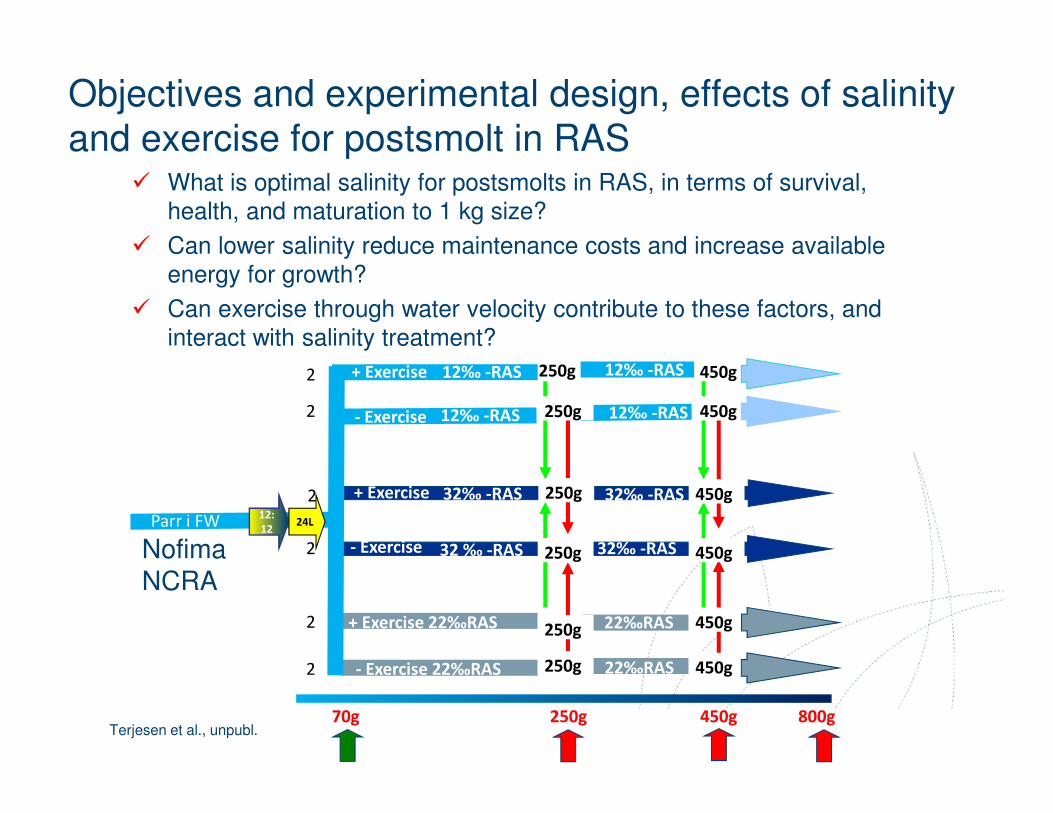
Objectives and experimental design, effects of salinity and exercise for postsmolt in RAS
� What is optimal salinity for postsmolts in RAS, in terms of survival, health, and maturation to 1 kg size?
� Can lower salinity reduce maintenance costs and increase available energy for growth?
� Can exercise through water velocity contribute to these factors, and interact with salinity treatment?
9/11/2013 8
FT
70g 250g 450g 800g
2
Parr i FW
250g 450g
32 ‰ -RAS
12‰ -RAS 12‰ -RAS
2
+ Exercise
+ Exercise2
2
2
- Exercise 12‰ -RAS 12‰ -RAS
- Exercise
32‰ -RAS 32‰ -RAS
2
12:
1224L
250g
250g
250g
450g
450g
+ Exercise 22‰RAS
32‰ -RAS
- Exercise 22‰RAS
22‰RAS
22‰RAS
250g
250g 450g
450g
450g
NofimaNCRA
Terjesen et al., unpubl.

Methods
11.09.2013 9
• 3 separate RAS with salinities 12, 22 and 32 ppt, and two exercise levels,
i.e. a 3x2 factorial study
• 7 200, 70 g smolts were stocked in 12 tanks (3.2 m2), duplicate/treatment
• 12:12h light:dark during the experiment, 12-13°C, high marine protein
commercial diet (Havsbrun, 3-4 mm pellet), feed intake measurements
• On-line measurements of e.g flow, pH, ORP, temperature, O2
• A range of tissue samples collected, for trad. physiology, histology, and
molecular physiology

11.09.2013 10
RAS configuration during trial
Belt filter
w/sludge discharge
Degasser
Pump sump
w/overflow
RAS 2
Central
water
treatment
room
Experimental
hall 1/2/3
Oxygenation
Pump sump
w/overflow
Fish tank
Sidewall
drain
Swirl
separator
w/sludge
discharge
Fish tank
Fish tank
Moving bed bioreactor
Make-up
water
with flowmeter
Pump
Ozone injection
w/degas separator
Ozone side-stream
1
23
4
5
6
78
9 10
9
11
11
12
Terjesen et al., unpubl.

Date
01.o
kt.1
2
15.o
kt.1
2
29.o
kt.1
2
12.n
ov.12
26.n
ov.12
10.d
es.1
2
24.d
es.1
2
07.ja
n.13
Bod
y le
ngth
s/se
c
0.0
0.2
0.4
0.6
0.8
1.0
1.2
1.4
Exp. day
0 20 40 60 80 100
32ppt minus exercise12ppt minus exercise22ppt minus exercise32ppt plus exercise 12ppt plus exercise 22ppt plus exercise
Swimming speed (BL/s) to ~250 g
11.09.2013 11
Flow132 l/min
Flow132 l/min
Flow85 l/min
Flow85 l/min
Mean± range (n=2 tanks per treatment)
9%
35%
63%
% o
f tot
al ta
nk d
epth
38 36 28 2318 10 8
% of total tank width
Tank inlet
Direction of the water flow
Lateral tankview
Top view
Terjesen et al., unpubl.

RAS conditions
11.09.2013 12
RASTemp
°CpH
CO2
mg/l
Alkalinity
CaCO3 mg/l
% Reused
flow
% Water
exchange
/day
Feedload ,
% of capacity
Feedload/
water exh
(kg/m3 /day)
12‰ 12.4±0.9 7.5±0.2 6.1±1.5 72±20 98.7±0.8 25±7 11.0±3.4 0.44±0.30
22‰ 12.1±0.8 7.6±0.1 7.0±0.2 110±26 98.8±0.7 24±6 10.6±3.9 0.49±0.28
32‰ 12.6±0.9 7.8±0.1 6.9±0.4 137±33 98.9±0.4 25±2 9.1±3.9 0.46±0.20
Terjesen et al., unpubl.
0.0
0.1
0.2
0.3
0.4
0.5
0.6
0.7
0.8
15.10.12 08.11.12 05.12.12 03.01.13 26.02.13 07.05.13
TAN
co
nce
ntr
ati
on
(m
g/L
)
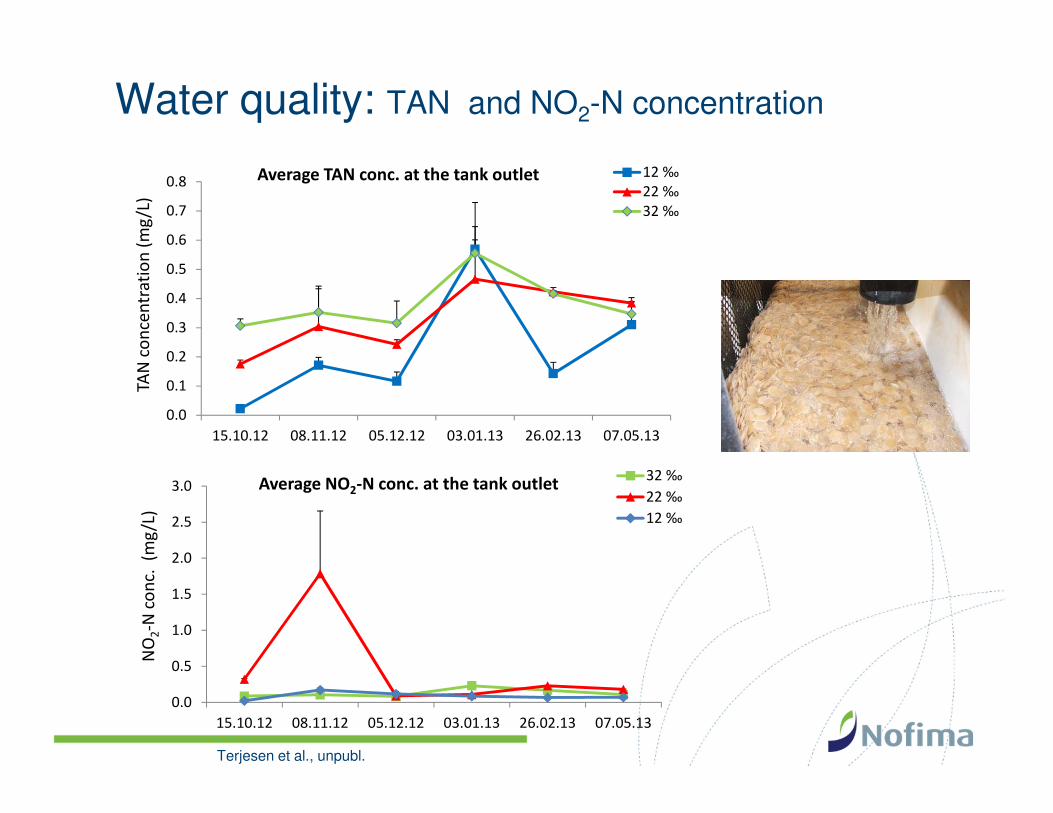
Average TAN conc. at the tank outlet 12 ‰
22 ‰
32 ‰
Water quality: TAN and NO2-N concentration
0.0
0.5
1.0
1.5
2.0
2.5
3.0
15.10.12 08.11.12 05.12.12 03.01.13 26.02.13 07.05.13
NO
2-N
co
nc.
(m
g/L
)
Average NO2-N conc. at the tank outlet32 ‰
22 ‰
12 ‰
Terjesen et al., unpubl.
3638
49
34
22 21
0
1317
0
10
20
30
40
50
60
04.12.12 03.01.13 07.05.13
TAN
re
mo
val e
ffic
ien
cy (
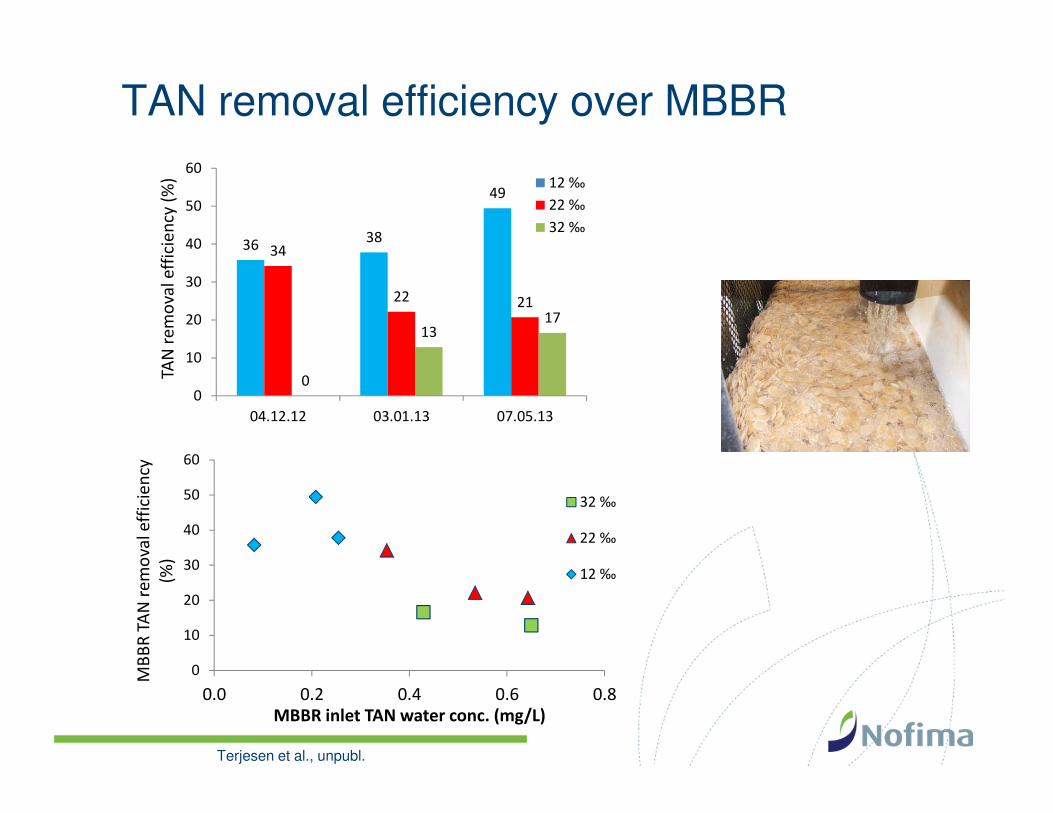
%) 12 ‰
22 ‰
32 ‰
TAN removal efficiency over MBBR
0
10
20
30
40
50
60
0.0 0.2 0.4 0.6 0.8
MB
BR
TA
N r
em
ova
l e
ffic
ien
cy
(%)
MBBR inlet TAN water conc. (mg/L)
32 ‰
22 ‰
12 ‰
Terjesen et al., unpubl.
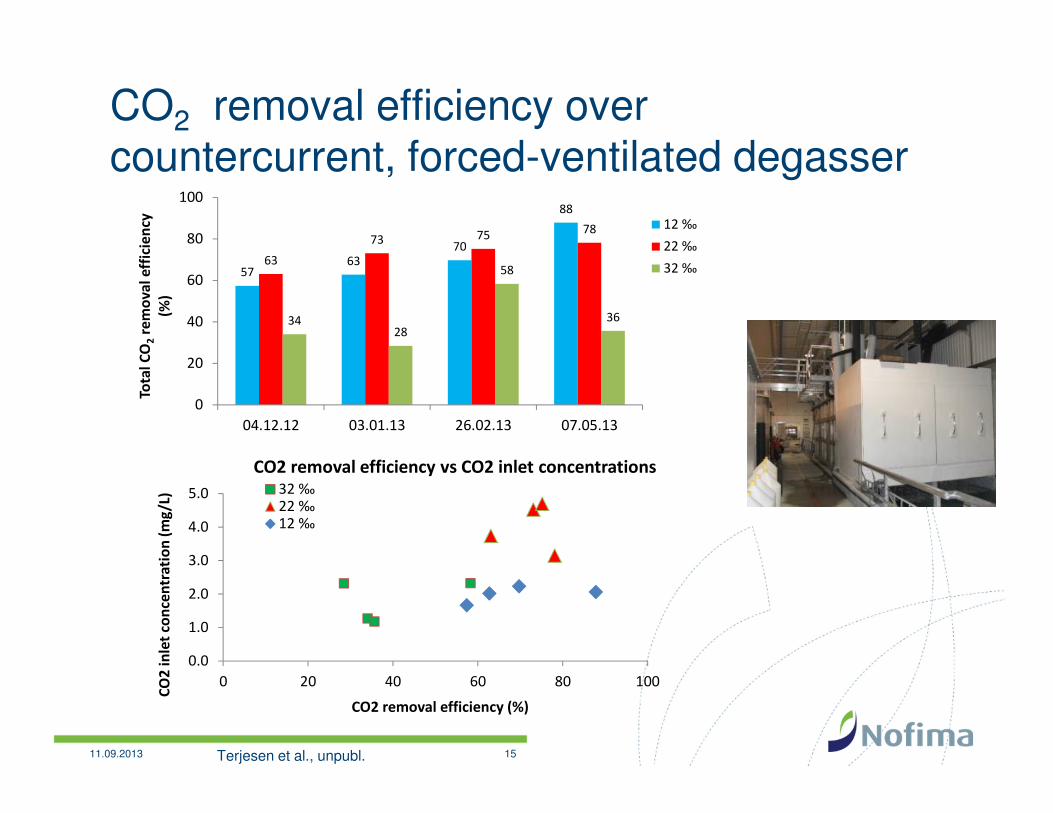
CO2 removal efficiency over countercurrent, forced-ventilated degasser
11.09.2013 15
5763
70
88
63
73 7578
3428
58
36
0
20
40
60
80
100
04.12.12 03.01.13 26.02.13 07.05.13
Tota
l C
O2
rem
ov
al
eff
icie
ncy
(%)
12 ‰
22 ‰
32 ‰
0.0
1.0
2.0
3.0
4.0
5.0
0 20 40 60 80 100
CO
2 i
nle
t co
nce
ntr
ati
on
(m
g/L
)
CO2 removal efficiency (%)
CO2 removal efficiency vs CO2 inlet concentrations32 ‰22 ‰12 ‰
Terjesen et al., unpubl.

11.09.2013 test 16
Postmolt sampled at ~250 g, produced in 12 ppt S RAS
12 ppt 22 ppt 32 ppt
200
220
240
260
280
300
320
bo
dy
we
igh
t(g
)
250 g training no training
Salinity: p˂0.01
Training: p˂0.01
Ind. weight at ~250 g/ind
Salinity
12 22 32
The
rmal
gro
wth
coe
ffici
ent
1.8
2.0
2.2
2.4
2.6
TrainingNo training
Factor salinity:p<0.001
Faktor exercisep<0.01
Salinity*exercise:p<0.05
TGC to~250 g/ind
Terjesen et al., unpubl.

Postmolts sampled at ~800 g, produced in RAS
TGC entire experiment
Salinity, ppt
12 22 32
Th
erm
al g
row
th c
oe
ffc
ien
t
0.0
1.6
1.8
2.0
2.2
Factor salinity, p<0.01
Factor exercise, p<0.01
Exercise
No exercise
12 ppt 22 ppt 32 ppt
400
500
600
700
800
900training no training
Salinity: p˂0.01
Training: p˂0.01
Final weight
Terjesen et al., unpubl.

Male gonad size 800 g/indMale gonad size 250 g/ind
Salinity
12 22 32Go
nad
oso
mati
c in
dex (
% B
W-1
)
0.00
0.02
0.04
0.06
0.08
0.10
0.12Exersise
No excersise
Faktor saliniNSFaktor treninNS
Salinity
12 22 32Go
nad
oso
mati
c in
dex (
% B
W-1
)
0.00
0.02
0.04
0.06
0.08
0.10
0.12Exersise
No excersise
Faktor salinitet:NSFaktor trening:NS
Salinity
12 22 32
Card
ioso
mati
c in
dex (
% B
W-1
)
0.070
0.075
0.080
0.085
0.090
ExerciseNo exercise
Faktor salinitet:p<0.001
Faktor trening:p<0.001
Heart index 250 g/ind Heart index 800 g/ind
Results: Organ indexes at 250 and 800 g
Terjesen et al., unpubl.
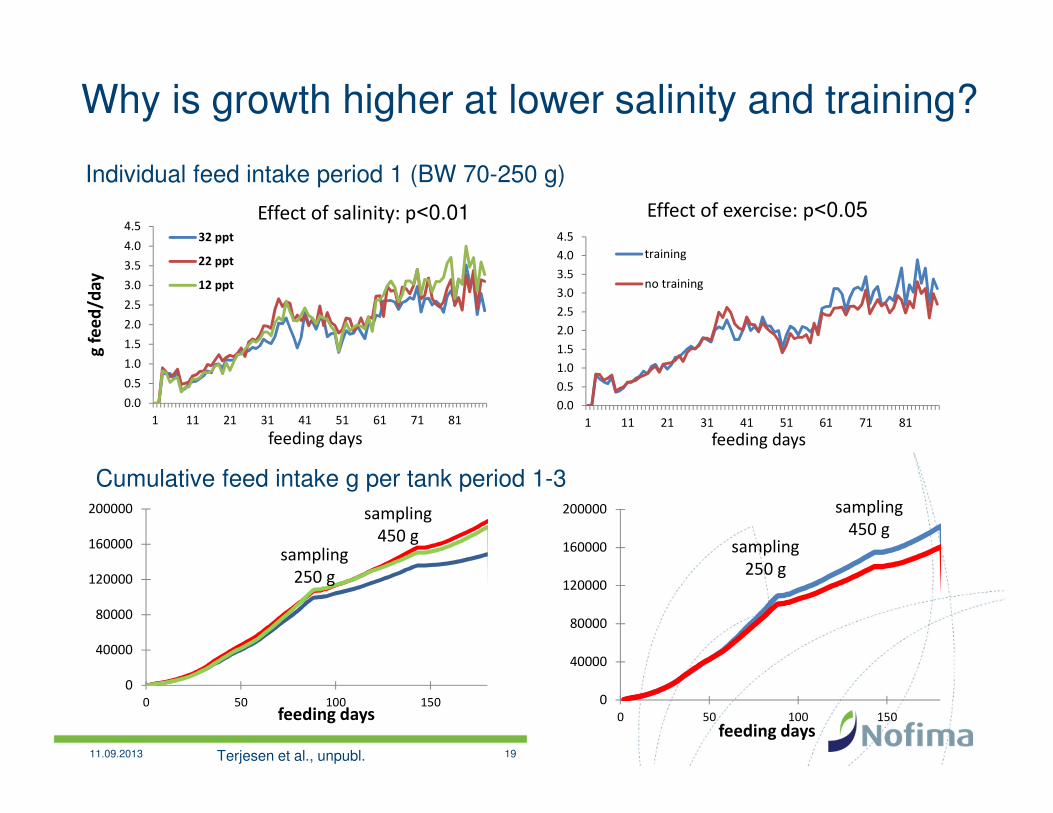
Why is growth higher at lower salinity and training?
11.09.2013 19
0.0
0.5
1.0
1.5
2.0
2.5
3.0
3.5
4.0
4.5
1 11 21 31 41 51 61 71 81
g f
ee
d/d
ay
feeding days
Effect of salinity: p˂0.0132 ppt
22 ppt
12 ppt
0.0
0.5
1.0
1.5
2.0
2.5
3.0
3.5
4.0
4.5
1 11 21 31 41 51 61 71 81
feeding days
Effect of exercise: p˂0.05
training
no training
Individual feed intake period 1 (BW 70-250 g)
Cumulative feed intake g per tank period 1-3
0
40000
80000
120000
160000
200000
0 50 100 150feeding days
sampling
250 g
sampling
450 g
0
40000
80000
120000
160000
200000
0 50 100 150
feeding days
sampling
450 gsampling
250 g
Terjesen et al., unpubl.
Fish weight (g)
0 200 400 600 800
% C
um
mu
lati
ve s
urv
ival
0
50
60
70
80
90
100
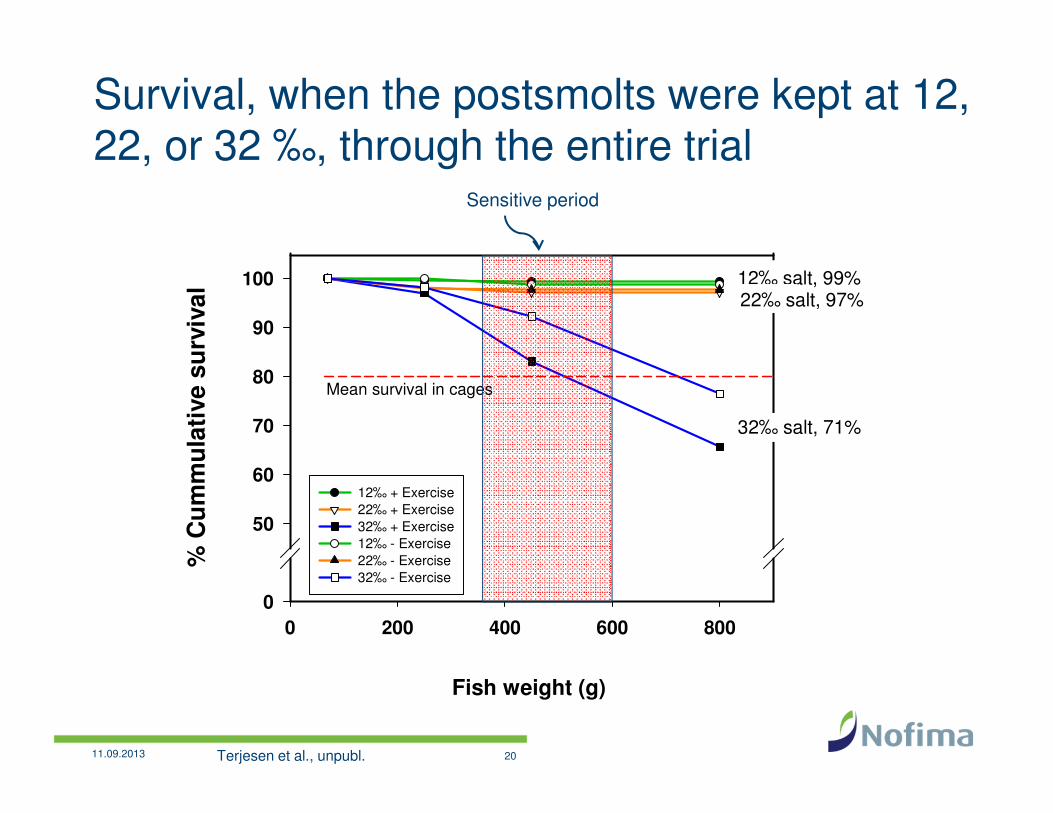
12‰ + Exercise22‰ + Exercise32‰ + Exercise12‰ - Exercise22‰ - Exercise32‰ - Exercise
12‰ salt, 99%22‰ salt, 97%
32‰ salt, 71%
Mean survival in cages
Survival, when the postsmolts were kept at 12, 22, or 32 ‰, through the entire trial
11.09.2013
Sensitive period
20Terjesen et al., unpubl.
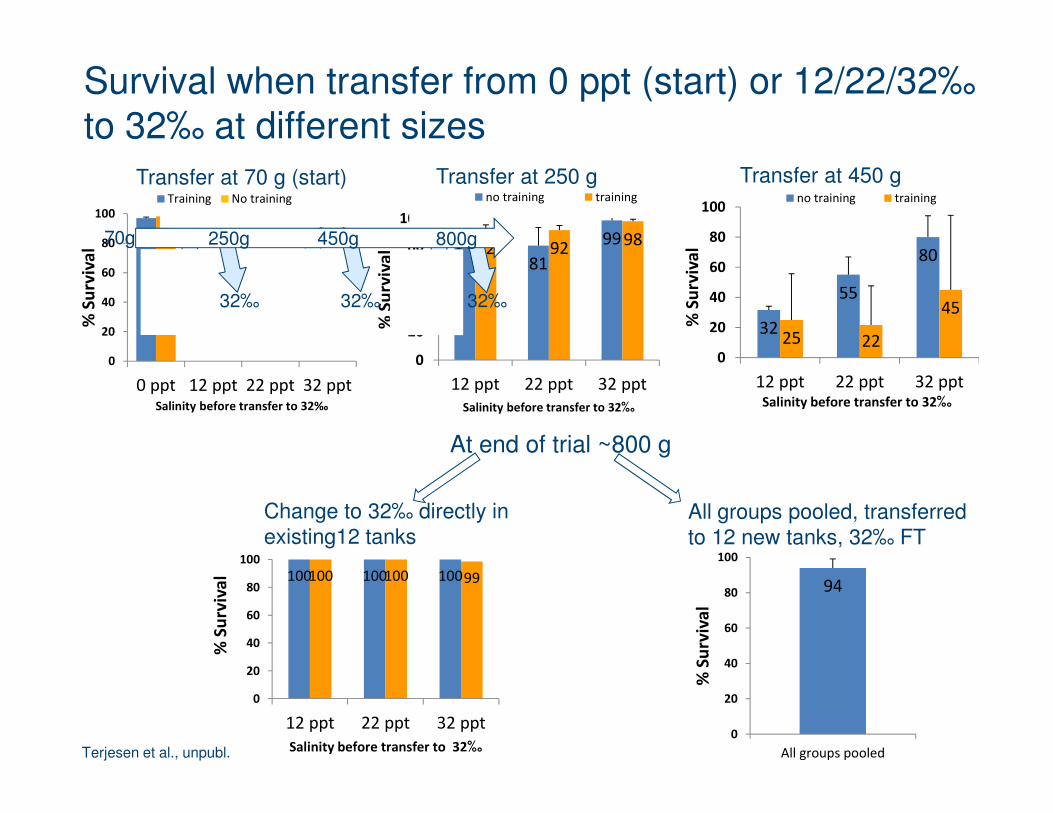
9681
9992 92
98
0
20
40
60
80
100
12 ppt 22 ppt 32 ppt%
Su
rviv
al
Salinity before transfer to 32‰
no training training
Transfer at 250 g
32
55
80
25 22
45
0
20
40
60
80
100
12 ppt 22 ppt 32 ppt
% S
urv
iva
l
Salinity before transfer to 32‰
no training training
Transfer at 450 gTransfer at 70 g (start)
97 98
0
20
40
60
80
100
0 ppt 12 ppt 22 ppt 32 ppt
% S
urv
iva
l
Salinity before transfer to 32‰
Training No training
Survival when transfer from 0 ppt (start) or 12/22/32‰to 32‰ at different sizes
70g 250g 450g 800g
32‰ 32‰ 32‰
100 100 100100 100 99
0
20
40
60
80
100
12 ppt 22 ppt 32 ppt
% S
urv
iva
l
Salinity before transfer to 32‰
At end of trial ~800 g
Change to 32‰ directly inexisting12 tanks
94
0
20
40
60
80
100
All groups pooled
% S
urv
iva
l
All groups pooled, transferredto 12 new tanks, 32‰ FT
Terjesen et al., unpubl.
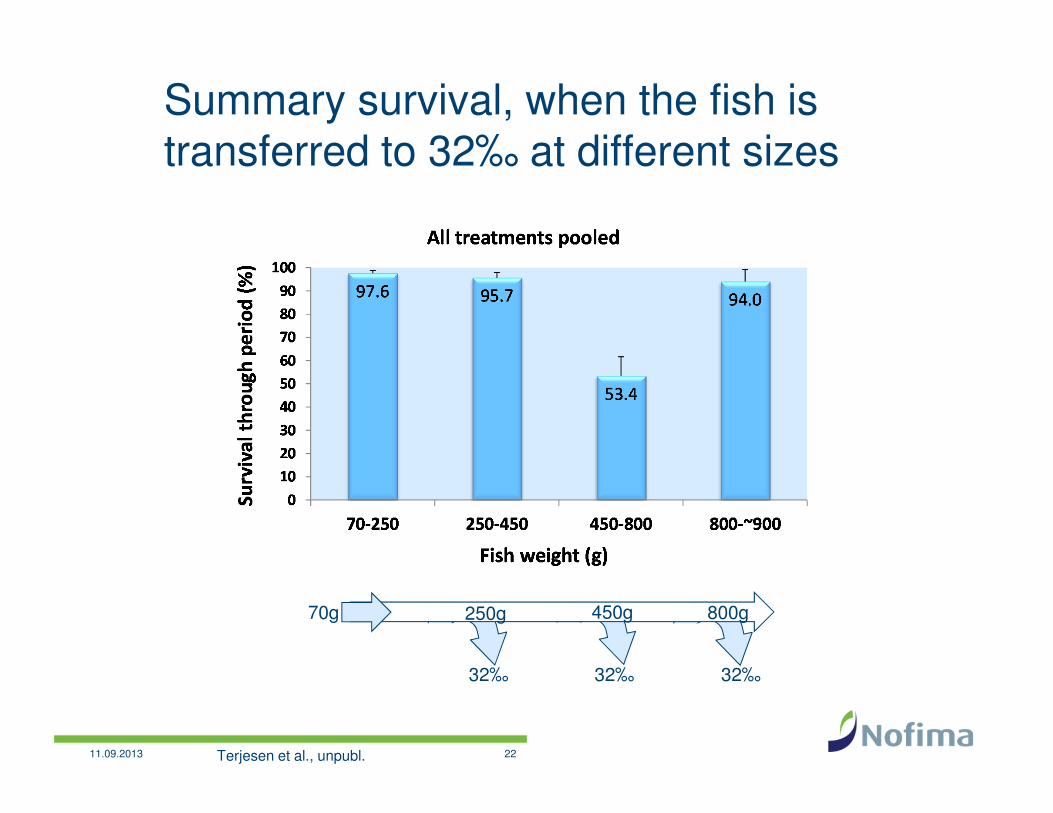
Summary survival, when the fish is transferred to 32‰ at different sizes
11.09.2013 22
250g 450g 800g70g
32‰ 32‰ 32‰
Terjesen et al., unpubl.
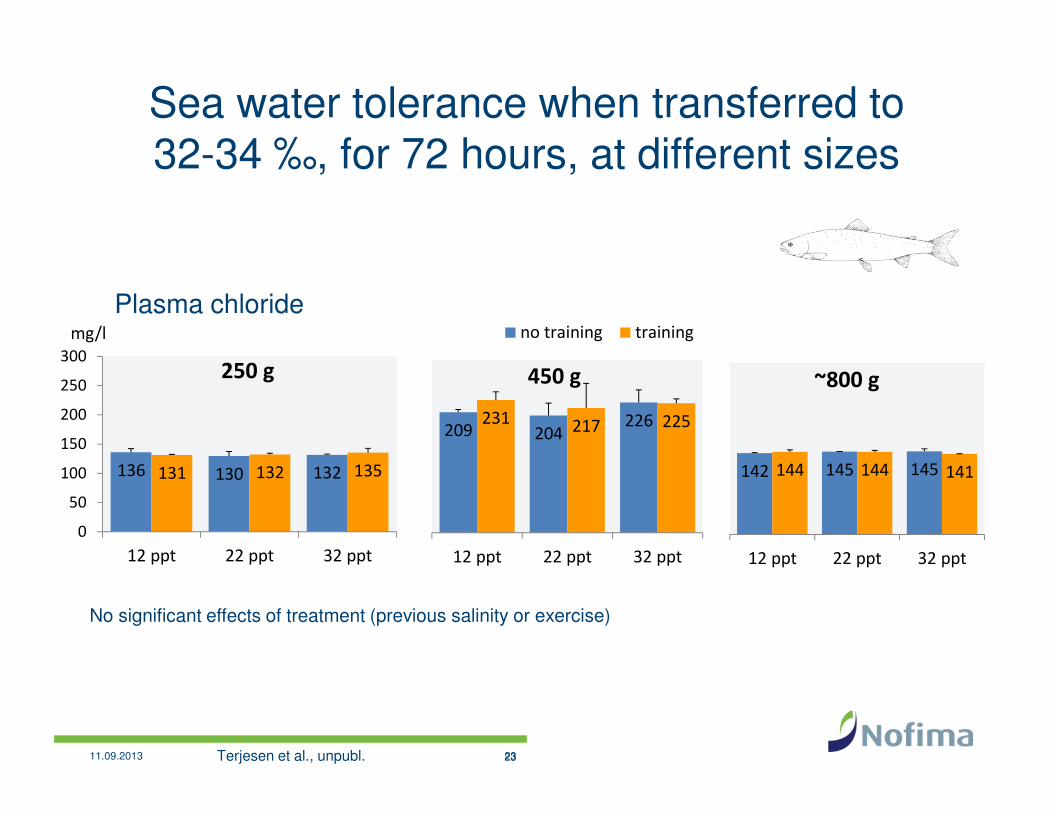
Sea water tolerance when transferred to 32-34 ‰, for 72 hours, at different sizes
2311.09.2013 23
Plasma chloride
No significant effects of treatment (previous salinity or exercise)
136 130 132131 132 135
0
50
100
150
200
250
300
12 ppt 22 ppt 32 ppt
mg/l
250 g
209 204226231 217 225
12 ppt 22 ppt 32 ppt
450 g
no training training
142 145 145144 144 141
12 ppt 22 ppt 32 ppt
~800 g
Terjesen et al., unpubl.
11.09.2013 24
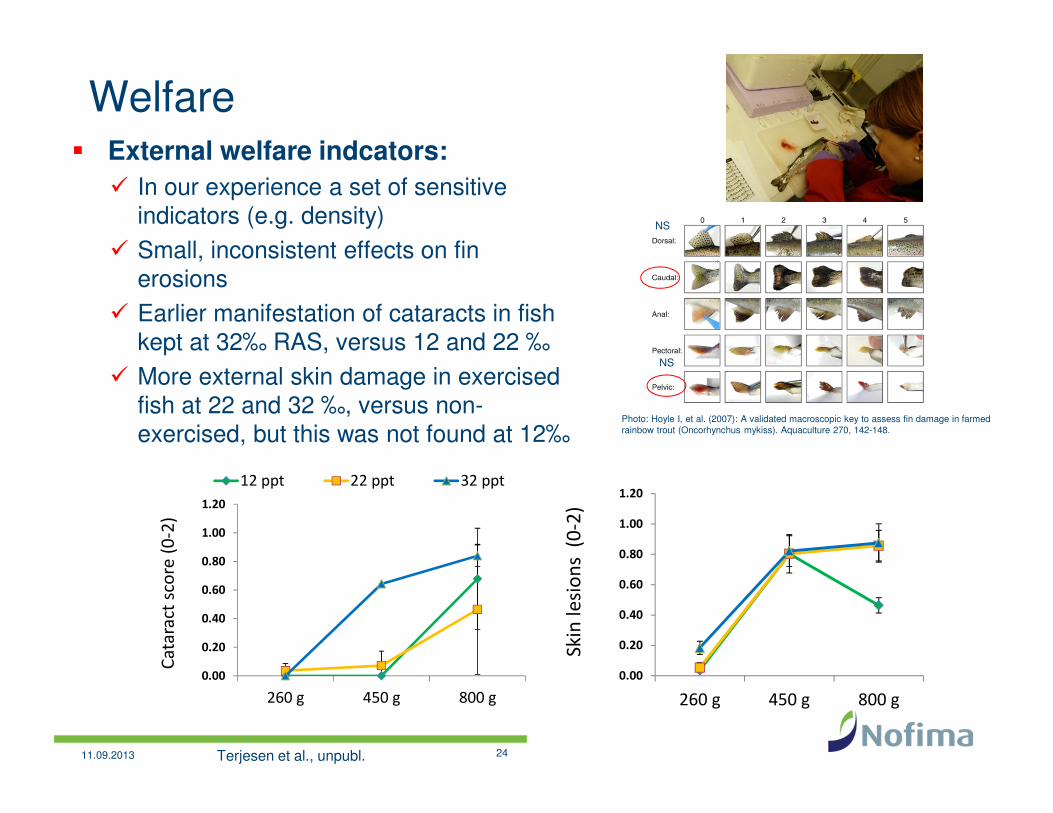
� External welfare indcators:
� In our experience a set of sensitive indicators (e.g. density)
� Small, inconsistent effects on fin erosions
� Earlier manifestation of cataracts in fishkept at 32‰ RAS, versus 12 and 22 ‰
� More external skin damage in exercisedfish at 22 and 32 ‰, versus non-exercised, but this was not found at 12‰
Welfare
Photo: Hoyle I, et al. (2007): A validated macroscopic key to assess fin damage in farmed rainbow trout (Oncorhynchus mykiss). Aquaculture 270, 142-148.
NS
NS
0.00
0.20
0.40
0.60
0.80
1.00
1.20
260 g 450 g 800 g
Skin
le
sio
ns
(0
-2)
0.00
0.20
0.40
0.60
0.80
1.00
1.20
260 g 450 g 800 g
Ca
tara
ct s
core
(0
-2)
12 ppt 22 ppt 32 ppt
Terjesen et al., unpubl.

11.09.2013 25
�Important organ for pathogen and parasitecontrol
�Les mucous and more tissue damage, at increasing salinity, and size
�Exercise had a negative effect on skin health at 22 and 32, but not at 12 ‰
�Up-regulation of the stress related genes HSP70 and iNOS at 32,22 vs 12‰
�We are establishing a skinanalytical pipeline, sinceskin-health may be a particular problem
Skin health
Takle et al., unpubl.
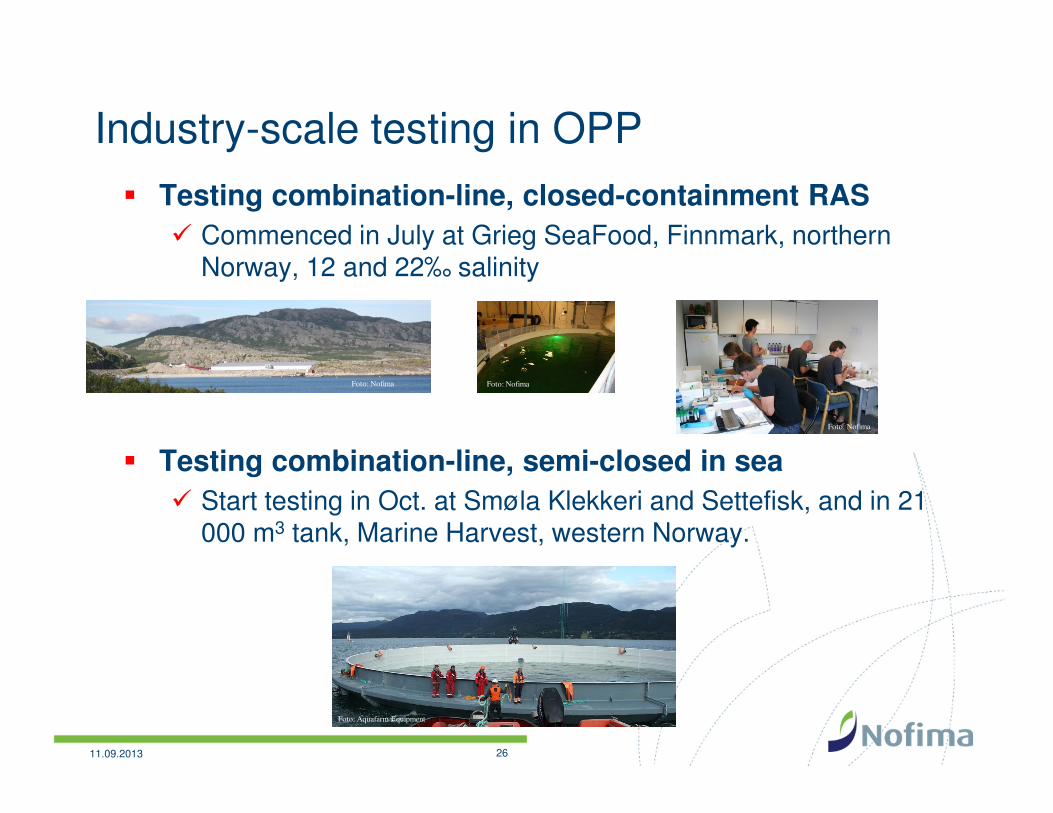
Industry-scale testing in OPP� Testing combination-line, closed-containment RAS
� Commenced in July at Grieg SeaFood, Finnmark, northernNorway, 12 and 22‰ salinity
� Testing combination-line, semi-closed in sea
� Start testing in Oct. at Smøla Klekkeri and Settefisk, and in 21 000 m3 tank, Marine Harvest, western Norway.
11.09.2013
Foto: Aquafarm Equipment
Foto: Nofima Foto: Nofima
Foto: Nofima
26
Conclusions
11.09.2013 27
� Also salmon benefits from less salt and more exercise
� Closed-containment systems make environmental control possible� Lower salinity: increased feed intake, growth rate, improved skin health� Combination with exercise maximized this effect
� No general maturation was observed, via GSI � Lower salinity improved removal efficency of TAN and CO2� Such types of findings may contribute to reduced costs in closed-
containment systems
� Production in closed-containment to 1 kg may contributeto smaller losses in Norwegian production
� Best group, 12‰ + exercise = 99% survival -6% at transfer to 32‰, = 93% survival to ~900 g
� BUT: at 400-700 g the fish was very sensitive to handling � This trial suggest a use for closed-contaiment RAS, also in grow-out
phase in Norwegian aquaculture
Top Related