


Languages
Pages
Legal


EFFECTS OF EMULSIFIERS ON CRYSTAL BEHAVIOR OF PALMOIL BLENDS ON SLOW CRYSTALLIZATION
M.S. MISKANDAR1,2, Y.B. CHE MAN1,4, R. ABDUL RAHMAN1, I. NOR AINI2
and M.S.A. YUSOFF3
1Department of Food TechnologyFaculty of Food Science and Technology
Universiti Putra Malaysia43400 UPM, Serdang, Selangor, D.E., Malaysia
2Malaysian Palm Oil BoardNo. 6 Persiaran Institusi
Bandar Baru BangiKajang, Selangor, D. E., Malaysia
3Golden Hope ResearchBanting Selangor, Malaysia
Submitted for Publication April 13, 2006Revised Received and Accepted July 20, 2006
ABSTRACT
The effects of sorbitan tristearate (STS) and soy lecithin on blends ofpalm oil (PO) and olein by slow crystallization were studied. The blends of POand olein were melted at 80C for 30 min and slowly cooled at a rate of0.7C/min for 32 min and at 20 � 0.1C for 48 min. Nuclear magnetic reso-nance was used to measure the solid fat content (SFC) development. Crystal-lization without emulsifier was influenced by trisaturated and disaturatedtriacylglycerol content of PO manifesting significant (P < 0.05) changes inSFC, crystal dispersion and viscosity, but emulsifiers in the blends disturbedthese behaviors. The reaction of lecithin was very selective and was deter-mined that at 0.03%, it generally served as a crystal promoter, while at0.06–0.09%, it was a crystal inhibitor. Viscosity was closely related to thecrystal dispersion in the liquid. The blends had low viscosity with 0.03%lecithin, while blends with high trisaturate content had high viscosity with0.06% lecithin. STS was generally a crystal inhibitor, although at variouslevels, it was a crystal promoter for the middle-range saturates. Slow crystal-lization process of PO and olein blends with 0.03% lecithin produced homog-enous crystals with low SFC and viscosity for fluidized products.
4 Corresponding author. TEL: 603-89468413; FAX: 603-89423552; EMAIL: [email protected]
Journal of Food Lipids 14 (2007) 1–18. All Rights Reserved.© 2007, The Author(s)Journal compilation © 2007, Blackwell Publishing
1

INTRODUCTION
The physical state at which hard fat crystallizes is important (O’Brien2000). However, it is not an ultimate effect of the current crystallizationconditions alone, but depends on the entire history of the crystallizationprocess (Blaurock 1999; Jahaniaval et al. 2000; Miskandar et al. 2002). Hot oilthat is rapidly cooled to a temperature below a melting point would mostprobably crystallize in a form followed by the formation of b′ and b crystals(Blaurock 1999). However, on slow cooling, b′ crystal would first form fol-lowed by the a crystal surrounding the b′ crystal that acts as nuclei forcrystallization (Blaurock 1999). Besides various temperature conditions,emulsifier with different hydrophobic properties would also affect fat proper-ties by accelerating or retarding crystallization and polymorphic transforma-tion (Garti 2002; Miskandar et al. 2002).
Emulsifiers are important ingredients in bakery shortening, although onlya small amount is used, and typically at <0.5% can contribute to significantproduct qualities (Stauffer 1996). According to Stauffer (1996), Nash andLawrence (1972) and Chrysam (1985), emulsifiers in food products are mul-tifunctional and contribute to the final product properties. For the purpose ofcertain functionalities, fluid shortening can act as the carrier for these emul-sifiers and later becomes an ingredient for the production of food productssuch as bread and cake, dough strengtheners and antistaling agent (O’Brien2000).
Emulsifiers are associated with triacylglycerol (TAG) by their hydropho-bic groups (fatty acid moieties), specifically the acyl–acyl interaction (Kat-suragi 1999). The acyl group of emulsifiers determines its functionality withrespect to the TAG. The major effects of emulsifiers on fat crystal occur in thearea of fat nucleation, transformation of polymorphism and crystal growth.These effects alter the physical properties of fat such as crystal size, solid fatcontent (SFC) and crystal arrangements. The question whether an emulsifierwill promote or retard crystallization in oils and fats is very subjective anddepends on various factors. However, Katsuragi (1999) suggested that similaracyl groups promote crystallization, while different acyl groups retard crystaldevelopment. Seeding effect could be another phenomenon on the effect ofemulsifiers in fluid shortening by promoting crystallization (O’Brien 2000).
Sorbitan tristearate (STS) is a hydrophobic emulsifier with a hydrophobiclipophilic balance (HLB) value of 2.1 (Kamel 1997). The molecular structureof STS is very similar to that of TAG, thus enabling STS to cocrystallize withfats and form solid solutions (Krog and Last 1995). Lecithin, on the otherhand, is a complex phospholipid that has hydrophilic and hydrophobic prop-erties, with an HLB of 3.5 (O’Brien 2000). The main function of phosphatideis to emulsify fats. The long-chain fatty acid moieties that contribute the
2 M.S. MISKANDAR ET AL.

hydrophobic property are counterbalanced by the polar or hydrophilic prop-erties of the phosphate moiety. Emulsifiers can also act as wetting agents influid shortening systems by reducing the interfacial tension between the liquidand solid surfaces that cause the liquid to spread more evenly over surfaces. Asagglomeration of crystal is not desired for a stable fluid shortening, emulsifierscan be used to control the fat particle coagulation (O’Brien 2000).
The aim of this study was to determine the crystallization properties of 11different blends of palm oil (PO) and palm olein using STS and lecithin.
MATERIALS AND METHODS
Materials
Refined, bleached and deodorized (RBD) PO and palm olein wereobtained from the Malaysian Palm Oil Board, Malaysia. STS was fromDanisco Malaysia Sdn. Bhd., Penang, Malaysia, and lecithin was bought fromEuro Chemopharma Sdn. Bhd., Shah Alam, Selangor, Malaysia.
Physical Analyses
RBD PO and palm olein were melted at 80C in a Memmert drying oven(model 854 UL 80; Memmert GmbH, Schwabach, Germany). STS and leci-thin were dissolved in PO before mixing in the blends to assist homogeneity.Eleven blends of PO and palm olein were prepared in three replications inthe ratios of 100:0, 90:10, 80:20, 70:30, 60:40, 50:50, 40:60, 30:70, 20:80,10:90 and 0:100 (w/w), and these were represented by the letters A, B, C, D,E, F, G, H, J, K and L, where A and L were 100% PO and palm olein,respectively. The experimental preparation was for the study of the effects ofSTS and lecithin at 0, 0.03, 0.06 and 0.09% by slow crystallization. Eachsample was filled in nuclear magnetic resonance (NMR) tube of 8-mm diam-eter to a height of 30 mm for SFC measurement and tall-formed beaker(69-mm internal diameter, 130-mm height) to a height of 45 mm for viscos-ity tests. The tubes and beakers were placed in the water bath at 80C for30 min to destroy all the crystal memory (De Man et al. 1989). SFC mea-surement took an average of 2.5 s, while viscosity measurement needed 35 sper sample (included in the time was sample preparation and measurement).The rest of the tubes and beakers were immediately transferred into thecooling bath at crystallization temperature (Tc) of 20C for crystallizationtime (Tm) of 80 min (cycle 1). The average time for the temperature to dropfrom 80 to 20C was 32.08 � 2.0 min (0.70C/min).
The SFC at the end of the study was determined by pulse NMR (modelNMS120, Minispec Bruker, Rheinstetten, Silberstreifen, Germany, with refer-
3EFFECTS OF EMULSIFIERS ON PO

ence samples of triolein and tristearin also in NMR tubes). Previous studieshad shown that the crystallization Tc 20C for Tm 80 min was sufficient for fullcrystallization of PO: olein blends with 50% and more PO.
The viscosity test was carried out by a Brookfield digital viscometer(model DV11, Brookfield Engineering Laboratories, Inc., Stoughton, MA)using a speed of 50 rpm for 25 s. The viscosity of the samples in centipoiseswas taken at the end of each tempering session.
Microscopic examination for crystal distribution was measured byplacing a drop of the tempered samples, from the same sample set previouslymentioned, on a glass slide. A glass cover slip was placed on top of the sample,and the sample was immediately viewed under a polarized microscope(Olympus model BH-2, Olympus Corporation, Tokyo, Japan) attached to avideo color camera. Leica (Leica Q500mc Qwin vol 0.02; Leica CambridgeLtd, Cambridge, U.K.) for windows was used to analyze the images.
TAG composition was determined by high-performance liquid chroma-tography according to the American Oil Chemist Society (AOCS 1989)method. The mobile phase used was acetone/acetonitrile (75:25, v/v). Thesample was diluted in acetone to make up to 10% sample concentration. Avolume of 10 mL was injected into a Waters C18 column (3.9 ¥ 300.0 mm).The oven temperature was set at 35C, and the flow rate of the solvent was1.5 mL/min. All sample determinations were carried out in duplicate.
Statistical Analysis
Analysis of variance at 95% confidence level and multiple comparisonsby Duncan was determined in statistical software package SPSS for Windowsversion 11.5. Arrangement of data for the statistical analysis was done inMicrosoft Excel 2000 (Microsoft Corporation, Redmond, WA).
RESULTS AND DISCUSSION
Crystallization of Fat Blend without Emulsifiers
When blends of PO and olein were slowly cooled from 80 to 20C, theyunderwent an average temperature change of 0.7C/min for the first 33 min and20.0 � 0.1C for the rest of 47 min (cycle 1), and created the condition of slowcrystallization, even to blends with high trisaturate and disaturate TAGs (Mis-kandar et al. 2004). No significant change on the temperature of the blend andwater bath was recorded during the crystallization process. The change in thetemperature was so slow, which caused slow crystallization, and any tempera-ture changes due to crystallization were not significant.
4 M.S. MISKANDAR ET AL.

NMR was used to determine the crystallization properties of blends A–Lin this study owing to its ability for direct SFC measurement. Blaurock (1999),Busfield and Proshogo (1990) and Sugimoto et al. (2001) had shown thatNMR provides an important tool for measuring fat crystallization. Albeitstudies on fat crystallization had used X-ray diffraction and differential scan-ning calorimeter in trilaurin and tripalmitin crystallization, X-ray diffractioncould not be used under the present experimental conditions because of thefluid nature of most of the samples.
Controlling the Tc is an important procedure in crystal development. ThePO and olein blends in this study were tempered at Tc of 80C for Tm 30 min toprovide an environment that was free of crystal memory and with the samestarting history of 0% SFC. According to Blaurock (1999), crystallizationhistory of the fat is considered an important step in fat product preparation, asit contributes to the final crystal type.
As the fat underwent cooling treatment for Tm 80 min, crystallizationstarted to occur when the supercooling temperature was low enough for thehighest melting crystals to create the nuclei for the centers of crystallization(Faur 1996; Ghotra et al. 2002). The greater the number of nuclei formed, themore rapid the whole bulk will crystallize. According to Blaurock (1999), in aninstantaneous cooling of melted oil to a temperature below the melting of atype of crystal, the crystallization will be of that type of crystal. The coolingrate of 0.7C/min was a slow cooling process that initiated the high meltingcrystal types to crystallize first, and because the cooling time was sufficientlylong, big crystal aggregates were formed.
Slow crystallization at 0.7C/min for cooling time Tm 80 min in an earlierstudy had provided sufficient crystallization time for blends with high SSS(Miskandar et al. 2004). The condition was suitable for PO and olein blendswith no emulsifiers. However, the presence of emulsifiers in these blends hadinfluenced their crystallization behaviors, as shown by change of SFC(Table 1). The SFC of blends of PO, from 0 (Blend L) to 100% (Blend A)ranged from 1.52 to 8.92%, in a nonlinear fashion as shown by the equationof SFC = -0.0202X3 + 0.03476X2 - 0.5313X% PO and R2 = 0.9846. As thecontent of PO was reduced to lower than 40%, the changes in SFC were notsignificant (P > 0.05) because the blends with and without emulsifiers at thatlevel were practically in the liquid form. Crystallization behavior and solid fatdevelopment in blends with more than 40% PO, however, were dependent onthe PO content, in agreement with findings of Martini et al. (2002) on crys-tallization with high melting TAGs.
Crystal Distribution without Emulsifiers
The formation of crystals at the end of cycle 1 showed that vigorouscrystal development had occurred in blends without emulsifiers as shown
5EFFECTS OF EMULSIFIERS ON PO
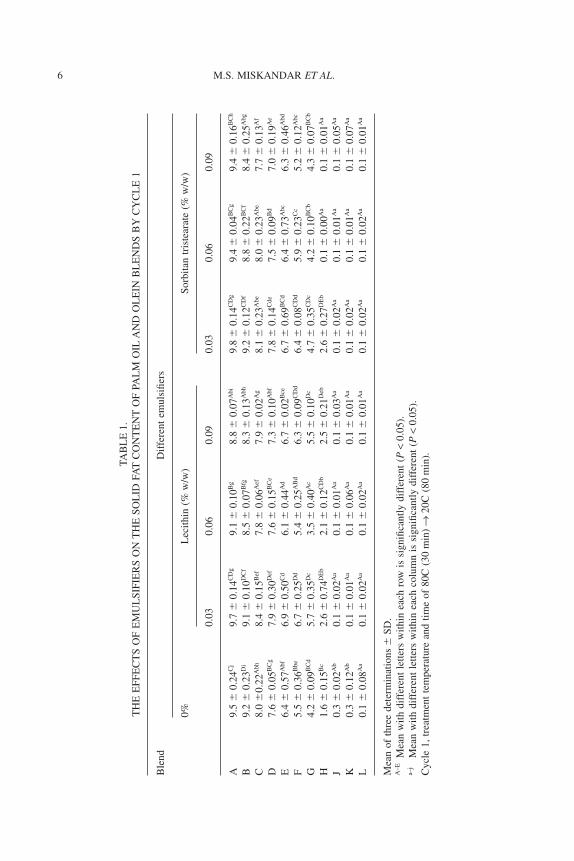
TAB
LE
1.T
HE
EFF
EC
TS
OF
EM
UL
SIFI
ER
SO
NT
HE
SOL
IDFA
TC
ON
TE
NT
OF
PAL
MO
ILA
ND
OL
EIN
BL
EN
DS
BY
CY
CL
E1
Ble
ndD
iffe
rent
emul
sifie
rs
0%L
ecith
in(%
w/w
)So
rbita
ntr
iste
arat
e(%
w/w
)
0.03
0.06
0.09
0.03
0.06
0.09
A9.
5�
0.24
Cj
9.7
�0.
14C
Dg
9.1
�0.
10B
g8.
8�
0.07
Abi
9.8
�0.
14C
Dg
9.4
�0.
04B
Cg
9.4
�0.
16B
Ch
B9.
2�
0.23
Di
9.1
�0.
10D
Cf
8.5
�0.
07B
fg8.
3�
0.13
Abh
9.2
�0.
12C
Df
8.8
�0.
22B
Cf
8.4
�0.
25A
bg
C8.
0�
0.22
Abh
8.4
�0.
15B
ef7.
8�
0.06
Aef
7.9
�0.
02A
g8.
1�
0.23
Abe
8.0
�0.
23A
be7.
7�
0.13
Af
D7.
6�
0.05
BC
g7.
9�
0.30
Def
7.6
�0.
15B
Ce
7.3
�0.
10A
bf7.
8�
0.14
Cde
7.5
�0.
09B
d7.
0�
0.19
Ae
E6.
4�
0.57
Abf
6.9
�0.
50C
d6.
1�
0.44
Ad
6.7
�0.
02B
ce6.
7�
0.69
BC
d6.
4�
0.73
Abc
6.3
�0.
46A
bd
F5.
5�
0.36
Bbe
6.7
�0.
25D
d5.
4�
0.25
AB
d6.
3�
0.09
CD
d6.
4�
0.08
CD
d5.
9�
0.23
Cc
5.2
�0.
12A
bc
G4.
2�
0.09
BC
d5.
7�
0.35
Dc
3.5
�0.
40A
c5.
5�
0.10
Dc
4.7
�0.
35C
Dc
4.2
�0.
10B
Cb
4.3
�0.
07B
Cb
H1.
6�
0.15
Bc
2.6
�0.
74D
Eb
2.1
�0.
12C
Db
2.5
�0.
21D
eb2.
6�
0.27
DE
b0.
1�
0.00
Aa
0.1
�0.
01A
a
J0.
3�
0.02
Ab
0.1
�0.
02A
a0.
1�
0.01
Aa
0.1
�0.
03A
a0.
1�
0.02
Aa
0.1
�0.
01A
a0.
1�
0.05
Aa
K0.
3�
0.12
Ab
0.1
�0.
01A
a0.
1�
0.06
Aa
0.1
�0.
01A
a0.
1�
0.02
Aa
0.1
�0.
01A
a0.
1�
0.07
Aa
L0.
1�
0.08
Aa
0.1
�0.
02A
a0.
1�
0.02
Aa
0.1
�0.
01A
a0.
1�
0.02
Aa
0.1
�0.
02A
a0.
1�
0.01
Aa
Mea
nof
thre
ede
term
inat
ions
�SD
.A
–EM
ean
with
diff
eren
tle
tters
with
inea
chro
wis
sign
ifica
ntly
diff
eren
t(P
<0.
05).
a–j
Mea
nw
ithdi
ffer
ent
lette
rsw
ithin
each
colu
mn
issi
gnifi
cant
lydi
ffer
ent
(P<
0.05
).C
ycle
1,tr
eatm
ent
tem
pera
ture
and
time
of80
C(3
0m
in)
→20
C(8
0m
in).
6 M.S. MISKANDAR ET AL.
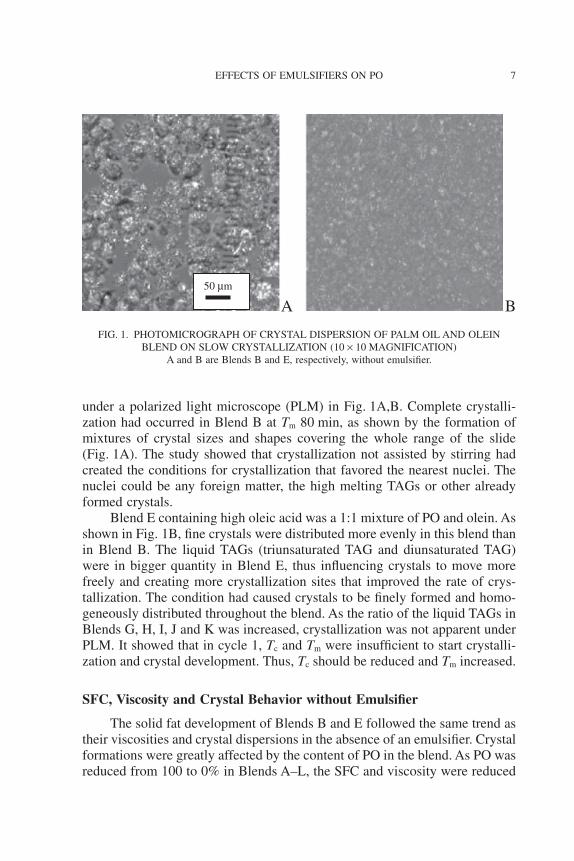
under a polarized light microscope (PLM) in Fig. 1A,B. Complete crystalli-zation had occurred in Blend B at Tm 80 min, as shown by the formation ofmixtures of crystal sizes and shapes covering the whole range of the slide(Fig. 1A). The study showed that crystallization not assisted by stirring hadcreated the conditions for crystallization that favored the nearest nuclei. Thenuclei could be any foreign matter, the high melting TAGs or other alreadyformed crystals.
Blend E containing high oleic acid was a 1:1 mixture of PO and olein. Asshown in Fig. 1B, fine crystals were distributed more evenly in this blend thanin Blend B. The liquid TAGs (triunsaturated TAG and diunsaturated TAG)were in bigger quantity in Blend E, thus influencing crystals to move morefreely and creating more crystallization sites that improved the rate of crys-tallization. The condition had caused crystals to be finely formed and homo-geneously distributed throughout the blend. As the ratio of the liquid TAGs inBlends G, H, I, J and K was increased, crystallization was not apparent underPLM. It showed that in cycle 1, Tc and Tm were insufficient to start crystalli-zation and crystal development. Thus, Tc should be reduced and Tm increased.
SFC, Viscosity and Crystal Behavior without Emulsifier
The solid fat development of Blends B and E followed the same trend astheir viscosities and crystal dispersions in the absence of an emulsifier. Crystalformations were greatly affected by the content of PO in the blend. As PO wasreduced from 100 to 0% in Blends A–L, the SFC and viscosity were reduced
A B50 μm
FIG. 1. PHOTOMICROGRAPH OF CRYSTAL DISPERSION OF PALM OIL AND OLEINBLEND ON SLOW CRYSTALLIZATION (10 ¥ 10 MAGNIFICATION)
A and B are Blends B and E, respectively, without emulsifier.
7EFFECTS OF EMULSIFIERS ON PO

almost linearly as shown in Fig. 2. The high PO content had created viscositywith high centipoise in Table 2 as well as densely packed crystals as shown inFig. 1A. In the same respect, the crystal dispersion became loosely packed asthe proportion of olein was increased in Blend E (Fig. 1B), and this wasfollowed by a significant drop in viscosity from 832 to 485 cps.
Effect of Lecithin on Crystal Behavior
The optimum amount of STS and lecithin effectively retarding or pro-moting crystal growth of Blends A–L was influenced by Tc and Tm. In general,at 0.03% level, lecithin had caused SFC to increase, but at 0.06 and 0.09%,lecithin caused SFC to decrease. As shown in Table 1, lecithin had caused anincrease (P < 0.05) in the SFCs of Blends C–H, but no significant change wasobserved in the SFCs of A, B, J, K and L at 0.03%. Increasing the lecithin levelto 0.06% caused a reduction (P < 0.05) in the SFCs of Blends A, B, G and H,but no significant change in other blends was observed. At 0.09% lecithin,SFCs were reduced in Blends A–H, while other blends remained unchanged.Table 1 shows that there was possible preference in the interaction of lecithinat its phosphate ends with the acyl ends of TAGs (Katsuragi 1999). It wassuggested that at 0.03% lecithin, the phosphate ends had interacted with a low
R2 = 0.9846
R2 = 0.9689
-2
0
2
4
6
8
10
A B C D E F G H I J K
PO Blend with 0% emulsifier
SF
C (
%)
0
200
400
600
800
1000
1200
Vis
cosi
ty (
cps)
SFC
VISC
FIG. 2. SOLID FAT CONTENT (SFC) (%) AND VISCOSITY (VISC, CPS) AS A FUNCTION OFPALM OIL (PO) AND PALM OLEIN BLENDS AT SLOW CRYSTALLIZATION
8 M.S. MISKANDAR ET AL.

number of acyl groups of the TAGs that retarded the crystallization and growthof the infected surface and crystal, but allowed the uninfected surface andcrystals to grow as the blend was cooled. Crystal growth and crystal size wasenhanced, as the infected crystals became the centers of crystallization. Ingeneral, it was noted that the SFC increase was only in blends containing0.64–1.03% trisaturates (middle range of trisaturates), while no significantchange was noted in blends with a high range of trisaturates. At 0.06 and0.09% lecithin, increasing points of interaction had occurred on more acylends, allowing less crystallization to take place. Retardation of crystal growthhad occurred in most blends as shown by the reducing SFCs as lecithin wasincreased from 0.06 to 0.09% in the experiments as shown in Table 1.
The significant change in crystal development, as shown by the SFCs,was well correlated with crystal distribution. It was densely formed in BlendB without emulsifier, but the addition of lecithin had reduced the crystal size(Fig. 3A–C) due to physical and chemical interactions. The presence of0.09% lecithin had induced the formation of the most crystal in comparisonto the rest of the combinations in Blend B. As more liquid was present inBlend E, crystal arrangement became loosely packed in relation to the reduc-ing amount of trisaturates in the blends. Lecithin had greatly reducedthe crystal size of the blends; however, the amount of lecithin added into theblend had increased the crystal growth as shown by the crowdedness of thecrystal under PLM (Fig. 3D–F).
Zaki et al. (1997) determined that tripalmitoyl-glycerol (PPP), sn-1-myristoyl-2,3-dipalmitoyl-glycerol (MPP) and sn-1,2-dipalmitoyl-3-stearoyl-glycerol (PPS) are responsible for influencing crystallization in palm
TABLE 2.THE EFFECTS OF LECITHIN ON THE VISCOSITY (CPS) OF
PALMOIL AND OLEIN BLENDS BY CYCLE 1
Blend % Lecithin
0 0.03 0.06 0.09
B 832 � 55Cc 394 � 64Ab 725 � 56Bc 1343 � 28Db
E 485 � 102Bb 112 � 0Aa 384 � 27Bb 186 � 24Aa
G 138 � 9Ca 101 � 9Aa 117 � 9Ba 112 � 0ABa
Mean of three determinations � SD.A–D Mean with different letters within each row is significantly dif-
ferent (P < 0.05).a–c Mean with different letters within each column is significantly
different (P < 0.05).Cycle 1, treatment temperatures and time of 80C (30 min) → 20C(80 min).
9EFFECTS OF EMULSIFIERS ON PO

A D
B E
C F
FIG. 3. PHOTOMICROGRAPH OF EFFECT OF LECITHIN ON CRYSTAL DISPERSION OFPALM OIL AND OLEIN BLENDS AT SLOW CRYSTALLIZATION (10 ¥ 10 MAGNIFICATION)A, B and C are Blend B with 0.03, 0.06 and 0.09% lecithin, respectively; D, E and F are Blend E
with 0.03, 0.06 and 0.09% lecithin, respectively.
10 M.S. MISKANDAR ET AL.

olein. These high melting TAGs, especially the PPP, crystallize before theother TAGs do, thus forming a new liquid and solid interface on the surface ofthe crystal (De Man et al. 1989; Stauffer 1996; Zaki et al. 1997).
The increment in the SFCs of Blends J–L (0.1% SFC), E and F (6.7–6.9%SFC), and B–D (7.9–9.1%) followed the same trend as the increment of PO inBlends A–L at 0.03% lecithin. Except for Blends J–L, the increase in the SFCswas significant with changes in PO content with 0.06 and 0.09% lecithin. Asshown in Table 1, insignificant SFCs in some of these blends indicates thatlecithin was also more effective in promoting crystal growth in one blend overthe other. Lecithin at 0.03% was more effective in promoting crystal growth inBlends D than C, and F than E, and L than J and K. However, lecithin was moreof a crystal inhibitor at 0.06 and 0.09% in Blends A–H. Insignificant increasein the SFCs of Blends J–L with 0.03–0.09% lecithin indicated that the lowcontent of SSS in the blends did not create sufficient crystals.
Viscosity, SFC Relationship with Lecithin
Viscosity is caused by the gelling effect of oil during the cooling process(Faur 1996). The increase in viscosity during crystallization process may havecaused several implications, such as low heat conductivity and slowness inheat transfer through the mass that led to the crystal growth selective only tothe high melting crystals (Faur 1996). The gelling properties due to themolecular arrangements of the crystals had developed constraints on crystalmobility and led to the minimum interactions between the crystals. Conse-quently, it retarded the crystal growth leading to the low solid. However, slowcrystallization of PO and palm olein was contradictory with that of Faur(1996). The increases of SFC during slow crystallization of Blends G–L with0.06% lecithin (Fig. 4A) and D–L with 0.09% lecithin (Fig. 4B) were notfollowed by an increase of viscosity. On the other hand, the reduction in theviscosity was more of a general effect of lecithin (comparing Fig. 4A,B).The viscosities of Blends D–L with lecithin at 0.03% were below 200 cps, andthe viscosities of Blends G–L with 0.06% lecithin were also below 200 cps(Fig. 4A). However, the increase in trisaturated fatty acids content had causedthe increased in SFCs that was followed by the increase in viscosity of BlendsA–F (Fig. 4A) and A–C (Fig. 4B) for lecithin contents of 0.06 and 0.09%,respectively.
The viscosity of the blends with lecithin was closely related to the crystaldispersion in the liquid as shown in Fig. 3. Variation in the crowdedness of thecrystal distribution in Blend B with 0.03, 0.06 and 0.09% lecithin had viscosi-ties of 394, 725 and 1,343 cps, respectively, as shown in Table 2. The viscosi-ties of Blend E of the same lecithin content were 112, 384, and 186 cps, andBlend G had viscosities of 101, 117 and 112 cps with the same lecithin content,respectively.
11EFFECTS OF EMULSIFIERS ON PO

R2 = 0.9869
R2 = 0.9757
-2
0
2
4
6
8
10
A B C D E F G H I J K
PO Blend with 0.06% Lecithin
SF
C (
%)
0
200
400
600
800
1000
1200
Vis
cosi
ty (
cps)
SFC
VISC
R2 = 0.962
R2 = 0.9543
-2
0
2
4
6
8
10
A B C D E F G H I J K
PO Blend with 0.09% lecithin
SF
C (
%)
0
200
400
600
800
1000
1200
1400
1600
1800
2000V
isco
sity
(cp
s)
SFC
VISC
A
B
FIG. 4. SOLID FAT CONTENT (SFC) (%) AND VISCOSITY (VISC, CPS) AS A FUNCTION OFPALM OIL (PO) AND PALM OLEIN BLENDS WITH 0.06% (A) AND 0.09% (B) LECITHIN AT
SLOW CRYSTALLIZATION
12 M.S. MISKANDAR ET AL.

Effects of STS on Crystal Behavior
STS in PO and olein blends was generally a crystal inhibitor, as shownby its insignificant effect on the SFC except for few blends. Addition of STSat 0.03% level into the fat Blends G–L did not significantly (P > 0.05) changethe SFC of the blends (except for Blends E, F and H) at the end of cycle 1(Table 1). The SFC of Blends E, F and H had increased (P < 0.05) from 6.4to 6.7, from 5.5 to 6.4 and from 1.6 to 2.6%, respectively. The increase inSFC indicated that STS was a crystal promoter in these blends. As 0.06%STS was added into the fat blends, no significant changes occurred on theSFCs except for a few blends. The SFC decreased (P < 0.05) in A, B and H,but an increase in F was noted. At 0.09% STS, the SFC decreased (P < 0.05)in B, D, F and H. Table 1 shows that STS had promoted the crystal growthof a few blends, but inhibited growth of most of the blends. These findingsare in agreement with those of Garti (1988) on the inhibition of the effect ofSTS at 0.3% in sunflower oil margarine, although this study used lowerpercentages of STS.
SFC, Viscosity Relationship with STS
SFC did not show a linear relationship with viscosity in blends with STS(Fig. 5A,B). The results show that STS was only effective in lowering theviscosities of the low-melting blends (Blends F–L). The viscosities weremaintained at below 200 cps in Blends G–L with 0.03% STS, F–L with 0.06%STS (Fig. 5A) and G–L with 0.09% STS (Fig. 5B). It was also noted thatincrease of viscosities was only at region of SFC > 4% in Blends A–F, A–C(Fig. 5A) and A–F (Fig. 5B) with STS content of 0.03, 0.06 and 0.09%,respectively.
Addition of emulsifier altered the chemical composition of PO and palmolein blends, hence their physical properties. The interaction of the fatty acidsof the TAG and the acyl groups of the emulsifier was selective and led todifferent rates of retardation and acceleration of crystal growth (Katsuragi1999). Acceleration of crystal growth occurred when the emulsifiers wereadsorbed by the kinks of TAG molecules. STS seemed to have some of the acylends’ preference toward other similar acyl ends belonging to the TAGsforming the crystal, and were adsorbed to them, resulting in the retardation ingrowth of that crystal type, but at the same time allowing other crystals tocontinue growing and causing SFC to increase (Garti 1988; Katsuragi 1999).
The preference of the acyl ends of STS and TAG was manifested by thehomogeneous crystal distribution of even sizes in Blends B and E at 0.03%STS, respectively (Fig. 6). It is suggested that STS preferred blends withtrisaturated fatty acids, and the interaction of acyl–acyl groups had enhancedthe formation of homogeneous crystal sizes. The low trisaturate content in
13EFFECTS OF EMULSIFIERS ON PO

Blend G may have caused development of hardly visible crystals in Blend Gby normal microscope. The crystal dispersion micrograph showed that crystalmigration had occurred toward a particular nucleus with STS 0.06 and 0.09%forming irregular crystal sizes. Blends with more PO content had more crystal
R2 = 0.9423
R2 = 0.9581
-2
0
2
4
6
8
10
A B C D E F G H I J K
PO Blend with 0.06% STS
SF
C (
%)
0
200
400
600
800
1000
1200
1400
1600
1800
2000
2200
Vis
cosi
ty (
cps)
SFC
VISC
R2 = 0.9838
R2 = 0.9562
-2
0
2
4
6
8
10
A B C D E F G H I J K
PO Blend with 0.09% STS
SF
C (
%)
0
200
400
600
800
1000
1200
1400
1600
Vis
cosi
ty (
cps)
SFC
Visc
A
B
FIG. 5. SOLID FAT CONTENT (SFC) (%) AND VISCOSITY (VISC, CPS) AS A FUNCTION OFPALM OIL (PO) AND PALM OLEIN BLENDS WITH 0.06% (A) AND 0.09% (B) SORBITAN
TRISTEARATE (STS) AT SLOW CRYSTALLIZATION
14 M.S. MISKANDAR ET AL.

formation and in the same manner more dense crystal formation occurred inblends with 0.09% STS.
The viscosity of the blends with STS was closely related to the crystaldispersion in the liquid as shown in Table 3 and Fig. 6, respectively. Variationin the crowdedness of the crystal distribution in Blend B with 0, 0.03, 0.06 and0.09% STS had viscosities of 773, 960, 1,506 and 1,166 cps, respectively, asshown in Table 2. The crystals in Blend B (0% STS) formed into big agglom-erates that separated from the liquid and led to the low viscosity. Blend B(0.03% STS) produced small but evenly dispersed crystals with the lowestviscosity. The blends with 0.09 and 0.06% STS had promoted big and closely
A C
B D
FIG. 6. PHOTOMICROGRAPH OF EFFECT OF SORBITAN TRISTEARATE (STS) ONCRYSTAL DISPERSION OF PALM OIL AND OLEIN BLEND AT SLOW CRYSTALLIZATION
(10 ¥ 10 MAGNIFICATION)A and B are Blend B with 0.03 and 0.09% STS, respectively; C and D are Blend E with 0.03 and
0.09% STS, respectively.
15EFFECTS OF EMULSIFIERS ON PO

packed crystal agglomerates with a strong crystal network, leading to highproduct viscosity. The viscosities of Blend E were 496, 554, 202 and 416 cps,and Blend G had viscosities of 138, 122, 112 and 122 cps with the same STScontent, respectively. The trisaturate content of Blend E was lower than B;thus, crystal network formation was lesser in strength and lower in viscositybecause of the dramatic increase in crystal size, but significantly decreased incrystal number (Martini et al. 2002). The phenomenon suggested that as moreSTS was present in the blend, nuclei formation took place much earlier duringcooling. The undesirable nuclei formation had enhanced crystallization,leading to the formation of large crystal size. The concentration of thesecrystals at limited numbers of centers was undesirable as crystal networkwould not be sufficient to bind the liquid, thus causing oil to separate from thesolid. Table 3 shows that the viscosity in blends with 0.06 and 0.09% STS wasgreatly reduced because of oil separation.
CONCLUSIONS
The Tm and Tc under slow crystallization conditions were sufficient for thePO and olein to crystallize without an emulsifier. However, crystallization wasaffected by the presence of either lecithin or STS. These emulsifiers, at specificamount and temperature, lead to crystal promotion or retardation. Under staticcondition, crystallization was toward the nearest nuclei. Heterogeneous crys-tals were formed in blends with high trisaturates, and homogeneous crystalswere significantly distributed in blends with more liquid phase. The slowcrystallization process of PO and olein blends with 0.03% lecithin producedhomogeneous crystals with low SFC and viscosity for fluidized products.
TABLE 3.THE EFFECTS OF SORBITAN TRISTEARATE (STS) ON THE VISCOSITY (CPS) OF PALM
OILAND OLEIN BLENDS BY CYCLE 1
Blend % STS
0 0.03 0.06 0.09
B 773 � 78Ac 960 � 160Ac 1506 � 170Cb 1166 � 15Bc
E 496 � 235Bb 554 � 64Bb 202 � 46Aa 416 � 27Bb
G 138 � 9Ba 122 � 9Aa 112 � 0Aa 122 � 9Aa
Mean of three determinations � SD.A–C Mean with different letters within each row is significantly different (P < 0.05).a–c Mean with different letters within each column is significantly different (P < 0.05).Cycle 1, treatment temperatures and time of 80C (30 min) → 20C (80 min).
16 M.S. MISKANDAR ET AL.

ACKNOWLEDGMENTS
M.S. Miskandar thanks the Malaysian Palm Oil Board for permission touse the laboratory facilities. Special thanks to the Ministry of Science andTechnology Malaysia for financing the study and to Radzuan, Hanirah, Rosnahand Nor Haya for providing technical assistance.
REFERENCES
AOCS 1989. Official and Tentative Methods of American Oil Chemist Society,4th Ed., AOCS, Champaign, IL.
BLAUROCK, A.E. 1999. Fundamental understanding of the crystallization ofoils and fats. In Physical Properties of Fats, Oils, and Emulsifiers, (N.Widlak, ed.) pp. 1–30, AOCS Press, Champaign, IL.
BUSFIELD, W.K. and PROSHOGO, N.P. 1990. Isothermal analysis of palmstearin by DSC. J. Am. Oil Chem. Soc. 67, 171–180.
CHRYSAM, M.M. 1985. Table spreads and shortening. In Bailey’s IndustrialOil and Fat Products, Vol 3 (T. Applewhite, ed.) pp. 42–83, John Wileyand Sons, Inc., New York, NY.
DE MAN, L., DE MAN, J.M. and BLACKMAN, B. 1989. Polymorphicbehavior of some fully hydrogenated oils and their mixtures with liquidoils. J. Am. Oil Chem. Soc. 66, 1777–1780.
FAUR, L. 1996. Fractionation technology. In Oils and Fats Manual, Vol 2 (A.Karleskind, ed.) pp. 935–951, Lovoisier Publishing, Paris, France.
GARTI, N. 1988. Effects of surfactants on crystallization and polymorphictransformation of fats and fatty acids. In Crystallization and Polymor-phism of Fats and Fatty Acids (N. Garti and K. Sato, eds.) pp. 267–300,Marcel and Dekker, Inc., New York, NY.
GARTI, N. 2002. Food emulsifiers: Structure-reactivity relationships, design,and applications. In Physical Properties of Lipids (A.G. Marangoni andS.S. Narine, eds.) pp. 265–340, Marcel and Dekker, Inc., New York, NY.
GHOTRA, B.S., DYAL, S.D. and NARINE, S.S. 2002. Lipid shortening: Areview. Food Res. Int. 35, 1015–1048.
JAHANIAVAL, F., KAKUDA, Y. and ABRAHAM, V. 2000. Oil-bindingcapacity of plastic fats: Effects of intermediate melting point TAG. J. Am.Oil Chem. Soc. 79, 389–394.
KAMEL, B.S. 1997. Emulsifiers. In Food Additive User’s Handbook(J. Smith, ed.) pp. 170–201, Blackie Academic & Professional, London,U.K.
KATSURAGI, T. 1999. Interactions between surfactants and fats. In PhysicalProperties of Fats, Oils, and Emulsifiers (N. Widlak, ed.) pp. 211–219,AOCS Press, Champaign, IL.
17EFFECTS OF EMULSIFIERS ON PO

KROG, N. and LAST, D. 1995. Palm oil based food emulsifiers. J. Mal. OilSci. Technol. 4, 93–100.
MARTINI, S., HARRERA, M.L. and HARTEL, H.R. 2002. Effect of coolingrate on crystallization behavior of milk fat fraction/sunflower oil blends.J. Am. Oil Chem. Soc. 79, 1055–1062.
MISKANDAR, M.S., CHE MAN, Y.B., YUSOFF, M.S.A. and ABDULRAHMAN, R. 2002. Effect of emulsion temperature on physical prop-erties of palm oil-based margarine. J. Am. Oil Chem. Soc. 79, 1163–1168.
MISKANDAR, M.S., CHE MAN, Y.B., YUSOFF, M.S.A. and ABDULRAHMAN, R. 2004. Palm oil crystallization: Effects of cooling time andoil content. J. Food Lipids 11, 190–207.
NASH, N.H. and LAWRENCE, M.B. 1972. Food emulsifiers-science and art.J. Am. Oil Chem. Soc. 49, 457–461.
O’BRIEN, R.D. 2000. Shortening technology. In Introduction to Fats and OilsTechnology, 2nd Ed. (R.D. O’Brian, W.E. Farr and P.J. Wan, eds.)pp. 422–451, AOCS Press, Champaign, IL.
STAUFFER, C.E. 1996. Properties of emulsifiers. In Fats and Oils (C.E.Stauffer, ed.) pp. 29–33, Eagen Press, St. Paul, MN.
SUGIMOTO, T., MORI, T., MANO, J., MUTOH, T., SHINOKI, Y. andMATSUMARA, Y. 2001. Effect of fat crystallization on the behavior ofproteins and lipids at oil droplet surfaces. J. Am. Oil Chem. Soc. 78,183–188.
ZAKI, M.S., NIK MERIAM, S. and SIVARUBY, K. 1997. Triacylglycerolsresponsible for the onset of nucleation during clouding of palm olein. J.Am. Oil Chem. Soc. 74, 1553–1558.
18 M.S. MISKANDAR ET AL.
Top Related