


![[PPT]Eight Evidence-Based Principles for Effective … · Web viewEIGHT EVIDENCE-BASED PRINCIPLES FOR EFFECTIVE OFFENDER INTERVENTION Acknowledgements This presentation draws on information](https://static.fdocuments.in/doc/165x107/5b24ea067f8b9a645d8b4765/ppteight-evidence-based-principles-for-effective-web-vieweight-evidence-based.jpg)

Languages
Pages
Legal


Distr.
LIMITED
E/ESCWA/SD/2013/Technical Paper.1
17 June 2013
ENGLISH
ORIGINAL: ARABIC
ECONOMIC AND SOCIAL COMMISSION FOR WESTERN ASIA (ESCWA)
EFFECTIVE USE OF STATISTICS IN EVIDENCE-BASED POLICYMAKING
CONCEPTUAL FRAMEWORK
United Nations
New York, 2013
12-0339

iii
Acknowledgements
The Economic and Social Commission for Western Asia (ESCWA) is pleased to set out the
conceptual framework for enhancing the effective use of statistics in evidence-based policymaking. The
framework was prepared under the project for strengthening statistical capacity and cooperation between
institutions in the field of statistics, funded by the United Nations Development Account, to review the
Millennium Development Goals and stimulate regional cooperation and knowledge-sharing.
The framework was diligently prepared through the meticulous methodological work of Mr. Ahmed
Hussein and the valuable input from a team of experts that reviewed the framework and made valuable
suggestions to enrich its content, in particular Mr. Abdulaziz Mohammad Farah Ali, Mr. Ziad Obeidat and
Mr. Noureldin ibn Sina. Moreover, ESCWA staff members, notably Ms. Nada Ja’far, worked tirelessly to
coordinate and monitor the project, and review and finalize the framework.

v
CONTENTS
Page Acknowledgements .............................................................................................................................. iii
Introduction .......................................................................................................................................... 1 Chapter I. CONCEPTUAL FRAMEWORK.......................................................................................... 3 A. Objective ............................................................................................................................. 3
B. Benefits of documentation .................................................................................................. 3
C. Importance of statistical data .............................................................................................. 4 II. BENEFITS OF EVIDENCE-BASED POLICIES ............................................................... 5 A. Defining evidence-based policies ....................................................................................... 5
B. Benefits of evidence use ..................................................................................................... 5
C. Policies and evidence.......................................................................................................... 5 III. PRIORITY ISSUES FOR THE EFFECTIVE USE OF STATISTICS ............................. 7 A. Building institutional statistical capacities ......................................................................... 7
B. Policymaking process ......................................................................................................... 7
C. Policy governance .............................................................................................................. 9
D. Policy coherence and integration ........................................................................................ 11
E. Role of statistics in policy development ............................................................................. 12
IV. CONDUCTING RESEARCH, POLICYMAKING AND DECISION-MAKING ............................................................................................................ 16 A. Research ............................................................................................................................. 16
B. Framework for analysing decision-making processes ........................................................ 16 V. POLICY MONITORING AND EVALUATION ................................................................ 18 A. Monitoring .......................................................................................................................... 18
B. Evaluation ........................................................................................................................... 18
C. Results-based review and evaluation .................................................................................. 18
D. Developing and activating a results-based monitoring and
evaluation mechanism ........................................................................................................ 19
VI. DEVELOPMENT POLICIES AND THE MILLENNIUM
DEVELOPMET GOALS ....................................................................................................... 22 A. Millennium Development Goals ........................................................................................ 22
B. Capacity-building ............................................................................................................... 22
VII. RAISING AWARENESS ON THE IMPORTANCE OF
STATISTICAL DATA ........................................................................................................... 24 A. Awareness-raising .............................................................................................................. 24

vi
CONTENTS (continued)
Page
B. Engines of change ............................................................................................................... 24
C. Developing a strategic plan for awareness-raising and advocacy
in the statistics field ............................................................................................................ 24 VIII. GUIDING PRINCIPLES FOR DETERMINING BEST PRACTICES ............................ 26 A. Criteria for selecting good practices ................................................................................... 26
B. Documenting best practices ................................................................................................ 26
C. Factors for determining best practices ................................................................................ 26 IV. CONCLUSION ....................................................................................................................... 28 References ............................................................................................................................................ 29
LIST OF FIGURES I. Evidence components ............................................................................................................... 6
II. Public policy cycle.................................................................................................................... 8
III. Statistical inputs in a public policy cycle ................................................................................. 8
IV. Decision-making for sustainable development: Institutional setup .......................................... 12
V. Statistical cycle ......................................................................................................................... 15
VI. General conceptual framework considering health research as an integral part
of institutional work.................................................................................................................. 17
VII. Logic model for describing the implementation stages of a national
development policy................................................................................................................... 19
VIII. Developing and activating an evidence-based monitoring and
evaluation mechanism .............................................................................................................. 20
IX. Jordanian Executive Development Programme 2011-2013 ..................................................... 21
LIST OF BOXES 1. Fundamental premises of the National Strategy for Poverty Reduction in Iraq ....................... 11
2. Cooperation between data producers and users in Egypt to prepare human
development reports ................................................................................................................. 15
3. Programme summary on assessing development strategies to achieve
the Millennium Development Goals in Morocco ..................................................................... 23
ANNEXES I. Official list of Millennium Development Goal indicators ........................................................ 31
II. Classification of statistical activities ........................................................................................ 34
III. Fundamental principles of official statistics ............................................................................. 36

Introduction
Policymakers and decision-makers are well aware that the effective use of statistical data is vital to
good decision-making, contributing to comprehensive and sustainable development objectives. The
Millennium Development Goals, comprising eight goals, 21 targets and 60 indicators developed to assist in
Goal achievement by 2015, are an indication of increasing international interest in the use of statistics in
various development areas.
Although many efforts have been made to build statistical capacities in member States of the
Economic and Social Commission for Western Asia (ESCWA), the use of statistics in policymaking requires
further development, with special focus on tackling shortfalls in statistical processes and their role in public
policy formulation and monitoring, and finding quick solutions to related problems. It is therefore beneficial
to review and strengthen solutions developed by various countries to realize achievements in the field of
statistics, as done by several developed countries. National statistical mechanisms in the ESCWA region
(tasked with data collection, analysis, publication and distribution to decision-makers for the preparation of
national development strategies) are an intrinsic part of the institutional framework of ESCWA countries,
responsible for meeting statistical data needs for national development.
The United Nations Statistics Division, in collaboration with the regional commissions, analyses the
Millennium Development Goal Indicators using approaches developed in cooperation with the Inter-Agency
and Expert Group on Millennium Development Goals Indicators, and by preparing an annual assessment of
the global and regional progress made towards achieving the Goals. Information from countries indicates the
levels and direction of such progress and the Millennium Development Goals Progress Chart compares
a country’s progress to that of its region. The United Nations assessment conducted in 2011 showed that
a large number of countries would not achieve the Goals by 2015.
Data indicate disparities between national and international data, which could be attributed to timing,
the approach adopted in preparing data or to the use of estimations in the absence of national data. It is
therefore necessary to strengthen coordination between countries and international agencies and provide
broad metadata on indicators, so as to reduce disparities between data and explain their sources.
The present study is the first of its kind at the regional level. It sets out the conceptual framework for
developing the effective use of statistics in evidence-based policymaking at all levels, and monitoring and
evaluating their implementation, so as to establish guiding principles to assist experts in determining,
preparing and documenting good practices in this field to build an information knowledgebase on successful
practices in the Arab region.
The conceptual framework was developed under the project for strengthening statistical capacity and
cooperation between institutions to monitor the implementation of the Millennium Development Goals
through regional cooperation and knowledge-sharing, funded by the Development Account and implemented
by the ESCWA Statistics Division, in collaboration with the other regional commissions. The project aims
to achieve the following: provide new comparable data on achieving the Goals at the national, regional and
international levels; strengthen statistical capacities and statistical coordination efforts to stimulate the
development of Millennium Indicators; and reduce inconsistencies between national, regional and
international sources regarding the Millennium Indicators.
Examining countries’ achievements in this field has several benefits, including establishing national
statistical mechanisms and clarifying ways to realize and benefit from them. Propagating such experiences
and expertise assists individuals and statistical mechanisms to strengthen statistical capabilities and provide
comprehensive data, so as to include reliable statistics on development planning in national databases.
However, the adoption of successful statistical policies requires the use of statistical evidence at all stages
and the undertaking of research to equip decision-makers with the necessary skills to identify effective and
beneficial evidence when offering guidance to Governments.

2
The framework defines evidence-based policymaking and its main components; identifies the
conditions for its success; and highlights the importance of understanding policymaking and the data needed
by policymakers, to allow statistical mechanisms to determine data collection, analysis and publication
priorities. The framework also sets out the relationship between statistics and policies on the one hand, and
the requirements for statistical capacity-building in accordance with international standards, on the other
hand, so as to ensure that statistical outputs are effectively used in development policymaking. Moreover,
the framework explains the use of statistical indicators at every stage of policy formulation, monitoring and
evaluation, and ways to develop and implement monitoring and evaluation mechanisms aimed at measuring
results and impact. The framework also identifies standards for selecting successful practices and guiding
principles to produce literature containing good practices for the efficient use of statistics in policymaking.
It should be noted that the ESCWA Statistical Committee, at its tenth session held in Cairo, on 30 and
31 January 2013, adopted the framework as a conceptual document and agreed to develop it periodically. It
also requested the secretariat to organize a series of activities aimed at building the statistical capacities of
ESCWA member States in using statistics in policymaking, and monitoring and evaluating their
developmental effects.

3
I. CONCEPTUAL FRAMEWORK
A. OBJECTIVE
The conceptual framework to enhance the effective use of statistics in policymaking aims to highlight
the importance of the following: statistics’ role in policymaking, analysis and performance monitoring and
evaluation; strengthening statistical capacity to develop necessary indicators for monitoring the Millennium
Development Goals and national development goals; developing an accessible and easy-to-use
knowledgebase to document successful national practices in the use of statistics that allows users to explore,
learn and exchange information; and taking good decisions using statistics gathered, analysed and published
in accordance with the United Nations Fundamental Principles of Official Statistics1 and international data
quality standards.
B. BENEFITS OF DOCUMENTATION
The following points outline the benefits of sharing success stories and adopting them as approaches
for national capacity-building:
(a) Enabling statistical mechanisms to gather and file national achievements to enhance their
ownership and encourage their monitoring, overcome comparable challenges with more confidence and build
trust in national statistical capabilities and their advancement. To achieve this and to tackle unfamiliar
statistical challenges, it is necessary to identify and carefully analyse the factors that contributed to realizing
those successes. This does not mean applying the same solution to different statistical problems but rather
learning the approaches used to arrive at those solutions, although statistical mechanisms in the Arab region
generally face similar problems;
(b) Gathering successful experiences and expertise to analyse problems and find solutions leads to
the establishment of a knowledgebase that includes fundamental information on experiences in the effective
use of statistics in policymaking. Libraries contain various documents and reports on the importance of
statistics in analysing policies and monitoring progress in their implementation, but they do not set out the
necessary procedures for the effective use of statistics in formulating and analysing development policies;
(c) Successful experiences are founded on statistics collected, analysed and published in accordance
with the United Nations Fundamental Principles of Official Statistics and international data quality
standards, meaning that they are comprehensive and accessible to users and national statistical systems
responsible for publishing data transparently and adopting international standards, such as the General Data
Dissemination System and the Special Data Dissemination Standard used by the International Monetary
Fund, containing metadata on practices used to produce, publish and improve data. The success of these
experiences also depended on the establishment of interactive databases, geographic information systems and
global geospatial information management.2 Disseminating data through modern means is important as it
directly contributes to the effective use of statistical data in evidence-based policymaking and formulating
successful strategies. Moreover, providing disaggregated data by age, gender and geographical location,
among other socioeconomic categorizations, contributes to the development of effective plans to allocate
resources to target groups.
1 The Fundamental Principles of Official Statistics were issued by the United Nations Statistical Commission in 1994. The
Commission requested member States to disseminate statistical data transparently and increase user access to them for their use in decision-making and research.
2 It is possible to benefit from the successful experiences of developed countries, including those of the Australian Bureau of Statistics that excelled in using modern technology to disseminate data, especially to publish the results of the 2005 census (see www.abs.gov.au).
4
C. IMPORTANCE OF STATISTICAL DATA
Available information indicates that statistical mechanisms are in possession of large amounts of
unpublished national statistical data, which have not yet been gathered from files or are not accessible to
users, because their importance has been underestimated or because of a lack of publishing capacity. This
highlights the importance of building statistical capacities to develop necessary indicators and highlight the
importance of research and analysis, which depend on cooperation between national statistical mechanisms,
universities and research centres. Weak cooperation among these entities means that national statistical
mechanisms do not benefit from user opinions and comments that could assist in improving statistical data
quality, identifying priority issues for researchers and academics and providing a solid foundation for
decision-makers to develop evidence-based solutions and policies that can be monitored and evaluated.
However, statistics alone cannot guarantee the effective implementation or effects of policies, as this requires
the adoption of institutional procedures, such as enhancing accountability, using policy reviewers and
encouraging stakeholder participation, which are not covered by the framework.

5
II. BENEFITS OF EVIDENCE-BASED POLICIES
A. DEFINING EVIDENCE-BASED POLICIES Evidence-based policies assist stakeholders in making effective decisions regarding public policy,
programmes and projects, by offering the best available evidence to policymaking and implementation.3
They shed light on the working mechanism of policies rather than their direct effects on final objectives. The
implementation of these policies entails methodological and scientific work. Effective evidence-based policies require the use of evidence during all stages of policymaking,
statistical data collection and research, so as to equip decision-makers with the necessary skills to identify
effective and beneficial evidence. In the absence of such evidence, policy stakeholders cannot give good
guidance to Governments. For evidence to be effective, it must reflect reality and be accurate, objective,
timely, available, relevant to policies, accessible and easy to use.
B. BENEFITS OF EVIDENCE USE The use of strong evidence plays the following five roles in policymaking:
(a) Shedding light on policy-related issues: which takes place when statistical data and evidence are
used to highlight latent or recent socioeconomic issues. This allows the public sector, civil society
organizations, development agencies and the media to tackle those issues and demand solutions through new
policies and programmes;
(b) Policy formulation and selection: following the identification and analysis of an issue, its nature
and dimensions are determined, and its effects are understood. It is vital to relate this approach to statistical
applications to facilitate the selection of recommendations covered by a policy;
(c) Predicting policy future effects: evidence helps predict the future effects of policies if they
continue to be implemented. This outlook, provided by statistical models, increases the possibility of
achieving policy goals on schedule. This applies to the envisaged effects of achieving the Millennium
Development Goals;
(d) Monitoring policy implementation: statistical data can assist in monitoring the progress of policy
programmes and projects by developing integrated monitoring systems on the basis of various indicators that
measure progress towards desired goals. Reports on those monitoring systems should be periodically
prepared for review by decision-makers and should contain work mechanisms that cover inputs, outputs and
results;
(e) Evaluating policy results: Standard means should be selected from the start of the process to
evaluate expected policy results.
C. POLICIES AND EVIDENCE Effective evidence-based policies require the use of evidence during all stages of policymaking,
including data collection and research investment. Policymakers should be equipped with skills to
differentiate between accurate and inaccurate evidence. The following seven conditions must be met for
evidence-based policies to succeed: adopting the correct analytical approach, given that not identifying the
nature of a problem leads to policy failure; availability of accurate and consistent data; data objectivity,
regardless of founding hypotheses; timely availability of data; availability of qualified human resources;
independent evaluation of technical research; and ability to integrate data in policymaking.
3 Sutcliffe and Court, 2005.

6
Figure I. Evidence components
Source: Banks, 2009.
Availability of sufficient evidence to make a decision
Ability
Availability of analytical
skills
Approach
Analytical approach must take into account
the nature of the problem
Data quality
Good quality data to
support analysis
Timeliness
Data collection and analysis assessment
Provision of trusted evidence
Independence
Guidance incentive
Transparency
Awareness-raising dialogue
Environment conducive to policymaking
Preparedness to assess policy choices, infrastructure and resources
Evidence-based
policies

7
III. PRIORITY ISSUES FOR THE EFFECTIVE USE OF STATISTICS
To identify priority issues regarding the effective use of statistics, it is necessary to determine
institutional capacity-building components; policymaking processes; policy governance; policy consistency
and integration; statistical processes; and policies.
A. BUILDING INSTITUTIONAL STATISTICAL CAPACITIES
The principal objective of highlighting successful practices is to effectively use statistical data in
evidence-based policymaking. It is thus important to know the statistical capacities of national statistical
mechanisms, which are the official source of statistical data, in accordance with domestic law. The main
responsibility of those mechanisms therefore is collecting and publishing statistical data related to economic,
social and environmental aspects; making them available to national and international users; and facilitating
access to them, with the support of metadata. The statistical capacities of national mechanisms and statistical
systems as a whole can be ascertained by assessing the viability of the following nine components: national
strategies to develop statistics and related implementation plans; the administrative and legal environments
of national statistical systems, especially in terms of professional independence and transparency in data
publishing and use; dialogue between data producers and users to meet demand for data under a sustainable
institutional framework; statistical infrastructure related to administrative records, such as population and
employment records, databases, geographic information systems and data collection approaches to gather
data from individuals, businesses, the public sector and non-governmental organizations, among others;
knowledge of the approaches, methods and classifications used in statistical data collection and publishing;
national data quality assurance frameworks and standards for statistical data and metadata exchange at the
national and international levels;4 sufficient human resources to complete statistical tasks; training
programmes to continuously raise staff capacities; and up-to-date and accurate data for use in policymaking.
B. POLICYMAKING PROCESS
Determining the components of policymaking and the needs of policymakers and other statistical data
users is necessary to identify the priorities of statistical data collection, analysis and dissemination, especially
when selecting good practices in terms of statistics use. The most widespread approach to assessing public
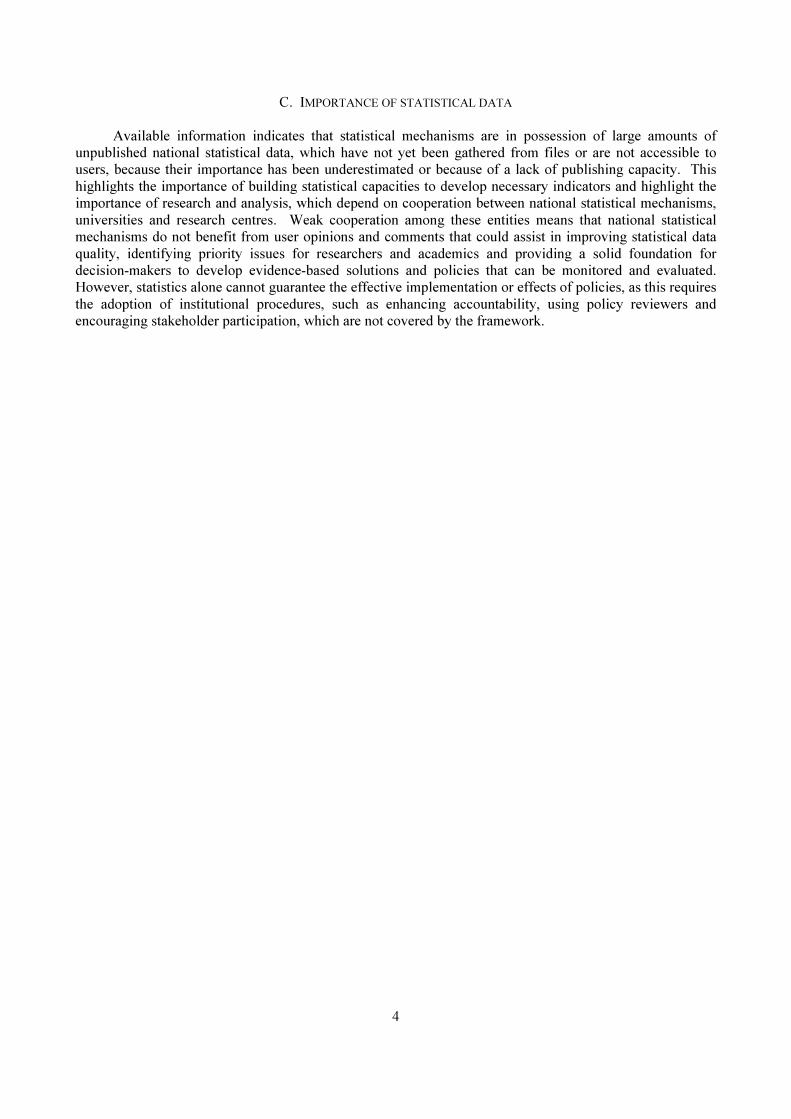
policy divides the process into several functional elements.5 Figure II sets out a conceptual model of the
public policy cycle. Public policy processes should not be one-directional, but should include successes and
setbacks. Figure II depicts the stages or technical elements of policymaking, which can assist in
understanding the process’ actual or desired trajectory. An efficient public policy cycle should facilitate the
following: status quo evaluation; detailed goal determination; clear policy and strategy formulation;
development of effective implementation procedures, strong administration, effective use of resources and
accountability; and implementation of a monitoring and evaluation system that is dependable, effective and
objective.
4 See www.sdmx.org.
5 Sutcliffe and Court, 2005.
8
Figure II. Public policy cycle
Source: Sutcliffe and Court, 2005.
It is possible to simplify the public policy cycle and its distribution by dividing it into the following stages:
(a) Identify the issue: problems and related social, economic and environmental dimensions must be
identified. It is then possible to determine problems and challenges that are in need of solutions and identify
the objectives of data analyses. It is therefore necessary to know the number of underprivileged families
in a certain area; the demographic, social and economic characteristics of those families; the reasons why
some families are underprivileged and others are better off in the light of the analyses, and to conceptualize
the reasons behind those problems;
(b) Policy analyses: the policy analyses stage includes establishing working groups for data
collection and policy discussion. Several points should be taken into account at this stage, including
a preliminary explanation of the issue under discussion followed by a detailed explanation; and developing
a general model followed by a specific model for a policy. Statistical inputs should be determined by
analysing the availability of statistics from all sources and gathering information through consultative
mechanisms. Figure III sets out statistical inputs in a public policy cycle.
Figure III. Statistical inputs in a public policy cycle
1. Identify
the issue
2. Policy
analysis
3. Present
options and
analysis
4. Decision on
policy development and
implementation
5. Monitoring
and evaluation
Public policy cycle
Public policy cycle
Determining the issue
Policy analyses
Solutions
Monitoring progress made and
evaluating results
Statistical
inputs

9
The following approaches can be used to simplify analytical methods:
(a) Statistical graphics: give a direct and simplified picture of an issue by distributing data in groups
and identifying relationships among those groups. Several types of statistical graphics can be used to
represent data, including simplified frequency tables that assist in understanding the nature of issues
presented for analyses;
(b) Statistical measures: can be used for policy analyses, including percentages, averages and
standard deviations;
(c) Spatial distributions and maps: can assist in the effective use of data, providing decision-makers
with simple methods to facilitate policymaking;
(d) Presenting and analysing options: policies are formulated at this stage by developing and
analysing options and reviewing their effects on target groups. Special focus should be placed on practical
evidence to improve initiative efficiency, conduct analysis, acquire practical skills, undertake research and
develop programmes to assess operational projects. Issues under consideration should not be viewed in
isolation from other relevant issues. The following questions should be taken into account when preparing
conclusions and results: What are the key conclusions and results? Can those conclusions and results be
justified statistically? Are those conclusions realistic? What alternative solutions are available? Did the
results differ from preliminary expectations?
(e) Monitoring progress and evaluating policy results: the main aim at this stage is to establish
an effective system to monitor the implementation of projects and the preparation of reports on the progress
achieved by those projects, by developing a group of performance indicators to measure success. The
evaluation should cover the effectiveness of policy implementation and the improvement of future
policymaking fundamentals.
C. POLICY GOVERNANCE
Policy governance is founded on a comprehensive group of integrated principles that, if consistently
applied, could assist in ensuring the accountability of governing councils. Policy governance sets out the
fundamental reasons for the existence of governing councils and determines the nature of their authority.
The International Policy Governance Association identifies the following 10 fundamental principles that
need to be applied to ensure the success of a Government.6
1. Ownership
Government council responsibility and authority are linked to owners who have moral responsibility
for institutions, unless they are legal owners, and who consider that the role of governing councils is to
manage the workload and serve their interests and those of the institutions. In terms of model policy
governance, “owners” do not represent all stakeholders but rather those who are in a similar situation to
shareholders who own ordinary shares. Staff and customers therefore do not count as owners.
2. Governance situation
Governing councils form a special link in the authority chain or in moral responsibility. Their role is
to give orders not guidance. They exercise power and build the capacities of others, they bear full and direct
responsibility for the governance process and its results and are held accountable for any task or
responsibility delegated to others.
6 See www.policygovernanceassociation.org.

10
3. Governing council comprehensiveness
Governing councils take decisions implemented by administrations, the councils themselves, their
members and their committees, given that they are comprehensive and integrated bodies, which means that
their authority is collective rather than a collection of individual authorities.
4. Policy objectives
Governing councils determine in writing the desired results, changes and benefits; target groups and
beneficiaries; priorities; and expenses. Achieving those benefits is the main objective of organizations and
reflects their success.
5. Specific policies for governing council methods
Councils set out in writing their practices, conduct, added value, systems, performance, relationships
with sub-components and executive bodies in organizations in terms of delegation and responsibility. Given
that their decisions are not ends in themselves, they are therefore referred to as “methods” to differentiate
them from staff purposes and methods. Council conduct, decisions and documents must be consistent.
In governance policy terms, documents and texts only containing council decisions are categorized as the
governing process and administration delegation. However, councils can label the process as they please
as long as the meaning is preserved.
6. Specific policies for executive limitations
Councils decide the methods and procedures of their functional bodies through prevention or
prohibition, so as to avoid specifying methods and circumvent more lenient restrictions. In terms of policy
governance, documents that only contain such decisions are categorized as executive limitations. However,
councils can label the process as they please as long as the meaning is preserved.
7. Policy measurements
Council decision-making processes linked to objectives, governance, administrative delegation and
executive limitations begin at the broadest and most comprehensive level. They then move to more specific
levels to narrow interpretation so as to reach a clear and unified level. These documents are thorough and
are used by councils to refer to institutions’ missions, visions, ideology, values, strategies and budgets. They
are labelled as “policies” in the policy governance language but councils can label the process as they please
as long as the meaning is preserved.
8. Delegation of authority
If councils choose to delegate authority to high-level executives, their roles and responsibilities are
clear given that they are the only link between governance and administration. Councils do not delegate the
same authority or responsibility in more than one issue.
9. Good interpretation
Regarding the delegation of decisions not contained in council policies, the person delegated has the
right to adopt any rational interpretation of those policies. Concerning objectives and executive limitations,
a high-level executive, if one exists, would fulfil that role. In terms of policy governance and administrative
delegation, delegates are also primarily responsible for the governance process, unless a council assigns such
responsibility to another of its members or committees.

11
10. Oversight
Councils monitor organizational performance through a methodological and fair evaluation of the
interpretation of policy objectives, within the limits of good interpretation of executive limitation policies. It
is the responsibility of high-level executives, if they exist, to carry out such evaluations.
Box 1. Fundamental premises of the National Strategy for Poverty Reduction in Iraq
1. Government commitment to all aspects of the Strategy. 2. The Strategy forms the general framework for national efforts to achieve the Millennium Development
Goals and to develop short and medium-term policies for national resource allocation and for galvanizing required international support.
3. The Strategy is linked to the Five-Year National Development Plan and annual budgets. 4. It considers poverty to be a multifaceted phenomenon. 5. The Strategy must be formulated in accordance with Iraqi needs, specificities and social and economic
characteristics, so as to realize poverty reduction priorities, goals and solutions. 6. The Strategy is an opportunity to discuss and understand economic development and its link to poverty
reduction. 7. Parliament should participate in all stages of Strategy preparation. 8. Collaboration with civil society institutions and the private sector is vital. 9. It is necessary to start from a perspective that strikes a balance between immediate assistance to eradicate
poverty and reducing the number of poor persons in the long-run. 10. Eliminating the charity mentality and replacing it with the notion of empowering the poor to help
themselves.
D. POLICY COHERENCE AND INTEGRATION
Policies must be consistent with the Millennium Development Goals and must not contradict other
policies. The Organization for Economic Cooperation and Development (OECD) has compiled a check list
of principles that outline policy criteria, on the basis of several countries’ successful experiences with long-
term sustainable development governance,7 notably achieving the maximum degree of internal coherence
through policy integration; stakeholder participation to avoid conflicting views and achieve consensus on
a single trajectory; and improving the management of scientific knowledge to raise awareness of the
importance of sustainable development within and outside Governments. Principles linked to the
improvement of policy coherence and integration for sustainable development can be summarized
as follows: developing a standardized concept of sustainable development; ensuring commitment and
leadership; providing an institutional mechanism for integration; adjusting conditions to manage sustainable
development integration; and ensuring the good management of varied knowledge and scientific input.
Figure IV shows some on the fundamental elements for the evaluation of institutional practices and
sustainable development decision-making.
7 OECD, 2002a.

12
Figure IV. Decision-making for sustainable development: Institutional set-up
Source: OECD, 2002b.
E. ROLE OF STATISTICS IN POLICY DEVELOPMENT
The effective use of statistics depends on several issues related to the statistical process itself, in
particular the availability of necessary statistical data; access to data from statistical mechanisms; and the
accuracy and quality of such data and their suitability for development issues handled by data users and
decision-makers, especially researchers, academics and the media. Statistical mechanisms publish statistical
data in various ways, including multivariate statistical tables. Statistical indicators are issued in functional
sets as indicators of sustainable human development and for achievement of the Millennium Development
Goals. The majority of Arab countries have prepared reports on the progress made in achieving those eight
Goals, using such indicators to measure achievements and assess what remains to be completed to realize the
Goals by 2015 in compliance with the Millennium Declaration.
Arab countries use such indicators in the form of rates, percentages, averages and absolute values to
assess the progress made in reaching the Goals by establishing national databases on the Goals. Several
countries have developed applications for interactive databases using the DevInfo software in the monitoring
process.
The effective use of statistics in policymaking and evaluation requires the use of statistical analysis
methods to ascertain the reasons behind various phenomena, such as rises in illiteracy rates in some parts of
a city but not others or an increase in poverty among workers in certain industries. Employing statistical
analysis methods assists decision-makers in determining the reasons behind such phenomena; finding
appropriate solutions to problems; and resource allocation and distribution. The following are some of the
challenges faced by Arab national statistical mechanisms.
1. Statistical data availability
Statistical mechanisms in the Arab region face several challenges related to data provision, with ever-
increasing user demand. Decision-makers and civil society organizations are increasingly recognizing the
importance of statistics. The great cost of data collection hampers their provision and publication in user-
friendly ways. The data and indicator publication cycle linked to monitoring development phenomena, such
as the Millennium Development Goals, is given special attention by countries. Categorizing data and
Stakeholders
National
Subnational
Central
bodies
Oversight Line agencies
Stakeholders

13
indicators by variables, such as gender and geographical distribution, increases their effectiveness and assists
policymakers in taking decisions related to woman empowerment and rural development programmes.
2. Statistical activity classification
The Classification of International Statistical Activities was prepared in October 2009 to classify
official statistics by domain and is being used to establish an international database; as part of the Statistical
Data and Metadata Exchange; and in the majority of international statistical initiatives. There is a difference
between this Classification and other international standard statistical classifications used in statistical data
collection and publication, such as the International Standard Industrial Classification and the 2011
International Standard Classification of Education (ISCED). The main components of statistical activity
categorization have been divided into the following five domains: demographic and social statistics;
economic statistics; environment and multi-domain statistics; methodology of data collection, processing,
dissemination and analysis; and strategic and managerial issues of official statistics at the national and
international levels.
3. Commitment to the Family of International Statistical Classifications
There are several international statistical classifications used by countries and international
organizations to collect, publish and evaluate data. In general, countries adapt those classifications to meet
national specificities, while maintaining the possibility of international comparisons. The Expert Group on
International Statistical Classifications, which undertakes research on such classifications and monitors their
progress, held a meeting from 18 to 20 May 2011 to discuss classification issues, including the Group’s
mandate and working mechanism, and review progress made in several classifications. It agreed on the
phrase “Family of International Statistical Classifications” to define statistical classifications. The quality of
gathered, published and used data is influenced by the commitment to using revised statistical classifications
to arrive at conclusions that reflect reality. It is necessary to follow developments related to the continuous
revision of such classifications. Over the period of two years, the UNESCO Institute for Statistics, in
collaboration with its partners, completed the revision of ISCED. ESCWA countries must establish
a working group to monitor statistical classifications, offer suggestions thereon and encourage best practices
in national classification development on the basis of international classifications. Moreover, the United
Nations Statistics Division developed a website setting out the majority of classifications and statistical
concepts.8
4. Statistical data sources
There are various statistical data sources, including population and economic censuses, household and
establishment surveys and all types of administrative records:
(a) Population and economic censuses: are considered a fundamental source of statistical data on
inhabitant numbers, growth, characteristics and geographical distribution; they are part of an integrated
national statistical system. The United Nations Statistics Division called upon countries to conduct at least
one census every 10 years. Censuses provide a great amount of data that can be used in policy analysis and
formulation and in Millennium Indicators. They also act as a departure point for population projections that
can be used when examining development requirements in the medium and long-term, by identifying service
needs in health, education, housing, transport and communication;
(b) Household surveys: are conducted by statistical mechanisms, including health, social,
demographic and workforce surveys, in addition to income and expenditure surveys that produce important
data used in estimating poverty levels, in accordance with the first Millennium Development Goal on
8 http://unstats.un.org/unsd/class/family/default.asp.

14
eradicating extreme poverty and hunger. Unemployment rates indicated through workforce surveys are used
in labour market policymaking and decent work indicators, as requested by the International Labour
Organization;
(c) Establishment surveys: are a vital tool for gathering data on prices, market indexes and gross
domestic product (GDP) rates for use as evidence in economic policy analysis;
(d) Administrative records: the process of extracting statistical data from administrative records
remains weak in most Arab countries because they have not yet been fully computerized. Strengthening
administrative infrastructure therefore improves the quality and periodicity of statistical data;
(e) Publishing statistical data: the statistical process is not complete before data are published and
made available for use in applications and research. Rapid developments in information and communication
technology, especially databases, have allowed statistical mechanisms to store and access data easily and
have provided the necessary tools for the establishment of interactive databases; although such applications
are still nascent in the Arab region. Undoubtedly, progress in data publication will enhance their use in
policymaking;
(f) Data coherence: statistical data are gathered from various sources. For example, graduation data
can been gathered from administrative records and household surveys, although such sources are generally
at odds. It is therefore necessary to unify concepts and definitions related to phenomena by developing data
collection approaches that provide coherent data to facilitate policymaking;
(g) Data analysis: national statistical mechanisms should especially focus on data analysis to arrive
at conclusions and results. Nevertheless, this process remains weak within national statistical mechanisms,
as are relations between those mechanisms and research centres and universities. Statistical mechanisms
should therefore provide data to researchers and academics and facilitate data analysis so as to produce
results that assist the policymaking process;
(h) Data quality: refers to whether data are valid for use in policymaking and analysis and in
decision-making. To assess data accuracy, there compliance with the following eight institutional and
regulatory quality requirements must be evaluated: relevance to an the issue under consideration; accuracy in
describing the phenomenon; timeliness; ease of access; openness to interpretation; coherence; validity of the
data collection approach; and data integrity;
(i) Cooperation between data producers and users: several experiences have shown that cooperation
between statistical data producers and users benefits statistical systems and allows national statistical
mechanisms to identify priorities in data collection, publication and analyses. This cooperation improves the
quality of statistical data and reduces inconsistencies. Continuous consultations with users therefore
strengthen data collection methods and processes. Several ESCWA member States have taken practical
steps to institutionalize the consultation process by establishing high-level advisory councils representing
government ministries and departments and private sector institutions, among others, which has brought
together stakeholders, helped determine their data needs and provided support to national statistical
mechanisms;
(j) Adopting the Fundamental Principles of Official Statistics: the success of data experiences
depends on the adoption of the Fundamental Principles of Official Statistics issued by the United Nations
Statistical Division in 1994, especially considering that those Principles cover the ethical guidelines for
statistical practice. Data should therefore reflect those official ethical guidelines, in particular the data
privacy of individuals and businesses. The Fundamental Principles of Official Statistics are set out in annex
III to the present report.

15
Figure V represents the cycle for statistical data management and production required for decision-
making and economic, social and environmental policymaking and analysis. Data collection is based on the
demand of potential users in the public and private sectors. The first stage begins when the potential
beneficiary submits a request for data. A related survey is then designed and data is collected from
households in accordance with agreed standards and concepts. Data are then processed and results are
reached within a determined timeframe. Subsequently, data are analysed and the conclusions required by
decision-makers are reached. At the end of the cycle, data are used in decision-making, policymaking,
as well as in the evaluation and the monitoring of their implementation and results. The monitoring and
evaluation process begins when a statistical project is launched.
Figure V. Statistical cycle
Source: Gardner, 2010.
Box 2. Cooperation between data producers and users in Egypt
to prepare human development reports
The team tasked with preparing human development reports at the Egyptian Institute of Planning was able to establish human development indicators, in collaboration with data producers represented by the Central Agency for Public Motivation and Statistics, and data users represented by the Institute of Planning. Human development indicators were used as tools for monitoring annual human development levels in Egyptian governorates to arrange them by development level and to link those levels to poverty indicators. This was achieved by identifying the following main characteristics of poverty: 1. Poverty is concentrated in governorates with the lowest human development levels.
2. Poverty is concentrated in tribal governorates.
3. Rural areas record higher poverty rates than urban areas.
4. The poor live in large families where the number of dependents affects their consumer needs and their ability to meet those needs.
5. Fertility levels are high among the poor leading to high numbers of dependents.
6. Child labour rates are high among the poor, leading to low school attendance rates either because they refrain from enrolling or because they drop out.
7. Families headed by women are poorer that those headed by men.
8. The head of the household’s education level affects a family’s poverty level.
9. The poor contribute less to the economy than their wealthier peers.
1. Request
for data
2. Survey
design
4. Data
processing
3. Data
collection
6. Publishing
statistical results
5. Data
analysis
7. Using statistical
results
Data management and collection
for good decision-making

16
IV. CONDUCTING RESEARCH, POLICYMAKING
AND DECISION-MAKING
A. RESEARCH
More focus is being placed on research for good evidence-based decision-making. Research bodies
have begun to respond to the needs of individuals, institutions and policymakers by conducting relevant
research. With regard to social research, an approach labelled “research to action” has been adopted. The
importance of this approach lies in that the application of research conclusions realizes the desired objectives
of conducting and funding such research. That is the case in the participatory approach that allows persons
to identify social problems and present solutions to them.9 Several Governments
10 allocate resources for
conducting varied research aimed at developing a knowledgebase containing field expertise so as to
guarantee good decision-making and evidence-based policymaking.
Research can be described as “the process of regularly collecting and publishing information”. Policy
research offers societies and decision-makers realistic recommendations and procedures to tackle particular
challenges. There are several types of research, including the following:
(a) Available research: whose conclusions and results are periodically reviewed and discussed by
experts and stakeholders;
(b) Secondary analysis: entails examining databases and using statistical methods to describe them
and present them in the form of statistical graphics;
(c) Field tests: assess the effectiveness of strategies in tackling problems by collecting data related to
the achieved change and analysing them to determine the effect of supposed evidence-based strategies;
(d) Descriptive methods: entail collecting and analysing non-digital information to identify problems
and find solutions to them;
(e) Surveys: are used to collect data on the reasons behind problems through personal interviews or
various types of paper or digital questionnaires. Opinion polls are a kind of survey whose results are used
for evidence-based decision-making;
(f) Case studies: entail recording and analysing the practical expertise of institutions or society
regarding a certain issue. They also assist in determining performance and other variables concerning
a certain problem or social issue, and generally clarify the complexities of an issue;
(g) Analysing expenses, gains and benefits: consists of a number of methods used by researchers to
compare social issues and the expenses and gains of certain options.
B. FRAMEWORK FOR ANALYSING DECISION-MAKING PROCESSES
Developing a preliminary framework to analyse decision-making assists in identifying shortfalls in
decision-makers’ abilities to understand interrelationships in the various policymaking fields, and facilitates
the preparation of research agendas aimed at determining the best options, leading to the identification of
significant outputs and factor models that could assist in developing statistical indicators on health and the
environment.11 Figure VI shows the institutional measures for conducting health research at the national
level, in accordance with a general conceptual framework. The aim is to determine the situation of research
institutions and their relationships with decision-makers in the health sector.
9 Dukeshire and Thurlow, 2002.
10 Qatar allocates financial resources (around 2.8 per cent of its annual GDP) to support scientific research in several fields, with the aim of establishing a solid knowledge and expertise base for sound evidence-based decision-making. Moreover, Qatar has prepared a national research strategy, which is an important addition to its National Development Strategy 2011-2016.
11 Pattanayak and others, 2006.

17
Figure VI. General conceptual framework considering health research
as an integral part of institutional work
Source: Alliance for Health Policy and Systems Research, April 2012.
Org
anizatio
ns
Independent institutions
Univ
ersi
ties
Multilateral
Associations Bilateral
Consu
ltants
Res
earc
her
s
Government-supported
institutions
Universities Technical bodies
Reg
ulato
rs
Leg
isla
tors
Government institutions
Research institutions
Committees
Institutions
Correlation
Repute
Quality of
relationship
Linkage capacity
Other supporting factors L
egislatio
n
Environment
Decision-
makers
Decision-
makers
18
V. POLICY MONITORING AND EVALUATION
A. MONITORING Policy evaluation is an ongoing process through which stakeholders receive regular comments and
opinions on progress made.12 The monitoring process is not only limited to reviewing progress made, but
also entails achieving the desired results, thus assisting in selecting the correct path for realizing those
objectives. OECD sees monitoring as a regular process for collecting data on a specific indicator so as to
provide stakeholders with the necessary information for preparing interventions, noting the use of allocated
resources and the progress made in achieving goals. In other words, monitoring determines the extent to
which the work undertaken is helping achieve goals. All stages of the monitoring process should include the
following: periodically reviewing the extent to which desired results are being reached; tackling obstacles to
achieving those results; assessing whether expected outputs are being achieved within the agreed timeframe
and whether they contribute to achieving desired results; reviewing partnership strategies (this may require
the development of new partnerships to achieve results faster); and benefitting from lessons learned and
developing a knowledgebase for broader partnerships (this requires the use of acquired knowledge and its
detailed assessment to guarantee desired results).
B. EVALUATION The United Nations Development Programme (UNDP) states that evaluation is a thorough, rigorous
and independent process applied to completed and ongoing activities to determine the extent to which they
have reached objectives and assisted in decision-making. As is the case with monitoring, many issues
undergo evaluation, including activities, projects, programmes, strategies, sectors and organizations. The
main difference between monitoring and evaluation is that the latter is carried out independently to prepare
objective reports indicating whether managers and staff are on the right track. Evaluation processes also
have more thorough procedures, designs and approaches, and include more detailed assessments. However,
the objectives of monitoring and evaluation are very similar; they both aim to provide information to
improve decision-making and performance and to achieve desired results. Each monitoring and evaluation unit at every level must have its own clear reference framework that
specifies its role and responsibilities, including the following: developing methodological monitoring
frameworks and preparing evaluation plans; holding regular meetings with stakeholders to evaluate progress;
assuming joint field monitoring and evaluations to estimate successes and shortfalls; extracting good lessons
and practices; determining the success levels of results achieved in terms of gender issues and the interests
and rights of marginalized and weak groups; and identifying additional capacities that stakeholders and
partners need to build. Moreover, it is necessary to report regularly to advisors and consultative entities on specified results
and take opportunities to influence policymaking and decision-making; guarantee quality monitoring and
evaluation and offer relevant guidelines when necessary; and regularly assess the suitability of monitoring
and evaluation frameworks leading to new development priorities or a change in circumstances.
C. RESULTS-BASED MONITORING AND EVALUATION Results-based monitoring and evaluation aims to continuously improve results by following the
performance of government institutions in implementing development goals, collecting and analysing
information for indicator development, and comparing the results of those steps with expected results.
Simply put, monitoring processes entail overseeing changes in indicator values until goals are achieved.
Evaluation, however, has a broader dimension, given that it does not only take into account progress towards
achieving desired goals, but also the practical steps to that end.
12 UNDP, 2009.

19
Results can be evaluated and presented using a logic framework that shows the types of information
and data used at each stage. The logic model in figure VII shows the sequential results related to each stage
of a particular policy or project. This example covers health policies aimed at orally tackling dehydration in
children, leading to positive results, including a reduction in the mortality rate of children under 5. This
framework is derived from a training manual prepared by the United Nations Children’s Fund (UNICEF)
indicating the sequential monitoring and evaluation steps to arrive at the desired results.13 This model can be
used for several programmes, especially if the expected result is manifold as is the case with the Millennium
Development Goals.
Figure VII. Logic model for describing the implementation stages
of a national development goal
Source: Farrel, 2009.
D. DEVELOPING AND ACTIVATING A RESULTS-BASED MONITORING
AND EVALUATION MECHANISM
International initiatives guide Arab countries in implementing their development goals with the
support of evidence-based mechanisms. The main initiatives are the Millennium Development Goals aimed
at reducing poverty, improving living standards and realizing other development goals by 2015. It is
possible to gauge the extent to which those Goals have been achieved using measurement indicators. Figure
VIII shows the necessary steps to develop an evidence-based monitoring and evaluation mechanism.
13 Farrell, 2009.
Impact
Outcome
Outputs
Activities
Inputs
Reduced mortality rates for children under 5
Improved use of oral rehydration therapy (ORT) for managing childhood diarrhea
• Increased maternal knowledge of ORT services
• Increased access to ORT services
• Conducting 15 media campaigns
• Training 100 health professionals
• 15 media campaigns completed
• 100 health professionals trained in ORT
Trainers – ORT supplies - Funds
Resu
lts
Imp
lem
en
tati
on

20
Figure VIII. Developing and activating an evidence-based
monitoring and evaluation mechanism
Assessing willingness and readiness.
Agreeing results for monitoring and evaluation.
Selecting principal indicators for monitoring and evaluation.
Developing indicators that reflect the status quo.
Planning for results improvement.
Monitoring results.
Planning roles.
Reporting on results.
Using results.
Preserving stakeholder monitoring and evaluation systems.
Source: Kusek, 2004.
In terms of the Millennium Development Goals, evidence-based monitoring and evaluation systems
and mechanisms can be developed for several sectors and policies. Figure VIII indicates the logical steps
that a monitoring system takes before arriving at results, preparing reports thereon and using them in
decision-making.14 This does not mean that a specific trajectory needs to be followed or that several
activities cannot be implemented at once.
(a) Assessing willingness and readiness: aims to determine the ability of Governments and
development partners to establish evidence-based monitoring and evaluation mechanisms and their
willingness to do so;
(b) Agreeing results for monitoring and evaluation: entails agreeing on the achievement of specific
strategic results and allocating resources and undertaking government development activities on that basis;
14 Kusek, 2004.
1
2
3
4
5
6
7
8
9
10

21
(c) Selecting principal indicators for monitoring and evaluation: this is a key step for evaluating
achieved results and developing monitoring and development mechanisms that guide all data collection,
analysis and reporting processes;
(d) Collecting primary data on indicators: entails measuring indicators first. Results are then
measured by describing and measuring the initial result conditions;
(e) Planning for improvement and to identify realistic goals: the development of temporary goals to
measure the necessary progress to achieve a specific result within a specified timeframe;
(f) Results follow-up: at this stage, guidelines are developed for data collection, analysis and
reporting; to identify those responsible for activities; establish quality control methods; specify a timeframe;
and determine costs;
(g) Evaluating information to support decision-making: focusing on the role of evaluation studies and
analysis in assessing results to ensure their full realization;
(h) Evaluating results and preparing reports thereon: by identifying results that will be reported and
by determining the form of those reports and their deadlines;
(i) Using results: the aim is not to produce evidence-based information only, but for that information
to reach relevant users in a timely manner so that they can be taken into consideration by Governments or
organizations;
(j) Guaranteeing the continuity of monitoring and evaluation systems within Governments: this
requires the development of sustainable mechanisms that meets several key standards, including demand,
structuring, merit, confidence, information accuracy, accountability, incentives and capacity.
Figure IX. Jordanian Executive Development Programme 2011-2013
Structure of the Executive Development Programme
2011-2013
Theme goals in accordance with
the national agenda
Analysing the sector and
identifying problems and
obstacles (challenges)
Long-term sectoral goals
Short-term goals
Executive Development
Programme 2011-2013
Performance and
impact measurement
indicators
Programme, project and
activity procedures
Goal achievement
methods (policies)
Monitoring and follow-up
• Follow-up of the programme is done regularly as is data updating and analysis, and comparing
actual indicator values to statistical data
• Reviewing policies on the basis of the status quo and suggesting alternatives to rectify the situation
• Providing updated statistical data • Analysing data and identifying points of strength and weakness
• Identify challenges • Target indicator values for the coming years are determined using
statistical data
• Formulating policies using target indicator values

22
VI. DEVELOPMENT POLICIES AND THE MILLENNIUM
DEVELLOPMENT GOALS
A. MILLENNIUM DEVELOPMENT GOALS The Millennium Development Goals are internationally agreed development goals, which represent
the outcomes of various summits organized by the United Nations over the last decade, including summits on
sustainable development, human settlements, women, populations and social development. These Goals are
global, quantitative and have a specific timeframe for their achievement. They were developed to eradicate
extreme poverty, hunger and disease, and to increase gender equality, particularly in education. They
enshrine several inalienable human rights, including the right to health, education and housing. The eighth
Goal on developing a global partnership for development reaffirms a commitment to all forms of
development assistance, debt reduction, strengthening trade and providing new technologies.15
Over the last decade, the Millennium Declaration and Goals led to several commitments and the
establishment of unprecedented partnerships, which were reaffirmed in several summits and meetings,
including the International Conference on Financing for Development (Monterrey, Mexico, 2002), the World
Summit on Sustainable Development (Johannesburg, 2002) and the World Summit (New York, 2005).
Populations and Governments face new unexpected challenges, some linked to specific countries or regions,
whereas others are global such as the food and the financial crises witnessed over the past few years. Today,
the challenge lies in agreeing on a workplan to achieve the Goals. Although only three years remain before
reaching the deadline for their achievement in 2015, they might not be realized because of lack of
commitment. The Goals offer a historical framework to ensure accountability in development, tackle the
potentially devastating effects of climate change and eradicate extreme poverty. United Nations country development teams have prepared a framework to accelerate the
implementation of the Goals at the national level, which provides Governments and their partners with
an approach to identify and overcome the main obstacles to realizing the Goals and make progress with their
targets. The framework begins by determining the targets that remain elusive. Governments and their
partners should then tackle them through the following four steps:16 identifying priority interventions by
country; determining and sorting the main obstacles and the key interventions that must be implemented to
overcome those obstacles; specifying solutions to be implemented by several partners; and planning to
implement those solutions and monitor their implementation. This approach is flexible, allowing its application at the national and regional levels. It also assists in
developing public and sectoral strategies and supports the implementation of existing strategies. The
framework also allows for the development of a plan to hasten the implementation of national and sectoral
goals. UNDP and country development teams tested a framework to accelerate the implementation of the
Goals in 10 countries, including Jordan in the ESCWA region. The framework was adopted in December
2010.17
B. CAPACITY-BUILDING
The United Nations Statistics Division, in collaboration with ESCWA and the African Development
Fund, organized a regional workshop in Amman, from 10 to 13 July 2011, on using the Statistical Data and
Metadata Exchange (SDMX) initiative to exchange statistical data and metadata collected from monitoring
the Goals. The workshop included practical training on using the initiative and on converting Goal databases
to a format that can be stored on DevInfo. The workshop recommended the development of strategies to
improve coordination within national statistical mechanisms and between them and government
15 General Assembly, 2010.
16 UNDP, 2011.
17 See www.undg.org/index.cfm?p=1505.

23
mechanisms. Participants were shown the benefits of using the initiative to report metadata and
metainformation at the national and international levels, so as to reduce data disparities and costs; limit the
burden of preparing reports; and improve coordination within national statistical mechanisms.
At the workshop, countries expressed their desire to adopt a data and metadata exchange standard for
the Goals. They requested ESCWA to organize additional training sessions for national statistical
mechanisms and ministries to strengthen their relevant skills. They also requested the Statistics Division to
organize an international workshop to build the capacities of the most developed countries to exchange data
and metadata on the Goals. They expressed their support for an interface to store information on the Goals
using DevInfo. To benefit from lessons learned at the workshop, the Statistics Division will adapt its
training material to meet the needs of developing countries in other regions and include that material in
future workshops on the initiative.
The definition of the Goal data structure, developed by the SDMX Expert Group, underwent several
assessments over the past few years. The results highlighted shortfalls in the first draft, including duplication
and incomplete definitions and explanations. The Statistics Division thoroughly revised the definition to
improve its performance. The revision was presented at the twentieth session of the Inter-Agency and Expert
Group, held in Manila in October 2011, and was added to the Millennium Indicators website.18
Box 3. Programme summary on assessing development strategies to achieve
the Millennium Development Goals in Morocco (the Maquette for Millennium
Development Goal Simulations (MAMS) as a tool for analysing the Goals) The Moroccan High Commission for Planning implemented a programme to assess development strategies to achieve the Millennium Development Goals in Morocco, with technical and financial support from the United Nations Development Programme (UNDP) and the World Bank. Since the launch of the National Human Development Initiative in 2005 and the realization of various social and economic programmes, Morocco has increased its efforts to achieve most of the Goals by 2015. It adopted a comprehensive approach to assess the impact of its achievements and the interaction between Goals. Morocco consulted UNDP and World Bank experts to develop a more holistic and accurate approach to the existing UNDP approach. The High Commission then prepared a comprehensive approach based on the application of a dynamic economic model to simulate the Goals. The main aims of the programme were to evaluate its impact on factor markets and, in turn, on the economy; to assess employment, investment, commodity and service needs in all sectors related to the Goals; highlight the link between achieving the Goals and an increase in economic resources by strengthening labour markets, raising income and increasing long-term investment; and identify expected results to adopt various scenarios so as to avoid resource competition between service sectors related to the Goals and other sectors. MAMS contains several modules, including those on poverty, health, education, water and sanitation. It describes the mechanisms through which the Goals interact in a way that explains complementarities between expenses. One module tackles social factors and variables and the indicators used to follow progress made in achieving the Goals. UNDP, World Bank and High Commission experts oversaw the trial. The ministries of education and health provided the necessary statistics to complete the trial. Preparing and adapting the Moroccan model took almost three years (from the end of 2007 to March 2010). The trial represented a simulation of public policy effects on the Goals and an evaluation of the effects of the global financial crisis on their achievement. The programme resulted in the development of a database from statistical research conducted by the High Commission and relevant government sectors over the period 2007-2010. Following the success of the trial, it was adopted as a good practice. During the biennium 2011-2012, it was implemented in several areas, including retirement; the High Commission suggested several scenarios to solve problems in the Moroccan retirement system in the future.
18 Statistical Commission, 2012.
24
VII. RAISING AWARENESS ON THE IMPORTANCE
OF STATISTICAL DATA
A. AWARENESS RAISING
Raising awareness on the importance of statistical data is a process undertaken by a group of
individuals, aimed at affecting public policy to change the policies of institutions, civil society organizations
and the media; increasing the awareness of individuals and empowering them to carry out activities requiring
the use of statistical data in policy formulation, monitoring and implementation; and raising awareness
among stakeholders on the importance of using statistics to develop plans and make evidence-based
decisions.
A distinction must be made between raising awareness on the importance of statistics and other
concepts, such as data publication and consultations and communication on data. In Arab countries, national
strategies must be developed to improve statistics and produce the necessary data to plan for development.
Those strategies should include programmes and activities aimed at upgrading the entire national statistical
process; information on human and institutional statistical capacity-building at the national level; and the
relationship between statistical outputs and national development. The implementation of such programmes
and activities will provide a set of Millennium Indicators and poverty reduction strategy indicators.
Awareness-raising programmes should include activities that promote each Goal to galvanize support
and influence decision-makers to develop programmes that guarantee Goal achievement. The success of
such awareness-raising and advocacy campaigns relies on a strong relationship between campaign leaders,
decision-makers and stakeholders.
B. ENGINES OF CHANGE
In 2000, the international community agreed on the Millennium Development Goals as
an international development framework and called for the adoption of necessary procedures for their
achievement by 2015. At the national level, political and administrative institutions, civil society
organizations and individuals were called upon to work together to achieve those Goals. Awareness-raising
and advocacy strategies in the field of statistics support efforts by those driving change and progress in
national statistical mechanisms and statistical systems
C. DEVELOPING A STRATEGIC PLAN FOR AWARENESS-RAISING AND ADVOCACY
IN THE FIELD OF STATISTICS
Suggested methods to develop awareness-raising strategies on the importance of statistics include
organizing workshops to exchange ideas and identify the following elements: required changes contained in
strategies; social, political and economic institutions and statistical mechanisms capable of initiating change
and driving progress; individuals and institutions involved in guiding change and its necessary stimulants;
best advocacy methods; and ways to deliver messages to target groups. The following table contains
a practical example of a mechanism to raise awareness on the importance of statistical data and their use.
The publication Advocating for the National Strategy for the Development of Statistics indicates that
awareness-raising strategies must include an action plan that covers the following activities: forming a team
to plan the strategy; indentifying key elements in all stages of activity implementation; preparing a plan and
budget; providing the necessary awareness-raising material and funding; and specifying a timeframe for
implementing activities.

25
AWARENESS-RAISING MECHANISM ON THE IMPORTANCE OF STATISTICAL DATA
Awareness-raising aims
Awareness-raising stakeholders Key messages Advocacy material
Advocacy approaches
What are the aims of the awareness-raising campaign?
Who is raising awareness? For whom? Who is achieving the objectives?
What are the key messages that must be disseminated by campaign leaders?
What are the advocacy materials that assist in achieving the advocacy objective?
What are the best approaches to achieve campaign objectives?
Improving and strengthening the use of statistical data in awareness-raising for change
The media • Behind every figure is a story
• What cannot be measured cannot be managed
Press conference data and articles published in newspapers
Adopting direct approaches targeting the media
Civil society organizations
Count on us because we will count on you
School materials, text messages, music and radio programmes and writing competitions
• Developing radio programmes for young people and awarding prizes
• Adopting indirect methods, such as pamphlet distribution
Government decision-makers
• Providing qualitative data
• Developing more effective plans
• Achieving successful development
Holding seminars and working groups
Adopting direct approaches
• Business community
• Young people
• Research centres
• Universities and institutes
Understanding the markets
• PowerPoint presentations
• Preparing reports, publishing booklets and holding meetings and conferences
Adopting direct approaches
Source: Paris 21, 2010.

26
VIII. GUIDING PRINCIPLES FOR DETERMINING BEST PRACTICES
A. CRITERIA FOR SELECTING GOOD PRACTICES Key criteria for selecting good practices include the following: practices must generate a measurable
improvement; provide a successful solution to a specific statistical problem; statistical data users and
producers must participate in their development; they should be possible to repeat, develop and adapt; their
objectives, procedures and results should be clear and easy to understand; and the data used in them must be
innovative and sustainable.
B. DOCUMENTING BEST PRACTICES Documenting best practices entails recording the lessons that institutions have learned from their
experiences, so as to tackle their future challenges and to share this information with other institutions to find
solutions to similar problems. Documentation must include detailed descriptions of the methods used to
develop solutions; analyses of issues and challenges; and an explanation of options and conducive
circumstances leading to success. Documentation must therefore not simply be a narration of events and
facts. Herein lies the importance of developing guiding principles that assist stakeholders in identifying
successful practices for adoption.
C. FACTORS FOR DETERMINING BEST PRACTICES Guiding principles for identifying good practices include the following components.
1. Identifying the issue or the challenge It is necessary to accurately describe problems whose solutions are achievable through the effective
use of statistical data. These problems could be linked to issues such as poverty, unemployment, illiteracy,
school dropout rates, women empowerment and social protection. Successful trials could employ statistical
surveys or develop a set of additional indicators to find solutions to obstacles hampering the achievement of
the Millennium Development Goals. In 2000, over 170 Heads of State adopted the Goals, which form an international development agenda
that must be fulfilled by 2015. The process must be integrated into national development processes so the
Goals become an indivisible part of local and national development strategies. Herein lies the importance of
countries that have successfully used statistics to nationalize the Goals to document and exchange their
experiences. Innovative uses of statistics form good practices, including using data from general population
and housing censuses to develop a master plan or spatial planning for cities; supplying geographic
information systems; or solving transport problems. A manual prepared by the British Royal Statistical
Society19 shows the use of statistics in communication is a good practice and sets out key principles for
documenting such experiences, including the following: (a) Explaining the use of statistical data to achieve public relations objectives to raise awareness in
general, inform decision-makers of specific issues or influence public behaviour;
(b) Identifying the reasons for using statistics, confirming that statistical data reflect reality and are
used to measure policy effects;
(c) Specifying statistics that should be used in public relations;
(d) Analysing survey results or statistics uses in communication;
(e) Preparing reports on data collection approaches;
(f) Identifying indicators for development to better understand issues under consideration;
(g) Determining data shortfalls.
19 Garrett and Penrose, 2010.

27
2. Specifying results Identifying good practices in the effective use of statistics includes determining the changes that occur
as a result of those practices and their effects; and presenting the approach for measuring and evaluating such
changes. This may result in establishing a database on poverty that could assist in formulating strategies to
eradicate poverty; developing a system to monitor and evaluate gender mainstreaming in development
programmes to increase the number of women in positions of power; carrying out statistical surveys to
produce data to identify underprivileged households; establishing a database that includes indicators on
national energy for energy production, transfer, export and consumption; or developing policies on energy,
the environment and sustainable development. Such changes could occur at the visual, attitude or conceptual
levels as a result of the effective use of statistical data that guide the change process. Related indicators of
achievement and baselines should be mentioned when identifying results.
3. Trial or practice details Details should include the objectives of a trial or practice and its geographical location;
implementation methods; executors; partners, including their full names and addresses; timeframe; start date;
performance indicators; approved budget; adopted mechanism; and monitoring and evaluation mechanism.
4. Success factors Government and non-governmental bodies that collaborated to provide statistical data or assisted in
developing appropriate solutions could set out success factors.
5. Challenges and solutions Challenges include fundamental issues that hampered the success of a trial or practice. Solutions
include the methods used to overcome those challenges, the quality of data used and the data collection and
evaluation approach.
6. Recommendations Recommendations indicate the minimum requirements for a trial or practice to succeed and the lessons
learned and good practices whose exchange would be beneficial to all involved, despite that the success of
such practices is linked to spatial and temporal conditions and specific circumstances. A practice could
therefore succeed in one country but not in another, or in one part of a country but not in another.
7. Identifying future plans and sustainability This entails determining the bullet points of plans aimed at ensuring the sustainability of good
successful practices and the necessary financial and human resources; and the suggested mechanisms to
ensure the sustainability of statistical data provision and improve their quality.
8. Beneficiary opinions and responses The opinions and responses of decision-makers, professionals and all those who participated in
a successful trial, in addition to the opinions of researchers and experts who did not participate.
9. Supporting documents Documents supporting good practices are annexed to the reports thereon. Any information considered
necessary by those who developed the practices can also be added, including references used in
implementing practices, and information on committees tasked with ensuring their success and on persons
who participated in that success.

28
IX. CONCLUSION
Determining and documenting good practices and successful experiences in the effective use of
statistical data in policymaking is a vital tool that statistical mechanisms in the ESCWA region can benefit
from and build upon to tackle statistical challenges. The aim of the present conceptual framework is to
encourage analytical thought, self-education and mutual learning; stimulate serious research to develop
solutions for existing problems; and meet statistical data and information needs so as to achieve national
development goals and strengthen individual and institutional participation in establishing an information
base to improve the effective use of statistical data.

29
BIBLIOGRAPHY
ا�����ي��� � ا����� ا����� ��و�� ��� . ا����� ا����� �� .�٢٠٣٠#� رؤ � ��� ا����� . ٢٠١٦-٢٠١١ا���ا�
�%�&� � .ا���م � ا��8 ��7. ا��� 6 ا�5��3دي وا01���23، �.-�ات ا����� ��+� ا�ه�اف ا)���'
Alliance for Health Policy and Systems Research (2012). Health Policy and Systems Research:
A Methodology Reader. World Health Organization.
Australian Bureau of Statistics (2010). A guide for using statistics for evidence based policy. Available from
www.abs.gov.au/understanding statistics.
Australian Evaluation Society (2006). Evaluating policy with modified “policy cycle”- the NSW Healthy
School Canteen Strategy.
Banks, Gary (2009). Challenges of evidence-based policy-making. Australian Government, Australian Public
Service Commission.
Born, Alice and Kaveri Mechands (2011). Classification of statistical activities- proposed revisions. United
Nations: Department of Economic and Social Affairs, Statistics Division.
Brown, Denise (2009). Good practice guidelines for indicator development and reporting. Statistics New
Zealand.
Chartered Institute of Public Relations and others (2010). Best practice guide for using statistics in
communications. Available from www.rss.org.uk/uploadedfiles/userfiles/files/CIPR-MRS-RSS-
guidelines-for-using-statistics-in-communications.pdf.
Department of Economic and Social Affairs (2011). Final Report of the Meeting of the Expert Group on
International Economic and Social Classifications. United Nations.
Dukeshire, Steven and Jennifer Thurlow. (2002). Understanding the link between research and policy. Rural
Communities Impacting Policy.
Economic and Social Commission for Asia and the Pacific (2011). Handbook: Promoting the Use of
Statistical Data for Policy Analysis and Advocacy: Building on Success. United Nations.
Edmunds, Roger and Tim Marchant (2008). Official Statistics and Monitoring and Evaluation Systems In
Developing Countries: Friends Or Foes? Paris 21.
Farrell, Glen (2009). Results-based monitoring and evaluation at the Commonwealth of Learning:
A handbook. Commonwealth of Learning, Vancouver, Canada.
Gardner, Jessica (2010). Why relevant MDG-related data may not be reaching policy and decision-makers?
Daejeon, Korea, 18-20 October 2010. United Nations: ESCAP.
Garrett, Andrew and Adrian Penrose (2010). Using Statistics in Communications. CIPR.
General Assembly (2010). Keeping the promise – a forward-looking review to promote an agreed action
agenda to achieve the Millennium Development Goals. A/64/665, New York.
Koon, Adam and others (2012). Embedding of research into decision-making processes. Health Research
Policy and Systems.

30
Kusek, Jody and Ray Rist (2004). Ten steps to a results–based monitoring and evaluation system. World
Bank.
Nutley, Sandra and others (2002). Evidence based policy and practice: cross sector lessons from the UK.
Research Unit for Research Utilisation, Department of Management, University of St Andrews,
Working Paper 9.
Organization for Economic Cooperation and Development (2002a). Improving policy coherence and
integration for sustainable development: a checklist. Policy Brief.
OECD (2002b). Governance for Sustainable Development. Five OECD Case Studies. OECD: Paris.
Othman, Aziz (2005). The role of statistics in factual-based policy-making. Department of Statistics,
Malaysia.
Paris 21 (2010). Advocating for the National Strategy for the Development of Statistics: Country-level
Toolkit. Available from http://paris21.org/sites/default/files/advocacytoolkit.pdf.
Pattanayak, Subhrendu and others (2006). Deforestation, malaria and poverty: a call for transdisciplinary
research to support the design of cross-sectoral policies. Sustainability: Science, Practice and Policy.
Statistical Commission (2012). Development indicators for monitoring the Millennium Development Goals.
E/CN.3/2012/29.
Sutcliffe, Sophie and Julius Court (2005). Evidence-based policymaking: What is it? How does it work?
What relevance for developing countries? Overseas Development Institute.
UNDP (2010). Unlocking Progress: MDG Acceleration on the Road to 2015. New York.
UNDP (2011). MDG Acceleration Framework: Technical Note (October).
United Nations Economic Commission for Europe (2009). Making Data Meaningful. Available from
www.unece.org/stats/documents/writing/.
UNICEF (2004). Bridging the Gap: The Role of Monitoring and Evaluation in Evidence-based Policy
Making. United Nations.
United Nations Development Programme (UNDP) (2002). Handbook on Monitoring and Evaluating for
Results. New York.
UNDP (2009). Handbook on Planning, Monitoring and Evaluating for Development results. New York.
UNDP (2011). MDG Acceleration Framework: Operational Note. New York.
World Health Organization. Evidence-informed policy-making. Available from www.who.int/rpc/evipnet/en/
index.html.

31
Annex I
OFFICIAL LIST OF MILLENNIUM DEVELOPMENT GOAL INDICATORS
(All indicators should be disaggregated by sex and urban/rural as far as possible)
Millennium Development Goals (MDGs)
Goals and targets
(from the Millennium Declaration) Indicators for monitoring progress
Goal 1: Eradicate extreme poverty and hunger
Target 1.A: Halve, between 1990 and 2015, the proportion of people whose income is less than one dollar a day
1.1 Proportion of population below $1 (PPP) per daya/ 1.2 Poverty gap ratio 1.3 Share of poorest quintile in national consumption
Target 1.B: Achieve full and productive employment and decent work for all, including women and young people
1.4 Growth rate of GDP per person employed
1.5 Employment-to-population ratio
1.6 Proportion of employed people living below $1 (PPP) per day
1.7 Proportion of own-account and contributing family workers in total employment
Target 1.C: Halve, between 1990 and 2015, the proportion of those suffering from hunger
1.8 Prevalence of underweight children under-five years of age
1.9 Proportion of population below minimum level of dietary energy consumption
Goal 2: Achieve universal primary education
Target 2.A: Ensure that, by 2015, children everywhere, boys and girls alike, will be able to complete a full course of primary schooling
2.1 Net enrolment ratio in primary education
2.2 Proportion of pupils starting grade 1 who reach last grade of primary education
2.3 Literacy rate of 15-24 year-olds, women and men
Goal 3: Promote gender equality and empower women
Target 3.A: Eliminate gender disparity in primary and secondary education, preferably by 2005, and in all levels of education no later than 2015
3.1 Ratios of girls to boys in primary, secondary and tertiary education
3.2 Share of women in wage employment in the non-agricultural sector
3.3 Proportion of seats held by women in national parliament
Goal 4: Reduce child mortality
Target 4.A: Reduce by two-thirds, between 1990 and 2015, the under-five mortality rate
4.1 Under-five mortality rate
4.2 Infant mortality rate
4.3 Proportion of 1 year-old children immunised against measles
Goal 5: Improve maternal health
Target 5.A: Reduce by three quarters, between 1990 and 2015, the maternal mortality ratio
5.1 Maternal mortality ratio
5.2 Proportion of births attended by skilled health personnel
Target 5.B: Achieve, by 2015, universal access to reproductive health
5.3 Contraceptive prevalence rate
5.4 Adolescent birth rate
5.5 Antenatal care coverage (at least one visit and at least four visits)
5.6 Unmet need for family planning

32
Millennium Development Goals (MDGs)
Goals and targets
(from the Millennium Declaration) Indicators for monitoring progress
Goal 6: Combat HIV/AIDS, malaria and other diseases
Target 6.A: Have halted by 2015 and begun to reverse the spread of HIV/AIDS
6.1 HIV prevalence among population aged 15-24 years
6.2 Condom use at last high-risk sex
6.3 Proportion of population aged 15-24 years with comprehensive correct knowledge of HIV/AIDS
6.4 Ratio of school attendance of orphans to school attendance of non-orphans aged 10-14 years
Target 6.B: Achieve, by 2010, universal access to treatment for HIV/AIDS for all those who need it
6.5 Proportion of population with advanced HIV infection with access to antiretroviral drugs
Target 6.C: Have halted by 2015 and begun to reverse the incidence of malaria and other major diseases
6.6 Incidence and death rates associated with malaria
6.7 Proportion of children under 5 sleeping under insecticide-treated bednets
6.8 Proportion of children under 5 with fever who are treated with appropriate anti-malarial drugs
6.9 Incidence, prevalence and death rates associated with tuberculosis
6.10 Proportion of tuberculosis cases detected and cured under directly observed treatment short course
Goal 7: Ensure environmental sustainability
Target 7.A: Integrate the principles of sustainable development into country policies and programmes and reverse the loss of environmental resources
7.1 Proportion of land area covered by forest
7.2 CO2 emissions, total, per capita and per $1 GDP (PPP)
7.3 Consumption of ozone-depleting substances
7.4 Proportion of fish stocks within safe biological limits
7.5 Proportion of total water resources used
Target 7.B: Reduce biodiversity loss, achieving, by 2010, a significant reduction in the rate of loss
7.6 Proportion of terrestrial and marine areas protected
7.7 Proportion of species threatened with extinction
Target 7.C: Halve, by 2015, the proportion of people without sustainable access to safe drinking water and basic sanitation
7.8 Proportion of population using an improved drinking water source
7.9 Proportion of population using an improved sanitation facility
Target 7.D: By 2020, to have achieved a significant improvement in the lives of at least 100 million slum dwellers
7.10 Proportion of urban population living in slumsb/
Goal 8: Develop a global partnership for development
Some of the indicators listed below are monitored
separately for the least developed countries (LDCs), Africa,
landlocked developing countries and small island
developing States
Target 8.A: Develop further an open, rule-based, predictable, non-discriminatory trading and financial system with a commitment to good governance, development and poverty reduction – both nationally and internationally
Official development assistance (ODA) 8.1 Net ODA, total and to the least developed countries,
as percentage of OECD/DAC donors’ gross national income
Target 8.B: Address the special needs of the least developed countries
8.2 Proportion of total bilateral, sector-allocable ODA of OECD/DAC donors to basic social services (basic education, primary health care, nutrition, safe water and sanitation)

33
Millennium Development Goals (MDGs)
Goals and targets
(from the Millennium Declaration) Indicators for monitoring progress
Includes: tariff and quota-free access for the least developed countries’ exports; enhanced programme of debt relief for heavily indebted poor countries (HIPC) and cancellation of official bilateral debt; and more generous ODA for countries committed to poverty reduction
8.3 Proportion of bilateral official development assistance of OECD/DAC donors that is untied
8.4 ODA received in landlocked developing countries as a proportion of their gross national incomes
8.5 ODA received in small island developing States as a proportion of their gross national incomes
Target 8.C: Address the special needs of landlocked developing countries and small island developing States (through the Programme of Action for the Sustainable Development of Small Island Developing States and the outcome of the twenty-second special session of the General Assembly)
Market access 8.6 Proportion of total developed country imports (by
value and excluding arms) from developing countries and least developed countries, admitted free of duty
8.7 Average tariffs imposed by developed countries on agricultural products and textiles and clothing from developing countries
8.8 Agricultural support estimate for OECD countries as a percentage of their gross domestic product
8.9 Proportion of ODA provided to help build trade capacity
Target 8.D: Deal comprehensively with the debt problems of developing countries through national and international measures to make debt sustainable in the long term
Debt sustainability 8.10 Total number of countries that have reached their
HIPC decision points and number that have reached their HIPC completion points (cumulative)
8.11 Debt relief committed under HIPC and MDRI Initiatives
8.12 Debt service as a percentage of exports of goods and services
Target 8.E: In cooperation with pharmaceutical companies, provide access to affordable essential drugs in developing countries
8.13 Proportion of population with access to affordable essential drugs on a sustainable basis
Target 8.F: In cooperation with the private sector, make available the benefits of new technologies, especially information and communications
8.14 Fixed-telephone subscriptions per 100 inhabitants 8.15 Mobile-cellular subscriptions per 100 inhabitants 8.16 Internet users per 100 inhabitants
a/ For monitoring country poverty trends, indicators based on national poverty lines should be used, where available.
b/ The actual proportion of people living in slums is measured by a proxy, represented by the urban population living in
households with at least one of the four characteristics: (1) lack of access to improved water supply; (2) lack of access to improved
sanitation; (3) overcrowding (three or more persons per room); and (4) dwellings made of non-durable material.

34
Annex II
CLASSIFICATION OF STATISTICAL ACTIVITIES
Domain 1: Demographic and social statistics
1.1 Population and migration
1.2 Labour
1.3 Education
1.4 Health
1.5 Income and consumption
1.6 Social protection
1.7 Human settlements and housing
1.8 Justice and crime
1.9 Culture
1.10 Political and other community activities
1.11 Time use
Domain 2: Economic statistics
2.1 Macroeconomic statistics
2.2 Economic accounts
2.3 Business statistics
2.4 Sectoral statistics
2.4.1 Agriculture, forestry, fisheries
2.4.2 Energy
2.4.3 Mining, manufacturing, construction
2.4.4 Transport
2.4.5 Tourism
2.4.6 Banking, insurance, financial statistics
2.5 Government finance, fiscal and public sector statistics
2.6 International trade and balance of payments
2.7 Prices
2.8 Labour cost
2.9 Science, technology and innovation
Domain 3: Environment and multi-domain statistics
3.1 Environment
3.2 Regional and small area statistics
3.3 Multi-domain statistics and indicators
3.3.1 Living conditions, poverty and cross-cutting social issues
3.3.2 Gender and special population groups
3.3.3 Information society
3.3.4 Globalisation
3.3.5 Indicators related to the Millennium Development Goals
3.3.6 Sustainable development
3.3.7 Entrepreneurship
3.4 Yearbooks and similar compendia

35
Domain 4: Methodology of data collection, processing, dissemination and analysis 4.1 Metadata
4.2 Classifications
4.3 Data sources
4.3.1 Population and housing censuses; registers of population, dwellings and buildings
4.3.2 Business and agricultural censuses and registers
4.3.3 Household surveys
4.3.4 Business and agricultural surveys
4.3.5 Other administrative sources
4.4.6 Data editing and data linkage
4.4 Dissemination, data warehousing
4.5 Statistical confidentiality and disclosure protection
4.6 Data analysis Domain 5: Strategic and managerial issues of official statistics 5.1 Institutional frameworks and principles; role and organization of official statistics
5.2 Statistical programmes; coordination within statistical systems
5.3 Quality frameworks and measurement of performance of statistical systems and offices
5.4 Management and development of human resources
5.5 Management and development of technological resources (including standards for electronic data
exchange and data sharing)
5.6 Coordination of international statistical work
5.7 Technical cooperation and capacity building

36
Annex III
FUNDAMENTAL PRINCIPLES OF OFFICIAL STATISTICS
The Economic and Social Council
Recalling recent resolutions of the General Assembly and the Economic and Social Council
highlighting the fundamental importance of official statistics for the national and global development
agenda,
Bearing in mind the critical role of high-quality official statistical information in analysis and
informed policy decision-making in support of sustainable development, peace and security, as well as for
mutual knowledge and trade among the States and peoples of an increasingly connected world, demanding
openness and transparency,
Bearing in mind also that the essential trust of the public in the integrity of official statistical systems
and confidence in statistics depend to a large extent on respect for the fundamental values and principles that
are the basis of any society seeking to understand itself and respect the rights of its members, and in this
context that professional independence and accountability of statistical agencies are crucial,
Stressing that, to be effective, the fundamental values and principles that govern statistical work have
to be guaranteed by legal and institutional frameworks and be respected at all political levels and by all
stakeholders in national statistical systems,
Endorses the Fundamental Principles of Official Statistics set out below, as adopted by the Statistical
Commission in 1994 and reaffirmed in 2013, and recommends them further to the General Assembly for
endorsement.
Fundamental Principles of Official Statistics
Principle 1: Official statistics provide an indispensable element in the information system of
a democratic society, serving the Government, the economy and the public with data about the economic,
demographic, social and environmental situation. To this end, official statistics that meet the test of practical
utility are to be compiled and made available on an impartial basis by official statistical agencies to honour
citizens’ entitlement to public information.
Principle 2: To retain trust in official statistics, the statistical agencies need to decide according to
strictly professional considerations, including scientific principles and professional ethics, on the methods
and procedures for the collection, processing, storage and presentation of statistical data.
Principle 3: To facilitate a correct interpretation of the data, the statistical agencies are to present
information according to scientific standards on the sources, methods and procedures of the statistics.
Principle 4: The statistical agencies are entitled to comment on erroneous interpretation and misuse of
statistics.
Principle 5: Data for statistical purposes may be drawn from all types of sources, be they statistical
surveys or administrative records. Statistical agencies are to choose the source with regard to quality,
timeliness, costs and the burden on respondents.
Principle 6: Individual data collected by statistical agencies for statistical compilation, whether they
refer to natural or legal persons, are to be strictly confidential and used exclusively for statistical purposes.

37
Principle 7: The laws, regulations and measures under which the statistical systems operate are to be
made public.
Principle 8: Coordination among statistical agencies within countries is essential to achieve
consistency and efficiency in the statistical system.
Principle 9: The use by statistical agencies in each country of international concepts, classifications
and methods promotes the consistency and efficiency of statistical systems at all official levels.
Principle 10: Bilateral and multilateral cooperation in statistics contributes to the improvement of
systems of official statistics in all countries.
Top Related